Rain On Me IndicatorFinally, we made it :D
Rain On Me Indicator, As the name suggests this indicator will make money rain on you. More seriously, this indicator contains :
This indicator contains:
-Bullish and bearish RSI divergences showing on chart with alerts.
-Parabolic SAR with Labels on chart with buying or selling alerts.
-3 Moving Average (MA 1 : 7, MA 2 : 21 MA 3 HIDDEN : 50 (Cross alerts for Pullback)
-Customizable Bollinger band
-Fibonacci on 10 levels with the level 0 to the middle. This Fibonacci help a lot since it can let you find easily entry/exit point, trend and even where to place your Take Profit and Stop Loss. It have alerts for most important levels (0.382, 0.§, 0.618) for Crossunder and Crossover in Bullish or Bearish trend.
-Fully Customizable Ichimoku Cloud.
-Trend Buy/Sell Labels on chart with buying or selling signal alerts.
-Trend color visible on candles.
If an alert trigger of Buy/Sell Signal with the same alert based on PSAR, so you can be confident to enter in position. Alway checking fibs level that is the key thing with this indicator. the script has been set to have the best possible results on as many market as possible. But.best result for zfter backtesting is on
Forex : EUR/USD, USDJPY, USDCAD.
Indice : S&P500, NASDAQ, DOWJONES
Commodities : OIL, WTI
Everything work on following timeframe :
15MN, 1H, 4H, DAILY, WEEKLY.
So that you can avoid having to set it again, whether it be in minutes, hours, days, months.
So you can easily trade in the mode that suits you best. It works well on everything from indices to forex to commodities etc. I thank all those who allowed me to carry out this project. IF you feelt free to give your ideas, suggestions, for improve it by sending me messages.
This is really a first version sp it may contain bugs / errors that will be fixed over time.
A BIG THANK YOU TO QUANTNOMAD WHO GIVE ME HIS PERMISSION TO USE, MODIFY AND REPUBLISH HIS "Ultimate Pivot Points Alerts" Script Indicator :
Good trade to all !
Pesquisar nos scripts por "fib"

DUOT OSCILLATORDuot Oscillator is an indicator combining the performance of multiple differential oscillators (RSI, ROC, WCCI, MACD, BBB)
The oscillators are normalized and triple smoothed using a variant of McGuinley Dynamic MA formula, the final result is also then triple smoothed over a fib series.
The final oscillator was found to produce higher success rate when detecting divergence over using either individual signals for each of the oscillators on its own, or a weighted signal of a subset of the mentioned oscillators.
We were not able to verify, hypothesis, or find a reasoning for that claim, but following the divergences of that oscillator were more accurate at least in our setups since Feb 2019 on BTCUSD
Duot oscillator along with William Vix fix and Simple 3 MAs are the main decision makers behind Duot Strategy
Settings:
- Date Selectors
- Normalize Lookback (for all oscillators)
- Minimize parameters (this will use the same MAs Lookbacks for all oscillators, should be fine but if you want to use any parameters optimizers, you can disable that setting and fine tune each individually)
- Oscillators Lookback: if the above checkbox is checked then this value will be used for all oscillators(generally fine except for RSI)
- MAs Lookback for individual oscillators
- William Vix Fix Settings

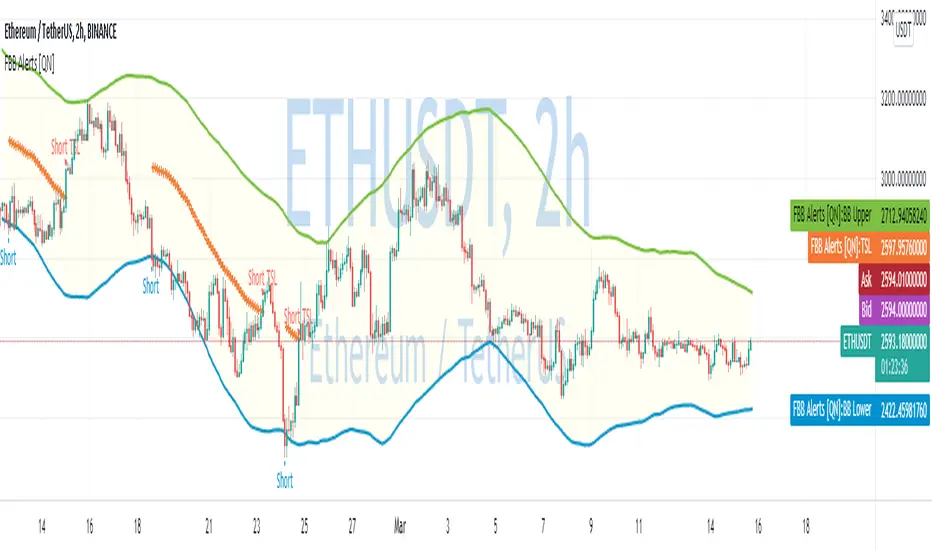
Fibonacci Bollinger Bands Alerts [QuantNomad]These are alerts for my Fibonacci Bollinger Bands Strategy. You can find more details and strategy description in it:
It's a pro indicator, you can have access to it for a small fee. Link to my PRO indicators you can find in my signature.
Disclaimer
Please remember that past performance may not be indicative of future results.
Due to various factors, including changing market conditions, the strategy may no longer perform as good as in historical backtesting.
This post and the script don’t provide any financial advice.
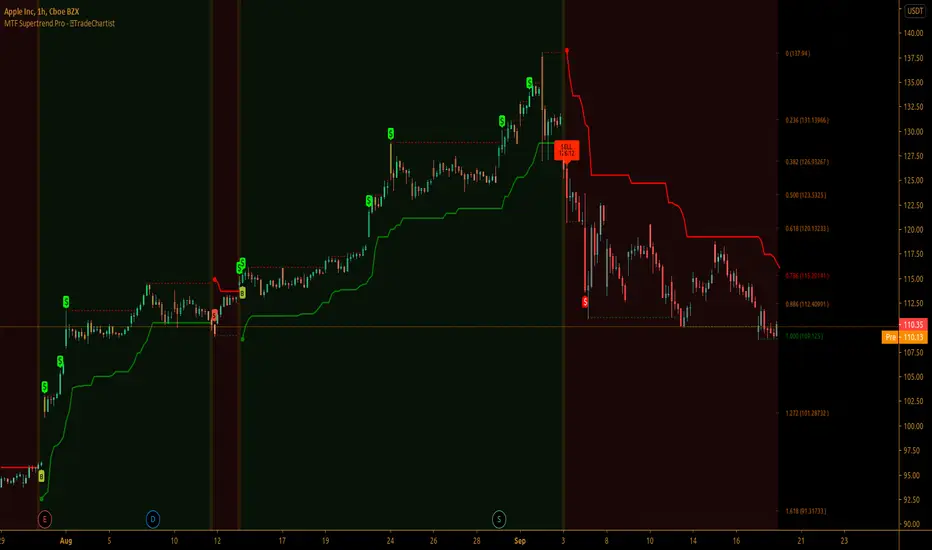
TradeChartist MTF Supertrend Pro™TradeChartist MTF SuperTrend Pro is the Multi Time-Frame version (using timeframe multiplier) of classic Volatility Stop or SuperTrend (Stop and Reverse indicator using multiple of Average True Range of lookback period trailing behind the price acting as both trend reversal signifier and StopLoss trigger at the same time ).
What does ™TradeChartist MTF SuperTrend Pro include?
Multi Time-Frame option using Time-Frame Multiplier to plot Higher Time Frame SuperTrend plot on Lower Time-Frame chart.
Auto-fibs - 2 types (1. Retracement from last significant high/low to previous significant low/high, 2. Retracement from Current High/Low to previous significant Low/High).
Trend identifying color bars.
Trend identifying Background colour.
Option to detect bars where Profit Taking is recommended using $ sign.
How to create Alerts for ™TradeChartist MTF SuperTrend Pro Long and Short Entries?
Alerts can be created for Long or Short entries using Once Per Bar as BUY and SELL labels appear with entries only on confirmation after bar close.
Does the indicator include Stop Loss and Take Profit plots?
This script doesn't have Stop Loss and Take Profit plots, but it can be connected to TradeChartist Plug and Trade as Non-Oscillatory signal to generate Automatic Targets, user set StopLoss and Take Profit plots and to create all types of alerts too.
Does this indicator repaint?
No. This script doesn't repaint as it confirms its signals only after close above/below SuperTrend plot and also uses security function to call higher time-frame values in the right way to avoid repainting. This can be verified using Bar Replay to check if the plots and fills stay in the same bar in real time as the Bar Replay.
===================================================================================================================
Tip 1: Using 1.618 as Timeframe Multiplier results in lucrative trades on most timeframes with ATR multiplier 1.618, 2.618 or 3.618. (Best Practice: Test with various values first on asset using Paper Trades before trading with real money)
Tip 2: Using bars, candles with no borders or Hollow Candles results in clear trend spotting with Bar color option enabled in settings.
===================================================================================================================
Chart below shows Performance of MTF SuperTrend Pro connected to Plug and Trade using Default settings.
===================================================================================================================
This is not a free to use indicator. Get in touch with me (PM me directly if you would like trial access to test the indicator)
Premium Scripts - Trial access and Information
Trial access offered on all Premium scripts.
PM me directly to request trial access to the scripts or for more information.
===================================================================================================================
Bollinger levelesSimilar to VRSI level script , only this time I use bolliger
plus add similar to a fib system to it
the cross up or down of high and low are optional if you want to see as L=low.h = high
so it a bollinger just it look different:)

Fibonacci EMA TrendlinesSimple EMAs based on the Fibs plus the 200 EMA - Default inputs are 8,13, 21, 55, 200. Inspired by Philakones EMAs.

AIMS Purple MagicThe Alligator is a Very Powerful Indicator
Some people think it's just 3 moving averages. But in reality, it is far more than that.
Read more about Alligator and Bill Williams
The Purple Magic Line has been derived from Bill Williams Alligator. Together the Alligator we call the AIMS Gator.
It is a smooth moving average based on the Chaos Red Line of the 5 times higher time frame.
Our Mantra: If you trade in line with the trend of the 5 times higher time frame, you will have a higher chance of catching breakouts in the direction of the trend.
So we have this rule, Always Trade when Price is Going Away from The Purple Line. Simple as that.
Buy Only: Price above the Purple Line
Sell Only: Price below the Purple Line.
What is The Alligator?
The Alligator Indicator was developed by Bill Williams and combines moving averages with fractal geometry.
The indicator helps traders to identify if the market is trending.
It consists of 3 lines: the blue line (aka the Alligator's Jaw),
the red Line (aka the Alligator's Teeth) and
the green Line (aka the Alligator's Lips).
Each has different lookback periods and offsets that can be set by the user.
The alligator is easy to use and can find trade setups, based on how close together or how far apart the lines are, resembling an alligator opening and closing his mouth. This indicator can be used in combination with other analysis techniques.
Based on calculations of Non-Linear mathematical formula we have arrived at a way to calculate the Trend of the 5 times higher time frame
The Purple Magic Indicates :
The Trend of Current and 5 times higher time frame
It helps prevent trading into Wave 4
It helps with counting Wave 3 and 4
You can use it to time early entry into Wave 5
The bounce of Purple after a wave 3 is often a 50% fib retracement.
Examples:
In the picture below you see an M5 chart and M1 chart.
On the left side, you see Alligator Red Line on the 5-minute chart
on the right side, you see The Purple Magic line. Which depicts the same price regions.
This is the Sweet Spot where we take trades.
In line with The Awesome oscillator if you time your entries based on a pullback towards the purple, it can be a system on its own. Nothing else required. But we have a better method.
When we put together, AIMS The Box, AIMS The Gator, and AIMS The Wave indicators, things work even smoother.
For more information visit the link below.

Nikesh Price CycleEvery Script has a pattern and it follows a cyclic movement which results into many small and big swings. We have tried to capture these cyclic pattern. Division line acts here as a pivot point which defines a holistic view of bulls and bear power. Price moving above division line indicates bullish trend and price moving below division line indicates bearish trend. Price scale bar defines trend momentum. when price crosses price scale bar with green scale bar colour it shows we should enter. we will keep on booking our profit on near next fib level. we will exit the trend once price candle crosses linear regression line. for safe entry in case of bulls entry-- price scale bar,linear regression line and mid avg term line should be below price candle. In case of bears entry--price scale bar,linear regression line and mid avg term line should be above price candle.

Automatic Fibonacci Pivot Point S/R LevelsThis is a great tool to find confluences between Fibonacci Pivot point on various time frames.
Fib Pivots used
23.6%
38.2%
50%
61.8%
76.4%
100%
127.2%
141.4%
161.8%
200%
If price is between two levels on the update the lines shift
Yearly Pivots shown on 1m - Daily timeframes
PIvots recalculate on every day
Monthly pivots show on 1m - 60m timeframes
Pivots recalculate every hour
Weekly pivots show on 1m - 15m timeframes
Pivots recalculate every 30m
There is a lot of code but it got the job done.
It would easy to interchange if you prefer different types of pivots
It would be easy to add an on/off if you dont want so many levels on your smaller time frames
If anyone can streamline it please do

Freedom FibThis script will allow to automatically draw levels on the chart for a potential pullback play like shown in this snapshot here
It will draw risk/reward levels upon your favorite ema (default is 13ema) as the price goes and it will work for both long or short scenarios for a potential trend continuation play.
You got the option to align your level to match exactly your selected ema or to be placed in between the first two levels (default settings) if you prefer.
I personally use this one settings for shorter time frames (up to 3min) and the aligned one for higher time frames.

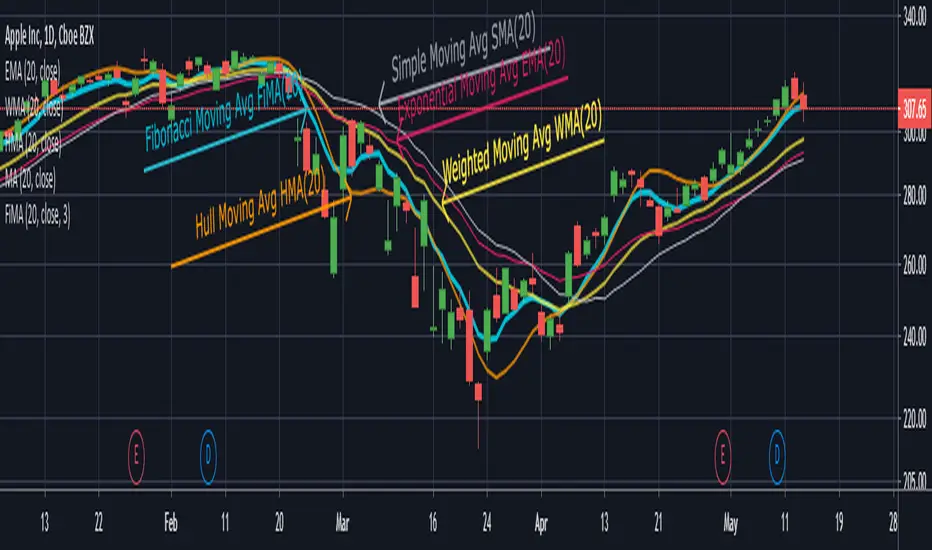
TA Basics: Creating a Fibonacci Weighted Moving AverageIn the previous 2 posts in this series, we played around with simple math concepts to create a zero-lag moving average that can deliver fast response and less lag - that we can use to enable better trend following, or as filter / signal.
here we take a step further - instead of using equal weight for the moving average (as in the Simple moving average) or linear weights (as in the weighted moving average), we get to pick THE MAGIC SEQUENCE, Fibonacci.
we will use the Fibonacci Sequence as weights to produce our moving average - so practically, we create a "Fibonacci Weighted Moving Average" (let's call it FiMA) - and compare the result with other commonly-used moving averages of the same length
in a Fibonacci moving average, the data will be weighted based on the Fibonacci Series starting from 1 (for the furthest data point)
so for example, if we use a length of 10, the weights will be 1, 1, 2, 3, 5, 8, 13, 21, 34, 55 with the 55 being the weight applied to the most recent / current bar's selected value (close, hl2, hc3..etc) and moving backward
before i posted this script, i searched around to see if someone else has already wrote this - i found a couple, but the approach we use here in this code is different - i can't claim it to be more efficient - i honestly don't know - but the resulting code here, IMHO, is more compact and easier to integrate in other studies that you may like to put together to leverage this idea, to create your own indicators and strategies.
the reason the code here is more compact, is that it utilizes a shorter formula to calculate the FIb(n) - i included the source where i found that formula, and i tested it before using it in the code.
i also added an optional "extra smoothing" for the resulting MA, by simply calling the fima() function a second time (so like doing a 2-pass filter), with a smaller length on the result of the 1st pass. keep this smoothing small not to produce too much lag.
i like the outcome when compared to other moving averages - it has a fast response to data/trend change and less overshoot - but honesty i didn't see any real "Fibonacci Magic" :) .. but i'll leave the final judgement to those who use it - this is more of an experimental code in all cases - please feel free to use, change and share feedback.
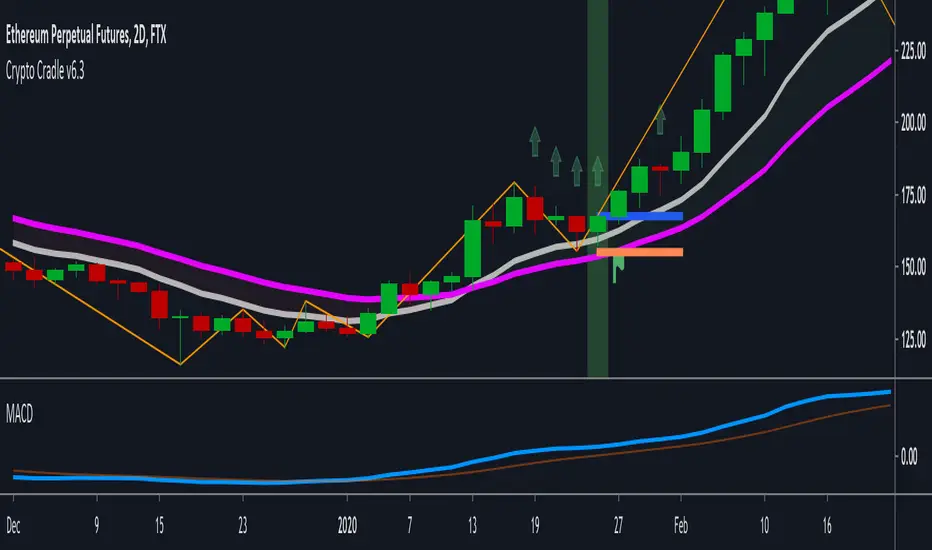
Crypto Cradle v6A long signal (green bar background) is flagged if a small bullish candle is in/around the EMA10/20 cradle.
A short signal (red bar background) is flagged if a small bearish candle is in/around the EMA10/20 cradle.
Other factors must be present such as MACD convergence and higher timeframe trend.
The blue bar is the entry. The red bar is the stop.
The strategy is designed to discretionally trade trending cryptocurrency assets.
SETTINGS:
Experiment with the zig-zag trend sensitivity (3-4 works best) to match entry timeframe trend detection.
* 'Zig Zag - Must require pullback trend' - sometimes a small bullish / bearish candle can appear in the cradle zone without a clear pullback (ie price has travelled sideways into the EMAs). Switch this on in an attempt to exclude such pull-backs.
* 'Zig Zag - Require extra trend zig' - trend is determined by a H, L, HH, HL forming (for long). Tis setting requests one more trend-aligned zig/zag (ie L, H, HL, HH, HL).
* 'Zig Zag - Show Higher Time Period Trend' - the trend sensitivity is doubled to estimate higher timeframe trend. This visualises what the algorithm has determined as the higher timeframe zig-zag pivot points .
* 'Minimum candles since outer pivot' - this attempts to exclude signals that occur after a dramatic pull-back.
* 'Entry Candle Offset Max' - how many bars to wait for entry
PROFIT TAKING:
There are many ways to take profit after entry - trailing stops, scaling out 50% at 1:1, fixed targets, fib extensions, etc. This is out of scope for this indicator.
I have included a basic 1:1 level line (dull green when enabled) and a fixed target level line ( bright green when enabled) that uses a risk/reward multiplier.
ALERT:
To create a generic alert, click the + button in the Alerts panel, select 'Crypto Cradle v6' from the first list, select 'Cradle v6 Short/Long Alert' from the second list, and select 'Once Per Bar Close'. Don't forget to add the timeframe to the message.
This indicator supersedes the open-sourced '"Crypto Cradle" trigger' / 'Crypto Cradle v2' indicator seen here:
Bollinger Bands Fibonacci Ratios (Automatic Timeframe)A Fibonacci Bollinger Bands indicator with automatic timeframe detection.
The timeframe reverts to the value specified in settings when viewing Daily, Monthly or seconds-based charts.
Based on: Bollinger Bands Fibonacci ratios by Shizaru (/script/bCy9urOG-Bollinger-Bands-Fibonacci-ratios/)

Donchian Channels with Auto Fibonacci RetracementRichard Donchian created Donchian Channels, which is a type of moving average indicator and a look-alike of other support and resistance trading indicators like Bollinger Bands.
Donchian Channels has a simple plotting of highest high and lowest low of the last “n” periods.
The “n” periods is based on the trader’s choice, who can select the period according to their requirements ranging from a day, hour and minutes etc.
Traders use Donchian Channels to understand the support and resistance levels.
Donchian Channels is a popular indicator for determining volatility in market prices.
The channels are wider when there are heavy price fluctuations and narrow when prices are relatively flat.
Generally, investors use 20-periods with the Donchian Channels as the default trading setting, but this value can be tweaked based on your trading style.
Donchian channels are mainly used to identify the breakout of a stock or any traded entity enabling traders to take either long or short positions.
Traders can take a long position, if the stock is trading higher than the Donchian channels “n” period and book their profits/short the stock if it is trading below the DC channels “n” period.
The middle band is the average of the upper and lower bands.
The middle band in Donchian channels could also be used as a breakout indicator.
If the stock rises above the middle band of the Donchian channels, then you can open a long position.
On the contrary, if the stock is trading below the middle band of the Donchian channel, then a trader can open a short position.
Combining Donchian Channel trading strategies with other trading strategies might decrease the false entry/exit signals and give a clearer picture of trading opportunities.
If you start to trade a choppy market on an intraday basis, you will be overloaded with false signals.
So, what I noticed is that in order for things to become clearer, we just need to increase the time frame.
Where Donchian Channels Can Fail You
It’s likely not the indicator but more likely our misinterpretation of the signals.
Few areas where the Donchian channel may be tough to read.
Low float stocks are not bound by any indicator, especially Donchian channels.
The challenge with the Donchian channels is that it does not factor in the most recent market volatility.
The indicators provide an equal weighting to all data points.
Therefore when a low float stock picks up and goes on a run, the lower bounds not capture the price movements quickly enough, thus risking giving back more profits than necessary.

EMA / Fibonacci / Bollinger Indicator for Market Sniper SuiteHello all,
this script was created to be used in conjunction with Market Sniper - Trading/Scalping Suite . It was put together to make instrument analysis faster and less convoluted.
It includes
9 Fibonacci Exponential moving averages + 2 Simple moving averages
Auto Fibonacci levels - Tradingviews Auto Fib Retracement - with some modifications
Bollinger Bands - To faster spot squeeze momentum

Stochastic FibonacciThis is your run-of-the-mill stochastic indicator, with one slight difference. I added Fibonacci ratios and colored them across the rainbow for aesthetics.
I noticed that the stochastic moving averages, K & D, would reverse in between 0 & 100. Just like price, they were likely Fibonacci ratios.
My original plan was to create a strategy script, and trade whenever K & D crosses the Fib levels. However, they do not cross them perfectly, rather they merely float near them and reverse. Therefore, the strategy would have never made the trades.
As you will notice in the script, there is Bitcoin Hash Rate data imported. I did so because I would like to create a stochastic hash rate indicator at some point. For those of you with this same passion, there is the hash data to mess around with; consider it an Easter Egg...

MarketGod VisualsHere are the visuals we had included with previous versions of MG (and since removed)
Price-Tracking Fibs - S/R
Price-Tracking Pivots - S/R
Bollinger Bands
Keltner Channels
Hi-Lo
Parabolic SAR
This is a free add-on for users and non-users to use. Enjoy!

Auto Fibonacci Indicator for All Types of Charts/TickersHi,
Pine Version: 4
I have created an indicator that will draw automagically all fibonacci level for any given Chart/Ticker or Frame. This works for anything below Monthly frame as bigger frames calculation algorithms are still in the lab.
For access contact me on private
Thanks

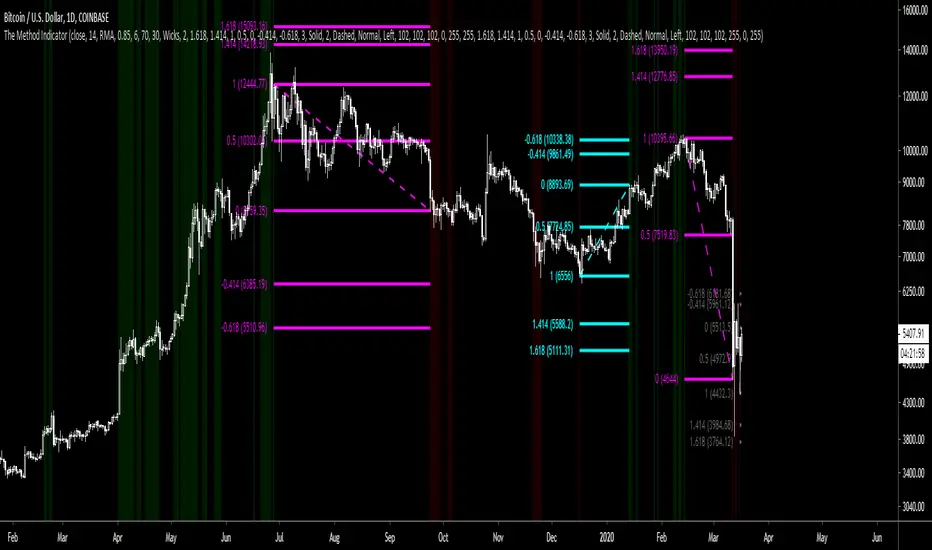
The Method IndicatorThe main use of this indicator is to capitalize on momentum driven movements of the RSI from 70-30 or 30-70 using these fib levels to plan your trade entries and exits, aiding in the creation of a simple yet profitable trading system.
Contact me via TradingView private message to request access.
Rounded Bluebox Zones - Bitcoin BeatsThis script is a combination of my Rounded Pitchforks script and an automatic support and resistance detector.
The goal of this script is to give the future supports and resistances in order to help guide your entries and exits in trades.
Both the curved and straight blueboxes indicate areas of confluence.
This means putting stoplosses and take profits in these areas can be a valid strategy.
This can be used on all timeframes.
ALL LINES AND BOXES CAN BE REMOVED IN THE SETTINGS.
So if you only want the curved pitchforks or only want to show a specific range, you can do as you wish.
For assets different from BTC, you will have to adjust the fully customisable settings.
TRADE AT YOUR OWN RISK


Bitcoin Logarithmic Growth Curves & ZonesI found this awesome script from @quantadelic and edited it to be a bit more legible for regular use, including coloured zones and removing the intercept / slope values as variables, to leave space for the fib levels in the indicator display. I hope you all like it.
