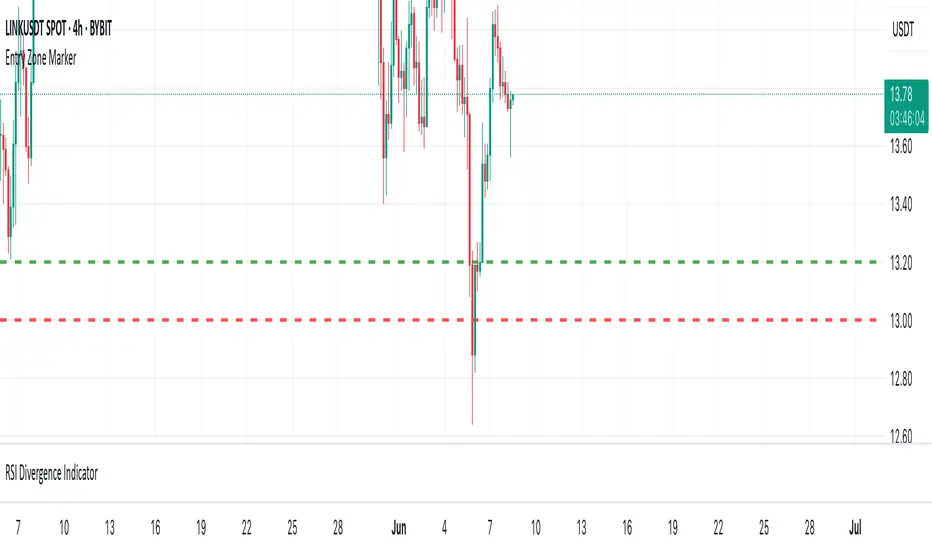
P&L Entry Zone Marker (clean)This indicator is a simple visual calculator for futures traders.
It helps you track your long and short entry zones based on position size and average price.
🔹 Green line – recalculated long entry after averaging down.
🔹 Red line – short entry point.
You can manually input your initial entry, volume, averaging volume, and averaging price.
The script calculates your new average entry for long positions and plots both lines as full horizontal levels across the chart.
✳️ Useful for:
Visualizing break-even zones
Planning P&L zones for hedged positions
Quickly aligning your trades with market structure
✅ Clean version — no labels, just lines.
📉 Works on all symbols and timeframes.
Pesquisar nos scripts por "entry"
AltcoinEvreni Entry/TP RR ToolMulti-Entry / Take-Profit Risk-Reward Tool
This indicator is designed to help traders visually plan and manage their trade entries, take-profit targets, stop-loss levels, and risk/reward calculations directly on the chart.
Key Features:
--- Up to 3 customizable entry levels with separate position sizing for each.
--- Up to 5 take-profit (TP) levels, each with individual allocation percentages.
--- Automatic calculation of weighted average entry price.
--- Dynamic risk and potential profit calculation based on your inputs.
--- Visual colored zones for entry, stop-loss, and take-profit areas on the chart.
--- Adjustable leverage and margin for position sizing.
--- Informative floating table displaying position type, entries, stop-loss, risk in $, potential
--- profit in $, and overall RR ratio.
--- Fully customizable appearance (colors, box width, table font size, etc.).
How to Use:
1- Set your trade direction (Long or Short).
2- Enter your planned entry prices, allocation percentages, and stop-loss.
3- Configure your take-profit levels and their respective allocation percentages.
4- Adjust margin, leverage, and visual preferences as desired.
5- The tool will display all relevant zones and statistics, helping you make better risk-managed trading decisions.
Notes:
--- All calculations and drawings update dynamically as you change your parameters.
--- Works on any symbol and timeframe.
--- For educational and planning purposes – always use your own judgment and risk management.

Inside 4+ Candles Box (Entry + Target + SMA Stop Logic)🔍 What This Script Does
This indicator detects price compression areas using 4 or more consecutive inside candles, then draws a breakout box to visually highlight the range.
Once price closes above the box, a long entry marker is plotted, along with:
🎯 Target line at 1x box size above the breakout.
❌ Stop-loss at the box low or at a dynamic SMA-based level if the box is too large.
🧠 Why It’s Unique
This script combines inside bar compression, breakout logic, risk control, and visual clarity — all in one tool.
It also cancels the setup entirely if price closes below the box low before breakout, avoiding late or false entries.
⚙️ Customizable Settings
Minimum inside candles (default = 4)
SMA length (used as stop if box is large)
Box size % threshold to activate smart stop
Entry, Target, and Stop marker colors
📌 Notes
For long setups only (no short signals).
Use on any asset or timeframe (ideal on 4H/1D).
This is not financial advice. Use with proper risk management.
Backtest thoroughly before live use.
Built with ❤️ by using Pine Script v6.
🇸🇦 وصف مختصر باللغة العربية:
هذا المؤشر يكتشف مناطق تماسك السعر من خلال 4 شموع داخلية أو أكثر، ثم يرسم مربعًا يحدد منطقة الاختراق المحتملة.
عند الإغلاق أعلى المربع، يتم عرض إشارة دخول وسطر هدف بنسبة 100% من حجم المربع.
كما يتم احتساب وقف الخسارة تلقائيًا إما عند قاع المربع أو عند متوسط متحرك ذكي (SMA) إذا كان حجم المربع كبيرًا.
الميزة الإضافية: إذا تم كسر قاع المربع قبل الاختراق، يتم إلغاء الصفقة تلقائيًا لتجنب الدخول المتأخر.
🧪 للاستفادة التعليمية والتحليل فقط. لا يُعتبر توصية مالية.

ian_Trado v15 Trend Entry Filter# 📈 ian_Trado v15 Trend Entry Filter (Pine Script v6)
The **ian_Trado v15** is a multi-factor **trend confirmation filter** for NASDAQ (NAS100), Dow Jones (DJ30), Gold (XAU), DAX, and USDJPY.
It combines **EMA structure**, **Donchian channel breakout**, **MACD histogram momentum**, **Volume confirmation**, and a **Range Compression Filter** to avoid entering during choppy or sideways markets.
✅ Designed for **bot deployment** (e.g., grid bots, long/short breakout bots) or **manual trading**.
---
## 🔍 How This Filter Works:
1. **EMA Trend Confirmation**
- Long Trend: EMA(1) > EMA(5) > EMA(60)
- Short Trend: EMA(1) < EMA(5) < EMA(60)
2. **Donchian Channel Width Expansion**
- Only allows trades when the **breakout width** exceeds a minimum threshold.
3. **MACD Histogram Slope Filter (Optional)**
- Confirms momentum building in the direction of the trend.
- Strict Mode: MACD histogram must consistently rise or fall over 3 bars.
4. **Volume Filter (Optional)**
- Ensures volume supports the move (filters out weak conditions).
5. **Range Compression Filter (Optional)**
- Avoids entries during sideways chop.
6. **Cooldown Control**
- Limits overtrading by requiring spacing between entries.
7. **Exit Conditions**
- Gray dot appears when trending conditions are no longer valid.
---
## ⚙️ Settings Explained:
| Setting | Description |
|:--------|:------------|
| **Cooldown Bars** | Minimum bars between consecutive entries |
| **Profit Target (%)** | Visual profit marker for exit tracking |
| **Donchian Channel Length** | Lookback period for detecting breakout width |
| **Minimum Donchian Width** | Threshold to confirm meaningful breakouts |
| **Volume Lookback Period** | Average volume validation window |
| **Box Range (Range Compression)** | Max allowed price range over lookback bars |
| **Range Compression Bars** | Number of bars to check for range compression |
| **Strict MACD Filter** | Use stricter MACD slope checks |
---
## 📊 Recommended Settings by Instrument (1H Chart):
| Asset | Min Donchian Width | Range Compression | Profit Target |
|:------|:-------------------|:------------------|:--------------|
| **NAS100** (Nasdaq) | 300–450 pts | 400 pts / 40 bars | 1.5% |
| **DJ30** (Dow Jones) | 400–600 pts | 500 pts / 40 bars | 1.0–1.5% |
| **XAU/USD** (Gold) | 10–15 pts | 8 pts / 30 bars | 0.8–1.2% |
| **DAX40** (Germany) | 200–300 pts | 250 pts / 40 bars | 1.0% |
| **USD/JPY** (Forex) | 0.5–0.8 pts | 0.4 pts / 40 bars | 0.5–0.8% |
---
## 🔔 Alerts Available:
- Long Entry
- Short Entry
- Exit Zone
> **Note:** Volume filter may be disabled if volume is unreliable (e.g., some forex pairs).
---
## 📅 Version:
- **ian_Trado v15** — April 2025
- Built with **Pine Script v6** for maximum stability
- Clean toggling and plotting logic (no `na` errors)

SMC Entry Signals MTF v2📘 User Guide for the SMC Entry Signals MTF v2 Indicator
🎯 Purpose of the Indicator
This indicator is designed to identify reversal entry points based on Smart Money Concepts (SMC) and candlestick confirmation. It’s especially useful for traders who use:
Imbalance zones, order blocks, breaker blocks
Liquidity grabs
Multi-timeframe confirmation (MTF)
📈 How to Use the Signals on the Chart
✅ LONG Signal (green triangle below the candle):
Conditions:
Price is in a discount zone (below the FIB 50% level)
A bullish engulfing candle appears
A bullish Order Block (OB) or Breaker Block is detected
There’s an upward imbalance
A bullish OB is confirmed on the higher timeframe
➡️ How to act:
Consider entering long on the current or next candle.
Place your stop-loss below the OB or the nearest swing low.
Take profit at the nearest liquidity zone or premium area (above FIB 50%).
🔻 SHORT Signal (red triangle above the candle):
Conditions:
Price is in a premium zone (above FIB 50%)
A bearish engulfing candle appears
A bearish OB or Breaker Block is detected
There’s a downward imbalance
A bearish OB is confirmed on the higher timeframe
➡️ How to act:
Consider short entry after the signal.
Place your stop-loss above the OB or swing high.
Target the discount zone or the next liquidity pocket.
⚙️ Recommended Settings by Trading Style
Trading Style Suggested Settings Notes
Intraday (1–15m) fibLookback = 20–50, obLookback = 5–10, htf_tf = 1H/4H Fast signals. Use Discount/Premium + Engulfing.
Swing/Position (1H–1D) fibLookback = 50–100, obLookback = 10–20, htf_tf = 1D/1W Higher trust in MTF confirmation. Ideal with fundamentals.
Scalping (1m) fibLookback = 10–20, obLookback = 3–5, htf_tf = 15m/1H Remove Breaker and MTF for quick reaction trades.
🧠 Best Practices for Traders
Trend Filtering:
Use EMAs or volume to confirm the current trend.
Take longs only in uptrends, shorts in downtrends.
Liquidity Zones:
Use this indicator after liquidity grabs.
OBs and Breakers often appear right after stop hunts.
Combine with Manual Zones:
This works best when paired with manually drawn OBs and key levels.
Backtest the Signals:
Use Bar Replay mode on TradingView to test past signals.
🧪 Example Trade Setup
Example on BTCUSDT 15m:
Price drops into the discount zone.
A green triangle appears (bullish engulfing + OB + imbalance + HTF OB).
You enter long, stop below the OB, target the premium zone.
🎯 This type of setup often gives a risk/reward ratio of 1:2 or better — profitable even with a 40% win rate.
⏰ Alerts & Automation
Enable alerts:
"SMC Long Entry" — fires when a long signal appears.
"SMC Short Entry" — fires when a short signal appears.
You can integrate this with bots via webhook, like:
TradingConnector, 3Commas, Alertatron, etc.
✅ What This Indicator Gives You
High-probability entries using SMC logic
Customizable filters for entry logic
Multi-timeframe confirmation for stronger setups
Suitable for both intraday and swing trading

Scalping Entry/Exit Indicator by DiGetImagine having a tool that not only spots high-probability entry signals but also visually marks them on your chart with color-coded cues and automated alerts. The Scalping Entry/Exit Indicator by DiGet does exactly that—by fusing a range of classic candlestick patterns (such as Bullish Hammers, Engulfing patterns, and Morning/Evening Stars) with dynamic risk management levels, this script empowers you to make swift and informed trading decisions. Whether you're an active trader or an algorithm enthusiast, this indicator offers both precision and clarity in identifying scalp opportunities, making your chart analysis more efficient and visually engaging.
Indicator Breakdown
Input Parameters:
The indicator accepts a customizable risk-reward ratio, an ATR period for volatility measurement, and a lookback period to scan for valid candlestick patterns.
ATR & Candle Calculations:
It computes the Average True Range (ATR) to dynamically set stop-loss and take-profit levels. Additionally, it determines the body and wick sizes of each candlestick to help identify key reversal patterns.
Pattern Detection:
Multiple bullish patterns (Hammer, Engulfing, Morning Star) and bearish patterns (Shooting Star, Engulfing, Evening Star) are detected. There’s also a simplified version of the Head & Shoulders pattern, offering further validation for reversal signals.
Signal Generation & Trade Levels:
The script consolidates the pattern signals into combined “buy” and “sell” triggers. It then calculates the respective stop-loss (SL) and take-profit (TP) levels based on the current price and ATR, providing a robust risk management framework.
Visual Aids & Alerts:
To enhance usability, the indicator changes the chart’s background color to green for buy signals and red for sell signals. It also draws labels, lines (representing SL and TP), and markers directly on the chart, along with alert conditions to notify traders of actionable signals.
This indicator is an excellent addition to your TradingView toolkit—ideal for scalpers and short-term traders seeking clarity, precision, and automated signal generation on their charts.
Enjoy trading with confidence and precision!

[COG]TMS Crossfire 🔍 TMS Crossfire: Guide to Parameters
📊 Core Parameters
🔸 Stochastic Settings (K, D, Period)
- **What it does**: These control how the first stochastic oscillator works. Think of it as measuring momentum speed.
- **K**: Determines how smooth the main stochastic line is. Lower values (1-3) react quickly, higher values (3-9) are smoother.
- **D**: Controls the smoothness of the signal line. Usually kept equal to or slightly higher than K.
- **Period**: How many candles are used to calculate the stochastic. Standard is 14 days, lower for faster signals.
- **For beginners**: Start with the defaults (K:3, D:3, Period:14) until you understand how they work.
🔸 Second Stochastic (K2, D2, Period2)
- **What it does**: Creates a second, independent stochastic for stronger confirmation.
- **How to use**: Can be set identical to the first one, or with slightly different values for dual confirmation.
- **For beginners**: Start with the same values as the first stochastic, then experiment.
🔸 RSI Length
- **What it does**: Controls the period for the RSI calculation, which measures buying/selling pressure.
- **Lower values** (7-9): More sensitive, good for short-term trading
- **Higher values** (14-21): More stable, better for swing trading
- **For beginners**: The default of 11 is a good balance between speed and reliability.
🔸 Cross Level
- **What it does**: The centerline where crosses generate signals (default is 50).
- **Traditional levels**: Stochastics typically use 20/80, but 50 works well for this combined indicator.
- **For beginners**: Keep at 50 to focus on trend following strategies.
🔸 Source
- **What it does**: Determines which price data is used for calculations.
- **Common options**:
- Close: Most common and reliable
- Open: Less common
- High/Low: Used for specialized indicators
- **For beginners**: Stick with "close" as it's most commonly used and reliable.
🎨 Visual Theme Settings
🔸 Bullish/Bearish Main
- **What it does**: Sets the overall color scheme for bullish (up) and bearish (down) movements.
- **For beginners**: Green for bullish and red for bearish is intuitive, but choose any colors that are easy for you to distinguish.
🔸 Bullish/Bearish Entry
- **What it does**: Colors for the entry signals shown directly on the chart.
- **For beginners**: Use bright, attention-grabbing colors that stand out from your chart background.
🌈 Line Colors
🔸 K1, K2, RSI (Bullish/Bearish)
- **What it does**: Controls the colors of each indicator line based on market direction.
- **For beginners**: Use different colors for each line so you can quickly identify which line is which.
⏱️ HTF (Higher Timeframe) Settings
🔸 HTF Timeframe
- **What it does**: Sets which higher timeframe to use for filtering (e.g., 240 = 4 hour chart).
- **How to choose**: Should be at least 4x your current chart timeframe (e.g., if trading on 15min, use 60min or higher).
- **For beginners**: Start with a timeframe 4x higher than your trading chart.
🔸 Use HTF Filter
- **What it does**: Toggles whether the higher timeframe filter is applied or not.
- **For beginners**: Keep enabled to reduce false signals, especially when learning.
🔸 HTF Confirmation Bars
- **What it does**: How many bars must confirm a trend change on higher timeframe.
- **Higher values**: More reliable but slower to react
- **Lower values**: Faster signals but more false positives
- **For beginners**: Start with 2-3 bars for a good balance.
📈 EMA Settings
🔸 Use EMA Filter
- **What it does**: Toggles price filtering with an Exponential Moving Average.
- **For beginners**: Keep enabled for better trend confirmation.
🔸 EMA Period
- **What it does**: Length of the EMA for filtering (shorter = faster reactions).
- **Common values**:
- 5-13: Short-term trends
- 21-50: Medium-term trends
- 100-200: Long-term trends
- **For beginners**: 5-10 is good for short-term trading, 21 for swing trading.
🔸 EMA Offset
- **What it does**: Shifts the EMA forward or backward on the chart.
- **For beginners**: Start with 0 and adjust only if needed for visual clarity.
🔸 Show EMA on Chart
- **What it does**: Toggles whether the EMA appears on your main price chart.
- **For beginners**: Keep enabled to see how price relates to the EMA.
🔸 EMA Color, Style, Width, Transparency
- **What it does**: Customizes how the EMA line looks on your chart.
- **For beginners**: Choose settings that make the EMA visible but not distracting.
🌊 Trend Filter Settings
🔸 Use EMA Trend Filter
- **What it does**: Enables a multi-EMA system that defines the overall market trend.
- **For beginners**: Keep enabled for stronger trend confirmation.
🔸 Show Trend EMAs
- **What it does**: Toggles visibility of the trend EMAs on your chart.
- **For beginners**: Enable to see how price moves relative to multiple EMAs.
🔸 EMA Line Thickness
- **What it does**: Controls how the thickness of EMA lines is determined.
- **Options**:
- Uniform: All EMAs have the same thickness
- Variable: Each EMA has its own custom thickness
- Hierarchical: Automatically sized based on period (longer periods = thicker)
- **For beginners**: "Hierarchical" is most intuitive as longer-term EMAs appear more dominant.
🔸 EMA Line Style
- **What it does**: Sets the line style (solid, dotted, dashed) for all EMAs.
- **For beginners**: "Solid" is usually clearest unless you have many lines overlapping.
🎭 Trend Filter Colors/Width
🔸 EMA Colors (8, 21, 34, 55)
- **What it does**: Sets the color for each individual trend EMA.
- **For beginners**: Use a logical progression (e.g., shorter EMAs brighter, longer EMAs darker).
🔸 EMA Width Settings
- **What it does**: Controls the thickness of each EMA line.
- **For beginners**: Thicker lines for longer EMAs make them easier to distinguish.
🔔 How These Parameters Work Together
The power of this indicator comes from how these components interact:
1. **Base Oscillator**: The stochastic and RSI components create the main oscillator
2. **HTF Filter**: The higher timeframe filter prevents trading against larger trends
3. **EMA Filter**: The EMA filter confirms signals with price action
4. **Trend System**: The multi-EMA system identifies the overall market environment
Think of it as multiple layers of confirmation, each adding more reliability to your trading signals.
💡 Tips for Beginners
1. **Start with defaults**: Use the default settings first and understand what each element does
2. **One change at a time**: When customizing, change only one parameter at a time
3. **Keep notes**: Write down how each change affects your results
4. **Backtest thoroughly**: Test any changes on historical data before trading real money
5. **Less is more**: Sometimes simpler settings work better than complicated ones
Remember, no indicator is perfect - always combine this with proper risk management and other forms of analysis!

Squeeze Momentum Indicator with Entry Tactics### **Squeeze Momentum Indicator with Stacked EMAs**
#### **Description:**
This indicator is an enhanced version of the **Squeeze Momentum Indicator** (originally by John Carter and later modified by LazyBear). It identifies **periods of consolidation (squeeze)** and signals potential **explosive price moves** when momentum shifts. The added **stacked EMA concept** further refines entry signals by confirming trend strength. This is also an update to version 6 of PineScript
#### **How to Use:**
The indicator provides **three different entry tactics**, allowing traders to choose signals based on their strategy:
1. **Inside Day Pattern** – Detects inside candles, which indicate potential breakouts when volatility contracts.
2. **Consecutive Black Crosses (Squeeze Signal)** – A certain number of black crosses (low volatility periods) suggests a strong move is coming.
3. **Stacked EMA Concept** – When the **8 EMA > 21 EMA > 34 EMA**, combined with a momentum shift from negative to positive, it signals a **high-probability bullish entry**.
#### **Visual Cues:**
- **Histogram Bars**: Show momentum (green for increasing bullish, red for increasing bearish).
- **Black & Gray Dots**: Represent different squeeze states (low volatility vs. breakout conditions).
- **🔥 Bullish Label**: Appears when the stacked EMAs align and momentum shifts from negative to positive.
#### **Best Practices:**
- Look for **momentum shifts during a squeeze** for high-probability trades.
- Use **stacked EMAs as trend confirmation** before entering.
- Combine with **price action and volume analysis** for additional confluence.
This indicator helps traders **anticipate major price moves** rather than react, making it a powerful tool for trend-following and breakout strategies. 🚀

[COG]StochRSI Zenith📊 StochRSI Zenith
This indicator combines the traditional Stochastic RSI with enhanced visualization features and multi-timeframe analysis capabilities. It's designed to provide traders with a comprehensive view of market conditions through various technical components.
🔑 Key Features:
• Advanced StochRSI Implementation
- Customizable RSI and Stochastic calculation periods
- Multiple moving average type options (SMA, EMA, SMMA, LWMA)
- Adjustable signal line parameters
• Visual Enhancement System
- Dynamic wave effect visualization
- Energy field display for momentum visualization
- Customizable color schemes for bullish and bearish signals
- Adaptive transparency settings
• Multi-Timeframe Analysis
- Higher timeframe confirmation
- Synchronized market structure analysis
- Cross-timeframe signal validation
• Divergence Detection
- Automated bullish and bearish divergence identification
- Customizable lookback period
- Clear visual signals for confirmed divergences
• Signal Generation Framework
- Price action confirmation
- SMA-based trend filtering
- Multiple confirmation levels for reduced noise
- Clear entry signals with customizable display options
📈 Technical Components:
1. Core Oscillator
- Base calculation: 13-period RSI (adjustable)
- Stochastic calculation: 8-period (adjustable)
- Signal lines: 5,3 smoothing (adjustable)
2. Visual Systems
- Wave effect with three layers of visualization
- Energy field display with dynamic intensity
- Reference bands at 20/30/50/70/80 levels
3. Confirmation Mechanisms
- SMA trend filter
- Higher timeframe alignment
- Price action validation
- Divergence confirmation
⚙️ Customization Options:
• Visual Parameters
- Wave effect intensity and speed
- Energy field sensitivity
- Color schemes for bullish/bearish signals
- Signal display preferences
• Technical Parameters
- All core calculation periods
- Moving average types
- Divergence detection settings
- Signal confirmation criteria
• Display Settings
- Chart and indicator signal placement
- SMA line visualization
- Background highlighting options
- Label positioning and size
🔍 Technical Implementation:
The indicator combines several advanced techniques to generate signals. Here are key components with code examples:
1. Core StochRSI Calculation:
// Base RSI calculation
rsi = ta.rsi(close, rsi_length)
// StochRSI transformation
stochRSI = ((ta.highest(rsi, stoch_length) - ta.lowest(rsi, stoch_length)) != 0) ?
(100 * (rsi - ta.lowest(rsi, stoch_length))) /
(ta.highest(rsi, stoch_length) - ta.lowest(rsi, stoch_length)) : 0
2. Signal Generation System:
// Core signal conditions
crossover_buy = crossOver(sk, sd, cross_threshold)
valid_buy_zone = sk < 30 and sd < 30
price_within_sma_bands = close <= sma_high and close >= sma_low
// Enhanced signal generation
if crossover_buy and valid_buy_zone and price_within_sma_bands and htf_allows_long
if is_bullish_candle
long_signal := true
else
awaiting_bull_confirmation := true
3. Multi-Timeframe Analysis:
= request.security(syminfo.tickerid, mtf_period,
)
The HTF filter looks at a higher timeframe (default: 4H) to confirm the trend
It only allows:
Long trades when the higher timeframe is bullish
Short trades when the higher timeframe is bearish
📈 Trading Application Guide:
1. Signal Identification
• Oversold Opportunities (< 30 level)
- Look for bullish crosses of K-line above D-line
- Confirm with higher timeframe alignment
- Wait for price action confirmation (bullish candle)
• Overbought Conditions (> 70 level)
- Watch for bearish crosses of K-line below D-line
- Verify higher timeframe condition
- Confirm with bearish price action
2. Divergence Trading
• Bullish Divergence
- Price makes lower lows while indicator makes higher lows
- Most effective when occurring in oversold territory
- Use with support levels for entry timing
• Bearish Divergence
- Price makes higher highs while indicator shows lower highs
- Most reliable in overbought conditions
- Combine with resistance levels
3. Wave Effect Analysis
• Strong Waves
- Multiple wave lines moving in same direction indicate momentum
- Wider wave spread suggests increased volatility
- Use for trend strength confirmation
• Energy Field
- Higher intensity in trading zones suggests stronger moves
- Use for momentum confirmation
- Watch for energy field convergence with price action
The energy field is like a heat map that shows momentum strength
It gets stronger (more visible) when:
Price is in oversold (<30) or overbought (>70) zones
The indicator lines are moving apart quickly
A strong signal is forming
Think of it as a "strength meter" - the more visible the energy field, the stronger the potential move
4. Risk Management Integration
• Entry Confirmation
- Wait for all signal components to align
- Use higher timeframe for trend direction
- Confirm with price action and SMA positions
• Stop Loss Placement
- Consider placing stops beyond recent swing points
- Use ATR for dynamic stop calculation
- Account for market volatility
5. Position Management
• Partial Profit Taking
- Consider scaling out at overbought/oversold levels
- Use wave effect intensity for exit timing
- Monitor energy field for momentum shifts
• Trade Duration
- Short-term: Use primary signals in trading zones
- Swing trades: Focus on divergence signals
- Position trades: Utilize higher timeframe signals
⚠️ Important Usage Notes:
• Avoid:
- Trading against strong trends
- Relying solely on single signals
- Ignoring higher timeframe context
- Over-leveraging based on signals
Remember: This tool is designed to assist in analysis but should never be used as the sole decision-maker for trades. Always maintain proper risk management and combine with other forms of analysis.

2022 Model ICT Entry Strategy [TradingFinder] One Setup For Life🔵 Introduction
The ICT 2022 model, introduced by Michael Huddleston, is an advanced trading strategy rooted in liquidity and price imbalance, where time and price serve as the core elements. This ICT 2022 trading strategy is an algorithmic approach designed to analyze liquidity and imbalances in the market. It incorporates concepts such as Fair Value Gap (FVG), Liquidity Sweep, and Market Structure Shift (MSS) to help traders identify liquidity movements and structural changes in the market, enabling them to determine optimal entry and exit points for their trades.
This Full ICT Day Trading Model empowers traders to pinpoint the Previous Day High/Low as well as the highs and lows of critical sessions like the London and New York sessions. These levels act as Liquidity Zones, which are frequently swept prior to a market structure shift (MSS) or a retracement to areas such as Optimal Trade Entry (OTE).
Bullish :
Bearish :
🔵 How to Use
The ICT 2022 model is a sophisticated trading strategy that focuses on identifying key liquidity levels and price movements. It operates based on two main principles. In the first phase, the price approaches liquidity zones and sweeps critical levels such as the previous day’s high or low and key session levels.
This movement is known as a Liquidity Sweep. In the second phase, following the sweep, the price retraces to areas like the FVG (Fair Value Gap), creating ideal entry points for trades. Below is a detailed explanation of how to apply this strategy in bullish and bearish setups.
🟣 Bullish ICT 2022 Model Setup
To use the ICT 2022 model in a bullish setup, start by identifying the Previous Day High/Low or key session levels, such as those of the London or New York sessions. In a bullish setup, the price usually moves downward first, sweeping the Liquidity Low. This move, known as a Liquidity Sweep, reflects the collection of buy orders by major market participants.
After the liquidity sweep, the price should shift market structure and start moving upward; this shift, referred to as Market Structure Shift (MSS), signals the beginning of an upward trend. Following MSS, areas like FVG, located within the Discount Zone, are identified. At this stage, the trader waits for the price to retrace to these zones. Once the price returns, a long trade is executed.
Finally, the stop-loss should be set below the liquidity low to manage risk, while the take-profit target is usually placed above the previous day’s high or other identified liquidity levels. This structure enables traders to take advantage of the upward price movement after the liquidity sweep.
🟣 Bearish ICT 2022 Model Setup
To identify a bearish setup in the ICT 2022 model, begin by marking the Previous Day High/Low or key session levels, such as the London or New York sessions. In this scenario, the price typically moves upward first, sweeping the Liquidity High. This move, known as a Liquidity Sweep, signifies the collection of sell orders by key market players.
After the liquidity sweep, the price should shift market structure downward. This movement, called the Market Structure Shift (MSS), indicates the start of a downtrend. Following MSS, areas such as FVG, found within the Premium Zone, are identified. At this stage, the trader waits for the price to retrace to these areas. Once the price revisits these zones, a short trade is executed.
In this setup, the stop-loss should be placed above the liquidity high to control risk, while the take-profit target is typically set below the previous day’s low or another defined liquidity level. This approach allows traders to capitalize on the downward price movement following the liquidity sweep.
🔵 Settings
Swing period : You can set the swing detection period.
Max Swing Back Method : It is in two modes "All" and "Custom". If it is in "All" mode, it will check all swings, and if it is in "Custom" mode, it will check the swings to the extent you determine.
Max Swing Back : You can set the number of swings that will go back for checking.
FVG Length : Default is 120 Bar.
MSS Length : Default is 80 Bar.
FVG Filter : This refines the number of identified FVG areas based on a specified algorithm to focus on higher quality signals and reduce noise.
Types of FVG filters :
Very Aggressive Filter: Adds a condition where, for an upward FVG, the last candle's highest price must exceed the middle candle's highest price, and for a downward FVG, the last candle's lowest price must be lower than the middle candle's lowest price. This minimally filters out FVGs.
Aggressive Filter: Builds on the Very Aggressive mode by ensuring the middle candle is not too small, filtering out more FVGs.
Defensive Filter: Adds criteria regarding the size and structure of the middle candle, requiring it to have a substantial body and specific polarity conditions, filtering out a significant number of FVGs.
Very Defensive Filter: Further refines filtering by ensuring the first and third candles are not small-bodied doji candles, retaining only the highest quality signals.
🔵 Conclusion
The ICT 2022 model is a comprehensive and advanced trading strategy designed around key concepts such as liquidity, price imbalance, and market structure shifts (MSS). By focusing on the sweep of critical levels such as the previous day’s high/low and important trading sessions like London and New York, this strategy enables traders to predict market movements with greater precision.
The use of tools like FVG in this model helps traders fine-tune their entry and exit points and take advantage of bullish and bearish trends after liquidity sweeps. Moreover, combining this strategy with precise timing during key trading sessions allows traders to minimize risk and maximize returns.
In conclusion, the ICT 2022 model emphasizes the importance of time and liquidity, making it a powerful tool for both professional and novice traders. By applying the principles of this model, you can make more informed trading decisions and seize opportunities in financial markets more effectively.

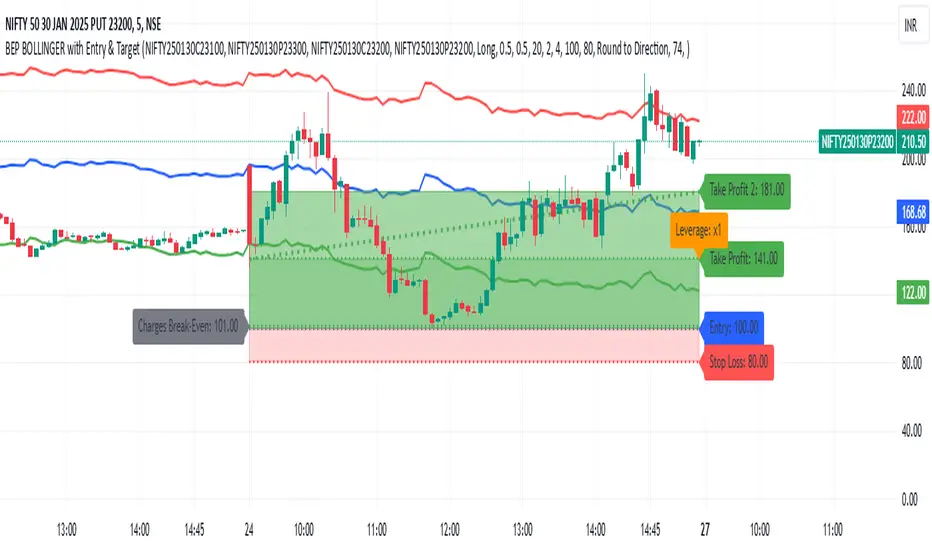
BEP BOLLINGER with Entry & TargetBEP BOLLINGER with Entry & Target Indicator
INPUT
ITM CE
ITM PE
ATM CE
ATM PE
This custom Pine Script indicator provides traders with a powerful tool to analyze options trading setups, specifically for Call and Put options (CE & PE). By integrating Bollinger Bands with a set of configurable parameters, it calculates key entry, stop loss, and take profit levels, while factoring in risk and reward for each trade. Ideal for options traders, this indicator supports precise risk management and enhances your ability to plan and execute trades based on calculated entry points and profit targets.
Key Features:
CE & PE Symbol Selection: Allows users to input two pairs of Call and Put option symbols for premium calculation.
Premium Calculation: Automatically calculates and plots the average premium for each pair of options.
Risk & Reward Zones: Visualizes risk zones and reward zones based on user-defined entry price, stop loss, and risk/reward ratio.
Leverage and Stop Loss Calculation: Computes the optimal leverage and adjusts stop loss based on acceptable loss percentage.
Break-Even Point: Identifies the break-even point considering trading fees and leverage.
Take Profit Levels: Calculates and visualizes multiple take profit levels with different risk/reward ratios.
Multi-Timeframe Analysis: Incorporates higher timeframe analysis to determine entry and stop loss levels for better decision-making.
Dynamic Alerts: Provides alerts when the price hits the stop loss, take profit levels, or reaches the break-even point.
Visual Tools: Draws lines and shaded areas for entry, stop loss, take profit, and risk/reward zones to aid in visual decision-making.
Customizable Settings:
Risk Management: Adjust stop loss, leverage, and risk/reward ratios to suit your trading strategy.
Trading Direction: Choose between Long or Short positions based on market outlook.
Fee Calculations: Input your buy and sell fees to accurately calculate break-even and profit zones.
Color Customization: Personalize the color of premium lines, offset levels, and risk/reward zones.
Alerts:
Alerts can be set for Stop Loss, Take Profit, and Break-Even, ensuring you're notified in real-time when important price levels are reached.
This tool is perfect for traders looking to integrate risk management and precise trade setup analysis into their options trading strategy.
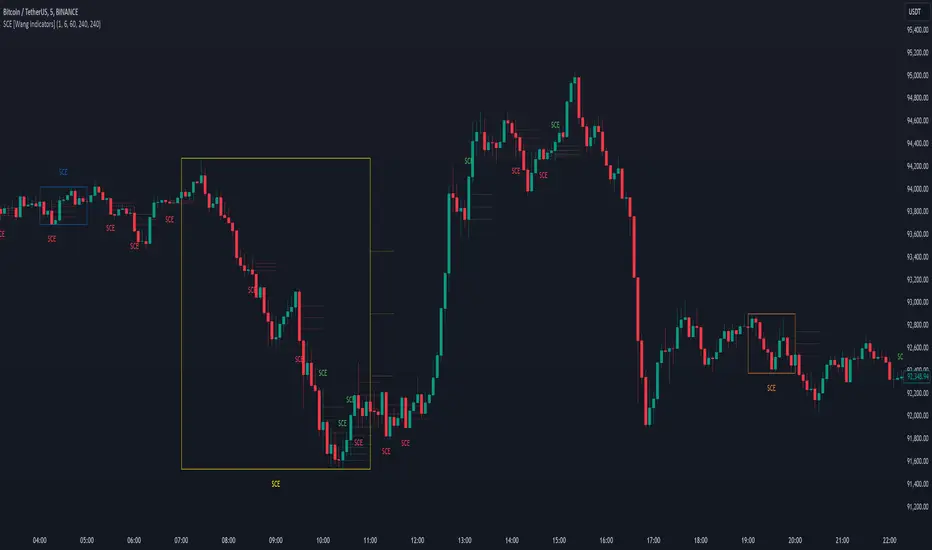
Single Candle Entry with Multi-Timeframe [Wang Indicators]
Single candle entry
Overview : The "Single Candle Entry Model" indicator is designed to help traders through a simple yet effective trading strategy. This indicator automatically detects candles that encompass both the high and low of the previous candle, creating key price zones for potential market entries.
- This indicator was developed with the help of @DaveTeaches -
How does it works ?
Detects when a candle trade above the high and below the low of the previous candle
When it occur, the indicator write "SCE" on the candle
The text will be in different color if its bearish or bullish (customizable by user)
Higher Timeframes
Users can enable up to 3 HTF SCE detection to enhance multi timeframe analysis.
Users can select which timeframe he want to use
Boxes will be displayed around High time frame SCE to highlight the HTF candle.
As regular SCE, the indicator will write "SCE" above or under the box
How does it helps users ?
Once the SCE is created, it can be used as a zone.
Levels (30, 50 and 70%) are displayed
Users can customize their apparence as they see fit
The 30 - 50 - 70 levels are support/resistance that the price tend to bounce of off
You might find some success looking for an entry inside the zone at a level if price gives further confirmations such as a lower time frame flip or using other indicators
Alert can be setup on any timeframe
Custom RSI & MACD Momentum Entry SignalsIndicator Explanation: Custom RSI & MACD Momentum Entry Signals
Introduction
The "Custom RSI & MACD Momentum Entry Signals" indicator combines the Relative Strength Index (RSI) and the Moving Average Convergence Divergence (MACD) to generate precise long and short entry signals. This indicator offers a powerful combination of overbought/oversold zones, momentum analysis, and RSI-EMA crossovers to assist traders in making better decisions.
How the Indicator Works
1. RSI Calculation and EMA
The RSI is calculated based on the closing price with an adjustable period (default: 14).
An Exponential Moving Average (EMA) of the RSI (default: 9) is plotted to identify RSI trend changes.
When the RSI crosses its EMA upwards, it signals a bullish impulse. Conversely, a downward cross indicates a bearish impulse.
2. MACD Calculation and Momentum Shifts
The MACD line is derived from the difference between a fast EMA (default: 12) and a slow EMA (default: 26).
The Signal line is the EMA of the MACD line (default: 9).
The MACD histogram represents the difference between the MACD line and the Signal line.
Momentum shifts are detected as follows:
Weakening Bearish: Histogram is negative but increasing (less bearish pressure).
Strengthening Bullish: Histogram is positive and rising.
Weakening Bullish: Histogram is positive but decreasing.
Strengthening Bearish: Histogram is negative and falling.
Signal Generation
Long Signals
A Long signal is triggered when all of the following conditions are met:
The RSI was previously below 30 (oversold condition).
MACD momentum shifts from "strengthening bearish" to "weakening bearish" or turns bullish.
The RSI crosses its EMA upwards.
A green upward arrow is displayed below the bar, and the background is lightly shaded green for additional visualization.
Short Signals
A Short signal is triggered when all of the following conditions are met:
The RSI was previously above 70 (overbought condition).
MACD momentum shifts from "strengthening bullish" to "weakening bullish" or turns bearish.
The RSI crosses its EMA downwards.
A red downward arrow is displayed above the bar, and the background is lightly shaded red for additional visualization.
Visual Elements
RSI and EMA:
The RSI is shown in purple.
The RSI EMA is shown in blue.
Horizontal lines at 30 (oversold) and 70 (overbought) provide additional context.
MACD:
The MACD line is displayed in blue.
The Signal line is displayed in orange.
The zero line is added for easier interpretation.
Signals:
Green arrows: Long signals.
Red arrows: Short signals.
Background color: Light green for long conditions, light red for short conditions.
Use Cases
This indicator is ideal for:
Trend Followers: Combining RSI and MACD allows traders to identify entry points during impulsive trend shifts.
Swing Traders: Long and short signals can be used at reversal points to capture short-term price movements.
Momentum Traders: By considering MACD momentum, the indicator provides additional confidence in signal generation.
Customizable Settings
The indicator provides flexible input options:
RSI Period (default: 14)
RSI EMA Period (default: 9)
MACD Parameters: Fast, slow, and signal EMAs can be adjusted.
Conclusion
The Custom RSI & MACD Momentum Entry Signals indicator is a powerful tool for traders looking to combine RSI and MACD to identify high-probability entry signals. With clear visualization and precise signal generation, traders can make decisions more efficiently and capitalize on market movements.

Calculate Order Entry Units based on set Dollar ValuesFUNCTIONS
- Calculate UNITS quantity based on user's input dollar values.
- Show Units in table
USAGE
- Enter 6 usual order $ values
- Use units value in order entry
Tradingview doesn't have order entry in dollar value for most connections/exchanges so it's really tedious to calculate Units some other way every time.
This gives you the Units based on your most used order value sizes in a quick way.
Possible future updates
- Allow user settings for number of values to display
- Allow user option to set titles for each row
Note:
Tradingview really need to get off their butts and give us a real DOM panel and working dollar value order entry for all exchanges among other order entry panel updates.
I hope everyone is suggesting this to them.

SMC Order Block & Liquidity EntryThe SMC Order Block and Liquidity Trap Entry Strategy script uses Smart Money Concepts (SMC), which analyze institutional actions in the market, to assist traders in identifying high-probability trades. In order to help traders match their entry with institutional activity, this script highlights important regions of interest, including order blocks, liquidity zones, and indications for Break of Structure (BOS) or Change of Character (CHoCH).
The fundamental ideas of this approach, which focuses on regions where institutions frequently make sizable orders or sweep liquidity, are based on SMC principles. Order blocks, which are frequently important support or resistance zones when institutions are involved, are the final bullish or bearish candle before a significant price move in the other direction. There are liquidity zones that show where retail stop-loss orders build up (above recent highs or below recent lows), such as Buy-Side Liquidity (BSL) and Sell-Side Liquidity (SSL). Before changing the direction of the price, institutions could target these zones, giving traders possible chances.
The script depicts liquidity levels above or below recent highs and lows, automatically finds order blocks within a specified lookback time, and looks for BOS (a continuation signal) or CHoCH (a reversal signal). When liquidity retests inside an order block coincide with BOS or CHoCH circumstances, entry signals are produced. While short entries are triggered when the price breaks below the order block and SSL, long entry alerts are triggered when the price breaks above the order block and BSL.

Relative Measured Volatility (RMV) – Spot Tight Entry ZonesTitle: Relative Measured Volatility (RMV) – Spot Tight Entry Zones
Introduction
The Relative Measured Volatility (RMV) indicator is designed to highlight tight price consolidation zones , making it an ideal tool for traders seeking optimal entry points before potential breakouts. By focusing on tightness rather than general volatility, RMV offers traders a practical way to detect consolidation phases that often precede significant market moves.
How RMV Works
The RMV calculates short-term tightness by averaging three ATR (Average True Range) values over different lookback periods and then normalizing them within a specified lookback window. The result is a percentage-based scale from 0 to 100, indicating how tight the current price range is compared to recent history.
Here’s the breakdown:
Three ATR values are computed using user-defined short lookback periods to represent short-term price movements. An average of the ATRs provides a smoothed measure of current tightness. The RMV normalizes this average against the highest and lowest values over the defined lookback period, scaling it from 0 to 100.
This approach helps traders identify consolidation zones that are more likely to lead to breakouts.
Key Features of RMV
Multi-Period ATR Calculation : Uses three ATR values to effectively capture market tightness over the short term. Normalization : Converts the tightness measure to a 0-100 scale for easy interpretation. Dynamic Histogram and Background Colors : The RMV indicator uses a color-coded system for clarity.
How to Use the RMV Indicator
Identify Tight Consolidation Zones:
a - RMV values between 0-10 indicate very tight price ranges, making this the most optimal zone for potential entries before breakouts.
b - RMV values between 11-20 suggest moderate tightness, still favorable for entries.
Monitor Potential Breakout Areas:
As RMV moves from 21-30 , tightness reduces, signaling expanding volatility that may require wider stops or more flexible entry strategies.
Adjust Trading Strategies:
Use RMV values to identify tight zones for entering trades, especially in trending markets or at key support/resistance levels.
Customize the Indicator:
a - Adjust the short-term ATR lookback periods to control sensitivity.
b - Modify the lookback period to match your trading horizon, whether short-term or long-term.
Color-Coding Guide for RMV
ibb.co
How to Add RMV to Your Chart
Open your chart on TradingView.
Go to the “Indicators” section.
Search for "Relative Measured Volatility (RMV)" in the Community Scripts section.
Click on the indicator to add it to your chart.
Customize the input parameters to fit your trading strategy.
Input Parameters
Lookback Period : Defines the period over which tightness is measured and normalized.
Short-term ATR Lookbacks (1, 2, 3) : Control sensitivity to short-term tightness.
Histogram Threshold : Sets the threshold for differentiating between bright (tight) and dim (less tight) histogram colors.
Conclusion
The Relative Measured Volatility (RMV) is a versatile tool designed to help traders identify tight entry zones by focusing on market consolidation. By highlighting narrow price ranges, the RMV guides traders toward potential breakout setups while providing clear visual cues for better decision-making. Add RMV to your trading toolkit today and enhance your ability to identify optimal entry points!

RSI (Kernel Optimized) | Flux Charts💎 GENERAL OVERVIEW
Introducing our new KDE Optimized RSI Indicator! This indicator adds a new aspect to the well-known RSI indicator, with the help of the KDE (Kernel Density Estimation) algorithm, estimates the probability of a candlestick will be a pivot or not. For more information about the process, please check the "HOW DOES IT WORK ?" section.
Features of the new KDE Optimized RSI Indicator :
A New Approach To Pivot Detection
Customizable KDE Algorithm
Realtime RSI & KDE Dashboard
Alerts For Possible Pivots
Customizable Visuals
❓ HOW TO INTERPRET THE KDE %
The KDE % is a critical metric that reflects how closely the current RSI aligns with the KDE (Kernel Density Estimation) array. In simple terms, it represents the likelihood that the current candlestick is forming a pivot point based on historical data patterns. a low percentage suggests a lower probability of the current candlestick being a pivot point. In these cases, price action is less likely to reverse, and existing trends may continue. At moderate levels, the possibility of a pivot increases, indicating potential trend shifts or consolidations.Traders should start monitoring closely for confirmation signals. An even higher KDE % suggests a strong likelihood that the current candlestick could form a pivot point, which could lead to a reversal or significant price movement. These points often align with overbought or oversold conditions in traditional RSI analysis, making them key moments for potential trade entry or exit.
📌 HOW DOES IT WORK ?
The RSI (Relative Strength Index) is a widely used oscillator among traders. It outputs a value between 0 - 100 and gives a glimpse about the current momentum of the price action. This indicator then calculates the RSI for each candlesticks, and saves them into an array if the candlestick is a pivot. The low & high pivot RSIs' are inserted into two different arrays. Then the a KDE array is calculated for both of the low & high pivot RSI arrays. Explaining the KDE might be too much for this write-up, but for a brief explanation, here are the steps :
1. Define the necessary options for the KDE function. These are : Bandwidth & Nº Steps, Array Range (Array Max - Array Min)
2. After that, create a density range array. The array has (steps * 2 - 1) elements and they are calculated by (arrMin + i * stepCount), i being the index.
3. Then, define a kernel function. This indicator has 3 different kernel distribution modes : Uniform, Gaussian and Sigmoid
4. Then, define a temporary value for the current element of KDE array.
5. For each element E in the pivot RSI array, add "kernel(densityRange.get(i) - E, 1.0 / bandwidth)" to the temporary value.
6. Add 1.0 / arrSize * to the KDE array.
Then the prefix sum array of the KDE array is calculated. For each candlestick, the index closest to it's RSI value in the KDE array is found using binary search. Then for the low pivot KDE calculation, the sum of KDE values from found index to max index is calculated. For the high pivot KDE, the sum of 0 to found index is used. Then if high or low KDE value is greater than the activation threshold determined in the settings, a bearish or bullish arrow is plotted after bar confirmation respectively. The arrows are drawn as long as the KDE value of current candlestick is greater than the threshold. When the KDE value is out of the threshold, a less transparent arrow is drawn, indicating a possible pivot point.
🚩 UNIQUENESS
This indicator combines RSI & KDE Algorithm to get a foresight of possible pivot points. Pivot points are important entry, confirmation and exit points for traders. But to their nature, they can be only detected after more candlesticks are rendered after them. The purpose of this indicator is to alert the traders of possible pivot points using KDE algorithm right away when they are confirmed. The indicator also has a dashboard for realtime view of the current RSI & Bullish or Bearish KDE value. You can fully customize the KDE algorithm and set up alerts for pivot detection.
⚙️ SETTINGS
1. RSI Settings
RSI Length -> The amount of bars taken into account for RSI calculation.
Source -> The source value for RSI calculation.
2. Pivots
Pivot Lengths -> Pivot lengths for both high & low pivots. For example, if this value is set to 21; 21 bars before AND 21 bars after a candlestick must be higher for a candlestick to be a low pivot.
3. KDE
Activation Threshold -> This setting determines the amount of arrows shown. Higher options will result in more arrows being rendered.
Kernel -> The kernel function as explained in the upper section.
Bandwidth -> The bandwidth variable as explained in the upper section. The smoothness of the KDE function is tied to this setting.
Nº Bins -> The Nº Steps variable as explained in the upper section. It determines the precision of the KDE algorithm.

MA15, MA50 with Support/Resistance, CHoCH, Trend, and Entry/Exita comprehensive indicator that includes moving averages (MA), support and resistance levels, Change of Character (CHoCH) detection, trend identification, and entry/exit signals. Here's a breakdown of its components:
Input Parameters:
ma15_length and ma50_length: Lengths for the moving averages.
lookback: Period for detecting support and resistance levels.
Moving Averages:
ma15 and ma50 are simple moving averages with lengths defined by the user.
Support and Resistance Levels:
The script identifies swing highs and lows to update support and resistance levels.
These levels are plotted using extended lines for visualization.
Change of Character (CHoCH):
CHoCH up is detected when ma15 crosses above ma50.
CHoCH down is detected when ma15 crosses below ma50.
Corresponding signals are plotted on the chart.
Trend Identification:
An uptrend is confirmed when ma15 crosses above ma50 and the close price is above ma50.
A downtrend is confirmed when ma15 crosses below ma50 and the close price is below ma50.
Background colors are used to highlight uptrend (green) and downtrend (red).
Entry and Exit Signals:
Buy signals are generated when CHoCH up occurs, and the price pulls back to support during an uptrend.
Sell signals are generated when CHoCH down occurs, and the price pulls back to resistance during a downtrend.
These signals are plotted on the chart.
Alerts:
Alerts are set up to notify the user when a buy or sell signal is detected.

Sniper Entry using RSI confirmationThis is a sniper entry indicator that provides Buy and Sell signals using other Indicators to give the best possible Entries (note: Entries will not be 100 percent accurate and analysis should be done to support an entry)
Moving Average Crossovers:
The indicator uses two moving averages: a short-term SMA (Simple Moving Average) and a long-term SMA.
When the short-term SMA crosses above the long-term SMA, it generates a buy signal (indicating potential upward momentum).
When the short-term SMA crosses below the long-term SMA, it generates a sell signal (indicating potential downward momentum).
RSI Confirmation:
The indicator incorporates RSI (Relative Strength Index) to confirm the buy and sell signals generated by the moving average crossovers.
RSI is used to gauge the overbought and oversold conditions of the market.
A buy signal is confirmed if RSI is below a specified overbought level, indicating potential buying opportunity.
A sell signal is confirmed if RSI is above a specified oversold level, indicating potential selling opportunity.
Dynamic Take Profit and Stop Loss:
The indicator calculates dynamic take profit and stop loss levels based on the Average True Range (ATR).
ATR is used to gauge market volatility, and the take profit and stop loss levels are adjusted accordingly.
This feature helps traders to manage their risk effectively by setting appropriate profit targets and stop loss levels.
Combining the information provided by these, the indicator will provide an entry point with a provided take profit and stop loss. The indicator can be applied to different asset classes. Risk management must be applied when using this indicator as it is not 100% guaranteed to be profitable.
Goodluck!

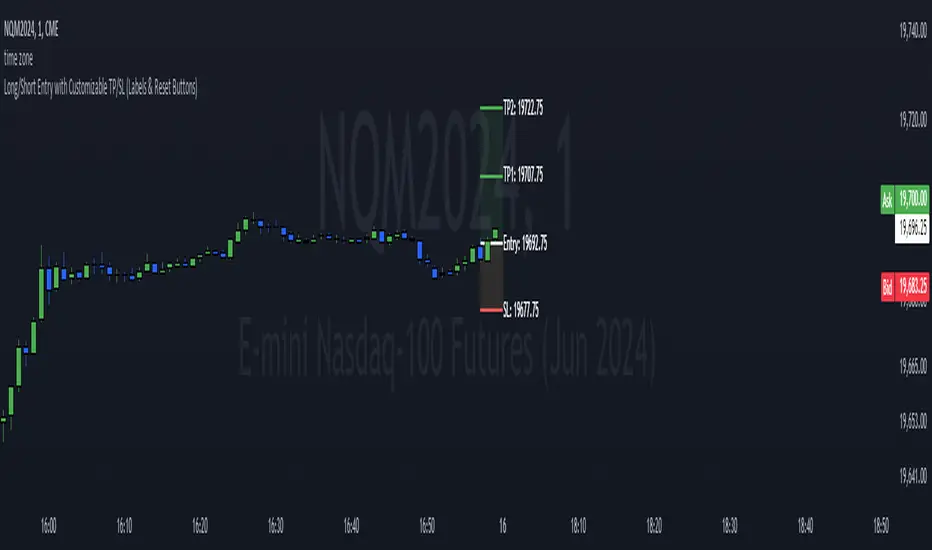
Long/Short Entry with Customizable TP/SLThis TradingView indicator is designed to help traders visualize potential trade entries along with their corresponding stop-loss (SL) and take-profit (TP) levels. It offers a high degree of customization, allowing users to:
Choose Entry Type: Select whether the anticipated trade is a Long or Short position.
Set Entry Price: Specify the exact price level at which you intend to enter the trade.
Customize TP/SL:
Enable/Disable: Choose whether to include a stop-loss (SL) and up to five take-profit (TP) levels.
Distance: Set the distance (in price points) for each SL and TP level from the entry price.
Add/Update Trade: Clicking the "Add/Update Trade" button will plot the entry line, SL line (if enabled), and TP lines (if enabled) on the chart, along with their corresponding labels. The lines and boxes will start two candles before the current bar and extend into the future.
Reset Trade: Clicking the "Reset Trade" button will clear all the lines, boxes, and labels from the chart, allowing you to start fresh with a new trade idea.
Visual Cues:
The indicator uses color-coded lines and boxes to distinguish between entry, SL, and TP levels.
Labels are provided next to each line, displaying the type of level (e.g., "Entry," "SL," "TP1") and its corresponding price.
Key Features:
Highly Customizable: Tailor the indicator to your specific trading style and risk management preferences.
Visual Clarity: Clearly visualize potential trade setups and their outcomes.
Easy to Use: The intuitive interface makes it simple to add, update, and reset trades.
Flexibility: Supports both long and short positions.
Limitations:
The indicator is designed for visualization and planning purposes only. It does not automatically execute trades.
The simulated "Add Trade" and "Reset Trade" buttons require manual unchecking after each click.
VAMSI ADVANCE Entry HelperThe "VAMSI Entry Helper" indicator is designed to assist traders in identifying potential entry points in the market by analyzing price equilibrium and liquidity equilibrium using a combination of Relative Strength Index (RSI) and moving averages. Here’s a detailed description of its components and functionality:
Components of the Indicator:
RSI (Relative Strength Index):
RSI Length: This parameter (rsiLengthInput) controls the period over which the RSI is calculated. It is set to 50 by default, but you can adjust it as needed.
RSI Source: The source of the price data for calculating the RSI, which is the closing price by default.
Moving Average (MA):
MA Type: You can choose between Simple Moving Average (SMA) and Exponential Moving Average (EMA) for smoothing the RSI values.
MA Length: This parameter (maLengthInput) controls the period over which the moving average of the RSI is calculated. It is set to 60 by default.
Functionality:
RSI Calculation:
The script calculates the RSI based on the selected source and length. RSI is a momentum oscillator that measures the speed and change of price movements and oscillates between 0 and 100.
The RSI calculation involves computing the average gains and losses over the specified period (rsiLengthInput), and then applying the RSI formula.
Moving Average of RSI:
After calculating the RSI, the indicator computes a moving average of the RSI values using the specified type (SMA or EMA) and length (maLengthInput). This smoothed RSI helps in identifying the equilibrium of liquidity.
Plots:
RSI Plot: The RSI values are plotted on the chart with a purple line (#4B0082), providing a visual representation of price equilibrium.
MA Plot: The moving average of the RSI is plotted with a black line, showing the smoothed trend of the RSI.
Middle Band: A horizontal line at the 50 level is plotted as a reference point, indicating the midpoint of the RSI scale. This can help in identifying overbought and oversold conditions.
Use Case:
Price Equilibrium: The RSI plot helps traders identify when the price is relatively strong or weak. RSI values above 70 may indicate an overbought condition, while values below 30 may indicate an oversold condition.
Liquidity Equilibrium: The moving average of the RSI provides a smoothed view of the RSI, helping traders see the overall trend of liquidity equilibrium.
Example Usage:
Entry Points: Traders might look for entry points when the RSI crosses above or below its moving average, indicating potential changes in momentum.
Overbought/Oversold Conditions: Traders can use the RSI values along with the middle band (50) to identify overbought (RSI > 70) and oversold (RSI < 30) conditions.
Customization:
RSI Length: Adjustable to fit different trading strategies and timeframes.
Source: You can change the source data for the RSI calculation (e.g., close, open, high, low).
MA Type and Length: You can choose between SMA and EMA and adjust the period to better fit your trading style.
This indicator provides a comprehensive tool for traders to analyze price and liquidity equilibrium, helping them make informed decisions about entry points in the market.

Dynamic Date and Price Tracker with Entry PriceThe Dynamic Date and Price Tracker indicator is a simple tool designed for traders to visualize and monitor their trade's progress in real-time from a specified starting point.
This tool provides an intuitive graphical representation of your trade's profitability based on a custom entry date and price.
Features:
-Starting Date Selection: Choose a specific starting date, after which the indicator begins tracking your trade's performance.
-Custom Entry Price: Input a starting price to accurately reflect your actual entry price for performance tracking across different timeframes.
-Real-Time Tracking: As new bars form, the indicator automatically adjusts a dynamic line to the current closing price.
-Profit/Loss Color Coding: The dynamic line color changes based on whether the current price is above (green for profit) or below (red for loss) your specified entry price.
-Performance Label: A real-time label displays the absolute and percentage change in price since your initial entry, color-coded for positive (green) or negative (red) performance.
-Entry Price Line: The horizontal line marks your starting price for easy visual comparison.

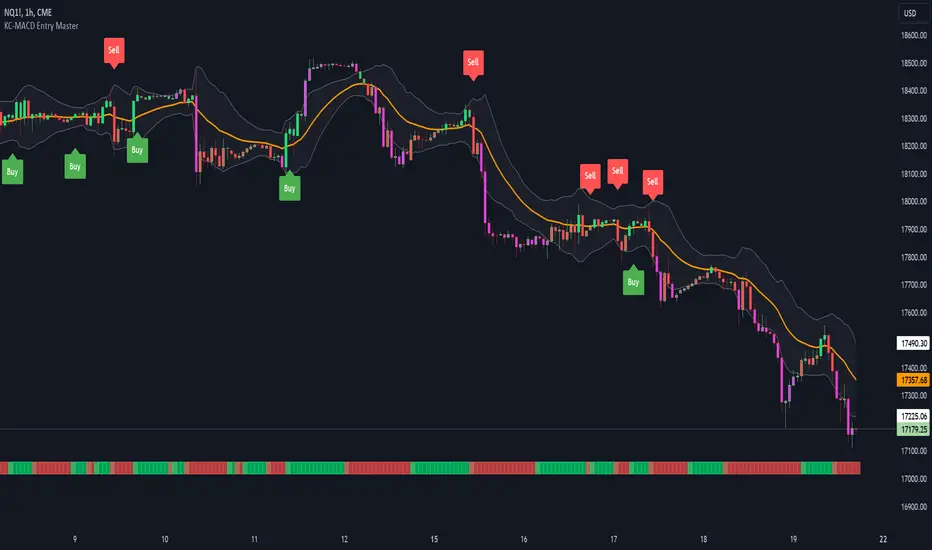
KC-MACD Entry Master @shrilssThe KC-MACD Entry Master is designed to enhance trading strategies by utilizing Keltner Channels and MACD for dynamic market analysis. This indicator excels in visually identifying market conditions with a sophisticated bar coloring system and an informative MACD Traffic Light feature.
Key Features:
- Dynamic Bar Coloring: The core feature of this indicator is its ability to adjust the color of bars based on their positioning relative to the Keltner Channels and the EMA (Exponential Moving Average). It colors bars lime or red when the closing price is within the Keltner Channels but above or below the EMA, respectively. Additionally, it uses a fuchsia color to indicate breakouts when the price extends beyond the Keltner Channels. This visual aid helps traders quickly identify potential buying or selling opportunities based on market volatility and price action.
- MACD Traffic Light: Positioned at the bottom of the chart, this unique feature displays the histogram color of the MACD, set by default to a 3/10/16 configuration—known as the 3-10 Oscillator. This Traffic Light gives traders an at-a-glance view of the underlying momentum and trend shifts, further aiding in decision-making processes.
- MACD-Based Entry Signals: By calculating the fast and slow moving averages specified by the user, the script determines MACD values and their crossover with a smoothed signal line. Entry points are then highlighted with shapes (e.g., "Buy" or "Sell") plotted on the chart when conditions are met, including alignment with the bar colors for enhanced accuracy.