[MAD] Entrytool / Bybit-LinearThis indicator, "Entry Tool," was coded at request for Sandmann .
It is designed to provide traders with real-time feedback for strategizing entries, exits, and liquidation levels for trades initiated at that given moment.
The tool visualizes average entry prices, stop-loss levels, multiple take-profit targets, and potential liquidation prices, offering a comprehensive overview of possible trade outcomes. It aids traders in pre-planning their trades by visually simulating the impact of different trading decisions directly on the live chart. Each setting and parameter can be customized to align with individual trading strategies and risk tolerances, making this tool versatile for various trading styles, including day trading, swing trading, and position trading.
------------------------------
Steps to Use the Indicator:
1. Basic Setup:
Setup Type: Choose between "Long" or "Short" to set the direction of the trade.
Leverage: Adjust the leverage to understand its impact on your potential returns and liquidation price.
Tracking follows the close price, alternative you can enter a specific price.
2. Position Setup:
Initial Entry Amount: Set the starting amount for the trade.
Distance: First Increment Percentage from Entry price
Amount: Define the increase for the first incremental addition to the position and specify the amount to be added.
Distance: Second Increment Percentage from Entry
Amount: Set the increase for the second incremental addition and the corresponding amount.
3. Risk Management:
Stop-Loss (SL) Percentage: Set the percentage below or above the average entry price at which the position should be closed to minimize losses.
Take-Profit (TP) Percentages: Define up to four different profit target levels by specifying the percentage above or below the average entry price.
4. Visual Settings:
Box Colors: Customize the colors of the boxes that represent long and short positions to differentiate easily on the chart.
Box Extension: Determine the length by which the box extends beyond the current bar, which helps in visualizing the potential price movement.
Line Colors and Extensions: Select colors for various lines such as the Average Entry Line, Stop-Loss Line, Take-Profit Lines, and Liquidations Line. Adjust the length of these lines for better visibility.
Label Settings: Configure the distance of labels from their corresponding lines and set the font size for better readability.
5. Additional Features:
Liquidation Price Visualization: This new feature calculates and displays the liquidation price based on the current leverage and margin settings, giving traders a critical insight into their risk exposure.
Interactive Drag Point: Adjust the start price manually by dragging the point on the chart, which dynamically updates entry and exit levels as well as risk metrics.
Detailed Leverage Data Array: Input different scenarios with specific leverage, initial margin, and maintenance rates to see how these factors impact potential liquidation points.
6. Informations about leverage calculation
The data used are fetched from Bybit for Linear pairs to calculate the liquidations like in their documentation.
Keep in mind that other exchanges may calulate based on another formular.
Pesquisar nos scripts por "entry"

TNT Entrysthis indicator gives you entrys and shows bar color for the current trend for you to confirm you entry
5 DMA Entry Plus5 DMA Entry Plus - Multi-Strategy Entry Signal Indicator
Overview:
The 5 DMA Entry Plus is a versatile entry signal indicator that combines multiple proven technical analysis methods to identify potential buy opportunities. This indicator is designed to be highly customizable, allowing traders to toggle between different entry strategies or combine them for confluence-based entries.
Key Features:
1. Multiple Entry Strategy Options:
Default Close Above Entry: Triggers when price closes above the 5-day moving average (with optional HMA filter)
Green Wick Candle Signal: Identifies bullish candles where the wick pierces above key moving averages, indicating rejection of lower prices
5DMA Zero/Upslope Entry: Generates signals when the 5DMA is flat or sloping upward, confirming momentum
HMA Cross Entry: Triggers when price crosses above the Hull Moving Average, a responsive momentum indicator
2. Adaptive HMA Filter:
Toggle the HMA (Hull Moving Average) filter on or off to adjust signal sensitivity. When enabled, price must be above both the 5DMA and 20 HMA for confirmation. When disabled, only the 5DMA is required, generating more frequent signals.
3. Smart Reset Logic:
The indicator includes intelligent reset functionality that prevents signal spam. Once an entry signal is generated, no new signals appear until price closes below the moving average(s), ensuring clean, actionable entries without clutter.
4. Visual Components:
5-Day Moving Average (Blue Line): The primary trend reference
20-Period Hull Moving Average (Orange Line): Fast-responding momentum filter
Buy Signals (Green Labels): Clear "Buy" labels appear below candles when entry conditions are met
Built-in Alerts: Set up custom alerts to be notified when entry signals trigger
Customizable Inputs:
Use HMA Filter: Enable/disable the 20 HMA confirmation requirement
Include Green Wick Candle Signal: Toggle wick-based entry detection
Use 5DMA Zero/Upslope Entry: Enable slope-based entry logic
Use HMA Cross Entry: Enable HMA crossover signals
HMA Length: Adjust the Hull Moving Average period (default: 20)
Best Use Cases:
Swing trading on daily and 4-hour timeframes
Identifying pullback entries in uptrends
Combining multiple confirmation signals for high-probability setups
Filtering entries in momentum-based strategies
Strategy Flexibility:
This indicator allows you to use each entry method independently or combine multiple methods for confluence. Test different combinations to find what works best for your trading style and the instruments you trade.
Risk Management Note:
This indicator identifies potential entry points but does not provide exit signals or stop-loss levels. Always use proper risk management and combine with your own exit strategy.

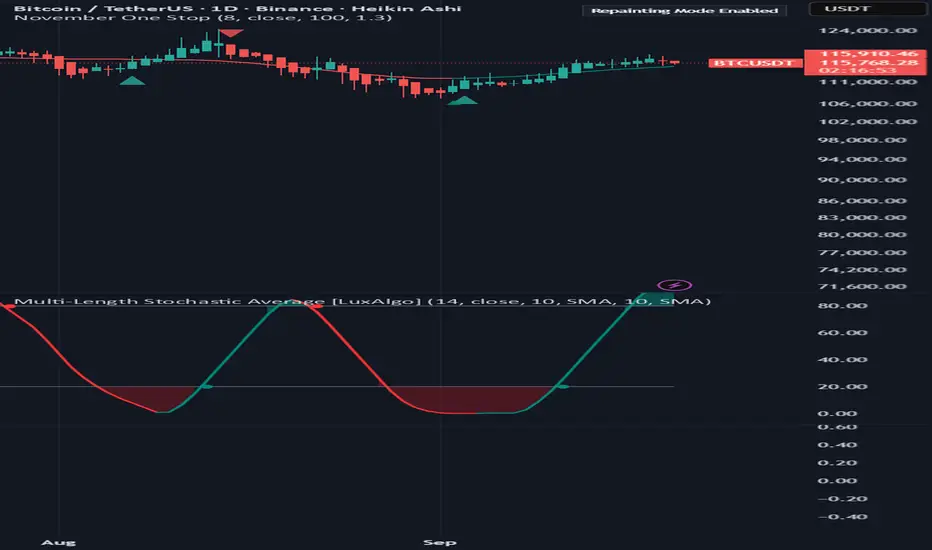
November One StopNovember One Stop
This script is designed to confirm entry confidence in trend trading using Heiken Ashi candles, with an optional enhancement through a multi-strength RSI indicator.
Confidence Levels:
Level 3 (Strong Confidence):
Entry is confirmed when three consecutive Heiken Ashi candles of the same color appear (green for long positions, red for short positions).
Additional confirmation is provided when the arrow indicator, the moving average line, and the closing candle are all aligned in color, indicating a strong trend with minimal likelihood of immediate reversal.
Level 4 (Maximum Confidence):
Incorporating a multi-strength RSI as an additional filter provides a fourth level of confirmation. While this may result in missing some initial gains, it significantly reduces risk by ensuring all indicators are in agreement. This script does not yet incorporate the RSI.
Entry Criteria:
Wait for three consecutive Heiken Ashi candles of the same color.
Confirm that the arrow indicator, moving average line, and the closing candle are all aligned in color.
For maximum confidence, ensure the multi-strength RSI also confirms the trend direction.
Risk Consideration:
Entering before all indicators are aligned increases risk due to potential reversals. Alignment of all indicators provides higher probability of trend continuation for the selected timeframe.
Recommendation:
Before implementation, review historical performance of this strategy to gain a comprehensive understanding of its effectiveness.
Roadmap for improvements:
Include RSI
Improve Alarm trigger options
Apex Edge - VantageApex Edge – Vantage
Quarter-Wick Reversal System | Price Action Based | Non-Repainting | Visual Confirmation Tool
Overview:
Apex Edge – Vantage is a precision price action indicator built to assist traders in identifying high-probability reversal entries — not based on indicators, but on how candles behave at their extremes.
This tool implements a clean, repeatable framework that reflects how I personally trade:
Spot a candle that closes with strong directional intent,
Then wait for a controlled pullback into the outer quarter,
And strike — only if price respects that line.
There’s no magic here — just raw, tactical logic visualized clearly on your chart. It's not designed to predict the market — it's built to respond when price offers you Vantage.
Core Logic:
Dot Detection – Final Quarter Close Candles
A green dot prints below a bullish candle if it closes within the top 25% of its wick-to-wick range.
A red dot prints above a bearish candle if it closes within the bottom 25% of its range.
These dots signify candles that made a strong, deliberate move in one direction — where price was pushed to an extreme and held that extreme into the close. These candles often signal institutional intent or momentum imbalance.
Entry Confirmation – Controlled Wick Rebalance
On the very next candle only, price must wick into the prior dot candle's outer quarter — but must not pass beyond it.
For buy entries, the wick must enter the bottom 25% of the previous green dot candle, but not dip below it.
For sell entries, the wick must reach into the top 25% of the red dot candle, but not exceed it.
This wick into the quarter is seen as a controlled rebalancing — a tactical reaction back into the origin zone before potential continuation.
Arrow Printing – Visual Entry Signal
Once the entry criteria are confirmed, an arrow is printed after the candle closes.
This arrow continues to print on each new candle as long as price does not violate the original entry zone — giving visual confirmation that the trade thesis is still valid.
If price breaks above/below the quarter range, the arrow disappears.
This ongoing confirmation is useful for staying in trades, managing risk, or spotting failed setups early.
Automatic Stop Loss Level
A horizontal Stop Loss line is drawn from the extreme wick of the original dot candle.
For buy entries, SL is placed below the green dot candle's low.
For sell entries, SL is placed above the red dot candle's high.
This provides immediate risk context — perfect for traders using limit orders or looking to scale in.
Coding Logic:
This script uses plotshape() and plot() functions for all visual elements.
Dot candles are identified using quarter-range logic via:
pinescript
Copy
Edit
close >= high - (high - low) * 0.25 // for bullish
close <= low + (high - low) * 0.25 // for bearish
Entry validation logic triggers only on the next candle, using:
pinescript
Copy
Edit
low >= quarterLine and low <= high // for buy entries
high <= quarterLine and high >= low // for sell entries
Arrows and SL lines are plotted only on closed candles, ensuring non-repainting behavior.
alertcondition() is used for real-time alerts on valid buy/sell triggers.
How I Personally Use It:
I wait for a dot to print — this shows directional conviction.
On the next candle, I watch for a tap into the outer quarter.
If the wick meets the criteria and the candle closes, I’ll execute manually at the close of that candle.
As long as the arrow remains on the chart, I know the setup hasn’t been invalidated.
I combine this with market structure, session timing, and liquidity context to build confluence around each trade.
Alerts Included:
Buy Entry Alert: When a green arrow prints (entry confirmed)
Sell Entry Alert: When a red arrow prints (entry confirmed)
These fire once per confirmed signal, allowing you to react in real-time or automate if desired.
Who This Is For:
Manual traders who want clean price-based entries
Anyone who uses market structure, SMC, or liquidity concepts
Traders looking to replace indicators with pure candle logic
Discretionary or semi-systematic traders who want visual tools to guide their decisions
Final Word
Apex Edge – Vantage doesn’t predict price — it shows you where price is offering you control.
This is a surgical tool designed to help you act only when the market gives you a measurable edge — and to stay in the trade as long as that edge holds.
If you're ready to stop chasing trades and start striking from a position of Vantage, then this tool belongs on your chart.

Bewakoof stock indicator**Title**: "Bewakoof Stock Indicator: Multi-Timeframe RSI and SuperTrend Entry-Exit System"
---
### Description
The **Bewakoof Stock Indicator** is an original trading tool that combines multi-timeframe RSI analysis with the SuperTrend indicator to create reliable entry and exit signals for trending markets. This indicator is designed for traders looking to follow strong trends with built-in risk management. By filtering entries through short- and long-term momentum and utilizing dynamic trailing exits, this indicator provides a structured approach to trading.
#### Indicator Components
1. **Multi-Timeframe RSI Analysis**:
- The Relative Strength Index (RSI) is calculated across three timeframes: Daily, Weekly, and Monthly.
- By examining multiple timeframes, the indicator confirms that trends align over short, medium, and long-term intervals, making buy signals more reliable.
- **Buy Condition**: All three RSI values must meet these thresholds:
- **Daily RSI > 50** – indicates short-term upward momentum,
- **Weekly RSI > 60** – signals medium-term strength,
- **Monthly RSI > 60** – confirms long-term trend alignment.
- This filtering process ensures that buy signals are generated only in stable, upward-trending markets.
2. **SuperTrend Confirmation**:
- The SuperTrend (20-period ATR with a multiplier of 2) acts as a trend filter and trailing stop mechanism.
- For a buy condition to be valid, the closing price must be above the SuperTrend level, verifying that the market is trending up.
- The combination of RSI and SuperTrend helps to avoid false signals, focusing only on well-established trends.
#### Trade Signals
- **Buy Signal**: When both the multi-timeframe RSI and SuperTrend conditions are met, a buy signal is triggered, indicated by a “BUY” label on the chart with details:
- **Entry Price**,
- **Initial Stop-Loss** (set at the SuperTrend level for risk control),
- **Target 1** – calculated with a 1:1 risk-reward ratio based on the initial stop-loss,
- **Target 2** – calculated with a 1:2 risk-reward ratio based on the initial stop-loss.
- **Exit Signals**: This indicator provides two exit strategies to protect profits:
1. **Fixed Stop-Loss**: Automatically set at the SuperTrend level at the time of entry to limit risk.
2. **Trailing Exit**: Exits are triggered if the price crosses below the SuperTrend level, adapting to potential trend reversals.
#### Labeling & Alerts
The **Bewakoof Stock Indicator** offers intuitive labeling and alert options:
- **Labels**: Buy and exit points are clearly marked, showing entry, stop-loss, and targets directly on the chart.
- **Alerts**: Custom alerts can be set for:
- **Buy signals** when both conditions are met, and
- **Exit signals** triggered by the stop-loss or trailing exit.
#### Use Case and Benefits
This indicator is ideal for trend-following traders who value risk control and trend confirmation:
- **Stronger Trend Signals**: By requiring RSI alignment across multiple timeframes, this indicator focuses only on trades with strong trend momentum.
- **Dynamic Risk Management**: Using both fixed and trailing exits enables flexible trade management, balancing risk and potential reward.
- **Simple Trade Execution**: The chart labels and alerts simplify trade decisions, making it easy to enter, manage, and exit trades.
#### How to Use
1. **Add** the Bewakoof Stock Indicator to your chart.
2. **Watch** for the "BUY" label as your entry point.
3. **Manage the trade** using the labeled stop-loss and target levels.
4. **Exit** on either a stop-loss hit or when the price crosses below the SuperTrend for a trailing exit.
The **Bewakoof Stock Indicator** is a complete solution for trend-following traders, combining the strength of multi-timeframe RSI with the SuperTrend’s trend-following capabilities. This systematic approach aims to provide high-confidence entries and effective risk management, empowering traders to follow trends with precision and control.

Gaussian Filter [BigBeluga]The Gaussian Filter - BigBeluga indicator is a trend-following tool that uses a Gaussian filter to smooth price data and identify directional shifts in the market. It provides dynamic signals for entering and exiting trades based on trend changes, helping traders stay aligned with the market's momentum. What sets this indicator apart is its ability to display precise entry and exit points with real-time tracking of percentage price changes, making it ideal for trend-based strategies.
SP500:
NIFTY50:
🔵 KEY FEATURES & USAGE
◉ Gaussian Filter Trend Line:
//@function GaussianFilter is used for smoothing, reducing noise, and computing derivatives of data.
//@param src (float) The source data (e.g., close price) to be smoothed.
//@param params (GaussianFilterParams) Gaussian filter parameters that include length and sigma.
//@returns (float) The smoothed value from the Gaussian filter.
gaussian_filter(float src, params) =>
var float weights = array.new_float(params.length) // Array to store Gaussian weights
total = 0.0
pi = math.pi
for i = 0 to params.length - 1
weight = math.exp(-0.5 * math.pow((i - params.length / 2) / params.sigma, 2.0))
/ math.sqrt(params.sigma * 2.0 * pi)
weights.set(i, weight)
total := total + weight
for i = 0 to params.length - 1
weights.set(i, weights.get(i) / total)
sum = 0.0
for i = 0 to params.length - 1
sum := sum + src * weights.get(i)
sum
The core functionality of the Gaussian Filter line is to show trend direction. When the trend line increases four times consecutively, it indicates an uptrend signal. Similarly, if it decreases four times in a row, it signals a downtrend. The smoothness of the filter helps traders stay on the right side of the market by filtering out noise and emphasizing the dominant trend direction.
◉ Entry and Exit Levels with Real-Time Price and Performance Data:
Each time the indicator detects a trend change, it plots an entry or exit level on the chart. For an uptrend, an entry level is marked, and for a downtrend, an exit level is plotted. These levels display the price at the time of the signal.
While the trend is ongoing, the indicator tracks the percentage change in price from the initial entry or exit signal to the current bar, updating in real-time. When a trend concludes, it displays the total percentage change from the entry or exit point to the trend's end. This feature provides valuable insights into how much the price has moved during each trend phase and allows traders to monitor the performance of each trade.
◉ Color-Coded Candlestick Representation with Trend Shift Alerts:
In addition to coloring the candlesticks based on the trend direction, the indicator also uses gray candles to highlight potential early trend shifts. For example, if the Gaussian Filter detects a downtrend but the price moves above the filter line, the candles turn gray, signaling a possible reversal or shift in momentum. Similarly, in an uptrend, if the price moves below the Gaussian Filter line, the candles turn gray as an early indication of potential bearish momentum. This visual cue helps traders stay alert to possible faster shifts in market direction, allowing for quicker decision-making.
🔵 CUSTOMIZATION
Length and Sigma for Gaussian Filter:
Adjust the length and sigma parameters to control how the Gaussian Filter smooths the price data. A longer length provides smoother trend lines, while adjusting sigma can fine-tune the level of smoothing applied.
Levels Display and Candle Coloring:
You can toggle the visibility of entry and exit levels as well as enable or disable the dynamic coloring of candlesticks based on the trend direction. The additional gray color setting provides an extra layer of information, allowing you to spot potential trend reversals early.
🔵 CONCLUSION
The Gaussian Filter indicator is a powerful tool for identifying and following market trends. By providing clear entry and exit signals, along with real-time tracking of price changes, it gives traders a structured way to manage trades and monitor performance. The color-coded candles, including gray to highlight possible trend shifts, add another dimension to visualizing market dynamics. The added flexibility of customizing colors and trend levels makes it a versatile indicator suitable for both trend-following and reversal strategies.

Professor Snipe: A superadaptive moving average. Prof. Snipe is a superadaptive, multi-purpose indicator I developed in order to judge market trend strength and show high probability entry points.
The indicator is focused around a zero lag moving average algorithm (SUPER-MA, ), that changes its parameters depending on the volatility (ATR) and trend strength (ADX).
If the price (black 3 period MA) is above the Super-MA, this indicates market momentum and strength. If price is below the Super-MA, price and momentum are showing weakness.
Micro-Signals are given based on smaller lag-free moving average crossovers (blue and red arrows), but entries will depend on the location of price, with respect to the super-MA.
Furthermore, to judge the current price position with respect to high timeframe averages, the algo will automatically show the location of the nearest moving averages for support and resistance.
/////////////////////////
Entry Conditions example.:
For Longs:
Wait until the 4 hour trend flips bullish, price above Super-MA. Once it does, it will often retest the Super-MA as support. When that happens, use the next entry signal to go long.
For further safety, check the safety net (dotted hull moving average) to see if price has broken above that too, for an optimal long.
-- use caution when entering longs if: price is floating around the super-ma (very weak trend) and if price is below super-ma.
For Shorts:
Wait until the 4 hour trend flips bearish, price below Super-MA. Once it does, use lower timeframes to find short entry points using the MA signals.
-- use caution when entering shorts if: price is floating around the super-ma (very weak trend) and if price is above super-ma.
DYOR and test it yourself to find what works for you.
BE AWARE!
Just following the entry and exit signals (arrows) will not give you perfect results.
Summary:
Overall, this is probably the best indicator I have ever created, and has a very high success rate when used properly.
Best,
MM
Ichimoku Signal GeneratorThis indicator uses the standard concepts of the Ichimoku Cloud. The indicator features a fully customisable set of Ichimoku lines: Tenkan Sen, Kijun Sen, Senkou Span A & B, Kumo, Chikou Span. Besides this the Indicator also features the ability to show and hide entry signals for various entry criteria for the Ichimoku indicator:
Signal 1 - Chikou crossing Kijun - The indicator will place an arrow in the direction of the trade that is suggested by this signal.
Signal 2 - Heikin Ashi Candle closing above the Kumo - This seems to filter out a lot of bad signal versus basing the signal on price closing above the Kumo alone.
Signal 3 - Price crossing the Kijun Sen in relation to the Kumo - This signal has received the most work - It generates a signal in the suggested direction of the particular condition being met i.e. price crosses below the Kijun indicates a sell and vice versa, but it also factors in where the cross happens in relation to the Kumo cloud. These signals can be switched on or off based on weak(longs below the cloud or shorts above the cloud), neutral (long or short when inside the cloud) or strong (long above the cloud or short below the cloud).
Examples of each of the different Signal 3 indicators can be seen in the screenshot. Pale/white signals are weak, yellow are neutral & green/red are strong.
Further features (only available on Signal 3 at present: entry, stop loss and take profit levels. These are determined based on the ATR periods setting and ATR Multiplier for Stop Loss - specifying an ATR period of 10 and multiplier of 2 will result in stop loss signal being shown as 2xATR(10) above or below the entry based on whether you are shown a long or short signal. For Take Profits you can specify a Risk:Reward multiplier. By default this is set to 2:1 (or 2). This takes the distance from the stop market to the entry and multiplies it by the multiplier and then indicates a signal where you "could" exit. For the risk averse trader that want some instant gratification when they hit 1:1, the indicator will show you exactly where 1:1 is. You can then follow whatever risk management strategy you wish to - personally I find this a point at which I breakeven my stop and take half the profits (now I can't lose!) :)
The indicator follows some basic Ichimoku trading rules - not all signals will result in a winning trade (this is NOT the holy grail and doesn't claim to be) - you should always follow you own risk management strategy. You should also couple this with additional analysis to try to qualify the entry signal i.e. "does this signal and direction correlate with what the higher timeframes are telling me?".
One last feature I added - mores for psychological reasons was to only show signals for the time window I would actually be trading. I hate seeing that I missed a signal when I wasn't online - and this doesn't set me up mentally for trading well. So if there was an opportunity when I would not be trading - it is matter under the bridge! It is gone and I don't want to see it as I would not have been there to take it. This trading window can be specified using the start and end times - the setting mentions EST - however you should relate them to the exchange time for the provider of the price feed - some providers may use a different timezone to others i.e. UTC vs EST.
Wish you the best of luck!
Please provide any constructive feedback as I would love to feature further enhancements to this indicator if it helps users.
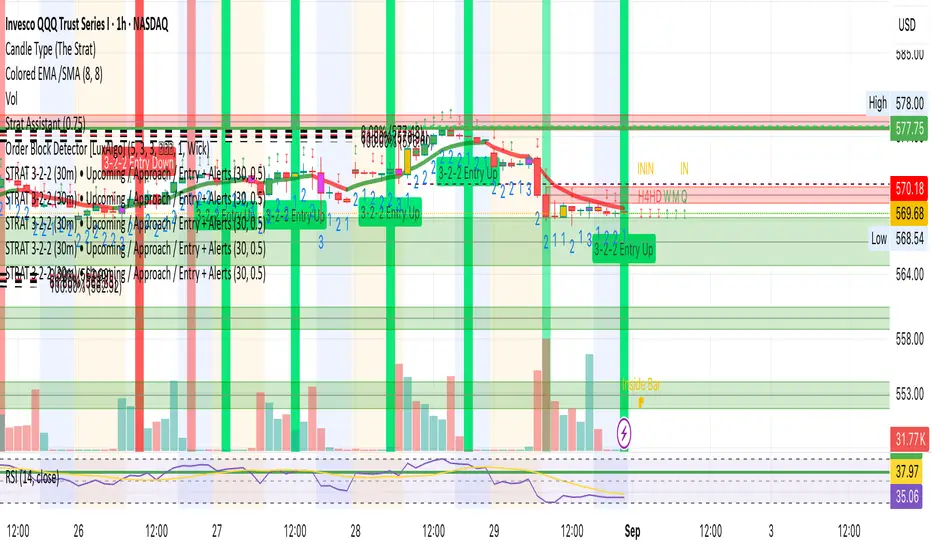
STRAT 3-2-2 (30m) • Upcoming / Approach / Entry + AlertsThis indicator is built for The STRAT trading method, specifically the 3-2-2 reversal pattern. It monitors price action on the 30-minute timeframe (HTF = 30m) and visually/alert-wise highlights where a 3-2-2 setup, approach, or entry trigger occurs.
---
⚙️ How it works
1. Detects bar types:
3 (Outside Bar) = range breaks both high & low of the previous bar
2u (Up bar) = higher high, not outside
2d (Down bar) = lower low, not outside
1 (Inside bar) = fully contained within prior bar
2. Looks for 3-2-2 setups:
Bullish 3-2-2 = 3 → 2d → 2u (expect reversal UP)
Bearish 3-2-2 = 3 → 2u → 2d (expect reversal DOWN)
3. Defines trigger levels:
Bullish trigger = high of the first “2d” bar
Bearish trigger = low of the first “2u” bar
4. Signals 3 phases:
Upcoming: pattern is forming, second “2” hasn’t triggered yet
Approach: price comes within 50% (adjustable) of the trigger level
Entry: price breaks the trigger (actual reversal confirmation)
5. Visualization:
Labels above/below candles show “Approach” and “Entry”
Background or bar colors (toggle in settings) highlight Setup / Approach / Entry
Optional dotted line marks the trigger level for clarity
---
🔔 Alerts
Two alert systems are built in:
1. Safe static conditions (for normal TradingView alert setup):
APPROACH: Bullish 3-2-2 (30m)
APPROACH: Bearish 3-2-2 (30m)
ENTRY: Bullish 3-2-2 (30m)
ENTRY: Bearish 3-2-2 (30m)
2. Dynamic messages (using alert() calls with price info):
If you create an alert with “Any alert() function call”, the pop-up will include the trigger price.
---
📋 Inputs (Settings)
Signal timeframe (HTF) → default 30m
Confirm signals at HTF bar close → waits for bar close (non-repainting)
Approach = % of first '2' bar range → default 50%
Show labels → On/Off
Color candles instead of background → toggle between candle color vs. chart background
Signalgo BBSignalgo BB: Technical Overview
Signalgo BB is a Bollinger Bands (BB) indicator for TradingView, designed to provide a multi-dimensional view of volatility, trend, and trading opportunities within a single overlay. Below is a detailed, impartial explanation of its workings, inputs, and trading logic.
Core Mechanics
Signalgo BB operates on the principle of nested volatility bands and moving averages. It calculates:
Fast & Slow Bands: Two sets of Bollinger Bands (BB), using different moving average types (EMA or SMA), lengths, and standard deviation multipliers.
Volatility Cloud: A dynamic visual layer indicating when price is inside both, one, or neither band.
Filtering: A short-term RSI is used to confirm trend direction and filter out weak signals.
Inputs & Components
MA Type: Choice between EMA, SMA for both fast and slow MA calculations.
Fast/Slow Lengths
Fast/Slow Deviations
RSI Length/Thresholds
Show Cloud: Toggle for the visual volatility cloud.
Signal Mode: Band Break.
Prevent Repeated Signals: Option to suppress duplicate signals in the same direction.
TP/SL & Trailing Logic: Advanced, automated trade management with ATR-based distances, three take-profit levels, and a dynamic trailing stop.
Signal Generation
Band Break: Triggers when price crosses the fast BB band.
RSI Filter: All signals require RSI confirmation.
Prevent Repeated Signals: Optionally only marks the first breakout in a series to reduce overtrading.
Entry/Exit Marks: Labels are plotted for visual clarity, and signals can trigger TradingView alerts.
Trade Management
Stop Loss (SL): Set at a multiple of ATR from the entry price, adapting to current volatility.
Take Profits (TP1, TP2, TP3): Three levels scaled by risk-reward ratios, supporting partial exits.
Trailing Stop: After the first TP is hit, SL moves to breakeven and then trails at a user-defined multiple of ATR, locking in further gains.
Event Markers: Each TP, SL, and trailing stop event is labeled on the chart.
Direction State: The indicator tracks active trades, allowing for only one open position per direction at a time.
Cloud Visualization: The background color changes depending on whether price is inside both, one, or no bands, making it easier to visualize market conditions.
Multiple Signal Logics: It doesn’t just look at breakouts, it includes cloud crossings, mean reversion, and a choice of how to combine them.
Rigorous Filtering: Signals require RSI trend confirmation, reducing false entries during weak phases.
Automated Trade Management: Built-in TP/SL and trailing logic, dynamically adapting to volatility.
Signal Suppression: Option to prevent repeated signals, reducing noise and overtrading.
Customizable MA Types: Supports EMA, SMA, and a selection algorithm for future expansion.
Trading Strategy Application
Volatility Regimes: The cloud’s color indicates whether price is inside, between, or outside the bands, helping traders identify trending, ranging, or breakout conditions.
Signals: entries can be based on breakouts filtered by RSI trend strength.
Risk Management: All active trades are managed by TP/SL logic, trailing stops after TP1, and visual feedback on exits.
Visual Alerts: Both signals and TP/SL events are marked on the chart for manual review.
Flexibility: Users can switch modes or suppress repeated signals as needed, depending on trading style.
Practical Usage
Intraday to Swing: Suitable for timeframes from minutes to days, depending on the MA periods and volatility profile.
Manual or Automated: The visual overlay and alerts support both manual trading and automated strategies.
Education & Review: The colored cloud and event markers make it easy to review past price action and learn from signals.
What separates this indicator from traditional ones:
1. Dual Bollinger Bands
Traditional: Most indicators use a single set of Bollinger Bands (two standard deviations above/below a moving average).
Signalgo BB: Implements two sets of bands—a "fast" set (shorter moving average, narrower deviation) and a "slow" set (longer moving average, wider deviation). This provides both immediate (fast) and broader context (slow) for volatility and price action.
2. Volatility Cloud Visualization
Traditional: Standard Bollinger Bands display as two lines, with the area between sometimes shaded as a "band" but without dynamic color changes.
Signalgo BB: The background is colored differently depending on whether price is within both, one, or neither band, offering a visual "cloud" that distinguishes trending, ranging, or breakout regimes at a glance.
3. RSI Filtering
Traditional: Many indicators either don’t filter signals, or if they do, it’s not always configurable.
Signalgo BB: Adds an optional RSI filter, requiring signals to be confirmed by short-term RSI overbought/oversold conditions. This reduces false signals in range-bound or low-trend environments.
4. Prevention of Repeated Signals
Traditional: Most indicators will keep firing signals as long as conditions are met, which can cause overtrading.
Signalgo BB: Offers a user-toggleable option to suppress repeated signals in the same direction until the opposite signal occurs. This reduces noise for discretionary traders.
5. Integrated Trade Management
Traditional: Manual or separate coding is required for stop-loss, take-profit, and trailing stop logic.
Signalgo BB: Builds in dynamic, ATR-based stop-loss; up to three take-profit levels and a trailing stop that activates after the first TP is hit. All levels are visually plotted on the chart, and events (TP/SL hits) are labeled, aiding strategy review and automation.
6. Event Labeling and Alerts
Traditional: Alerts may exist for entry/exit, but rarely for each TP/SL event.
Signalgo BB: Places labels for every entry, exit, and TP/SL event. It also provides TradingView alertconditions for each event, enabling automated notifications or integration with trading bots.
7. Directional State Tracking
Traditional: Indicators typically do not track the "state" of a trade (e.g., active long/short/flat) beyond simple signals.
Signalgo BB: Maintains persistent variables for entry price, SL, TP, trailing stop, and trade direction, ensuring only one active signal per direction. This prevents overlapping entries and mimics realistic trade management.
8. User Customization
Traditional: Default settings are often hardcoded, or customization is limited.
Signalgo BB: Offers extensive user inputs for MA type and TP/SL logic—making the tool adaptable to many strategies and timeframes.

Bollinger Bands Entry/Exit ThresholdsBollinger Bands Entry/Exit Thresholds
Author of enhancements: chuckaschultz
Inspired and adapted from the original 'Bollinger Bands Breakout Oscillator' by LuxAlgo
Overview
Pairs nicely with Contrarian 100 MA
The Bollinger Bands Entry/Exit Thresholds is a powerful momentum-based indicator designed to help traders identify potential entry and exit points in trending or breakout markets. By leveraging Bollinger Bands, this indicator quantifies price deviations from the bands to generate bullish and bearish momentum signals, displayed as an oscillator. It includes customizable entry and exit signals based on user-defined thresholds, with visual cues plotted either on the oscillator panel or directly on the price chart.
This indicator is ideal for traders looking to capture breakout opportunities or confirm trend strength, with flexible settings to adapt to various markets and trading styles.
How It Works
The Bollinger Bands Entry/Exit Thresholds calculates two key metrics:
Bullish Momentum (Bull): Measures the extent to which the price exceeds the upper Bollinger Band, expressed as a percentage (0–100).
Bearish Momentum (Bear): Measures the extent to which the price falls below the lower Bollinger Band, also expressed as a percentage (0–100).
The indicator generates:
Long Entry Signals: Triggered when the bearish momentum (bear) crosses below a user-defined Long Threshold (default: 40). This suggests weakening bearish pressure, potentially indicating a reversal or breakout to the upside.
Exit Signals: Triggered when the bullish momentum (bull) crosses below a user-defined Sell Threshold (default: 80), indicating a potential reduction in bullish momentum and a signal to exit long positions.
Signals are visualized as tiny colored dots:
Long Entry: Blue dots, plotted either at the bottom of the oscillator or below the price bar (depending on user settings).
Exit Signal: White dots, plotted either at the top of the oscillator or above the price bar.
Calculation Methodology
Bollinger Bands:
A user-defined Length (default: 14) is used to calculate an Exponential Moving Average (EMA) of the source price (default: close).
Standard deviation is computed over the same length, multiplied by a user-defined Multiplier (default: 1.0).
Upper Band = EMA + (Standard Deviation × Multiplier)
Lower Band = EMA - (Standard Deviation × Multiplier)
Bull and Bear Momentum:
For each bar in the lookback period (length), the indicator calculates:
Bullish Momentum: The sum of positive deviations of the price above the upper band, normalized by the total absolute deviation from the upper band, scaled to a 0–100 range.
Bearish Momentum: The sum of positive deviations of the price below the lower band, normalized by the total absolute deviation from the lower band, scaled to a 0–100 range.
Formula:
bull = (sum of max(price - upper, 0) / sum of abs(price - upper)) * 100
bear = (sum of max(lower - price, 0) / sum of abs(lower - price)) * 100
Signal Generation:
Long Entry: Triggered when bear crosses below the Long Threshold.
Exit: Triggered when bull crosses below the Sell Threshold.
Settings
Length: Lookback period for EMA and standard deviation (default: 14).
Multiplier: Multiplier for standard deviation to adjust Bollinger Band width (default: 1.0).
Source: Input price data (default: close).
Long Threshold: Bearish momentum level below which a long entry signal is generated (default: 40).
Sell Threshold: Bullish momentum level below which an exit signal is generated (default: 80).
Plot Signals on Main Chart: Option to display entry/exit signals on the price chart instead of the oscillator panel (default: false).
Style:
Bullish Color: Color for bullish momentum plot (default: #f23645).
Bearish Color: Color for bearish momentum plot (default: #089981).
Visual Features
Bull and Bear Plots: Displayed as colored lines with gradient fills for visual clarity.
Midline: Horizontal line at 50 for reference.
Threshold Lines: Dashed green line for Long Threshold and dashed red line for Sell Threshold.
Signal Dots:
Long Entry: Tiny blue dots (below price bar or at oscillator bottom).
Exit: Tiny white dots (above price bar or at oscillator top).
How to Use
Add to Chart: Apply the indicator to your TradingView chart.
Adjust Settings: Customize the Length, Multiplier, Long Threshold, and Sell Threshold to suit your trading strategy.
Interpret Signals:
Enter a long position when a blue dot appears, indicating bearish momentum dropping below the Long Threshold.
Exit the long position when a white dot appears, indicating bullish momentum dropping below the Sell Threshold.
Toggle Plot Location: Enable Plot Signals on Main Chart to display signals on the price chart for easier integration with price action analysis.
Combine with Other Tools: Use alongside other indicators (e.g., trendlines, support/resistance) to confirm signals.
Notes
This indicator is inspired by LuxAlgo’s Bollinger Bands Breakout Oscillator but has been enhanced with customizable entry/exit thresholds and signal plotting options.
Best used in conjunction with other technical analysis tools to filter false signals, especially in choppy or range-bound markets.
Adjust the Multiplier to make the Bollinger Bands wider or narrower, affecting the sensitivity of the momentum calculations.
Disclaimer
This indicator is provided for educational and informational purposes only.

Johnny's Moving Average RibbonProps to Madrid for creating the original script: Madrid Moving Average Ribbon.
All I did was upgrade it to pinescript v5 and added a few changes to the script.
Features and Functionality
Moving Average Types: The indicator offers a choice between exponential moving averages (EMAs) and simple moving averages (SMAs), allowing users to select the type that best fits their trading strategy.
Dynamic Color Coding: Each moving average line within the ribbon changes color based on its direction and position relative to a reference moving average, providing visual cues for market sentiment and trend strength.
Lime Green: Indicates an uptrend and potential long positions, shown when a moving average is rising and above the longer-term reference MA.
Maroon: Suggests caution for long positions or potential short reentry points, displayed when a moving average is rising but below the reference MA.
Ruby Red: Represents a downtrend, suitable for short positions, shown when a moving average is falling and below the reference MA.
Green: Signals potential reentry points for downtrends or warnings for uptrend reversals, displayed when a moving average is falling but above the reference MA.
Usage and Application
Trend Identification: Traders can quickly ascertain the market's direction at a glance by observing the predominant color of the ribbon and its orientation.
Trade Entry and Exit Points: The color transitions within the ribbon can signal potential entry or exit points, with changes from green to lime or red to maroon indicating shifts in market momentum.
Customization: Users have the flexibility to toggle between exponential and simple moving averages, allowing for a tailored analytical approach that aligns with their individual trading preferences.
Technical Specifications
The ribbon consists of multiple moving averages calculated over different periods, typically ranging from shorter to longer-term intervals to capture various aspects of market behavior.
The color dynamics are determined by comparing each moving average to a reference point, often a longer-term moving average within the ribbon, to assess the relative trend strength and direction.

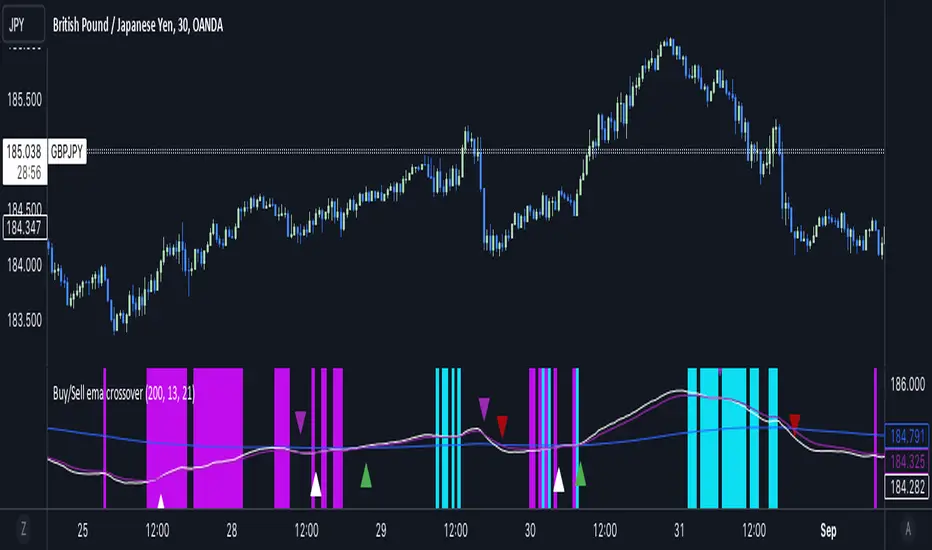
Buy/Sell EMA CrossoverThe indicator identifies potential trading opportunities within the market. It is entirely based on the combination of exponential moving averages by drawing triangles on the chart that identify buy or sell signals combined with vertical bars that create areas of interest.
Specifically, when a buy signal occurs, the indicator draws a vertical bar with an azure background, indicating a possible buy area. Similarly, a sell signal is represented by a vertical bar with a fuchsia background, indicating a possible sell area.
These areas represent the main point of the indicator which uses exponential moving averages which, based on the direction of prices, identify the trend and color the background of the graph in order to visually highlight the predominant trend.
The green triangles above the bars of the chart suggest possible upside opportunities (good bullish entry points) when the 21 ema crosses the 200 ema.
While on the contrary the red triangles, 21 ema lower than the 200 ema, can indicate possible bearish trends (good bearish entry points).
While the white and purple triangles reveal moments of potential indecision or market change.
We can think of them as situations of uncertain trend in which it is possible to place a long or short order near some conditions that we are going to see.
The white triangles below, which are created when the 13 ema is higher than the 21 ema, indicate a possible bullish zone while the purple triangles above (13 ema lower than the 21) could suggest a bearish reflex
Colored lines represent moving averages blue = 200, 21= fuchsia and 13 = white. If the price is above the 200 period line then it could be a bullish opportunity, otherwise it could be a bearish one.
An interesting strategy to adopt is to evaluate, for example, the inputs near the vertical bars (azure - long) (fuchsia - short) when a white or purple triangle appears.
The more prominent green triangle indicates that the trend is going in a long direction.
On the contrary, the red (short) triangles are the opposite of the green ones and have the same importance as input logic.
The white triangle instead present more often inside the indicator identifies interesting buying areas of short duration, it is important to consider that the closer the triangles are to the vertical blue bars the stronger the entry signal.
Finally, the purple triangles are the short-term bearish trends whose entry near the fuchsia vertical bars defines a short.
[volfgang] WAVE ScannerThe Wave Scanner helps you make more informed decisions about when to buy and sell.
This indicator operates on a series of inputs and global variable declarations. Based on the same parameters as the WAVE Indicator. It uses different parameters such as the closing price, Stochastic Momentum Index, and smoothing factors such as the EMA to calculate the potential trade signals.
The scanner allows you to adjust the thresholds for bullish and bearish counts, which can be tailored to your personal trading strategy.
The minimum value is 4 and maximum is 8.
In total you can use 8 different timeframes for your signals from the following;
3D
1D
12h
8h
4h
1h
15m
5m
The scanner's unique ability to scan across multiple timeframes is what makes this indicator unique. This multi timeframe analysis can be incredibly useful for identifying broader trends in the market.
The Wave Scanner settings also includes inputs for you to enter risk management settings, including your total capital and the risk percentage you are willing to take per trade. It uses this information to display data in a label on the chart including;
Position Size
Stop Loss Level
Potential Profit
Risk Reward Ratio
On your chart, the WAVE Scanner will plot the ideal Entry Levels, Stop Loss and Take Profit Levels by calculating Fibonacci Levels, which is a popular tool for identifying potential support and resistance levels.
These are marked as follows;
GREEN Lines: Entry Levels
PINK Line: Stop Loss (can be customized in the settings)
GREY Line: Breakeven Level (move SL to breakeven at this level)
BLUE Line: Take Profit Level
So, if you're a trader looking to level up your strategy, the Wave Scanner is a tool you won't want to miss out on.
Risk:RewardThis Indicator displays Entry and Exits levels. The display is done under 3 modes:
- Risk/Reward mode (the one by default. It is set to a 1:1 ratio)
- Multiples TP Levels
- Custom Levels
Click to Set entry Price on chart
The displaying is static by default
to make it dynamic disable the "Use custom Entry ?" input.
Disclaimer: Scripts that I post publicly are experimental. They are not financial advices. Always backtest your ideas using your own methodologies.

Buy and Sell with Master_in_chart-ind. [V1]This script indicates the Buy and Sell positions on your chart. In addition, it shows entry price , stop loss and possible targets on the chart. The same information are shown in a table where you can find the position type (long/short) in green and red color, entry point, stop-loss (always in red) and targets.
The targets are defined by Risk to Reward ratios 1:1, 1:1.5 and 1:2.
the labels appears when the all conditions are satisfied.
Interesting part of the script is the alert function. Here one can set the script for different
securities and activate alert in TV.
In summary, one can change and tune the setting of the indicator easily by clicking on the gear icon. In the setting, there are four sections. First section sets the slop-loss. Second section activates and shows the super trend indicator. Third section is designed to tune the signals. Finally, you can apply the script on five different symbols at different time-frames. Here you can set alarm to alert you the signals.
I hope you enjoy it!
Gain/StopLoss Percentage LinesGain/StopLoss Percentage Lines is a quick way to enter your Entry Price in to a stock and track the percentage of gain or loss at the 5% and 10% markers.
Click on the gear settings icon and type in your entry price. The percentage is defaulted to 5%. You can change this to a different percentage at this screen. Note that whatever number you enter will be doubled for the upper and lower lines. For instance, if you want to set your first red line stop loss and green gain line at 2.5%, your two other upper and lower green and red lines will be at 5%.
However, this will not change the text on the tab marker.
To change the tab text, go in to the Pine Editor and change the green text that says "5% Gain" and "5% Loss" to your new percentages.

Relative Volume Screener AlertsThis script will screen 12 different stocks and current chart (13 in total) for entry points from my relative volume indicator.
1. Enter in any ticker ID's from charts you wish to scan in the settings.
2. Go to desired timeframe.
3. Click add alert button at top toolbar.
4. Select RVOL Screener Alerts indicator, input alert notification settings and/or change alert name and click create.
The script will then scan the stocks and alert you of any entry points from the timeframe you set the alerts.
A new alert needs to be created for each timeframe you wish to screen.
You can find my relative volume indicator here:

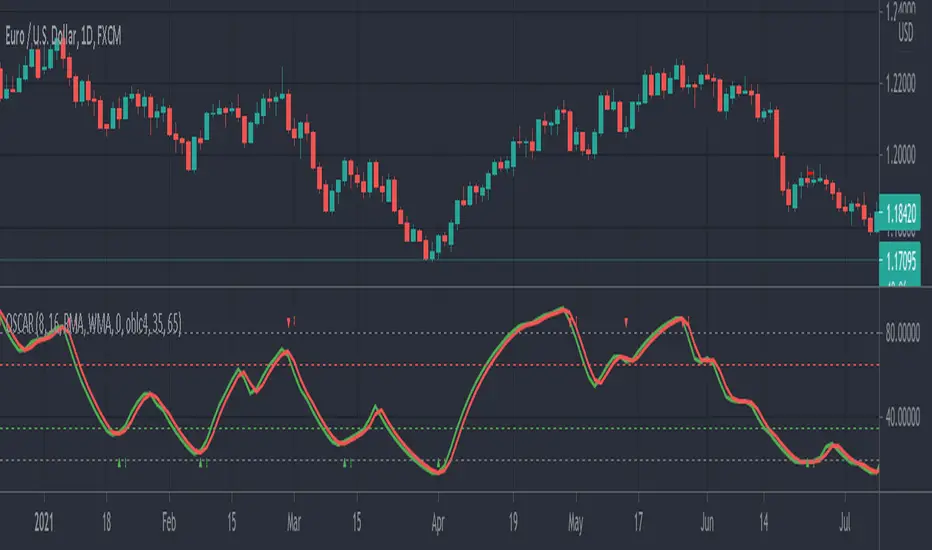
OSCAR Oscillator by GenZai - NNFXOSCAR Oscillator by GenZai
Green line is the Oscar Rough
Red line is the Oscar
By default based on the 8 last candles and smoothed using RMA
Purple line is the Slow Oscar
By default based on the 16 last candles and smoothed using WMA
HOW TO USE
Exit signaling
This indicator can be used as an exit indicator when line cross each other.
Entry signaling
When the green line crosses up, it indicates a long entry
When the red line crosses up, it indicates a short entry
Overbought/Oversold
When the indicator crosses the dashed grey lines it indicates Overbought Oversold
Slow Oscar Add-on
This is an Add-on to the orignal Oscar indicator
Can be hidden if you want the original experience of the Oscar indicator.
Can be used as a confirmation indicator by looking at the direction of the slope to verify is your are trending long or trending short.
Can be used as a baseline to confirm signals given by Oscar
Can be used to tweak your signals and test different settings.
Stock or Forex?
The program was originally written for stocks, but works equally well with the Forex market.
How this indicator is calculated ?
This is the formula we use to calculate the Oscar:
let A = the highest high of the last eight days (including today)
let B = the lowest low of the past eight days (including today)
let C = today's closing price
let X = yesterday's oscillator figure (Oscar)
Today's "rough" oscillator equals (C-B) divided by (A-B) times 100.
Next we "smooth" our rough number (let's call it Y) like this:
Final oscillator number = ((X divided by 3) times 2), plus (Y divided by 3).
SETTINGS:
You can choose between different smoothing options:
RMA: Moving average used in RSI. It is the Adjusted exponential moving averages (also known as Wilder's exponential moving average)
SMA : Simple moving average
EMA : Exponential moving average
WMA : Weighted moving average
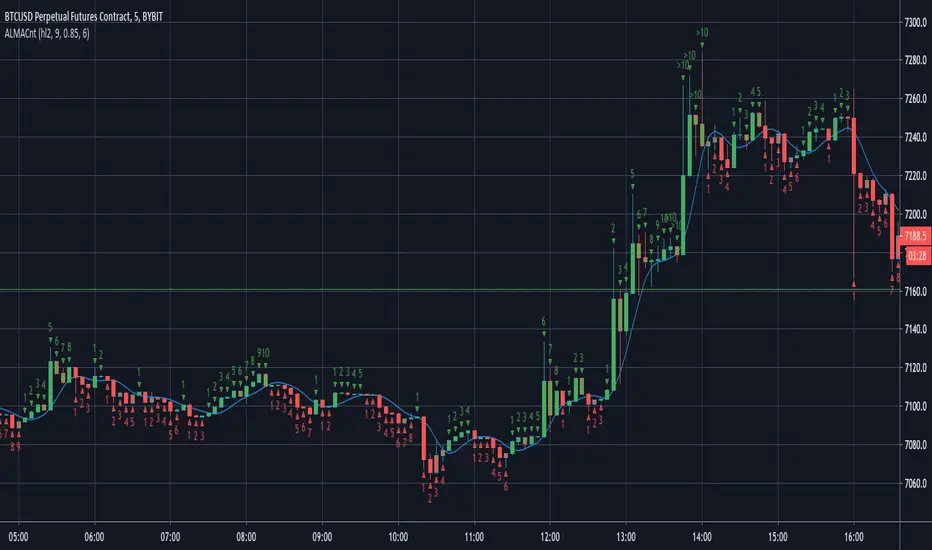
ALMA CounterIt counts how many candles are below or above the Arnaud Legoux Moving Average (ALMA).
It may be useful to found good entry points.
SECRET EESSecret EES is a Pivot Based indicator that shows Entry Price, Target Price, and Stoploss.
This is not exact Pivot Points or CPR. These ranges are corrected for better accuracy and better results.
The chart is divided into Three Zones - No trade Zone, Long Zone, and Short Zone.
Each line indicates the Entry, Exit, and Stoploss for at least one of the zones.
Works Good in Equity.
It also works on Index Charts.
Recommended time frame 15 mins.
Only for Intraday Trading.
THIS IS NOT REGULAR PIVOT POINTS. PLEASE USE CAREFULLY.

™TradeChartist Rubicon™TradeChartist Rubicon is a beautifully designed functional indicator that helps traders enter and exit Long or Short trades with ease.
This indicator is aptly named Rubicon as it studies the candles in the River of Rubicon (Flat Blue River that never stops flowing up and down the chart) through the Lands of Rubicon to find out which army ( Bulls or Bears ) is committing itself to crossing the River and its tides. By doing this for every price candle, the indicator generates BUY and SELL signals along with Targets and real-time Gains on the chart.
What does the ™TradeChartist Rubicon Indicator do?
Plots very high probability BUY and SELL signals on chart
-- Real-time signals are plotted in Orange labels. (Note: Real-time signals repaint. So wait for confirmation before taking a trade position. This feature is included based on feedback from a few traders as some of them like to see a potential direction based on developing candle, its RSI, Stochastic etc.)
-- Confirmed signals are plotted in Green labels for BUY and Red labels for SELL. These signals don't repaint and can be used confidently to enter or exit a trade.
-- Option to choose type of trade opportunity from indicator settings namely - Long trades, Short trades or both, based on which the chart background colour will be green for duration of long trades or red for duration of short trades.
-- Intermediate signals are also plotted between the primary BUY and SELL signals which can be used for re-entry, scalping etc if the opportunity to enter trade at Primary signal was missed. These secondary signals marked as B and S with arrows can be deactivated from indicator settings.
Plots Target levels as soon as BUY or SELL signal is confirmed on chart.
-- These levels can be used as support and resistance levels too.
-- The first 3 TP levels can be used as a litmus test to trade higher levels as the likelihood of price hitting higher profit levels significantly increase when price crosses the first 3 smaller levels.
-- The performance of the current signal can be tracked by using the Show Gains from Primary Signal and the past signals can be accessed by checking Show Past Performance option from Indicator Settings.
Plots % Gains based on candle close in real-time and Max % Gains based on highest since the BUY signal or lowest since the SELL signal. The entry price is normally plotted along with the signals and is an indicative price based on breached resistance. Traders may choose to buy at Market Price or Limit Price based on the price movement at the time of signal generation.
Plots Bulls/Bears waiting price points for chart time-frame if activated from settings. (Default - Not Active)
Automatically plots Bull and Bear power labels along with visually painting the Bull or Bear power on the Lands of Rubicon.
Plots RSI colour candles based on user preferred Overbought and Oversold RSI levels from indicator settings. (Default - 60 Overbought and 30 Oversold)
What markets can this indicator be used on?
Forex
Stocks - works best with 4hr or above and prices calculated taking gaps into account.
Commodities
Cryptocurrencies
and almost any asset on Trading View
Works really well when there is good volume , volatility or both in the asset observed/traded.
What time-frames can this indicator be used on?
This indicator can be used on 1m, 3m, 5m, 10m, 15m, 30m, 1hr, 2hr, 3hr, 4hr, 6hr, 8hr, 12hr, Daily, Weekly, Bi-Weekly and Monthly time-frames. Signal generation based on value, volume and volatility. If an asset has very little volume or is far low in comparative value against the base currency, there can be far too many erratic signals but with most assets, this won't be an issue.
Does this indicator repaint?
No and Yes
-- Once the confirmed BUY (in green) and SELL (in red) signals are posted after a candle close, it doesn't repaint.
-- Repainting happens for real time Orange label BUY and SELL signal on the current candle. Some traders prefer to see the developing signal and trade using RSI, Stochastic etc.
Does the indicator send alerts when a signal is generated?
Yes, traders can get alerts by setting Trading View alerts for BUY/SELL Signals and when a new Profit Target is achieved. For confirmed BUY/SELL alerts, 'Once per bar close' must be used.
Real-time BUY and SELL trigger alerts can also be set using 'Once per bar' or 'Once per minute' as alert frequency.
Some Examples of trades using ™TradeChartist Rubicon indicator
GOLD short trade and Long trade scalping on 15m
GOLD on Daily
SUGAR-USD on 15m
AUD-USD on 5m
LEND-BTC alt pair on Daily
-----------------------------------------------------------------------------------------
This is not a free to use indicator. Get in touch with me if you would like access to the indicator for a free trial before deciding on a paid access for a period of your choice.
-----------------------------------------------------------------------------------------
