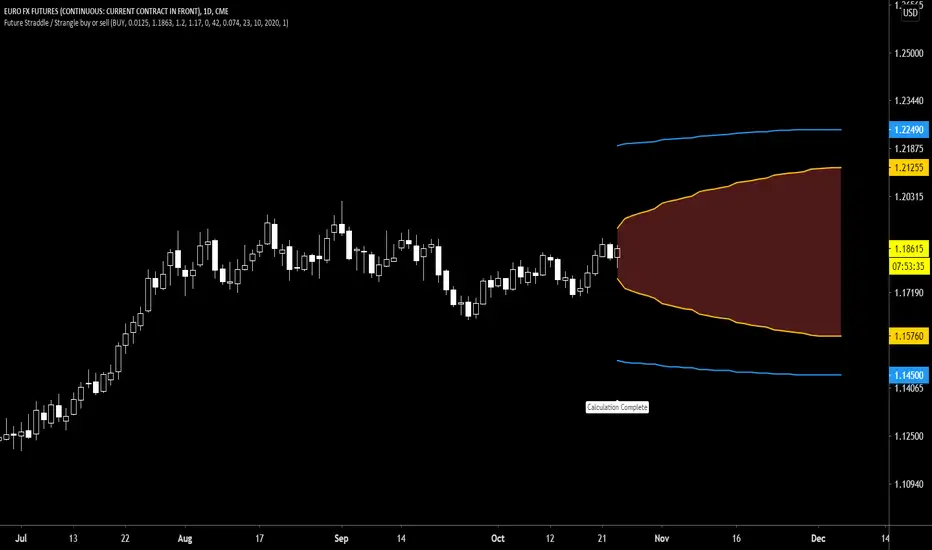
Future Straddle / Strangle buy or sell indicatorFuture Straddle / strangle buy or sell indicator developed by Chobotaru Brothers.
You need to have basic knowledge in option trading to use this indicator!
The indicator shows P&L lines of the options strategy. Use only for futures since the mathematical model of options for Future instruments is different from stocks. Plus, the days' representation in futures is also different from stocks (stocks have fewer days than futures ).
***Each strategy in options is based on different mathematical equations, use this indicator only for the strategy in the headline.***
What does the indicator do?
The indicator is based on the Black-Scholes model, which uses partial differential equations to determine the option pricing. Due to options non-linear behavior, it is hard to visualize the option price. The indicator calculates the solutions of the Black-Scholes equation and plots them on the chart so traders can view how the option pricing will behave.
How the indicator does it?
The indicator uses five values (four dominants and one less dominant) to solve the Black-Scholes equation. The values are stock price, the strike price of the option, time to expiration, risk-free interest rate, and implied volatility .
How the indicator help the users?
-View the risks and rewards so you can know the profit targets in advance which means you can compare different options in different strikes.
-View the volatility change impact so you can know the risk and the P&L changes in case of a change in the volatility over the life of the option before you enter the trade.
-View the passage of time impact so you can know where and when you could realize a profit.
-Multi-timeframes so you can stay on the same chart (Daily and below).
All these features are to help the user improve his analysis while trading options.
How to use it?
The user needs to obtain from the “option chain” the following inputs:
-Buy or sell (the strategy)
- Straddle/strangle price bought/sold: enter the price that you bought/sold one options strategy.
-Instrument price when bought/sold: the stock price when you bought/sold the options strategy.
-Upper strike price: the upper strike price of the options strategy.
-Lower strike price: the lower strike price of the options strategy.
-Interest rate: find the risk-free interest rate from the U.S. DEPARTMENT OF THE TREASURY. Example: for 2% interest rate, input: 0.02.
-Days to expire: how many days until the option expires.
-Volatility: the implied volatility of the option bought/sold. Example: for 45% implied volatility , input: 0.45.
-Day of entry: A calendar day of the month that the option bought/sold.
-Month of entry: Calendar month the option bought/sold.
-Year of entry: Calendar year the option bought/sold.
-Risk to reward: Profit/loss line defined by the user. Minimum input (-0.95) ; maximum input (3).
Example: If the strategy was bought, -0.95 means, 95% of the options strategy value is lost (unrealized). If the strategy was bought, 3 means, the risk to reward is 3.
After entering all the inputs, press Ok and you should see “Calculation Complete” on the chart.
The user should not change the entry date and days to expire inputs as time passes after he entered the trade.
How to access the indicator?
Use the link below to obtain access to the indicator
Pesquisar nos scripts por "entry"
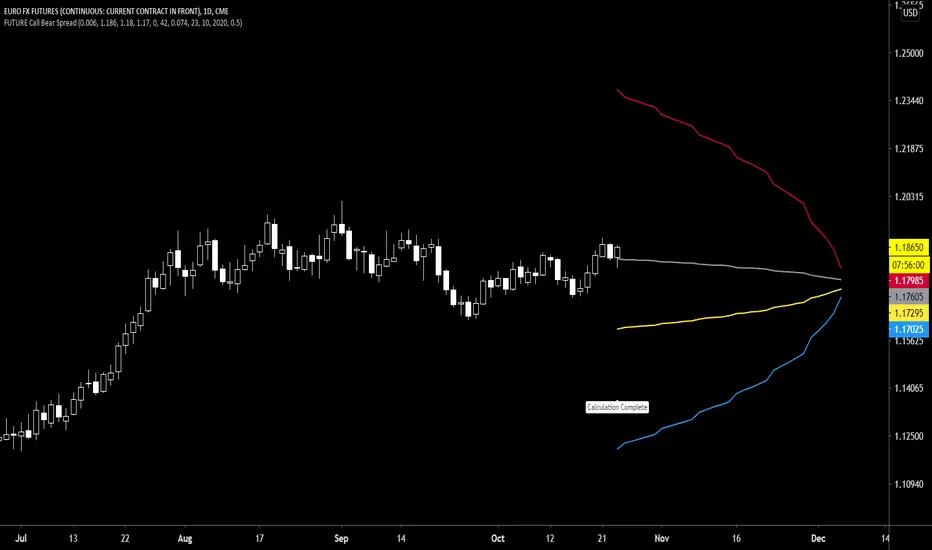
Future Call Bear Spread indicatorFuture Call bear spread indicator developed by Chobotaru Brothers.
You need to have basic knowledge in option trading to use this indicator!
This spread is a CREDIT SPREAD.
The indicator shows P&L lines of the options strategy. Use only for futures since the mathematical model of options for Future instruments is different from stocks. Plus, the days' representation in futures is also different from stocks (stocks have fewer days than futures ).
***Each strategy in options is based on different mathematical equations, use this indicator only for the strategy in the headline.***
What does the indicator do?
The indicator is based on the Black-Scholes model, which uses partial differential equations to determine the option pricing. Due to options non-linear behavior, it is hard to visualize the option price. The indicator calculates the solutions of the Black-Scholes equation and plots them on the chart so traders can view how the option pricing will behave.
How the indicator does it?
The indicator uses five values (four dominants and one less dominant) to solve the Black-Scholes equation. The values are stock price, the strike price of the option, time to expiration, risk-free interest rate, and implied volatility .
How the indicator help the users?
-View the risks and rewards so you can know the profit targets in advance which means you can compare different options in different strikes.
-View the volatility change impact so you can know the risk and the P&L changes in case of a change in the volatility over the life of the option before you enter the trade.
-View the passage of time impact so you can know where and when you could realize a profit.
-Multi-timeframes so you can stay on the same chart (Daily and below).
All these features are to help the user improve his analysis while trading options.
How to use it?
The user needs to obtain from the “option chain” the following inputs:
- Call spread price (Credit): The credit received for one unit of options strategy.
-Instrument price when entered spread: the stock price when you enter the options strategy.
-Upper strike price: the upper strike price of the options strategy.
-Lower strike price: the lower strike price of the options strategy.
-Interest rate: find the risk-free interest rate from the U.S. DEPARTMENT OF THE TREASURY. Example: for 2% interest rate, input: 0.02.
-Days to expire: how many days until the option expires.
-Volatility: the implied volatility of the option bought/sold. Example: for 45% implied volatility , input: 0.45.
-Day of entry: A calendar day of the month that the option bought/sold.
-Month of entry: Calendar month the option bought/sold.
-Year of entry: Calendar year the option bought/sold.
-% of Max Profit/Loss: Profit/loss line defined by the user. Minimum input (-0.95) ; maximum input (0.95).
Example: In this spread, -0.95 means, 95% of the options strategy maximum loss is reached and, 0.95 means, 95% of the options strategy maximum profit is reached.
After entering all the inputs, press Ok and you should see “Calculation Complete” on the chart.
The user should not change the entry date and days to expire inputs as time passes after he entered the trade.
How to access the indicator?
Use the link below to obtain access to the indicator
Future Call bull spread indicatorFuture Call bull spread indicator developed by Chobotaru Brothers.
You need to have basic knowledge in option trading to use this indicator!
This spread is a DEBIT SPREAD.
The indicator shows P&L lines of the options strategy. Use only for futures since the mathematical model of options for Future instruments is different from stocks. Plus, the days' representation in futures is also different from stocks (stocks have fewer days than futures ).
***Each strategy in options is based on different mathematical equations, use this indicator only for the strategy in the headline.***
What does the indicator do?
The indicator is based on the Black-Scholes model, which uses partial differential equations to determine the option pricing. Due to options non-linear behavior, it is hard to visualize the option price. The indicator calculates the solutions of the Black-Scholes equation and plots them on the chart so traders can view how the option pricing will behave.
How the indicator does it?
The indicator uses five values (four dominants and one less dominant) to solve the Black-Scholes equation. The values are stock price, the strike price of the option, time to expiration, risk-free interest rate, and implied volatility .
How the indicator help the users?
-View the risks and rewards so you can know the profit targets in advance which means you can compare different options in different strikes.
-View the volatility change impact so you can know the risk and the P&L changes in case of a change in the volatility over the life of the option before you enter the trade.
-View the passage of time impact so you can know where and when you could realize a profit.
-Multi-timeframes so you can stay on the same chart (Daily and below).
All these features are to help the user improve his analysis while trading options.
How to use it?
The user needs to obtain from the “option chain” the following inputs:
- Call spread price (Debit): The debit paid for one unit of options strategy.
-Instrument price when entered spread: the stock price when you enter the options strategy.
-Upper strike price: the upper strike price of the options strategy.
-Lower strike price: the lower strike price of the options strategy.
-Interest rate: find the risk-free interest rate from the U.S. DEPARTMENT OF THE TREASURY. Example: for 2% interest rate, input: 0.02.
-Days to expire: how many days until the option expires.
-Volatility: the implied volatility of the option bought/sold. Example: for 45% implied volatility , input: 0.45.
-Day of entry: A calendar day of the month that the option bought/sold.
-Month of entry: Calendar month the option bought/sold.
-Year of entry: Calendar year the option bought/sold.
-% of Max Profit/Loss: Profit/loss line defined by the user. Minimum input (-0.95) ; maximum input (0.95).
Example: In this spread, -0.95 means, 95% of the options strategy maximum loss is reached and, 0.95 means, 95% of the options strategy maximum profit is reached.
After entering all the inputs, press Ok and you should see “Calculation Complete” on the chart.
The user should not change the entry date and days to expire inputs as time passes after he entered the trade.
How to access the indicator?
Use the link below to obtain access to the indicator

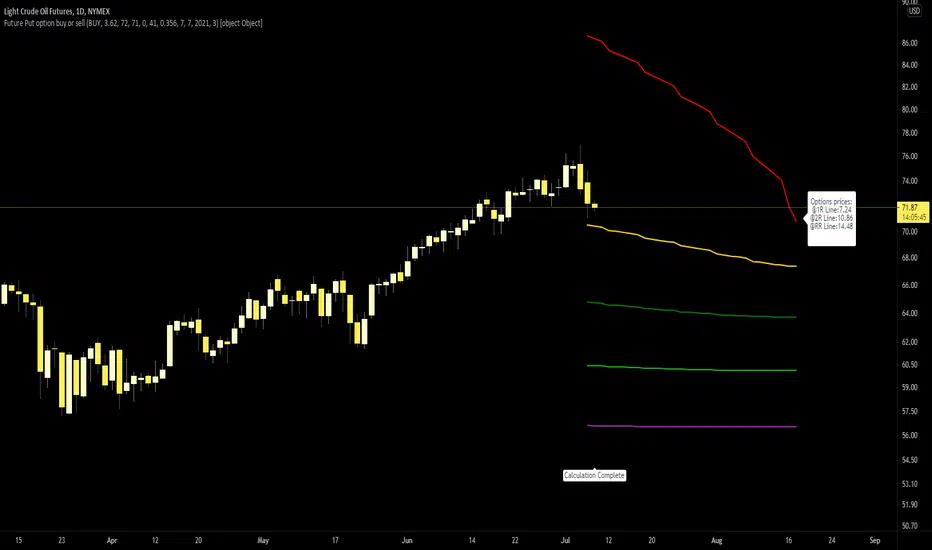
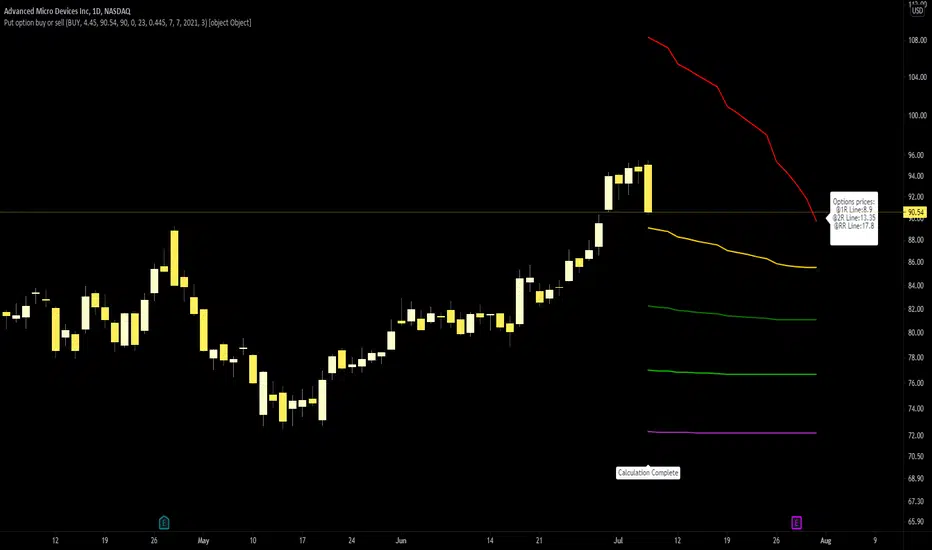
Future Put option buy or sell indicatorFuture Put option indicator developed by Chobotaru Brothers.
You need to have basic knowledge in option trading to use this indicator!
The indicator shows P&L lines of the options strategy. Use only for futures since the mathematical model of options for Future instruments is different from stocks. Plus, the days' representation in futures is also different from stocks (stocks have fewer days than futures ).
***Each strategy in options is based on different mathematical equations, use this indicator only for the strategy in the headline.***
What does the indicator do?
The indicator is based on the Black-Scholes model, which uses partial differential equations to determine the option pricing. Due to options non-linear behavior, it is hard to visualize the option price. The indicator calculates the solutions of the Black-Scholes equation and plots them on the chart so traders can view how the option pricing will behave.
How the indicator does it?
The indicator uses five values (four dominants and one less dominant) to solve the Black-Scholes equation. The values are stock price, the strike price of the option, time to expiration, risk-free interest rate, and implied volatility .
How the indicator help the users?
-View the risks and rewards so you can know the profit targets in advance which means you can compare different options in different strikes.
-View the volatility change impact so you can know the risk and the P&L changes in case of a change in the volatility over the life of the option before you enter the trade.
-View the passage of time impact so you can know where and when you could realize a profit.
-Multi-timeframes so you can stay on the same chart (Daily and below).
All these features are to help the user improve his analysis while trading options.
How to use it?
The user needs to obtain from the “option chain” the following inputs:
-Buy or sell (the strategy)
-The option price bought: at what price did you bought/sold one option.
-Instrument price when bought: the stock price when you bought/sold the option.
-Strike price: the strike price of the option.
-Interest rate: find the risk-free interest rate from the U.S. DEPARTMENT OF THE TREASURY. Example: for 2% interest rate, input: 0.02.
-Days to expire: how many days until the option expires.
-Volatility: the implied volatility of the option bought/sold. Example: for 45% implied volatility , input: 0.45.
-Day of entry: A calendar day of the month that the option bought/sold.
-Month of entry: Calendar month the option bought/sold.
-Year of entry: Calendar year the option bought/sold.
-Risk to reward: Profit/loss line defined by the user. Minimum input (-0.95) ; maximum input (3).
Example: If an option was bought, -0.95 means, 95% of the option value is lost (unrealized). If an option was bought, 3 means, the risk to reward is 3.
After entering all the inputs, press Ok and you should see “Calculation Complete” on the chart.
The user should not change the entry date and days to expire inputs as time passes after he entered the trade.
How to access the indicator?
Use the link below to obtain access to the indicator
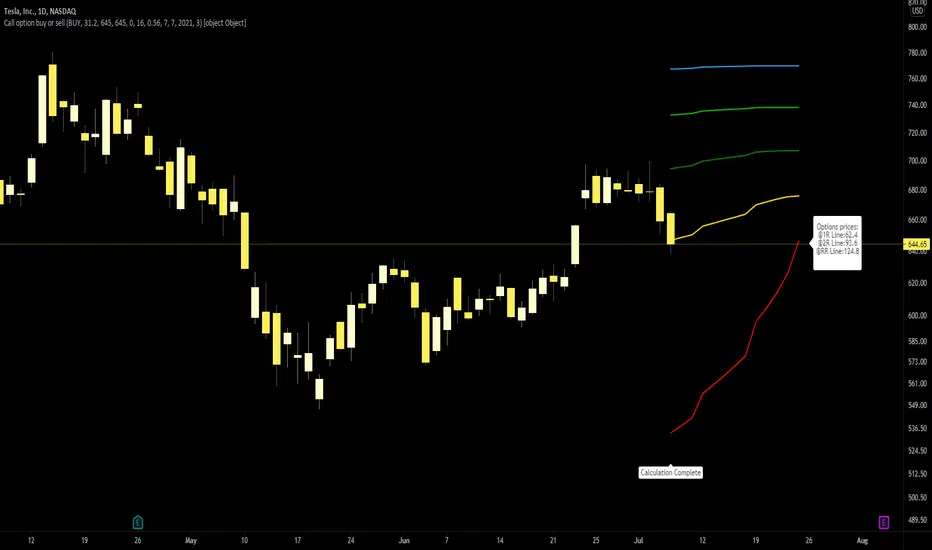
Future Call option buy or sell indicatorFuture Call option indicator developed by Chobotaru Brothers.
You need to have basic knowledge in option trading to use this indicator!
The indicator shows P&L lines of the options strategy. Use only for futures since the mathematical model of options for Future instruments is different from stocks. Plus, the days' representation in futures is also different from stocks (stocks have fewer days than futures ).
***Each strategy in options is based on different mathematical equations, use this indicator only for the strategy in the headline.***
What does the indicator do?
The indicator is based on the Black-Scholes model, which uses partial differential equations to determine the option pricing. Due to options non-linear behavior, it is hard to visualize the option price. The indicator calculates the solutions of the Black-Scholes equation and plots them on the chart so traders can view how the option pricing will behave.
How the indicator does it?
The indicator uses five values (four dominants and one less dominant) to solve the Black-Scholes equation. The values are stock price, the strike price of the option, time to expiration, risk-free interest rate, and implied volatility .
How the indicator help the users?
-View the risks and rewards so you can know the profit targets in advance which means you can compare different options in different strikes.
-View the volatility change impact so you can know the risk and the P&L changes in case of a change in the volatility over the life of the option before you enter the trade.
-View the passage of time impact so you can know where and when you could realize a profit.
-Multi-timeframes so you can stay on the same chart (Daily and below).
All these features are to help the user improve his analysis while trading options.
How to use it?
The user needs to obtain from the “option chain” the following inputs:
-Buy or sell (the strategy)
-The option price bought: at what price did you bought/sold one option.
-Instrument price when bought: the stock price when you bought/sold the option.
-Strike price: the strike price of the option.
-Interest rate: find the risk-free interest rate from the U.S. DEPARTMENT OF THE TREASURY. Example: for 2% interest rate, input: 0.02.
-Days to expire: how many days until the option expires.
-Volatility: the implied volatility of the option bought/sold. Example: for 45% implied volatility , input: 0.45.
-Day of entry: A calendar day of the month that the option bought/sold.
-Month of entry: Calendar month the option bought/sold.
-Year of entry: Calendar year the option bought/sold.
-Risk to reward: Profit/loss line defined by the user. Minimum input (-0.95) ; maximum input (3).
Example: If an option was bought, -0.95 means, 95% of the option value is lost (unrealized). If an option was bought, 3 means, the risk to reward is 3.
After entering all the inputs, press Ok and you should see “Calculation Complete” on the chart.
The user should not change the entry date and days to expire inputs as time passes after he entered the trade.
How to access the indicator?
Use the link below to obtain access to the indicator

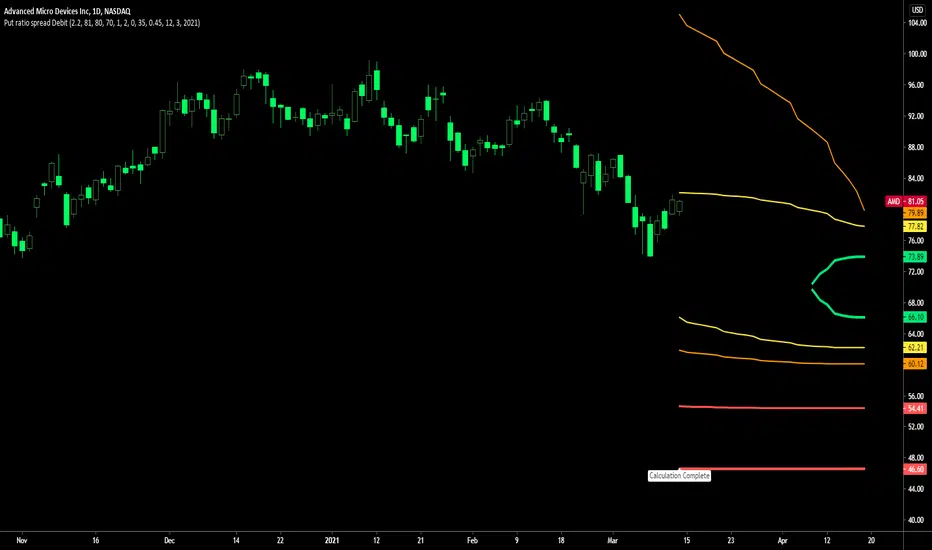
Put ratio spread Debit indicatorPut ratio spread debit indicator developed by Chobotaru Brothers.
You need to have basic knowledge in option trading to use this indicator!
This spread is a DEBIT SPREAD.
The indicator shows P&L lines of the options strategy. Use only for stocks since the mathematical model of options for Future instruments is different from stocks. Plus, the days' representation in futures is also different from stocks (stocks have fewer days than futures ).
***Each strategy in options is based on different mathematical equations, use this indicator only for the strategy in the headline.***
What does the indicator do?
The indicator is based on the Black-Scholes model, which uses partial differential equations to determine the option pricing. Due to options non-linear behavior, it is hard to visualize the option price. The indicator calculates the solutions of the Black-Scholes equation and plots them on the chart so traders can view how the option pricing will behave.
How the indicator does it?
The indicator uses five values (four dominants and one less dominant) to solve the Black-Scholes equation. The values are stock price, the strike price of the option, time to expiration, risk-free interest rate, and implied volatility .
How the indicator help the users?
-View the risks and rewards so you can know the profit targets in advance which means you can compare different options in different strikes.
-View the volatility change impact so you can know the risk and the P&L changes in case of a change in the volatility over the life of the option before you enter the trade.
-View the passage of time impact so you can know where and when you could realize a profit.
-Multi-timeframes so you can stay on the same chart (Daily and below).
All these features are to help the user improve his analysis while trading options.
How to use it?
The user needs to obtain from the “option chain” the following inputs:
-Debit paid: The debit paid for one unit of options strategy. Minimum value: 0. 01 .
-Instrument price when entered spread: the stock price when you enter the options strategy.
-Upper strike price: the upper strike price of the options strategy.
-Lower strike price: the lower strike price of the options strategy.
- Upper Strike numbers of puts . This number has to be less than the number of puts that were sold.
- Lower Strike number of puts . This number has to be greater than the number of puts that were bought.
-Interest rate: find the risk-free interest rate from the U.S. DEPARTMENT OF THE TREASURY. Example: for 2% interest rate, input: 0.02.
-Days to expire: how many days until the option expires.
-Volatility: the implied volatility of the option bought/sold. Example: for 45% implied volatility , input: 0.45.
-Day of entry: A calendar day of the month that the option bought/sold.
-Month of entry: Calendar month the option bought/sold.
-Year of entry: Calendar year the option bought/sold.
After entering all the inputs, press Ok and you should see “Calculation Complete” on the chart.
The user should not change the entry date and days to expire inputs as time passes after he entered the trade.
How to access the indicator?
Use the link below to obtain access to the indicator
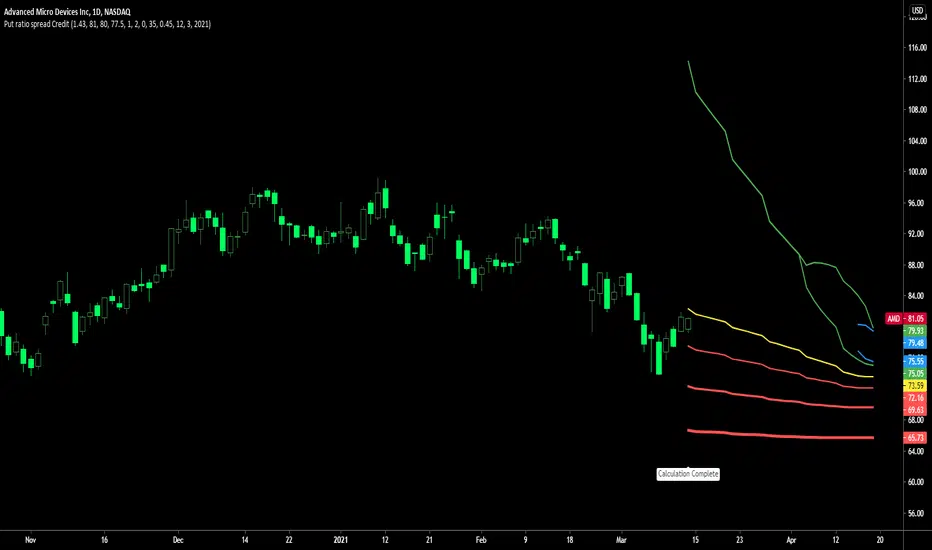
Put ratio spread Credit indicatorPut ratio spread credit indicator developed by Chobotaru Brothers.
You need to have basic knowledge in option trading to use this indicator!
This spread is a CREDIT SPREAD.
The indicator shows P&L lines of the options strategy. Use only for stocks since the mathematical model of options for Future instruments is different from stocks. Plus, the days' representation in futures is also different from stocks (stocks have fewer days than futures ).
***Each strategy in options is based on different mathematical equations, use this indicator only for the strategy in the headline.***
What does the indicator do?
The indicator is based on the Black-Scholes model, which uses partial differential equations to determine the option pricing. Due to options non-linear behavior, it is hard to visualize the option price. The indicator calculates the solutions of the Black-Scholes equation and plots them on the chart so traders can view how the option pricing will behave.
How the indicator does it?
The indicator uses five values (four dominants and one less dominant) to solve the Black-Scholes equation. The values are stock price, the strike price of the option, time to expiration, risk-free interest rate, and implied volatility .
How the indicator help the users?
-View the risks and rewards so you can know the profit targets in advance which means you can compare different options in different strikes.
-View the volatility change impact so you can know the risk and the P&L changes in case of a change in the volatility over the life of the option before you enter the trade.
-View the passage of time impact so you can know where and when you could realize a profit.
-Multi-timeframes so you can stay on the same chart (Daily and below).
All these features are to help the user improve his analysis while trading options.
How to use it?
The user needs to obtain from the “option chain” the following inputs:
-Credit received: The credit received for one unit of options strategy. Minimum value: 0. 01 .
-Instrument price when entered spread: the stock price when you enter the options strategy.
-Upper strike price: the upper strike price of the options strategy.
-Lower strike price: the lower strike price of the options strategy.
- Upper Strike numbers of puts . This number has to be less than the number of puts that were sold.
- Lower Strike number of puts . This number has to be greater than the number of puts that were bought.
-Interest rate: find the risk-free interest rate from the U.S. DEPARTMENT OF THE TREASURY. Example: for 2% interest rate, input: 0.02.
-Days to expire: how many days until the option expires.
-Volatility: the implied volatility of the option bought/sold. Example: for 45% implied volatility , input: 0.45.
-Day of entry: A calendar day of the month that the option bought/sold.
-Month of entry: Calendar month the option bought/sold.
-Year of entry: Calendar year the option bought/sold.
After entering all the inputs, press Ok and you should see “Calculation Complete” on the chart.
The user should not change the entry date and days to expire inputs as time passes after he entered the trade.
How to access the indicator?
Use the link below to obtain access to the indicator
Call ratio spread debit indicatorCall ratio spread debit indicator developed by Chobotaru Brothers.
You need to have basic knowledge in option trading to use this indicator!
This spread is a DEBIT SPREAD.
The indicator shows P&L lines of the options strategy. Use only for stocks since the mathematical model of options for Future instruments is different from stocks. Plus, the days' representation in futures is also different from stocks (stocks have fewer days than futures ).
***Each strategy in options is based on different mathematical equations, use this indicator only for the strategy in the headline.***
What does the indicator do?
The indicator is based on the Black-Scholes model, which uses partial differential equations to determine the option pricing. Due to options non-linear behavior, it is hard to visualize the option price. The indicator calculates the solutions of the Black-Scholes equation and plots them on the chart so traders can view how the option pricing will behave.
How the indicator does it?
The indicator uses five values (four dominants and one less dominant) to solve the Black-Scholes equation. The values are stock price, the strike price of the option, time to expiration, risk-free interest rate, and implied volatility .
How the indicator help the users?
-View the risks and rewards so you can know the profit targets in advance which means you can compare different options in different strikes.
-View the volatility change impact so you can know the risk and the P&L changes in case of a change in the volatility over the life of the option before you enter the trade.
-View the passage of time impact so you can know where and when you could realize a profit.
-Multi-timeframes so you can stay on the same chart (Daily and below).
All these features are to help the user improve his analysis while trading options.
How to use it?
The user needs to obtain from the “option chain” the following inputs:
-Debit paid: The debit paid for one unit of options strategy. Minimum value: 0. 01 .
-Instrument price when entered spread: the stock price when you enter the options strategy.
-Upper strike price: the upper strike price of the options strategy.
-Lower strike price: the lower strike price of the options strategy.
- Upper Strike numbers of calls . This number has to be greater than the number of calls that were bought.
- Lower Strike number of calls . This number has to be less than the number of calls that were sold.
-Interest rate: find the risk-free interest rate from the U.S. DEPARTMENT OF THE TREASURY. Example: for 2% interest rate, input: 0.02.
-Days to expire: how many days until the option expires.
-Volatility: the implied volatility of the option bought/sold. Example: for 45% implied volatility , input: 0.45.
-Day of entry: A calendar day of the month that the option bought/sold.
-Month of entry: Calendar month the option bought/sold.
-Year of entry: Calendar year the option bought/sold.
After entering all the inputs, press Ok and you should see “Calculation Complete” on the chart.
The user should not change the entry date and days to expire inputs as time passes after he entered the trade.
How to access the indicator?
Use the link below to obtain access to the indicator

Call ratio spread Credit indicatorCall ratio spread credit indicator developed by Chobotaru Brothers.
You need to have basic knowledge in option trading to use this indicator!
This spread is a CREDIT SPREAD.
The indicator shows P&L lines of the options strategy. Use only for stocks since the mathematical model of options for Future instruments is different from stocks. Plus, the days' representation in futures is also different from stocks (stocks have fewer days than futures ).
***Each strategy in options is based on different mathematical equations, use this indicator only for the strategy in the headline.***
What does the indicator do?
The indicator is based on the Black-Scholes model, which uses partial differential equations to determine the option pricing. Due to options non-linear behavior, it is hard to visualize the option price. The indicator calculates the solutions of the Black-Scholes equation and plots them on the chart so traders can view how the option pricing will behave.
How the indicator does it?
The indicator uses five values (four dominants and one less dominant) to solve the Black-Scholes equation. The values are stock price, the strike price of the option, time to expiration, risk-free interest rate, and implied volatility .
How the indicator help the users?
-View the risks and rewards so you can know the profit targets in advance which means you can compare different options in different strikes.
-View the volatility change impact so you can know the risk and the P&L changes in case of a change in the volatility over the life of the option before you enter the trade.
-View the passage of time impact so you can know where and when you could realize a profit.
-Multi-timeframes so you can stay on the same chart (Daily and below).
All these features are to help the user improve his analysis while trading options.
How to use it?
The user needs to obtain from the “option chain” the following inputs:
-Credit received: The credit received for one unit of options strategy. Minimum value: 0. 01 .
-Instrument price when entered spread: the stock price when you enter the options strategy.
-Upper strike price: the upper strike price of the options strategy.
-Lower strike price: the lower strike price of the options strategy.
- Upper Strike numbers of calls . This number has to be greater than the number of calls that were bought.
- Lower Strike number of calls . This number has to be less than the number of calls that were sold.
-Interest rate: find the risk-free interest rate from the U.S. DEPARTMENT OF THE TREASURY. Example: for 2% interest rate, input: 0.02.
-Days to expire: how many days until the option expires.
-Volatility: the implied volatility of the option bought/sold. Example: for 45% implied volatility , input: 0.45.
-Day of entry: A calendar day of the month that the option bought/sold.
-Month of entry: Calendar month the option bought/sold.
-Year of entry: Calendar year the option bought/sold.
After entering all the inputs, press Ok and you should see “Calculation Complete” on the chart.
The user should not change the entry date and days to expire inputs as time passes after he entered the trade.
How to access the indicator?
Use the link below to obtain access to the indicator

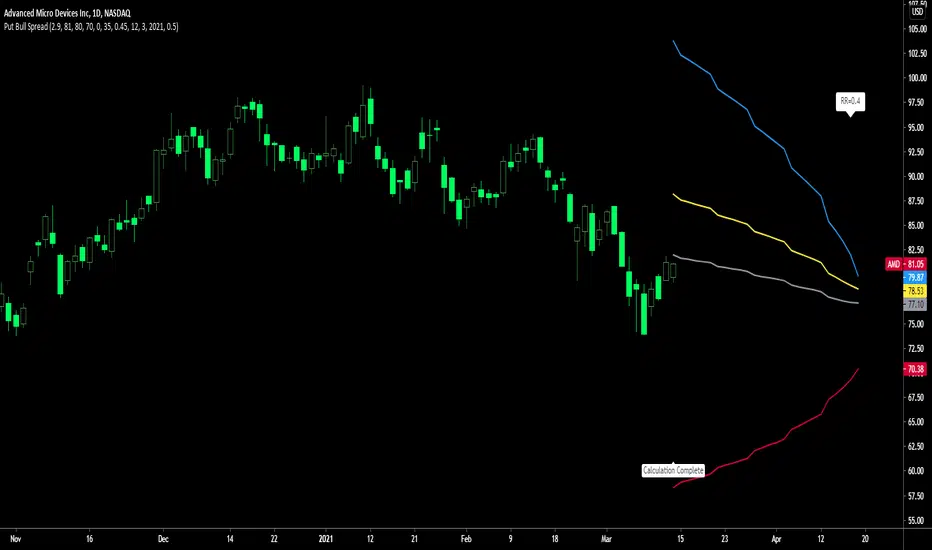
Put Bull Spread indicatorPut bull spread indicator developed by Chobotaru Brothers.
You need to have basic knowledge in option trading to use this indicator!
This spread is a CREDIT SPREAD.
The indicator shows P&L lines of the options strategy. Use only for stocks since the mathematical model of options for Future instruments is different from stocks. Plus, the days' representation in futures is also different from stocks (stocks have fewer days than futures ).
***Each strategy in options is based on different mathematical equations, use this indicator only for the strategy in the headline.***
What does the indicator do?
The indicator is based on the Black-Scholes model, which uses partial differential equations to determine the option pricing. Due to options non-linear behavior, it is hard to visualize the option price. The indicator calculates the solutions of the Black-Scholes equation and plots them on the chart so traders can view how the option pricing will behave.
How the indicator does it?
The indicator uses five values (four dominants and one less dominant) to solve the Black-Scholes equation. The values are stock price, the strike price of the option, time to expiration, risk-free interest rate, and implied volatility .
How the indicator help the users?
-View the risks and rewards so you can know the profit targets in advance which means you can compare different options in different strikes.
-View the volatility change impact so you can know the risk and the P&L changes in case of a change in the volatility over the life of the option before you enter the trade.
-View the passage of time impact so you can know where and when you could realize a profit.
-Multi-timeframes so you can stay on the same chart (Daily and below).
All these features are to help the user improve his analysis while trading options.
How to use it?
The user needs to obtain from the “option chain” the following inputs:
- Put spread price (Credit): The credit received for one unit of options strategy.
-Instrument price when entered spread: the stock price when you enter the options strategy.
-Upper strike price: the upper strike price of the options strategy.
-Lower strike price: the lower strike price of the options strategy.
-Interest rate: find the risk-free interest rate from the U.S. DEPARTMENT OF THE TREASURY. Example: for 2% interest rate, input: 0.02.
-Days to expire: how many days until the option expires.
-Volatility: the implied volatility of the option bought/sold. Example: for 45% implied volatility , input: 0.45.
-Day of entry: A calendar day of the month that the option bought/sold.
-Month of entry: Calendar month the option bought/sold.
-Year of entry: Calendar year the option bought/sold.
-% of Max Profit/Loss: Profit/loss line defined by the user. Minimum input (-0.95) ; maximum input (0.95).
Example: In this spread, -0.95 means, 95% of the options strategy maximum loss is reached and, 0.95 means, 95% of the options strategy maximum profit is reached.
After entering all the inputs, press Ok and you should see “Calculation Complete” on the chart.
The user should not change the entry date and days to expire inputs as time passes after he entered the trade.
How to access the indicator?
Use the link below to obtain access to the indicator
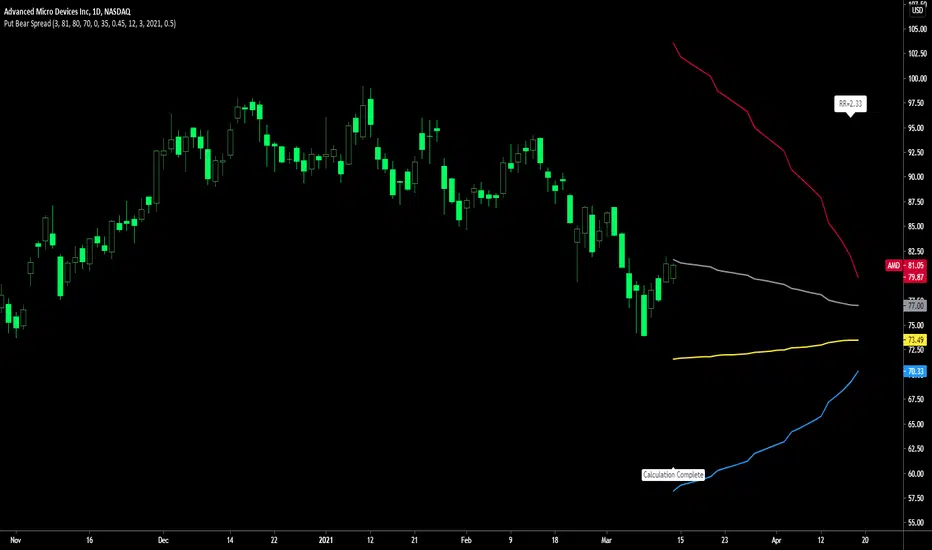
Put Bear Spread indicatorPut bear spread indicator developed by Chobotaru Brothers.
You need to have basic knowledge in option trading to use this indicator!
This spread is a DEBIT SPREAD.
The indicator shows P&L lines of the options strategy. Use only for stocks since the mathematical model of options for Future instruments is different from stocks. Plus, the days' representation in futures is also different from stocks (stocks have fewer days than futures ).
***Each strategy in options is based on different mathematical equations, use this indicator only for the strategy in the headline.***
What does the indicator do?
The indicator is based on the Black-Scholes model, which uses partial differential equations to determine the option pricing. Due to options non-linear behavior, it is hard to visualize the option price. The indicator calculates the solutions of the Black-Scholes equation and plots them on the chart so traders can view how the option pricing will behave.
How the indicator does it?
The indicator uses five values (four dominants and one less dominant) to solve the Black-Scholes equation. The values are stock price, the strike price of the option, time to expiration, risk-free interest rate, and implied volatility .
How the indicator help the users?
-View the risks and rewards so you can know the profit targets in advance which means you can compare different options in different strikes.
-View the volatility change impact so you can know the risk and the P&L changes in case of a change in the volatility over the life of the option before you enter the trade.
-View the passage of time impact so you can know where and when you could realize a profit.
-Multi-timeframes so you can stay on the same chart (Daily and below).
All these features are to help the user improve his analysis while trading options.
How to use it?
The user needs to obtain from the “option chain” the following inputs:
- Put spread price (Debit): The debit paid for one unit of options strategy.
-Instrument price when entered spread: the stock price when you enter the options strategy.
-Upper strike price: the upper strike price of the options strategy.
-Lower strike price: the lower strike price of the options strategy.
-Interest rate: find the risk-free interest rate from the U.S. DEPARTMENT OF THE TREASURY. Example: for 2% interest rate, input: 0.02.
-Days to expire: how many days until the option expires.
-Volatility: the implied volatility of the option bought/sold. Example: for 45% implied volatility , input: 0.45.
-Day of entry: A calendar day of the month that the option bought/sold.
-Month of entry: Calendar month the option bought/sold.
-Year of entry: Calendar year the option bought/sold.
-% of Max Profit/Loss: Profit/loss line defined by the user. Minimum input (-0.95) ; maximum input (0.95).
Example: In this spread, -0.95 means, 95% of the options strategy maximum loss is reached and, 0.95 means, 95% of the options strategy maximum profit is reached.
After entering all the inputs, press Ok and you should see “Calculation Complete” on the chart.
The user should not change the entry date and days to expire inputs as time passes after he entered the trade.
How to access the indicator?
Use the link below to obtain access to the indicator
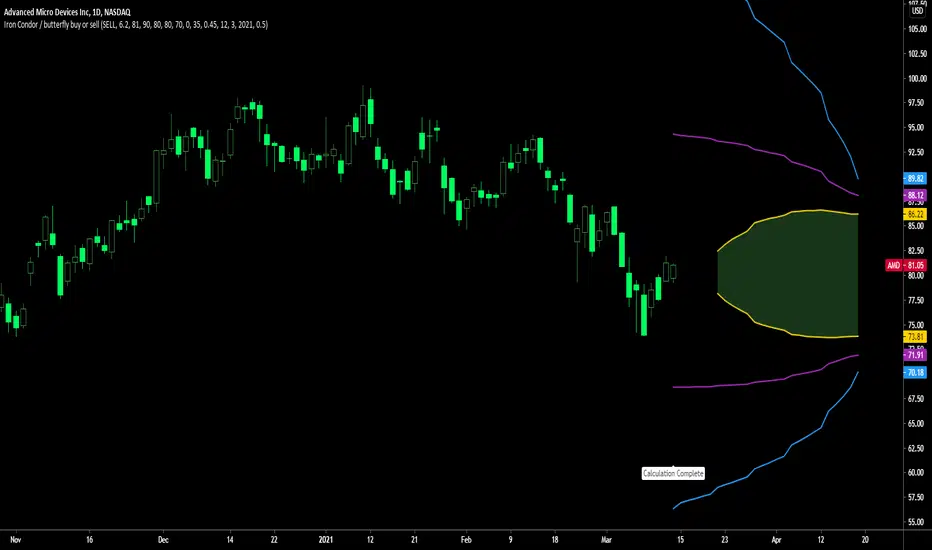
Iron Condor / butterfly buy or sell indicatorIron Condor / butterfly indicator developed by Chobotaru Brothers.
You need to have basic knowledge in option trading to use this indicator!
The indicator shows P&L lines of the options strategy. Use only for stocks since the mathematical model of options for Future instruments is different from stocks. Plus, the days' representation in futures is also different from stocks (stocks have fewer days than futures ).
***Each strategy in options is based on different mathematical equations, use this indicator only for the strategy in the headline.***
What does the indicator do?
The indicator is based on the Black-Scholes model, which uses partial differential equations to determine the option pricing. Due to options non-linear behavior, it is hard to visualize the option price. The indicator calculates the solutions of the Black-Scholes equation and plots them on the chart so traders can view how the option pricing will behave.
How the indicator does it?
The indicator uses five values (four dominants and one less dominant) to solve the Black-Scholes equation. The values are stock price, the strike price of the option, time to expiration, risk-free interest rate, and implied volatility .
How the indicator help the users?
-View the risks and rewards so you can know the profit targets in advance which means you can compare different options in different strikes.
-View the volatility change impact so you can know the risk and the P&L changes in case of a change in the volatility over the life of the option before you enter the trade.
-View the passage of time impact so you can know where and when you could realize a profit.
-Multi-timeframes so you can stay on the same chart (Daily and below).
All these features are to help the user improve his analysis while trading options.
How to use it?
The user needs to obtain from the “option chain” the following inputs:
-Buy or sell (the strategy)
- Iron Condor price bought/sold: enter the price that you bought/sold one options strategy.
-Instrument price when bought/sold: the stock price when you bought/sold the options strategy.
-Upper strike price Top: the top upper strike price of the options strategy.
-Lower strike price Top: the top lower strike price of the options strategy.
-Upper strike price Bottom: the bottom upper strike price of the options strategy.
-Lower strike price Bottom: the bottom lower strike price of the options strategy.
-Interest rate: find the risk-free interest rate from the U.S. DEPARTMENT OF THE TREASURY. Example: for 2% interest rate, input: 0.02.
-Days to expire: how many days until the option expires.
-Volatility: the implied volatility of the option bought/sold. Example: for 45% implied volatility , input: 0.45.
-Day of entry: A calendar day of the month that the option bought/sold.
-Month of entry: Calendar month the option bought/sold.
-Year of entry: Calendar year the option bought/sold.
-% of Profit/Loss: Profit/loss line defined by the user. Minimum input (-0.95) ; maximum input (0.95).
Example: If the strategy was bought, -0.95 means, 95% of the options strategy maximum loss is reached. : If the strategy was bought, 0.95 means, 95% of the options strategy maximum profit is reached.
After entering all the inputs, press Ok and you should see “Calculation Complete” on the chart.
The user should not change the entry date and days to expire inputs as time passes after he entered the trade.
How to access the indicator?
Use the link below to obtain access to the indicator
Straddle / strangle buy or sell indicatorStraddle / strangle buy or sell indicator developed by Chobotaru Brothers.
You need to have basic knowledge in option trading to use this indicator!
The indicator shows P&L lines of the options strategy. Use only for stocks since the mathematical model of options for Future instruments is different from stocks. Plus, the days' representation in futures is also different from stocks (stocks have fewer days than futures ).
***Each strategy in options is based on different mathematical equations, use this indicator only for the strategy in the headline.***
What does the indicator do?
The indicator is based on the Black-Scholes model, which uses partial differential equations to determine the option pricing. Due to options non-linear behavior, it is hard to visualize the option price. The indicator calculates the solutions of the Black-Scholes equation and plots them on the chart so traders can view how the option pricing will behave.
How the indicator does it?
The indicator uses five values (four dominants and one less dominant) to solve the Black-Scholes equation. The values are stock price, the strike price of the option, time to expiration, risk-free interest rate, and implied volatility .
How the indicator help the users?
-View the risks and rewards so you can know the profit targets in advance which means you can compare different options in different strikes.
-View the volatility change impact so you can know the risk and the P&L changes in case of a change in the volatility over the life of the option before you enter the trade.
-View the passage of time impact so you can know where and when you could realize a profit.
-Multi-timeframes so you can stay on the same chart (Daily and below).
All these features are to help the user improve his analysis while trading options.
How to use it?
The user needs to obtain from the “option chain” the following inputs:
-Buy or sell (the strategy)
- Straddle/strangle price bought/sold: enter the price that you bought/sold one options strategy.
-Instrument price when bought/sold: the stock price when you bought/sold the options strategy.
-Upper strike price: the upper strike price of the options strategy.
-Lower strike price: the lower strike price of the options strategy.
-Interest rate: find the risk-free interest rate from the U.S. DEPARTMENT OF THE TREASURY. Example: for 2% interest rate, input: 0.02.
-Days to expire: how many days until the option expires.
-Volatility: the implied volatility of the option bought/sold. Example: for 45% implied volatility , input: 0.45.
-Day of entry: A calendar day of the month that the option bought/sold.
-Month of entry: Calendar month the option bought/sold.
-Year of entry: Calendar year the option bought/sold.
-Risk to reward: Profit/loss line defined by the user. Minimum input (-0.95) ; maximum input (3).
Example: If the strategy was bought, -0.95 means, 95% of the options strategy value is lost (unrealized). If the strategy was bought, 3 means, the risk to reward is 3.
After entering all the inputs, press Ok and you should see “Calculation Complete” on the chart.
The user should not change the entry date and days to expire inputs as time passes after he entered the trade.
How to access the indicator?
Use the link below to obtain access to the indicator

Call Bear Spread indicatorCall bear spread indicator developed by Chobotaru Brothers.
You need to have basic knowledge in option trading to use this indicator!
This spread is a CREDIT SPREAD.
The indicator shows P&L lines of the options strategy. Use only for stocks since the mathematical model of options for Future instruments is different from stocks. Plus, the days' representation in futures is also different from stocks (stocks have fewer days than futures ).
***Each strategy in options is based on different mathematical equations, use this indicator only for the strategy in the headline.***
What does the indicator do?
The indicator is based on the Black-Scholes model, which uses partial differential equations to determine the option pricing. Due to options non-linear behavior, it is hard to visualize the option price. The indicator calculates the solutions of the Black-Scholes equation and plots them on the chart so traders can view how the option pricing will behave.
How the indicator does it?
The indicator uses five values (four dominants and one less dominant) to solve the Black-Scholes equation. The values are stock price, the strike price of the option, time to expiration, risk-free interest rate, and implied volatility .
How the indicator help the users?
-View the risks and rewards so you can know the profit targets in advance which means you can compare different options in different strikes.
-View the volatility change impact so you can know the risk and the P&L changes in case of a change in the volatility over the life of the option before you enter the trade.
-View the passage of time impact so you can know where and when you could realize a profit.
-Multi-timeframes so you can stay on the same chart (Daily and below).
All these features are to help the user improve his analysis while trading options.
How to use it?
The user needs to obtain from the “option chain” the following inputs:
- Call spread price (Credit): The credit received for one unit of options strategy.
-Instrument price when entered spread: the stock price when you enter the options strategy.
-Upper strike price: the upper strike price of the options strategy.
-Lower strike price: the lower strike price of the options strategy.
-Interest rate: find the risk-free interest rate from the U.S. DEPARTMENT OF THE TREASURY. Example: for 2% interest rate, input: 0.02.
-Days to expire: how many days until the option expires.
-Volatility: the implied volatility of the option bought/sold. Example: for 45% implied volatility , input: 0.45.
-Day of entry: A calendar day of the month that the option bought/sold.
-Month of entry: Calendar month the option bought/sold.
-Year of entry: Calendar year the option bought/sold.
-% of Max Profit/Loss: Profit/loss line defined by the user. Minimum input (-0.95) ; maximum input (0.95).
Example: In this spread, -0.95 means, 95% of the options strategy maximum loss is reached and, 0.95 means, 95% of the options strategy maximum profit is reached.
After entering all the inputs, press Ok and you should see “Calculation Complete” on the chart.
The user should not change the entry date and days to expire inputs as time passes after he entered the trade.
How to access the indicator?
Use the link below to obtain access to the indicator

Call bull spread indicatorCall bull spread indicator developed by Chobotaru Brothers.
You need to have basic knowledge in option trading to use this indicator!
This spread is a DEBIT SPREAD.
The indicator shows P&L lines of the options strategy. Use only for stocks since the mathematical model of options for Future instruments is different from stocks. Plus, the days' representation in futures is also different from stocks (stocks have fewer days than futures ).
***Each strategy in options is based on different mathematical equations, use this indicator only for the strategy in the headline.***
What does the indicator do?
The indicator is based on the Black-Scholes model, which uses partial differential equations to determine the option pricing. Due to options non-linear behavior, it is hard to visualize the option price. The indicator calculates the solutions of the Black-Scholes equation and plots them on the chart so traders can view how the option pricing will behave.
How the indicator does it?
The indicator uses five values (four dominants and one less dominant) to solve the Black-Scholes equation. The values are stock price, the strike price of the option, time to expiration, risk-free interest rate, and implied volatility .
How the indicator help the users?
-View the risks and rewards so you can know the profit targets in advance which means you can compare different options in different strikes.
-View the volatility change impact so you can know the risk and the P&L changes in case of a change in the volatility over the life of the option before you enter the trade.
-View the passage of time impact so you can know where and when you could realize a profit.
-Multi-timeframes so you can stay on the same chart (Daily and below).
All these features are to help the user improve his analysis while trading options.
How to use it?
The user needs to obtain from the “option chain” the following inputs:
- Call spread price (Debit): The debit paid for one unit of options strategy.
-Instrument price when entered spread: the stock price when you enter the options strategy.
-Upper strike price: the upper strike price of the options strategy.
-Lower strike price: the lower strike price of the options strategy.
-Interest rate: find the risk-free interest rate from the U.S. DEPARTMENT OF THE TREASURY. Example: for 2% interest rate, input: 0.02.
-Days to expire: how many days until the option expires.
-Volatility: the implied volatility of the option bought/sold. Example: for 45% implied volatility , input: 0.45.
-Day of entry: A calendar day of the month that the option bought/sold.
-Month of entry: Calendar month the option bought/sold.
-Year of entry: Calendar year the option bought/sold.
-% of Max Profit/Loss: Profit/loss line defined by the user. Minimum input (-0.95) ; maximum input (0.95).
Example: In this spread, -0.95 means, 95% of the options strategy maximum loss is reached and, 0.95 means, 95% of the options strategy maximum profit is reached.
After entering all the inputs, press Ok and you should see “Calculation Complete” on the chart.
The user should not change the entry date and days to expire inputs as time passes after he entered the trade.
How to access the indicator?
Use the link below to obtain access to the indicator

Put option buy or sell indicatorPut option indicator developed by Chobotaru Brothers.
You need to have basic knowledge in option trading to use this indicator!
The indicator shows P&L lines of the options strategy. Use only for stocks since the mathematical model of options for Future instruments is different from stocks. Plus, the days' representation in futures is also different from stocks (stocks have fewer days than futures ).
***Each strategy in options is based on different mathematical equations, use this indicator only for the strategy in the headline.***
What does the indicator do?
The indicator is based on the Black-Scholes model, which uses partial differential equations to determine the option pricing. Due to options non-linear behavior, it is hard to visualize the option price. The indicator calculates the solutions of the Black-Scholes equation and plots them on the chart so traders can view how the option pricing will behave.
How the indicator does it?
The indicator uses five values (four dominants and one less dominant) to solve the Black-Scholes equation. The values are stock price, the strike price of the option, time to expiration, risk-free interest rate, and implied volatility .
How the indicator help the users?
-View the risks and rewards so you can know the profit targets in advance which means you can compare different options in different strikes.
-View the volatility change impact so you can know the risk and the P&L changes in case of a change in the volatility over the life of the option before you enter the trade.
-View the passage of time impact so you can know where and when you could realize a profit.
-Multi-timeframes so you can stay on the same chart (Daily and below).
All these features are to help the user improve his analysis while trading options.
How to use it?
The user needs to obtain from the “option chain” the following inputs:
-Buy or sell (the strategy)
-The option price bought: at what price did you bought/sold one option.
-Instrument price when bought: the stock price when you bought/sold the option.
-Strike price: the strike price of the option.
-Interest rate: find the risk-free interest rate from the U.S. DEPARTMENT OF THE TREASURY. Example: for 2% interest rate, input: 0.02.
-Days to expire: how many days until the option expires.
-Volatility: the implied volatility of the option bought/sold. Example: for 45% implied volatility , input: 0.45.
-Day of entry: A calendar day of the month that the option bought/sold.
-Month of entry: Calendar month the option bought/sold.
-Year of entry: Calendar year the option bought/sold.
-Risk to reward: Profit/loss line defined by the user. Minimum input (-0.95) ; maximum input (3).
Example: If an option was bought, -0.95 means, 95% of the option value is lost (unrealized). If an option was bought, 3 means, the risk to reward is 3.
After entering all the inputs, press Ok and you should see “Calculation Complete” on the chart.
The user should not change the entry date and days to expire inputs as time passes after he entered the trade.
How to access the indicator?
Use the link below to obtain access to the indicator
Call option buy or sell indicatorCall option indicator developed by Chobotaru Brothers.
You need to have basic knowledge in option trading to use this indicator!
The indicator shows P&L lines of the options strategy. Use only for stocks since the mathematical model of options for Future instruments is different from stocks. Plus, the days' representation in futures is also different from stocks (stocks have fewer days than futures ).
***Each strategy in options is based on different mathematical equations, use this indicator only for the strategy in the headline.***
What does the indicator do?
The indicator is based on the Black-Scholes model, which uses partial differential equations to determine the option pricing. Due to options non-linear behavior, it is hard to visualize the option price. The indicator calculates the solutions of the Black-Scholes equation and plots them on the chart so traders can view how the option pricing will behave.
How the indicator does it?
The indicator uses five values (four dominants and one less dominant) to solve the Black-Scholes equation. The values are stock price, the strike price of the option, time to expiration, risk-free interest rate, and implied volatility .
How the indicator help the users?
-View the risks and rewards so you can know the profit targets in advance which means you can compare different options in different strikes.
-View the volatility change impact so you can know the risk and the P&L changes in case of a change in the volatility over the life of the option before you enter the trade.
-View the passage of time impact so you can know where and when you could realize a profit.
-Multi-timeframes so you can stay on the same chart (Daily and below).
All these features are to help the user improve his analysis while trading options.
How to use it?
The user needs to obtain from the “option chain” the following inputs:
-Buy or sell (the strategy)
-The option price bought: at what price did you bought/sold one option.
-Instrument price when bought: the stock price when you bought/sold the option.
-Strike price: the strike price of the option.
-Interest rate: find the risk-free interest rate from the U.S. DEPARTMENT OF THE TREASURY. Example: for 2% interest rate, input: 0.02.
-Days to expire: how many days until the option expires.
-Volatility: the implied volatility of the option bought/sold. Example: for 45% implied volatility , input: 0.45.
-Day of entry: A calendar day of the month that the option bought/sold.
-Month of entry: Calendar month the option bought/sold.
-Year of entry: Calendar year the option bought/sold.
-Risk to reward: Profit/loss line defined by the user. Minimum input (-0.95) ; maximum input (3).
Example: If an option was bought, -0.95 means, 95% of the option value is lost (unrealized). If an option was bought, 3 means, the risk to reward is 3.
After entering all the inputs, press Ok and you should see “Calculation Complete” on the chart.
The user should not change the entry date and days to expire inputs as time passes after he entered the trade.
How to access the indicator?
Use the link below to obtain access to the indicator

Whale Dash + Colored CandlesIstruzioni per l'uso:
Analisi Rapida: Guarda la dashboard per capire il trend generale e la potenza del volume.
Analisi Visiva: Quando vedi una candela colorata, sai che l'istituzionale ha lasciato l'impronta. Se una candela Oro appare sopra la SMA 50 (Trend Bullish), la probabilità di continuazione è molto alta.
Come usarla per le tue analisi:
Se vedi Potenza > 3.0x e Stato Balena: ATTIVA, guarda la candela corrente. Se è oro ed il trend è BULLISH, è un segnale di acquisto istituzionale.
Se vedi TREND: BEARISH e lo stato balena diventa attivo su una candela viola, le balene stanno scaricando posizioni.
Ingresso Long: Aspetta una candela Oro. Guarda la dashboard: se il Vol. Balena è molto alto (>3.0x), la forza del movimento è reale.
Ingresso Short: Aspetta una candela Viola. Guarda la dashboard: se il Vol. Balena è molto alto (>3.0x), la forza del movimento è reale.
Stop Loss: Posizionalo appena sotto la linea Oro/Viola creata dalla candela balena. Se il prezzo la rompe, l'istituzionale è uscito.
Consiglio:
Attendi sempre la fine dalla candela colorata per capire l'intenzione.
Instructions for use:
Quick Analysis: Look at the dashboard to understand the overall trend and volume strength.
Visual Analysis: When you see a colored candle, you know that the institutional player has left its mark. If a Gold candle appears above the SMA 50 (Bullish Trend), the probability of continuation is very high.
How to use it for your analyses:
If you see Power > 3.0x and Whale Status: ACTIVE, look at the current candle. If it is gold and the trend is BULLISH, it is a signal of institutional buying.
If you see TREND: BEARISH and the whale status becomes active on a purple candle, the whales are offloading positions.
Long Entry: Wait for a Gold candle. Check the dashboard: if Whale Vol. is very high (>3.0x), the strength of the movement is real.
Short Entry: Wait for a Purple candle. Check the dashboard: if Whale Vol. is very high (>3.0x), the strength of the movement is real.
Stop Loss: Place it just below the Gold/Purple line created by the whale candle. If the price breaks it, the institution has exited. Tip: always wait for the colored candle to close to understand the intention.

AI Reversal Signals Custom [wjdtks255]📊 Indicator Overview: AI Reversal Signals Custom
This indicator is a comprehensive trend-following and reversal detection tool. It combines the long-term trend bias of a 200 EMA with highly sensitive RSI-based reversal signals and momentum visualization. It is designed to capture market bottoms and tops by identifying exhaustion points in price action.
Key Features
200 EMA (Trend Filter): A gold line representing the long-term institutional trend. It helps traders distinguish between "buying the dip" and "catching a falling knife."
Reversal Buy/Sell Labels: Real-time signals that appear when the market recovers from extreme overbought or oversold conditions.
Dynamic Background Clouds: Visual indicators of trend strength changes, highlighting potential entry zones.
Momentum Histogram: Internal calculations mimic the "Bottom Bars" seen in professional suites to track the velocity of price movement.
📈 Trading Strategy (How to Trade)
1. High-Probability Long Setup (Buy)
Trend Confirmation: Price should ideally be trading above the 200 EMA for the highest success rate.
Signal: Wait for the "BUY" label to appear below the candle.
Momentum: Confirm with the Light Green background or histogram shift indicating recovery.
Entry: Enter on the close of the signal candle.
2. High-Probability Short Setup (Sell)
Trend Confirmation: Price should ideally be trading below the 200 EMA.
Signal: Wait for the "SELL" label to appear above the candle.
Momentum: Confirm with the Red background or histogram fading from green to red.
Entry: Enter on the close of the signal candle.
3. Risk Management
Stop Loss: Place your Stop Loss slightly below the recent swing low for Buy orders, or above the recent swing high for Sell orders.
Take Profit: Exit when the price reaches a major support/resistance level or when an opposing signal appears.
💡 Professional Tip
For the best results, use this indicator on the 15-minute or 1-hour timeframes. The most powerful "Ultimate Reversal" signals occur when there is a Bullish Divergence (Price making lower lows while the RSI makes higher lows) followed by a confirmed "BUY" label.

Order Flow Pro - CVD - Alphaomega18═══════════════════════════════════════════════════════════════════════════════
ORDER FLOW CVD SIMPLE - TRADINGVIEW PUBLICATION
Created by Alphaomega18
═══════════════════════════════════════════════════════════════════════════════
📝 COMPLETE DESCRIPTION
═══════════════════════════════════════════════════════════════════════════════
🎯 FOLLOW INSTITUTIONAL TREND AT A GLANCE
Order Flow CVD is an ultra-simple and ultra-effective indicator that displays CVD (Cumulative Volume Delta) with a colored fill zone to instantly identify order flow trend.
No complexity, no clutter: just 2 lines and 1 colored zone to know if you should HOLD or EXIT your trade.
🔥 THE GOLDEN RULE OF TRADING
The secret of professional traders:
→ "Let your winners run, cut your losses"
But how do you know WHEN to hold and WHEN to exit?
**The answer: CVD (Cumulative Volume Delta)**
As long as institutional flow goes your way, HOLD the trade.
As soon as flow changes, EXIT.
This is exactly what this indicator does: it shows you the flow in real-time with ultra-clear visualization.
📊 HOW IT WORKS
🔷 **2 SIMPLE LINES**
**WHITE Line** = CVD (Cumulative Volume Delta)
→ Cumulative sum of volume delta
→ Rises when buying > selling
→ Falls when selling > buying
**YELLOW Line** = CVD Moving Average (20 periods default)
→ Smooths CVD to see trend
→ Filters noise
→ Reference for trend
🔷 **COLORED FILL ZONE**
🟢 **GREEN ZONE** = White CVD ABOVE yellow CVD
→ BULLISH trend
→ Institutions are BUYING
→ HOLD your LONG trades
→ Avoid SHORT
🔴 **RED ZONE** = White CVD BELOW yellow CVD
→ BEARISH trend
→ Institutions are SELLING
→ HOLD your SHORT trades
→ Avoid LONG
⚡ **CROSSOVER** = Zone changes color
→ Trend change
→ Exit or reverse position
→ Clear and sharp signal
🎯 USAGE RULES
📌 **RULE #1: HOLD A LONG TRADE**
You're in a LONG:
→ ✅ As long as ZONE IS GREEN → HOLD
→ ❌ As soon as ZONE TURNS RED → EXIT
Real example:
```
LONG entry: 16,500
Zone stays green for 2 hours
Price climbs to 16,650 (+150 points)
Zone turns red → EXIT
You pocket +150 points instead of giving back 50 points!
```
📌 **RULE #2: HOLD A SHORT TRADE**
You're in a SHORT:
→ ✅ As long as ZONE IS RED → HOLD
→ ❌ As soon as ZONE TURNS GREEN → EXIT
Real example:
```
SHORT entry: 16,500
Zone stays red for 1 hour
Price drops to 16,350 (-150 points)
Zone turns green → EXIT
You pocket +150 points!
```
📌 **RULE #3: DON'T ENTER COUNTER-TREND**
Green zone visible:
→ ❌ Do NOT enter SHORT
→ ✅ Look for LONG setups only
Red zone visible:
→ ❌ Do NOT enter LONG
→ ✅ Look for SHORT setups only
📌 **RULE #4: CROSSOVERS = CHANGE**
White CVD crosses yellow CVD:
→ Zone changes color
→ Institutional flow reverses
→ Exit or reverse position
💡 REAL USE CASES
📊 **CASE 1: MNQ Scalping 5min**
Setup:
→ Price breaks resistance
→ CVD zone is GREEN
→ You enter LONG
Management:
→ Price rises, pulls back, rises again
→ Zone STAYS GREEN → You hold
→ +30 points, +40 points, +50 points...
→ Zone turns RED → You exit at +52 points
Without CVD:
→ You would have exited at +15 points out of fear
→ You lose 37 points of gain!
📊 **CASE 2: ES Day Trading 15min**
Setup:
→ Price in range
→ CVD zone RED for 1 hour
→ Price touches top of range
→ You enter SHORT
Management:
→ Zone STAYS RED during decline
→ Price makes -20 points, -30 points, -40 points
→ Zone turns GREEN → You exit at +42 points
Without CVD:
→ You would have exited at +20 points (fear)
→ Or held too long and gave back gains
📊 **CASE 3: Avoid Losing Trade**
Perfect technical setup:
→ Triangle breakout
→ Supportive VWAP
→ FVG below
BUT... CVD zone is RED!
Decision:
→ You DON'T ENTER LONG
→ Price rises 10 points then collapses -30 points
→ Losing trade avoided thanks to CVD!
⚙️ CUSTOMIZABLE PARAMETERS
🔧 **CVD Moving Average Length** (default: 20)
→ Yellow moving average length
→ Shorter (10-15) = More reactive, more signals
→ Longer (30-50) = Smoother, fewer false signals
Recommendations by style:
• Scalping (1-5min): 10-15
• Day Trading (15min-1H): 20 (default)
• Swing Trading (4H-Daily): 30-50
🎨 **Show Fill Between CVD and MA** (On/Off)
→ Show/hide colored zone
→ OFF = Just 2 lines
→ ON = Lines + green/red zone
🎨 **Bullish Fill Color** (Customizable)
→ Bullish zone color
→ Default: Transparent green (80%)
→ Change to blue, cyan, or other
🎨 **Bearish Fill Color** (Customizable)
→ Bearish zone color
→ Default: Transparent red (80%)
→ Change to orange, pink, or other
💡 **Transparency Tip:**
→ 90% transparent = Very subtle
→ 80% transparent = Balanced (recommended)
→ 60% transparent = Well visible
→ 40% transparent = Very visible
📊 RECOMMENDED CONFIGURATIONS
**Scalping (1-5min) - Reactive**
```
CVD MA Length: 10
Show Fill: ✅ ON
Bullish Color: Green 70% transparent
Bearish Color: Red 70% transparent
```
**Day Trading (15min-1H) - Balanced** ⭐
```
CVD MA Length: 20
Show Fill: ✅ ON
Bullish Color: Green 80% transparent
Bearish Color: Red 80% transparent
```
**Swing Trading (4H-Daily) - Smooth**
```
CVD MA Length: 30
Show Fill: ✅ ON
Bullish Color: Green 85% transparent
Bearish Color: Red 85% transparent
```
**Minimalist - Lines only**
```
CVD MA Length: 20
Show Fill: ❌ OFF
(Just white and yellow, no zone)
```
💡 MARKETS AND TIMEFRAMES
✅ **ALL markets compatible:**
• Futures (ES, NQ, YM, RTY, MNQ, MES, etc.)
• Forex (EUR/USD, GBP/USD, USD/JPY, etc.)
• Crypto (BTC, ETH, altcoins)
• Stocks (Tesla, Apple, Nvidia, etc.)
• Indices (S&P 500, Nasdaq, Dow Jones)
✅ **All timeframes:**
• Scalping: 1min, 5min
• Day Trading: 15min, 30min, 1H ⭐ (optimal!)
• Swing Trading: 4H, Daily
Note: More reliable with real volume data
→ TradingView Premium recommended
🏆 UNIQUE ADVANTAGES
✅ **Ultimate simplicity**: 2 lines, 1 zone, 1 rule
✅ **Instant vision**: Green = hold LONG, Red = hold SHORT
✅ **Hold trades longer**: Maximize your gains
✅ **Avoid counter-trend**: Don't trade against flow
✅ **Customizable**: Colors and transparency of choice
✅ **Ultra-light**: Optimized code, no lag
✅ **No repaint**: Reliable signals
✅ **Works everywhere**: All markets, all TF
🎓 QUICK INTERPRETATION
**When zone is GREEN:**
→ Institutions buying
→ Bullish momentum
→ Hold LONG, avoid SHORT
→ Look for buy setups
**When zone is RED:**
→ Institutions selling
→ Bearish momentum
→ Hold SHORT, avoid LONG
→ Look for sell setups
**When zone CHANGES color:**
→ Institutional flow reverses
→ Trend changes
→ EXIT position
→ Or reverse if new setup
**White line volatile:**
→ White CVD zigzags a lot
→ Market indecisive or range
→ Wait for clear zone before trade
💪 TRADER PSYCHOLOGY
What THIS indicator solves:
❌ "I'm afraid, I exit too early" → Green/red zone says WHEN to exit
❌ "I hold my losses too long" → Zone changes = EXIT
❌ "I trade counter-trend" → Zone tells which direction to trade
❌ "I don't know if trend continues" → Green/red zone = answer
Result:
✅ You hold your gains longer
✅ You exit at right time
✅ You avoid counter-trend trades
✅ You trade with institutions
🔗 PERFECT COMPLEMENT
Use with:
• **Order Flow Signals** → Precise signals (💎▲🚀)
• **VWAP** → Institutional price levels
• **Fair Value Gaps** → Inefficiency zones
• **Market Profile** → POC/VPOC
**CVD Simple** tells you WHEN to hold/exit
**Technical analysis** tells you WHERE to enter
⚠️ DISCLAIMER
Technical indicators are decision support tools. No indicator guarantees profits. Always use:
• Appropriate risk management
• Stop loss on every trade
• Proper position sizing
• Demo account testing first
Order Flow CVD improves your trade management but doesn't replace a complete strategy.
🚀 INSTALLATION
1. Copy the Pine Script code
2. Open Pine Editor in TradingView
3. Paste the code
4. Click "Add to Chart"
5. Indicator displays in separate pane (below)
6. Configure colors to your preferences
7. Apply golden rule: Green = LONG, Red = SHORT!
💡 PRO TIP
**CVD Discipline:**
Create this mental rule:
→ "I NEVER exit a position until zone changes color"
This simple discipline will:
✅ Multiply your gains (you hold longer)
✅ Reduce your losses (you exit when flow changes)
✅ Eliminate emotional exits
✅ Align you with institutions
📞 CONTACT AND SUPPORT
Created by Alphaomega18
For questions, bugs or suggestions:
Find my other indicators:
• Order Flow Signals (precise signals on chart)
• Order Flow Dashboard (CVD oscillator + pressures)
• VWAP Multi-Timeframe Pro
• Fair Value Gap Detector

Unmitigated MTF High Low Pro - Cave Diving Bookmap Heatmap Plot
Unmitigated MTF High Low Pro - Cave Diving Bookmap Heatmap Plot
---
## 📖 Table of Contents
1. (#what-this-indicator-does)
2. (#core-concepts)
3. (#visual-components)
4. (#the-cave-diving-framework)
5. (#how-to-use-it-for-trading)
6. (#settings--customization)
7. (#best-practices)
8. (#common-scenarios)
---
## What This Indicator Does
The **Unmitigated MTF High Low v2.0** tracks unmitigated (untouch) high and low levels across multiple timeframes, helping you identify key support and resistance zones that the market hasn't revisited yet. Think of it as a sophisticated memory system for price action - it remembers where price has been, and more importantly, where it *hasn't been back to*.
### Why "Unmitigated" Matters
In futures trading, especially on instruments like NQ and ES, the market has a tendency to revisit levels where liquidity was left behind. An "unmitigated" level is one that hasn't been touched since it was formed. These levels often act as magnets for price, and understanding their age and proximity gives you a significant edge in:
- **Entry timing** - Waiting for price to approach tested levels
- **Exit planning** - Taking profits before ancient resistance/support
- **Risk management** - Avoiding entries when approaching multiple old levels
- **Liquidity mapping** - Visualizing where orders likely cluster
---
## Core Concepts
### 1. **Sessions & Age**
The indicator uses **New York trading sessions** (6:00 PM to 5:59 PM NY time) as the primary time measurement. This aligns with how futures markets naturally segment their activity.
**Age Categories:**
- 🟢 **New (0-1 sessions)** - Fresh levels, recently formed
- 🟡 **Medium (2-3 sessions)** - Tested by time, gaining significance
- 🔴 **Old (4-6 sessions)** - Highly significant, survived multiple days
- 🟣 **Ancient (7+ sessions)** - Extreme significance, major support/resistance
The longer a level remains unmitigated, the more significant it becomes. Think of it like compound interest - time adds weight to these zones.
### 2. **Multi-Timeframe Tracking**
You can set the indicator to track high/low levels from any timeframe (default is 15 minutes). This means you're watching for unmitigated 15-minute highs and lows while trading on, say, a 1-minute or 5-minute chart.
**Why this matters:**
- Higher timeframe levels have more weight
- You can see multiple timeframe structure simultaneously
- Helps you avoid fighting larger timeframe momentum
### 3. **Mitigation**
A level becomes "mitigated" (deactivated) when price touches it:
- **High levels** are mitigated when price reaches or exceeds them
- **Low levels** are mitigated when price reaches or goes below them
Once mitigated, the level disappears from view. The indicator only shows you the untouch levels that still matter.
---
## Visual Components
### 📊 The Dashboard Table
Located in the corner of your chart (configurable), the table shows:
```
┌─────────┬───────────┬────────┬─────┬───────┐
│ Level │ Price │ Points │ Age │ % │
├─────────┼───────────┼────────┼─────┼───────┤
│ ↑↑↑↑↑ │ 21,450.25 │ +45.50 │ 8 │ +0.21%│ ← 5th High (Ancient)
│ ↑↑↑↑ │ 21,430.00 │ +25.25 │ 5 │ +0.12%│ ← 4th High (Old)
│ ↑↑↑ │ 21,420.50 │ +15.75 │ 3 │ +0.07%│ ← 3rd High (Medium)
│ ↑↑ │ 21,412.00 │ +7.25 │ 1 │ +0.03%│ ← 2nd High (New)
│ ↑ ⚠️ │ 21,408.25 │ +3.50 │ 0 │ +0.02%│ ← 1st High (Proximity Alert!)
├─────────┼───────────┼────────┼─────┼───────┤
│ 15 mins │ 🟢 │ Δ 8.75 │ 2U │ │ ← Status Row
├─────────┼───────────┼────────┼─────┼───────┤
│ ↓ ⚠️ │ 21,399.50 │ -5.25 │ 0 │ -0.02%│ ← 1st Low (Proximity Alert!)
│ ↓↓ │ 21,395.00 │ -9.75 │ 2 │ -0.05%│ ← 2nd Low (Medium)
│ ↓↓↓ │ 21,385.25 │ -19.50 │ 4 │ -0.09%│ ← 3rd Low (Old)
│ ↓↓↓↓ │ 21,370.00 │ -34.75 │ 6 │ -0.16%│ ← 4th Low (Old)
│ ↓↓↓↓↓ │ 21,350.75 │ -54.00 │ 9 │ -0.25%│ ← 5th Low (Ancient)
├─────────┼───────────┼────────┼─────┼───────┤
│ 📊 15↑ / 12↓ │ ← Statistics (optional)
└─────────┴───────────┴────────┴─────┴───────┘
```
**Reading the Table:**
- **Level Column**: Number of arrows indicates position (1-5), color shows age
- **Price**: The actual price level
- **Points**: Distance from current price (+ for highs, - for lows)
- **Age**: Number of full sessions since creation
- **%**: Percentage distance from current price
- **⚠️**: Proximity alert - price is within threshold distance
- **Status Row**: Shows timeframe, direction (🟢 bullish/🔴 bearish), tunnel width (Δ), and Strat pattern
### 📈 Visual Elements on Chart
**1. Level Lines**
- Horizontal lines showing each unmitigated level
- **Color-coded by age**: Bright colors = new, darker = older, deep purple/teal = ancient
- **Line style**: Customizable (solid, dashed, dotted)
- Automatically turn **yellow** when price gets close (proximity alert)
**2. Price Labels**
- Show the exact price and age: "21,450.25 (8d)"
- Fixed at small size for clean readability
- Positioned with configurable offset from current bar
**3. Bands (Optional)**
- Shaded zones between pairs of unmitigated levels
- Default: Between 1st and 2nd levels (the "tunnel")
- Can switch to 1st-3rd, 2nd-3rd, or disable entirely
- **Upper band** (pink/maroon) - Between unmitigated highs
- **Lower band** (blue/teal) - Between unmitigated lows
- These represent the "no man's land" or consolidation zones
---
## The Cave Diving Framework
This indicator is designed around the **Cave Diving Trading Framework** - a psychological and technical approach that maps cave diving safety protocols to futures trading risk management.
### 🤿 The Core Metaphor
**Cave diving has clear danger zones based on depth and overhead environment. Your trading should too.**
#### Shallow Water (New Levels, 0-1 Sessions)
- **Light**: Bright colors (bright red highs, bright green lows)
- **Psychology**: Fresh territory, recently tested
- **Trading**: Be aware but not overly concerned
- **Cave Diving Parallel**: You can see the surface, easy exit
#### Penetration Depth (Medium Levels, 2-3 Sessions)
- **Light**: Medium intensity colors
- **Psychology**: Building significance, market memory forming
- **Trading**: Start respecting these levels for entries/exits
- **Cave Diving Parallel**: Deeper in, need to track your line back
#### Deep Dive Zone (Old Levels, 4-6 Sessions)
- **Light**: Dark colors (deep maroon, dark blue)
- **Psychology**: Highly tested support/resistance
- **Trading**: Major decision points, plan accordingly
- **Cave Diving Parallel**: Significant overhead, careful navigation required
#### Overhead Environment (Ancient Levels, 7+ Sessions)
- **Light**: Very dark, purple/deep teal
- **Psychology**: Extreme caution required, major liquidity zones
- **Trading**: These are your "turn back" signals - don't fight ancient levels
- **Cave Diving Parallel**: Maximum danger, no room for error
### 🎯 The Proximity Alert System
Just like a cave diver's depth gauge that warns at critical thresholds, the proximity alerts (⚠️) tell you when you're entering a danger zone. When price gets within your configured threshold (default 5 points), the indicator:
- Highlights the level in **yellow** on the chart
- Shows **⚠️** in the table
- Signals: "You're entering a high-significance zone - adjust your position accordingly"
This prevents the trading equivalent of going deeper into a cave without checking your air supply.
---
## How to Use It for Trading
### 🎯 Entry Strategies
**1. The "Bounce Setup" (Mean Reversion)**
- Wait for price to approach an old or ancient unmitigated level
- Look for confluence: multiple levels nearby, bands narrowing
- Enter when price shows rejection (reversal candle patterns)
- **Example**: Price drops to a 6-session-old low, shows bullish engulfing → Long entry
**2. The "Break and Retest" (Trend Following)**
- Wait for price to break through an unmitigated level (mitigates it)
- Enter on the retest of the newly broken level
- **Example**: Price breaks above 4-session-old high → Wait for pullback to that level → Long entry
**3. The "Tunnel Trade" (Range Trading)**
- When bands are active, trade the range between 1st-2nd levels
- Short near upper band resistance, long near lower band support
- Exit at opposite side or when bands break
### 🚨 Risk Management Rules
**The Ancient Level Rule**
> Never fight ancient levels (7+ sessions). If you're long and approaching an ancient high, take profits. If you're short and approaching an ancient low, take profits.
These levels have survived a full trading week without being touched - there's likely significant liquidity and institutional interest there.
**The Proximity Exit Rule**
> When you see ⚠️ proximity alerts on multiple levels above/below your position, tighten stops or scale out.
This is your "overhead environment" warning. You're in dangerous territory.
**The New Level Filter**
> Be cautious taking positions based solely on new levels (0-1 sessions). Wait for them to age or combine with other confluence.
Fresh levels haven't been tested by time. They're like unconfirmed support/resistance.
### 📊 Reading Market Structure
**Bullish Structure (🟢 in status row)**
- Unmitigated lows are aging and holding
- Price respecting the lower band
- Old lows below acting as strong support
- **Bias**: Look for long entries at lower levels
**Bearish Structure (🔴 in status row)**
- Unmitigated highs are aging and holding
- Price respecting the upper band
- Old highs above acting as strong resistance
- **Bias**: Look for short entries at higher levels
**The Tunnel Compression**
- When the Δ (delta) in the status row is small, levels are tight
- This often precedes a breakout
- **Trading**: Wait for breakout direction, then trade the break
### 🔄 Strat Integration
The indicator shows Strat patterns in the status row:
- **1** - Inside bar (consolidation)
- **2U** - Broke high only (bullish)
- **2D** - Broke low only (bearish)
- **3** - Broke both (wide range, volatility)
Use these with the unmitigated levels:
- **2U near old high** → Potential resistance, watch for rejection
- **2D near old low** → Potential support, watch for bounce
- **3 pattern** → High volatility, respect wider stops
---
## Settings & Customization
### 📅 Session & Timeframe Settings
**HL Interval** (Default: 15 minutes)
- The timeframe for high/low calculation
- **Lower (1m, 5m)**: More levels, more noise, good for scalping
- **Higher (30m, 1H, 4H)**: Fewer levels, stronger significance, good for swing trading
- **Recommendation for NQ/ES**: 15m or 30m for day trading, 1H for swing trading
**Session Age Threshold** (Default: 2)
- How many sessions before a level is considered "old"
- Lower = more levels classified as old
- Higher = stricter definition of significance
### 📊 Level Display Options
**Show Level Lines**
- Toggle: Display horizontal lines for each level
- **Turn off** if you prefer a cleaner chart and only want the table
**Show Level Labels**
- Toggle: Display price labels on the chart
- **Turn off** for minimal visual clutter
**Label Offset**
- Distance (in bars) from current price bar to place labels
- Increase if labels overlap with price action
**Level Line Width & Style**
- Customize visual appearance
- **Thin solid**: Minimal distraction
- **Thick dashed**: High visibility
### 🎨 Age-Based Color Coding
Customize colors for each age category (high and low separately):
- **New (0-1 sessions)**: Default bright red/green
- **Medium (2-3 sessions)**: Default medium intensity
- **Old (4+ sessions)**: Default dark red/blue
- **Ancient (7+ sessions)**: Default deep purple/teal
**Color Strategy Tips:**
- Keep ancient levels in highly contrasting colors
- Use opacity (transparency) if you want subtler lines
- Match your chart's color scheme for aesthetic coherence
### 🎯 Band Settings
**Band Mode**
- **1st-2nd** (Default): The primary "tunnel" between most recent levels
- **1st-3rd**: Wider band, more room for price action
- **2nd-3rd**: Band between less immediate levels
- **Disabled**: No bands, lines only
**Band Colors & Borders**
- Customize fill color and border separately
- **Tip**: Keep bands very transparent (90-95% transparency) to avoid obscuring price action
### ⚠️ Proximity Alert Settings
**Enable Proximity Alerts**
- Toggle: Turn on/off the warning system
- When enabled, levels within threshold distance show ⚠️ and turn yellow
**Alert Threshold** (Default: 5.0 points)
- Distance in points to trigger the alert
- **For NQ**: 5-10 points is reasonable
- **For ES**: 2-5 points is reasonable
- **For MES/MNQ**: Scale down proportionally
**Alert Highlight Color**
- The color lines/labels turn when proximity is triggered
- Default: Yellow (high visibility)
### 📋 Table Settings
**Show Table**
- Toggle: Display the dashboard table
**Table Location**
- Top Left, Top Right, Bottom Left, Bottom Right
- Choose based on your chart layout and other indicators
**Text Size**
- Tiny, Small, Normal, Large
- **Recommendation**: Normal for 1080p monitors, Small for 4K
**Show % Distance**
- Toggle: Add percentage distance column to table
- Useful for comparing relative distances across different price ranges
**Show Statistics Row**
- Toggle: Show total count of unmitigated highs/lows
- Format: "📊 15↑ / 12↓" (15 unmitigated highs, 12 unmitigated lows)
- Useful for gauging overall market structure
### ⚡ Performance Settings
**Enable Level Cleanup**
- Automatically remove very old levels to maintain performance
- **Keep on** unless you want unlimited history
**Max Lookback Levels** (Default: 10,000)
- Maximum number of levels to track
- 10,000 ≈ 6+ months of 15-minute bars
- **Increase** if you want more history
- **Decrease** if experiencing performance issues
**Max Boxes Per Band** (Default: 245)
- TradingView limit is 500 total boxes
- With 2 bands, 245 each = 490 total (safe maximum)
---
## Best Practices
### 🎯 Position Management
**1. Scaling In Near Old Levels**
```
Price approaching 5-session-old low:
- First position: 30% size at proximity alert (⚠️)
- Second position: 40% size at exact level
- Third position: 30% size if it shows strong rejection
```
**2. Scaling Out Near Ancient Levels**
```
Holding long position, approaching 8-session-old high:
- Exit 50% at proximity alert (⚠️)
- Exit 30% at exact level
- Trail stop on remaining 20%
```
### 🧠 Trading Psychology Integration
Drawing from principles in *The Mountain Is You*, this indicator helps you:
**1. Recognize Self-Sabotage Patterns**
- **The Premature Entry**: Entering before price reaches your planned level
- **Solution**: Set alerts at unmitigated levels, wait for proximity warnings
- **The Profit-Taking Problem**: Exiting too early from fear
- **Solution**: Identify the next unmitigated level and commit to holding until proximity alert
- **The Loss Holding**: Refusing to exit losing trades
- **Solution**: When price breaks through and mitigates your entry level, it's telling you the structure changed
**2. Building Better Habits**
The color-coded age system trains your brain to:
- Respect levels that have proven themselves over time
- Distinguish between noise (new levels) and structure (old levels)
- Make decisions based on objective data, not fear or greed
**3. Emotional Regulation**
The proximity alerts serve as:
- **Circuit breakers** - Forcing you to re-evaluate before dangerous zones
- **Permission to act** - Giving you objective signals to exit without second-guessing
- **Validation** - Confirming when you're in alignment with market structure
### 📝 Pre-Market Routine
**Daily Setup Checklist:**
1. ✅ Identify the 3 nearest unmitigated highs above current price
2. ✅ Identify the 3 nearest unmitigated lows below current price
3. ✅ Note which are ancient (7+) - these are your "no-go" zones
4. ✅ Check the tunnel width (Δ in status row) - tight or wide?
5. ✅ Set alerts at the 1st high and 1st low for proximity warnings
6. ✅ Plan: "If we go up, I exit at ___. If we go down, I enter at ___."
### 🔄 Timeframe Confluence
**Multi-Timeframe Strategy:**
Run the indicator on **three instances**:
- **15-minute** (short-term structure)
- **1-hour** (intermediate structure)
- **4-hour** (major structure)
**Strong Setup**: When all three timeframes show unmitigated levels converging at the same price zone.
**Example:**
- 15m: Old low at 21,400
- 1H: Ancient low at 21,398
- 4H: Ancient low at 21,395
- **Result**: 21,395-21,400 is a monster support zone
### ⚠️ What This Indicator Doesn't Do
**Not a Crystal Ball**
- It doesn't predict where price will go
- It shows you where price *hasn't been* and how long it's been avoided
- The trading decisions are still yours
**Not an Entry Signal Generator**
- It provides context and structure
- You need to combine it with your entry methodology (price action, indicators, order flow, etc.)
**Not Foolproof**
- Ancient levels get broken
- Proximity alerts can trigger early in strong trends
- The market doesn't "owe" you a reversal at any level
---
## Common Scenarios
### Scenario 1: "Level Cluster Ahead"
**Situation**: You're long at 21,400. The table shows:
- 1st High: 21,425 (2 sessions old)
- 2nd High: 21,428 (3 sessions old)
- 3rd High: 21,435 (6 sessions old)
**Interpretation**: There's a resistance cluster just 25-35 points away. The 6-session-old level is particularly significant.
**Action**:
- Set first profit target at 21,420 (before the cluster)
- Set second target at 21,426 (between 1st and 2nd)
- Trail remaining position, but be ready to exit on rejection at 21,435
**Cave Diving Analogy**: You're approaching an overhead section with limited clearance. Lighten your load (reduce position) before entering.
---
### Scenario 2: "Ancient Level Approaches"
**Situation**: The market is grinding higher. You see ⚠️ appear next to a 9-session-old high at 21,500.
**Interpretation**: This level has survived over a week without being touched. Massive potential liquidity zone.
**Action**:
- If long, this is your absolute exit zone. Take profits before or at level.
- If looking to short, wait for clear rejection (price taps and reverses)
- Don't try to buy the breakout until it clearly breaks and retests
**Cave Diving Analogy**: Your dive computer is beeping - you've reached your planned turn-back depth. No matter how interesting it looks ahead, honor your plan.
---
### Scenario 3: "Mitigated Levels Create New Structure"
**Situation**: Price breaks and mitigates the 1st High. The previous 2nd High becomes the new 1st High.
**Interpretation**: The structure just shifted. What was the 2nd level is now most relevant.
**Action**:
- Watch how price reacts to the newly-mitigated level
- If it holds below (acts as resistance), bearish
- If it reclaims and holds above (acts as support), bullish
- The NEW 1st High is your next target/resistance
**Cave Diving Analogy**: You've passed through a restriction - the cave layout ahead is different now. Update your mental map.
---
### Scenario 4: "Tight Tunnel, Upcoming Breakout"
**Situation**: The Δ in the status row shows 3.25 points (very tight). Bands are converging.
**Interpretation**: Price is consolidating between very close unmitigated levels. Breakout likely.
**Action**:
- Don't try to predict direction
- Set alerts above 1st High and below 1st Low
- When break occurs, trade the retest
- Expect volatility - use wider stops
**Cave Diving Analogy**: You're in a narrow passage. Movement will be sudden and directional once it starts.
---
### Scenario 5: "Imbalanced Structure"
**Situation**: The statistics row shows "📊 22↑ / 7↓"
**Interpretation**: There are many more unmitigated highs than lows. This suggests:
- Price has been declining (hitting lows, leaving highs behind)
- Potential bullish reversal zone (lots of overhead supply mitigated)
- Or continued bearish structure (resistance everywhere above)
**Action**:
- Look at the age of those 22 highs
- If mostly new (0-2 sessions): Just a recent downmove, not significant yet
- If many old/ancient: Strong overhead resistance, be cautious on longs
- Compare to price action: Is price respecting the remaining lows?
**Cave Diving Analogy**: You've swam deeper than your starting point - most of your markers are above you now. Are you planning the ascent or going deeper?
---
## Final Thoughts: The Philosophy
This indicator is built on a simple but powerful principle: **The market has memory, and that memory has weight.**
Every unmitigated level represents:
- Liquidity left behind
- Orders waiting to be filled
- Institutional interest potentially parked
- Psychological significance for participants
The longer a level remains unmitigated, the more "charged" it becomes. When price finally revisits it, something significant usually happens - either a strong reversal or a definitive break.
Your job as a trader isn't to predict which outcome will occur. Your job is to:
1. **Recognize** when you're approaching these charged zones
2. **Respect** them by adjusting position size and risk
3. **React** appropriately based on how price behaves at them
4. **Remember** that ancient levels (like ancient wisdom) deserve extra reverence
The Cave Diving Framework embedded in this indicator serves as a constant reminder: Trading, like cave diving, requires rigorous respect for environmental hazards, meticulous planning, and the discipline to turn back when your limits are reached.
**Every proximity alert is the market asking you**: *"Do you really want to go deeper?"*
Sometimes the answer is yes - when your setup, confluence, and risk management all align.
Often, the answer should be no - and that's the trader avoiding the accident that would have happened to the gambler.
---
### 🎯 Quick Reference Card
**Color System:**
- 🟢 Bright colors = New (0-1 sessions) = Shallow water
- 🟡 Medium colors = Medium (2-3 sessions) = Penetration depth
- 🔴 Dark colors = Old (4-6 sessions) = Deep dive zone
- 🟣 Deep dark colors = Ancient (7+ sessions) = Overhead environment
**Symbols:**
- ↑ ↑↑ ↑↑↑ ↑↑↑↑ ↑↑↑↑↑ = High levels (1st through 5th)
- ↓ ↓↓ ↓↓↓ ↓↓↓↓ ↓↓↓↓↓ = Low levels (1st through 5th)
- ⚠️ = Proximity alert (danger zone)
- 🟢 = Bullish structure
- 🔴 = Bearish structure
- Δ = Tunnel width (distance between 1st high and 1st low)
**Critical Rules:**
1. Never fight ancient levels (7+ sessions)
2. Respect proximity alerts (⚠️)
3. Scale out near old/ancient resistance
4. Wait for confluence when entering
5. Let mitigated levels prove their new role
---
**Remember**: The indicator gives you structure. The trading edge comes from your discipline in respecting that structure.
Trade safe, trade smart, and always know your exit before your entry. 🎯
---
*"You don't become your best self by denying your patterns. You become your best self by recognizing them, understanding them, and choosing differently." - Adapted from The Mountain Is You*
In trading: You don't become profitable by ignoring market structure. You become profitable by recognizing it, understanding it, and choosing your entries accordingly.

Cross-Option Pair Intelligence# Elite Cross-Option Pair Intelligence System
## **Discover Options Trades BEFORE The Breakout - Institutional Cross-Strike Compression Analysis**
***
## **🔥 THE GAME-CHANGING DIFFERENCE**
Most option traders wait for price to move, then chase expensive options. **This indicator does the opposite** - it identifies **low-risk option combinations** where Call and Put premiums are **compressed (similar prices)** across different strikes, then alerts you **before the breakout** happens.
### **What Makes This Unique?**
This is the **ONLY indicator on TradingView** that performs **cross-strike compression analysis** - comparing EVERY Call option premium with EVERY Put option premium to find the **sweet spot** where:
✅ Premiums are nearly equal (low volatility skew)
✅ Time decay risk is minimized
✅ Market is coiled and ready to explode
✅ Risk-reward is optimal
**When compression breaks = High-probability directional move!**
***
## **📊 HOW IT WORKS - INSTITUTIONAL METHODOLOGY**
### **Step 1: Cross-Option Pair Matrix Analysis**
The indicator fetches **real-time premium data** from 8 customizable strikes and performs a **matrix comparison**:
```
25800 CE vs 25500 PE ✓
25800 CE vs 25550 PE ✓
25800 CE vs 25600 PE ✓
... (64 total comparisons)
```
**When it finds:** `25750 CE (₹120) ≈ 25700 PE (₹118)` → **COMPRESSION DETECTED! ✓✓**
### **Step 2: Lowest Price Match Identification**
The system identifies the **cheapest compressed pair** - this is your **optimal entry zone** because:
- **Low premium** = Lower capital risk
- **Compression** = Fair pricing (no IV inflation)
- **Cross-strike match** = Market indecision = Breakout imminent
### **Step 3: Compression Zone Tracking**
The indicator draws a **yellow compression box** on your chart and tracks:
- How long compression persists (minimum 3 bars default)
- Price boundaries during compression
- Volume and momentum buildup
### **Step 4: Breakout Signal Generation**
When price breaks out of compression with:
- ✅ **High volume surge** (1.3x+ average)
- ✅ **Strong momentum** (ATR-based)
- ✅ **RSI confirmation** (>55 bullish, <45 bearish)
**→ BUY CALL or BUY PUT signal fires!**
***
## **🎯 REAL TRADING EXAMPLE**
**Scenario:** NIFTY consolidating around 25,700
**What You See:**
1. **Option Chain Table** shows:
- 25750 CE: ₹115 ✓
- 25700 PE: ₹112 ✓✓
- **Status: "Lowest Price Match: 25750CE / 25700PE ✓"**
2. **Chart displays:**
- Yellow compression box between 25,680 - 25,720
- "⚠️ COMPRESSION ZONE ACTIVE - PREPARE FOR BREAKOUT"
3. **Price breaks above 25,720 with volume**
- 🔥 **BUY CALL signal appears!**
- **Strike: 25750CE**
- **Entry: ₹25,735**
- **T1: ₹25,795 (1.5x compression range)**
- **T2: ₹25,855 (2.5x compression range)**
- **SL: ₹25,680 (compression low)**
**Result:** You bought the option **BEFORE** the move, at **compressed premium**, with **clear targets and stop loss**!
***
## **💎 KEY FEATURES**
### **1. Live NSE Option Chain Display**
- Real-time premium tracking for 8 strikes
- Color-coded compression zones (Green ✓✓)
- Automatically highlights lowest price match
- Works with NIFTY, BANKNIFTY, FINNIFTY
### **2. Cross-Strike Compression Detection**
- Compares ALL Calls with ALL Puts (64 comparisons)
- Identifies similar premiums across different strikes
- Finds the cheapest compressed pair automatically
- Adjustable compression tolerance (1-20 points)
### **3. Visual Compression Zone**
- Yellow box on chart showing consolidation
- Real-time boundary updates
- Background color highlighting
- Duration tracking (min bars configurable)
### **4. Smart Breakout Signals**
- Multi-factor confirmation (Price + Volume + RSI + ATR)
- Directional labels: "🔥 BUY CALL" or "🔥 BUY PUT"
- Shows exact strike to trade
- Entry price displayed on label
### **5. Automatic Target Calculation**
- T1: 1.5x compression range expansion
- T2: 2.5x compression range expansion
- Stop Loss: Compression boundary
- Visual target lines on chart
### **6. Professional Table Display**
- Top: Option chain with live premiums
- Strikes highlighted when compressed
- Market status indicator
- Fully customizable position and size
### **7. Alert System**
- Compression zone entry alert
- Buy Call/Put signal alerts
- Includes strike, entry, and targets
- One alert per bar (no spam)
***
## **⚙️ CONFIGURATION - FULLY CUSTOMIZABLE**
### **Option Chain Setup:**
- Choose Index: NIFTY / BANKNIFTY / FINNIFTY
- Set Expiry: YYMMDD format (e.g., 251226)
- Configure 8 strikes manually (50-point intervals typical)
### **Compression Detection:**
- **Tolerance:** 1-20 points (default 5.0)
- Lower = Stricter compression
- Higher = More matches found
- **Min Duration:** 1-10 bars (default 3)
- Ensures persistent compression
### **Breakout Settings:**
- **ATR Multiplier:** 0.5-5.0 (default 1.5)
- **Volume Threshold:** 1.0-3.0x (default 1.3x)
- **RSI Bullish/Bearish:** 55/45 default
### **Display Options:**
- Enable/disable table, compression box, labels, targets
- Table position: Top/Middle/Bottom × Left/Center/Right
- Text size: Tiny/Small/Normal
***
## **📈 TRADING STRATEGY GUIDE**
### **For Intraday Traders:**
1. **Morning Setup:**
- Apply indicator to 5-min NIFTY/BANKNIFTY chart
- Check option chain table for compression
2. **Wait for Compression:**
- Watch for green checkmarks (✓✓) in table
- Note the "Lowest Price Match" strikes
- Compression zone box appears on chart
3. **Entry Signal:**
- Wait for breakout signal (BUY CALL/PUT label)
- Enter the exact strike shown
- Set stop loss at compression boundary
4. **Exit Strategy:**
- Take partial profit at T1 (1.5x move)
- Trail stop loss to entry
- Full exit at T2 (2.5x move)
### **For Swing Traders:**
1. **Daily Chart Analysis:**
- Apply to daily timeframe
- Look for multi-day compression zones
- Larger compression = Bigger breakout potential
2. **Position Sizing:**
- Compression zones on daily = Higher confidence
- Can hold options for multiple days
- Targets are proportionally larger
### **For Option Sellers:**
1. **Compression = Volatility Crush Zone**
- When compression detected, IV is balanced
- Consider selling strangles/straddles INSIDE compression
- Exit when breakout signal fires
***
## **🎓 UNDERSTANDING THE EDGE**
### **Why Cross-Strike Compression Works:**
**Traditional Approach:**
- Traders compare same strike: "25700 CE vs 25700 PE"
- Limited information
- Miss the bigger picture
**Institutional Approach (This Indicator):**
- Compare ALL strikes: "25750 CE vs 25700 PE"
- **Reveals true market structure**
- Shows where smart money is positioned
### **The Psychology Behind It:**
When a **Call at 25750** trades at the same premium as a **Put at 25700**:
1. **Option writers** (institutions) see balanced risk
2. **Implied volatility** is not inflated
3. **Market makers** are comfortable with prices
4. **Time decay** is priced fairly
**This creates a LOW-RISK entry point!**
When compression breaks → Market has chosen direction → Follow with confidence!
***
## **⚡ TECHNICAL SPECIFICATIONS**
### **Indicator Type:**
- Overlay: Yes (signals on price chart)
- Separate Pane: No
- Max Labels: 500
- Max Lines: 500
- Max Boxes: 500
### **Data Requirements:**
- Works with NSE option data
- Requires TradingView Pro/Premium for multiple `request.security()` calls
- Real-time or delayed data supported
- Minimum timeframe: 1-minute
### **Option Symbol Format:**
- NSE standard: `NSE:NIFTY251226C25700`
- Automatically constructed from inputs
- Supports all NSE option contracts
### **Performance:**
- 8 Call options fetched
- 8 Put options fetched
- 64 cross-comparisons per bar
- Optimized array operations
- No repainting
***
## **🚀 QUICK START GUIDE**
### **Step 1: Add to Chart**
1. Open NIFTY or BANKNIFTY chart (any timeframe)
2. Add "Guru Dronacharya - Cross-Option Pair Intelligence"
3. Chart will show option chain table on right side
### **Step 2: Configure Strikes**
1. Check current spot price (e.g., 25,700)
2. Set Strike 5 (ATM) = 25700
3. Set other strikes in 50-point intervals:
- Strike 1: 25500
- Strike 2: 25550
- Strike 3: 25600
- Strike 4: 25650
- Strike 5: 25700 (ATM)
- Strike 6: 25750
- Strike 7: 25800
- Strike 8: 25850
### **Step 3: Set Expiry**
1. Find current/next weekly expiry
2. Format as YYMMDD (e.g., 26-Dec-2025 = 251226)
3. Enter in "Expiry" input field
### **Step 4: Watch for Signals**
- Green ✓✓ in table = Compression detected
- Yellow box on chart = Consolidation zone
- 🔥 BUY CALL/PUT label = Trade signal!
***
## **💡 PRO TIPS**
### **Best Timeframes:**
- **5-min:** Intraday scalping (3-5 signals/day)
- **15-min:** Swing intraday (1-2 signals/day)
- **Daily:** Positional trades (high-conviction setups)
### **Best Market Conditions:**
- ✅ **Consolidation after trend:** Compression forms naturally
- ✅ **Pre-event/news:** IV crush opportunities
- ✅ **Range-bound markets:** Multiple compression zones
- ❌ **Strong trending markets:** Less compression, more chasing
### **Risk Management:**
- Never risk more than 2% account per trade
- Always use stop loss (provided automatically)
- Take partial profits at T1
- Let winners run to T2
### **Strike Selection:**
- ATM ± 4 strikes covers 90% of scenarios
- Wider range for high volatility (BANKNIFTY)
- Adjust strikes if price moves >2% from center
***
## **🏆 WHAT TRADERS ARE SAYING**
✅ **"Finally, an indicator that shows option premiums on the chart!"**
✅ **"The cross-strike compression detection is genius - never seen this before"**
✅ **"Stopped me from chasing expensive options after the move"**
✅ **"The table shows exactly which strike to trade - no guesswork"**
✅ **"Compression zones work like magic - high win rate setups"**
***
## **⚠️ IMPORTANT NOTES**
### **Data Requirements:**
- Requires TradingView Premium or Pro subscription
- NSE option data must be available
- Some strikes may show 0 if not listed/traded
### **Not Financial Advice:**
- This is an analysis tool, not trading advice
- Always do your own research
- Options trading carries significant risk
- Past performance ≠ future results
### **Best Practices:**
- Test on paper/demo account first
- Start with small position sizes
- Understand option Greeks before trading
- Never trade illiquid strikes
- Check bid-ask spreads before entry
***
## **📞 SUPPORT & UPDATES**
- **Version:** 1.0 (December 2025)
- **Pine Script:** v5
- **Updates:** Regular improvements based on feedback
- **Documentation:** Detailed tooltips in settings
- **Community:** Comment section for questions
***
## **🎯 WHO IS THIS FOR?**
### **Perfect For:**
✅ Options traders (beginner to advanced)
✅ Intraday scalpers looking for edge
✅ Swing traders seeking high-probability setups
✅ Traders who want to BUY options at fair value
✅ Anyone tired of chasing expensive options after the move
### **Not Suitable For:**
❌ Stock/equity traders only
❌ Long-term investors
❌ Traders without option trading knowledge
❌ Users without TradingView Premium/Pro
***
## **🌟 FINAL WORDS**
**Guru Dronacharya** brings **institutional-grade cross-option pair analysis** to retail traders for the first time.
The ability to see **real-time compression** between Calls and Puts across different strikes is a **game-changer** that was previously only available to professional trading desks.
**Stop chasing expensive options.**
**Start trading compression breakouts.**
**Let the market show you where the smart money is positioned.**
***
## **📊 TECHNICAL TAGS**
`#Options` `#NIFTY` `#BANKNIFTY` `#OptionsTrading` `#Compression` `#Breakout` `#PairTrading` `#PremiumAnalysis` `#CrossStrike` `#OptionChain` `#NSE` `#IndianMarket` `#IntradayTrading` `#SwingTrading` `#OptionStrategy` `#VolatilityAnalysis` `#InstitutionalTrading` `#SmartMoney`
***
**Install now and discover the edge professional traders have been using for years!** 🚀📈
***
*Disclaimer: Options trading involves substantial risk of loss. This indicator is for educational and analytical purposes only. Always consult with a qualified financial advisor before making trading decisions.*
