Pulsar Trading System-LITE📡 Pulsar Trading System
OVERVIEW
Pulsar is a comprehensive breakout trading system that combines dynamic support/resistance detection, trend filtering, and volume confirmation to identify high-probability entry opportunities. Unlike simple breakout indicators, Pulsar uses multi-timeframe analysis and adaptive ATR-based calculations to filter false signals and provide complete trade management from entry to exit.
WHAT MAKES THIS ORIGINAL
This indicator is unique in its integration of multiple complementary systems:
-Adaptive ATR Zones: Support and resistance levels are not static—they dynamically adjust based on current market volatility (ATR), creating entry zones that expand and contract with market conditions rather than using fixed price levels.
-Multi-Timeframe SuperTrend Filter: The trend filter operates on a higher timeframe than the chart (e.g., 5-minute SuperTrend on a 1-minute chart) to prevent counter-trend trades while maintaining granular entry precision. The visual ribbon with humorous warning text ("🚫 Don't Short - Trend is Your Friend! 📈") provides immediate trend awareness.
-Intelligent Cooldown System: After any trade exit (stop loss or take profit), the system enters a configurable cooldown period, preventing overtrading during choppy or consolidating market conditions—a critical feature often missing in breakout systems.
-Dynamic Trailing Stops: The trailing stop uses ATR multipliers to lock in profits while adapting to volatility, moving only in the favorable direction and never loosening.
-Comprehensive Dashboard: Real-time analysis displays trade status, entry prices, distances to targets in both points and ATR multiples, volume confirmation status, and cooldown countdown.
HOW IT WORKS
Core Detection Logic:
Pulsar identifies breakout opportunities by monitoring price interaction with dynamically calculated support and resistance levels:
Support/Resistance Calculation: Uses ta.lowest() and ta.highest() over a configurable lookback period to identify key levels, then adds ATR-based buffers (0.5 × ATR) to create entry zones.
Breakout Conditions:
Long Entry: Price closes above support buffer AND recent low touched support AND volume exceeds threshold
Short Entry: Price closes below resistance buffer AND recent high touched resistance AND volume exceeds threshold
SuperTrend Filter: A separate higher-timeframe SuperTrend calculation determines overall trend direction. Entries only trigger when breakout direction aligns with SuperTrend (bullish breakout + bullish trend, or bearish breakout + bearish trend).
Volume Confirmation: Current volume must exceed a configurable multiple of the 14-period SMA (default 1.0×) to confirm genuine interest in the breakout.
Cooldown Mechanism: After exit, the system tracks bars elapsed and blocks new signals until the cooldown period completes, preventing rapid-fire entries in ranging markets.
Trade Management:
Stop Loss: Calculated as entry zone ± (ATR × SL Multiplier)
Take Profit 1: Entry zone ± (ATR × TP1 Multiplier)
Take Profit 2: Entry zone ± (ATR × TP2 Multiplier)
Trailing Stop (optional): Updates every bar, moving the stop closer by maintaining distance of (ATR × Trailing Multiplier) from current price, but only in favorable direction
SuperTrend Calculation:
The SuperTrend uses standard methodology:
Upper Band = (High + Low) / 2 + (Multiplier × ATR)
Lower Band = (High + Low) / 2 - (Multiplier × ATR)
Direction changes when price crosses opposite band
The ribbon visualization adds a width offset (ATR × Ribbon Width) to create a filled zone rather than a single line.
HOW TO USE
Setup:
Add Pulsar to your chart (works best on liquid instruments like NQ, ES, CL)
Configure timeframe-specific settings (see recommendations below)
Enable SuperTrend Filter for trend-following mode, or disable for pure breakout mode
Set up alerts for Entry, TP1, TP2, and Stop Loss events
Recommended Settings by Timeframe:
1-Minute Charts:
Lookback Period: 10-15
SuperTrend Timeframe: 5 min
ATR Timeframe: 5 min (for stability)
Cooldown: 8-12 bars
Trailing Stop: Enabled with 0.8-1.0 multiplier
5-Minute Charts:
Lookback Period: 15-20
SuperTrend Timeframe: 15 min
ATR Timeframe: current chart
Cooldown: 5-8 bars
Trailing Stop: Optional
15-Minute+ Charts:
Lookback Period: 20-30
SuperTrend Timeframe: 1 hour
ATR Timeframe: current chart
Cooldown: 3-5 bars
Trailing Stop: Optional
Interpreting Signals:
Long/Short Zone Box: Green (long) or red (short) box appears when breakout conditions are met
Blue Entry Line: Shows your entry price
Red/Orange SL Line: Red = fixed stop, Orange = trailing stop (moves in real-time)
Green TP Lines: TP1 (closer) and TP2 (further) targets
SuperTrend Ribbon: Green = bullish trend (favor longs), Red = bearish trend (favor shorts)
Dashboard Status: Monitor trade state, distances, volume confirmation, and cooldown
Best Practices:
Use SuperTrend Filter: Significantly reduces false signals by avoiding counter-trend trades
Enable Cooldown on Fast Timeframes: Prevents overtrading on 1-5 minute charts
Volume Confirmation is Critical: Don't lower volume multiplier below 0.9 on futures
Use Higher Timeframe ATR: On 1-minute charts, use 5-minute ATR for stability
Avoid Major News Events: Disable during FOMC, NFP, CPI releases
Scale Out Strategy: Consider taking partial profits at TP1, letting remainder run to TP2
Parameter Optimization:
Start conservative and adjust based on results:
Too many stop-outs: Increase SL multiplier or SuperTrend multiplier
Missing good trades: Decrease volume multiplier or cooldown period
Too many false signals: Increase volume multiplier, lookback period, or cooldown
Profits not protected: Enable trailing stop or reduce trailing multiplier
KEY FEATURES
✅ Dynamic ATR-Based Zones: Entry, stop loss, and take profit levels automatically adjust to market volatility
✅ Multi-Timeframe Trend Filter: Uses higher timeframe SuperTrend to eliminate counter-trend trades
✅ Volume Confirmation: Filters low-volume false breakouts
✅ Intelligent Cooldown: Prevents overtrading with configurable post-trade waiting period
✅ Trailing Stop System: Optional dynamic stops that lock in profits using ATR distance
✅ Real-Time Dashboard: 13-row analysis showing trade status, targets, distances, volume, and cooldown
✅ Visual Ribbon Warnings: Humorous trend-following reminders on SuperTrend ribbon
✅ Complete Alert System: Notifications for entries, TP1, TP2, fixed stops, and trailing stops
✅ Customizable Visuals: Adjustable colors, dashboard position, text size, and line lengths
✅ Non-Repainting: Uses lookahead = barmerge.lookahead_off for all multi-timeframe calculations
SETTINGS EXPLAINED
SuperTrend Filter:
Enable: Toggle trend filtering on/off
Timeframe: Higher timeframe for trend analysis (recommended 3-5x chart timeframe)
ATR Period: Period for ATR calculation in SuperTrend (10-14 standard)
Multiplier: Distance from center band (2.5-3.5 for most markets)
Ribbon Width: Visual thickness of trend ribbon (0.2-0.5)
Core Parameters:
Lookback Period: Bars used to identify support/resistance (lower = more sensitive)
ATR Period: Bars for Average True Range calculation (14 is standard)
ATR Timeframe: Use higher timeframe ATR for smoother calculations on fast charts
Volume Multiplier: Required volume vs average (1.0 = average, 1.5 = 50% above average)
TP/SL:
SL Multiplier: Stop loss distance in ATR units (1.0-2.0 typical)
TP1 Multiplier: First target in ATR units (1.5-2.5 typical)
TP2 Multiplier: Second target in ATR units (2.0-3.5 typical)
Trailing Stop:
Enable: Activate dynamic trailing stop
Multiplier: Distance from current price in ATR units (0.8-1.5 typical)
Cooldown:
Enable: Prevent new signals after trade exit
Bars: Number of bars to wait before allowing next trade (higher on fast timeframes)
IMPORTANT NOTES
⚠️ Not a Holy Grail: No indicator is perfect. Pulsar is a tool that requires proper risk management, position sizing, and trading discipline.
⚠️ Backtest First: Test settings on historical data before live trading. Results vary by instrument, timeframe, and market conditions.
⚠️ Market Conditions Matter: Breakout systems perform best in trending markets. Consider reducing size or disabling during known choppy periods.
⚠️ Stop Loss is Mandatory: Always use the provided stop loss levels. Markets can move against you rapidly.
⚠️ Volume Data Required: This indicator requires volume data to function properly. It will display a warning if volume is unavailable.
⚠️ No Repainting: All multi-timeframe calls use non-repainting settings. What you see in real-time is what will be plotted historically.
TECHNICAL SPECIFICATIONS
Version: Pine Script v6
Type: Indicator (overlay = true)
Max Boxes: 500 (for zone visualization)
Max Lines: 500 (for TP/SL levels)
Max Labels: Unlimited (for annotations)
Repainting: None (uses lookahead = barmerge.lookahead_off)
COMPATIBLE INSTRUMENTS
Works best on liquid instruments with reliable volume data:
✅ Futures: NQ, MNQ, ES, MES, YM, MYM, RTY, M2K, CL, GC
✅ Forex: Major pairs (EUR/USD, GBP/USD, etc.)
✅ Stocks: Large-cap stocks with high volume
⚠️ Crypto: Works but requires higher ATR multipliers
❌ Low Volume Stocks: May produce unreliable signals
SUPPORT
For questions, suggestions, or to report issues, please comment below. I actively maintain this indicator and appreciate feedback from the community.
Enjoy trading with Pulsar! 🌟
Pesquisar nos scripts por "entry"

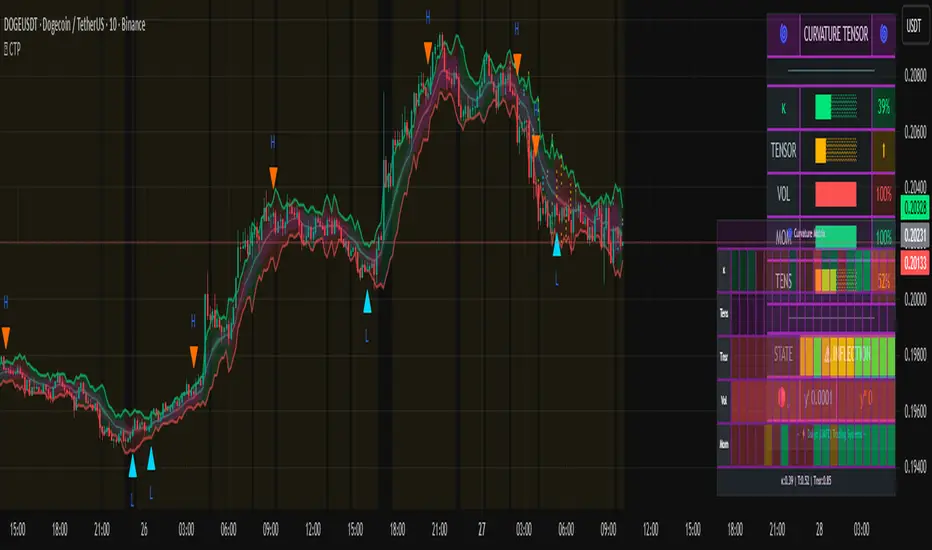
Curvature Tensor Pivots🌀 Curvature Tensor Pivots
Curvature Tensor Pivots: Geometric Pivot Detection Through Differential Geometry
Curvature Tensor Pivots applies mathematical differential geometry to market price analysis, identifying pivots by measuring how price trajectories bend through space. Unlike traditional pivot indicators that rely solely on price highs and lows, this system calculates the actual geometric curvature of price paths and detects inflection points where the curvature changes sign or magnitude—the mathematical hallmarks of directional transitions.
The indicator combines three components: precise curvature measurement using second-derivative calculus, tensor weighting that multiplies curvature by volatility and momentum, and a tension-based prediction system that identifies compression before pivots form. This creates a forward-looking pivot detector with built-in confirmation mechanics.
What Makes This Original
Pure Mathematical Foundation
This indicator implements the classical differential geometry curvature formula κ = |y''| / (1 + y'²)^(3/2), which measures how sharply a curve bends at any given point. In price analysis, high curvature indicates sharp directional changes (active pivots), while curvature approaching zero indicates straight-line motion (inflection points forming). This mathematical approach is fundamentally different from pattern recognition or statistical pivots—it measures the actual geometry of price movement.
Tensor Weighting System
The core innovation is the tensor scoring mechanism, which multiplies geometric curvature by two market-state variables: volatility (ATR expansion/compression) and momentum (rate of change strength). This creates a multi-dimensional strength metric that distinguishes between meaningful pivots and noise. A high tensor score means high curvature is occurring during significant volatility with strong momentum—a genuine structural turning point. Low tensor scores during high curvature indicate choppy, low-conviction moves.
Tension-Based Prediction
The system calculates tension as the inverse of curvature (Tension = 1 - κ). When curvature is low, tension is high, indicating price is moving in a straight line and approaching an inflection point where it must curve. The tension cloud visualizes this compression, tightening before pivots form and expanding after they complete. This provides anticipatory signals rather than purely reactive confirmation.
Integrated Confirmation Architecture
Rather than simply flagging high curvature, the system requires convergence of four elements: geometric inflection detection (sign changes in second derivative or curvature extrema), traditional price structure pivots (pivot highs/lows), tensor strength above threshold, and minimum spacing between signals. This multi-layer confirmation prevents false signals while maintaining sensitivity to genuine turning points.
This is not a combination of existing indicators—it's an application of pure mathematical concepts (differential calculus and tensor algebra) to market geometry, creating a unique analytical framework.
Core Components and How They Work Together
1. Differential Geometry Engine
The foundation is calculus-based trajectory analysis. The system treats price as a function y(t) and calculates:
First derivative (y'): The slope of the price trajectory, representing directional velocity
Second derivative (y''): The acceleration of slope change, representing how quickly direction is shifting
Curvature (κ): The normalized geometric bend, calculated using the formula κ = |y''| / (1 + y'²)^(3/2)
This curvature value is then normalized to a 0-1 range using adaptive statistical bounds (mean ± 2 standard deviations over a rolling window). High κ values indicate sharp bends (active pivots), while κ approaching zero indicates inflection points where the trajectory is straightening before changing concavity.
2. Tensor Weighting Components
The raw curvature is weighted by market dynamics to create the tensor score:
Volatility Component: Calculated as current ATR divided by baseline ATR (smoothed average). Values above 1.0 indicate expansion (higher conviction moves), while values below 1.0 indicate compression (lower reliability). This ensures pivots forming during volatile periods receive higher scores than those in quiet conditions.
Momentum Component: Measured using rate of change (ROC) strength normalized by recent average. High momentum indicates sustained directional pressure, confirming that curvature changes represent genuine trend shifts rather than noise.
Tensor Score Fusion: The final tensor score = κ × Volatility × Momentum × Direction × Gain. This creates a directional strength metric ranging from -1 (strong bearish curvature) to +1 (strong bullish curvature). The magnitude represents conviction, while the sign represents direction.
These components work together by filtering geometric signals through market-state context. A high curvature reading during low volatility and weak momentum produces a low tensor score (likely noise), while the same curvature during expansion and strong momentum produces a high tensor score (likely genuine pivot).
3. Inflection Point Detection System
Inflection points occur where the second derivative changes sign (concave to convex or vice versa) or where curvature reaches local extrema. The system detects these through multiple methods:
Sign change detection: When y'' crosses zero, the price trajectory is transitioning from curving upward to downward (or vice versa)
Curvature extrema: When κ reaches a local maximum or minimum, indicating peak bend intensity
Near-zero curvature: When κ falls below an adaptive threshold, indicating straight-line motion before a directional change
These geometric signals are combined with traditional pivot detection (pivot highs and lows using configurable lookback/lookahead periods) to create confirmed inflection zones. The geometric math identifies WHERE inflections are forming, while price structure confirms WHEN they've completed.
4. Tension Cloud Prediction
Tension is calculated as 1 - κ, creating an inverse relationship where low curvature produces high tension. This represents the "straightness" of price trajectory—when price moves in a straight line, it's building tension that must eventually release through a curved pivot.
The tension cloud width adapts to this tension value: it tightens (narrows) when curvature is low and tension is high, providing visual warning that a pivot is forming. After the pivot completes and curvature increases, tension drops and the cloud expands, confirming the turn.
This creates a leading indicator component within the system: watch for the cloud to compress, then wait for the pivot marker and tensor direction confirmation to enter trades.
5. Multi-Layer Visualization System
The visual components work hierarchically:
Curvature ribbons (foundation): Width expands with curvature magnitude, color shifts with tensor direction (green bullish, red bearish)
Tension cloud (prediction): Purple overlay that compresses before pivots and expands after
Tensor waves (context): Harmonic oscillating layers driven by three phase accumulators (curvature, tensor magnitude, volatility), creating visual texture that becomes erratic before pivots and smooth during trends
Inflection zones (timing): Golden background highlighting when geometric conditions indicate inflection points forming
Pivot markers (confirmation): Triangles marking confirmed pivots where geometric inflection + price structure + tensor strength all align
Each layer adds information without redundancy: ribbons show current state, tension shows prediction, waves show regime character, zones show geometric timing, and markers show confirmed entries.
Calculation Methodology
Phase 1 - Derivative Calculations
Price is normalized by dividing by a 50-period moving average to improve numerical stability. The first derivative is calculated as the bar-to-bar change, then smoothed using a configurable smoothing length (default 3 bars) to reduce noise while preserving structure.
The second derivative is calculated as the bar-to-bar change in the first derivative, also smoothed. This represents the acceleration of directional change—positive values indicate price is curving upward (concave up), negative values indicate curving downward (concave down).
Phase 2 - Curvature Formula
The classical curvature formula is applied:
Calculate y'² (first derivative squared)
Calculate (1 + y'²)^1.5 as the denominator
Divide |y''| by this denominator to get raw curvature κ
This formula ensures curvature is properly normalized regardless of the steepness of the trajectory. A vertical line with high slope (large y') can still have low curvature (straight), while a gradual slope with changing direction produces high curvature (curved).
The raw curvature is then normalized to 0-1 range using adaptive bounds (rolling mean ± 2 standard deviations), allowing the system to adapt to different market volatility regimes.
Phase 3 - Tensor Weighting
ATR is calculated over the specified volatility length (default 14). Current ATR is divided by smoothed ATR to create the volatility ratio. Momentum is calculated as the rate of change over the momentum length (default 10), normalized by recent average ROC.
The tensor score is computed as: Curvature × Volatility × Momentum × Tensor Gain × Direction Sign
This creates the final directional strength metric used for ribbon coloring and signal generation.
Phase 4 - Inflection Detection
Multiple conditions are evaluated simultaneously:
Second derivative sign changes (y'' × y'' < 0)
Curvature local maxima (previous bar κ > current bar κ AND previous bar κ > two bars ago κ)
Curvature local minima (opposite condition)
Low curvature threshold (current κ < adaptive threshold)
Any of these conditions triggers inflection zone highlighting. For confirmed pivot signals, inflection detection must coincide with traditional pivot highs/lows AND tensor magnitude must exceed threshold AND minimum spacing since last signal must be satisfied.
Phase 5 - Tension Calculation
Tension = 1 - κ (smoothed)
This inverse relationship creates the compression/expansion dynamic. When curvature approaches zero (straight trajectory), tension approaches 1 (maximum compression). When curvature is high (sharp bend), tension approaches zero (released).
The tension cloud bands are calculated as: Basis ± (Ribbon Width × Tension)
This creates the visual tightening effect before pivots.
Phase 6 - Wave Generation
Three phase accumulators are maintained:
Phase 1: Accumulates based on curvature magnitude (0.1 × κ per bar)
Phase 2: Accumulates based on tensor magnitude (0.15 × tensor per bar)
Phase 3: Accumulates based on volatility (0.08 × volatility per bar)
For each wave layer (2-8 configurable), a unique frequency is used (layer number × 0.6). The wave offset is calculated as:
Amplitude × (sin(phase1 × frequency) × 0.4 + sin(phase2 × frequency × 1.2) × 0.35 + sin(phase3 × frequency × 0.8) × 0.25)
This creates complex harmonic motion that reflects the interplay of curvature, strength, and volatility. When these components are aligned, waves are smooth; when misaligned (pre-pivot conditions), waves become chaotic.
All calculations are deterministic and execute on closed bars only—there is no repainting.
How to Use This Indicator
Setup and Configuration
Apply the indicator to your chart with default settings initially
Enable the main dashboard (top right recommended) to monitor curvature, tensor, and tension metrics in real-time
Enable the curvature matrix (bottom right) to see historical patterns in the heatmap
Choose your ribbon mode: "Dual Ribbon" shows both bullish and bearish zones, "Tension Cloud" emphasizes the compression zones
For your first session, observe how the tension cloud behaves before confirmed pivots—you'll notice it consistently tightens (narrows) before pivot markers appear, then expands after.
Signal Interpretation
High Pivot (Bearish) - Red triangle above price:
Occurs when price makes a pivot high (local maximum)
Second derivative is negative (concave down curvature)
Tensor magnitude exceeds threshold (strong confirmation)
Minimum spacing requirement met (noise filter)
Interpretation: A confirmed bearish inflection point has formed. Price trajectory has curved over and is transitioning from upward to downward movement.
Low Pivot (Bullish) - Blue triangle below price:
Occurs when price makes a pivot low (local minimum)
Second derivative is positive (concave up curvature)
Tensor magnitude exceeds threshold
Spacing requirement met
Interpretation: A confirmed bullish inflection point has formed. Price trajectory has curved upward and is transitioning from downward to upward movement.
Dashboard Metrics
κ (Curvature): 0-100% reading. Above 70% = sharp active pivot, 40-70% = moderate curve, below 40% = gentle or approaching inflection
Tensor: Directional strength. Arrow indicates bias (⬆ bullish, ⬇ bearish, ⬌ neutral). Magnitude indicates conviction.
Volatility: Current ATR expansion state. Above 70% = high volatility (pivots more significant), below 40% = compressed (pivots less reliable)
Momentum: Directional strength. High values confirm trend continuation, low values suggest exhaustion
Tension: 0-100% reading. Above 70% = pivot forming soon (high compression), below 40% = pivot recently completed (expanded)
State: Real-time regime classification:
"🟢 STABLE" = normal trending conditions
"🟡 TENSION" = pivot forming (high compression)
"🔴 HIGH κ" = active sharp pivot in progress
"⚠ INFLECTION" = geometric inflection zone (critical transition)
Curvature Matrix Heatmap
The matrix shows the last 30 bars (configurable 10-100) of historical data across five metrics:
κ row: Curvature evolution (green = low, yellow = moderate, red = high)
Tension row: Purple intensity shows compression building
Tensor row: Strength evolution (green = strong, yellow = moderate, red = weak)
Volatility row: Expansion state
Momentum row: Directional conviction
Pattern recognition: Look for purple clustering in the tension row followed by red spikes in the κ row—this shows compression → release pivot sequence.
Trading Workflow
Step 1 - Monitor Tension:
Watch the tension cloud and dashboard tension metric. When tension rises above 60-70% and the cloud visibly tightens, a pivot is building. The matrix will show purple bands clustering.
Step 2 - Identify Inflection Zone:
Wait for the golden background glow (inflection zone) to appear. This indicates the geometric conditions are met: curvature is approaching zero, second derivative is near sign change, or curvature extrema detected. The dashboard state will show "⚠ INFLECTION ZONE".
Step 3 - Confirm Direction:
Check the tensor arrow in the dashboard:
⬆ (bullish tensor) = expect bullish pivot
⬇ (bearish tensor) = expect bearish pivot
Also verify the y'' status in the dashboard:
"🔵↑ Concave Up" = bullish curvature forming
"🔴↓ Concave Down" = bearish curvature forming
Step 4 - Wait for Pivot Marker:
Do not enter on inflection zones alone—wait for the confirmed pivot marker (triangle). This ensures all confirmation layers have aligned: geometric inflection + price structure pivot + tensor strength + spacing filter.
Step 5 - Execute Entry:
Long entry: Blue triangle below price + ⬆ tensor + tension releasing (dropping)
Short entry: Red triangle above price + ⬇ tensor + tension releasing
Step 6 - Manage Risk:
Initial stop: Place beyond the opposite ribbon edge plus one ATR buffer
Trailing stop: Follow the ribbon edge (basis ± adaptive width) as curvature sustains in your direction
Exit signal: If tension spikes again quickly (another inflection forming), consider taking profit—the trend may be reversing
Best Practices
Use multiple timeframe confirmation: Check that higher timeframe tensor aligns with your trade direction
Respect the spacing filter: If a pivot just fired, wait for minimum spacing before taking another signal
Distinguish regime: In "🔴 HIGH κ" state (choppy), reduce position size; in "🟢 STABLE" state, full confidence
Combine with support/resistance: Pivots near key levels have higher probability
Watch particle density: Clustering of particles indicates rising curvature intensity
Observe wave texture: Smooth flowing waves = trending environment (pivots are reversals); chaotic erratic waves = reversal environment (pivots are trend starts)
Ideal Market Conditions
Best Performance
Liquid markets with clear swing structure (forex majors, large-cap stocks, major indices)
Timeframes from 15-minute to daily (the system adapts across timeframes)
Markets with periodic swings and clear directional phases (where geometric curvature is meaningful)
Trending markets with consolidation phases (where tension builds before breakouts)
Challenging Conditions
Extremely choppy/sideways markets for extended periods (high curvature but low tensor magnitude—system will reduce signals appropriately)
Very low liquidity instruments (erratic price action creates false geometric signals)
Ultra-low timeframes (1-minute or below) where spread and noise dominate structure
Markets in deep consolidation (the system will show high tension but no clean pivot confirmation)
The indicator is designed to adapt: in poor conditions, tensor scores remain low and signals reduce naturally. In optimal conditions, tension compression → inflection → pivot confirmation sequences occur cleanly.
Parameter Optimization by Trading Style
Scalping (5-15 Minute Charts)
Curvature Window: 3-5 (faster response)
Curvature Smoothing: 2 (minimal lag)
Volatility Length: 10-14
Momentum Length: 8-10
Tensor Gain: 1.2-1.5 (moderate sensitivity)
Inflection Threshold: 0.10-0.15 (more sensitive)
Min Pivot Spacing: 3-5 bars
Pivot Mode: Aggressive
Ribbon Mode: Dual Ribbon (clearer entries)
Day Trading (15-60 Minute Charts)
Curvature Window: 5 (default)
Curvature Smoothing: 3 (balanced)
Volatility Length: 14
Momentum Length: 10
Tensor Gain: 1.5 (default)
Inflection Threshold: 0.15 (default)
Min Pivot Spacing: 5-8 bars
Pivot Mode: Normal or Adaptive
Ribbon Mode: Dual Ribbon
Swing Trading (4-Hour to Daily Charts)
Curvature Window: 7-10 (smoother)
Curvature Smoothing: 4-5 (noise reduction)
Volatility Length: 20-30
Momentum Length: 14-20
Tensor Gain: 1.8-2.5 (higher conviction requirement)
Inflection Threshold: 0.20-0.30 (more selective)
Min Pivot Spacing: 8-12 bars
Pivot Mode: Conservative
Ribbon Mode: Tension Cloud (focus on compression zones)
Performance Optimization
If you experience lag on lower-end systems:
Reduce Wave Layers: 4 → 2 (50% reduction in calculations)
Lower Particle Density: 3 → 1 (66% reduction in label creation)
Decrease Matrix History: 30 → 15 bars (50% reduction in table size)
Disable Tensor Waves entirely if not needed for your trading
Important Disclaimers
- This indicator is a technical analysis tool designed to identify potential pivot points through mathematical analysis of price trajectory geometry. It should not be used as a standalone trading system. Always combine with proper risk management, position sizing, and additional confirmation methods (support/resistance, volume analysis, multi-timeframe alignment).
- The curvature and tensor calculations are deterministic mathematical formulas applied to historical price data—they do not predict future price movements with certainty. Past geometric patterns do not guarantee future pivot behavior. The tension-based prediction system identifies conditions where pivots are likely to form based on trajectory straightness, but market conditions can change rapidly.
- All trading involves risk. Use appropriate stop losses and never risk more than you can afford to lose. The signal spacing filters and tensor confirmation layers are designed to reduce noise, but no indicator can eliminate false signals entirely.
This system is most effective when combined with sound trading principles, market context awareness, and disciplined execution.
Technical Notes
All calculations execute on closed bars only (no repainting)
Lookback functions limited to 5000 bars maximum
Arrays are fixed-size (waves) or hard-capped (particles at 80 labels)
Dashboard and matrix update only on the last bar to minimize computational load
Particle generation throttled to every 2 bars
Phase accumulators use modulo operations to prevent overflow
Statistical normalization (mean ± 2σ) automatically adapts to different volatility regimes
— Dskyz, Trade with insight. Trade with anticipation.
Momentum Breakout Filter + ATR ZonesMomentum Breakout Filter + ATR Zones - User Guide
What This Indicator Does
This indicator helps you with your MACD + volume momentum strategy by:
Filtering out fake breakouts - Shows ⚠️ warnings when breakouts lack confirmation
Showing clear entry signals - 🚀 LONG and 🔻 SHORT labels when all conditions align
Automatic stop loss & profit targets - Based on ATR (Average True Range)
Visual trend confirmation - Background color + EMA alignment
Signal Types
🚀 LONG Entry Signal (Green Label)
Appears when ALL conditions met:
✅ MACD crosses above signal line
✅ Volume > 1.5× average
✅ Price > EMA 9 > EMA 21 > EMA 200 (bullish trend)
✅ Price closes above recent 20-bar high
🔻 SHORT Entry Signal (Red Label)
Appears when ALL conditions met:
✅ MACD crosses below signal line
✅ Volume > 1.5× average
✅ Price < EMA 9 < EMA 21 < EMA 200 (bearish trend)
✅ Price closes below recent 20-bar low
⚠️ FAKE Breakout Warning (Orange Label)
Appears when price breaks high/low BUT lacks confirmation:
❌ Low volume (below 1.5× average), OR
❌ Wick break only (didn't close through level), OR
❌ MACD not aligned with direction
Hover over the warning label to see what's missing!
ATR Stop Loss & Targets
When you get a signal, colored lines automatically appear:
Long Position
Red solid line = Stop Loss (Entry - 1.5×ATR)
Green dashed lines = Profit Targets:
Target 1: Entry + 2×ATR
Target 2: Entry + 3×ATR
Target 3: Entry + 4×ATR
Short Position
Red solid line = Stop Loss (Entry + 1.5×ATR)
Green dashed lines = Profit Targets:
Target 1: Entry - 2×ATR
Target 2: Entry - 3×ATR
Target 3: Entry - 4×ATR
The lines move with each bar until you exit the position.
Chart Elements
Moving Averages
Blue line = EMA 9 (fast)
Orange line = EMA 21 (medium)
White line = EMA 200 (trend filter)
Volume
Yellow bars = High volume (above threshold)
Gray bars = Normal volume
Background Color
Light green = Bullish trend (all EMAs aligned up)
Light red = Bearish trend (all EMAs aligned down)
No color = Neutral/mixed
MACD (Bottom Pane)
Green/Red columns = MACD Histogram
Blue line = MACD Line
Orange line = Signal Line
Info Dashboard (Bottom Right)
ItemWhat It ShowsVolumeCurrent volume vs average (✓ HIGH or ✗ Low)MACDDirection (BULLISH or BEARISH)TrendEMA alignment (BULL, BEAR, or NEUTRAL)ATRCurrent ATR value in dollarsPositionCurrent position (LONG, SHORT, or NONE)R:RRisk-to-Reward ratio (shows when in position)
How To Use It
Basic Workflow
Wait for setup
Watch for MACD to approach signal line
Volume should be building
Price should be near EMA structure
Get confirmation
Wait for 🚀 LONG or 🔻 SHORT label
Check dashboard shows "✓ HIGH" volume
Verify trend is aligned (green or red background)
Enter the trade
Enter when signal appears
Note your stop loss (red line)
Note your targets (green dashed lines)
Manage the trade
Exit at first target for partial profit
Move stop to breakeven
Trail remaining position
What To Avoid
❌ Don't trade when you see:
⚠️ FAKE labels (wait for confirmation)
Neutral background (no clear trend)
"✗ Low" volume in dashboard
MACD and Trend not aligned
Settings You Can Adjust
Volume Sensitivity
High Volume Threshold: Default 1.5×
Increase to 2.0× for cleaner signals (fewer trades)
Decrease to 1.2× for more signals (more trades)
Fake Breakout Filters
You can toggle these ON/OFF:
Volume Confirmation: Requires high volume
Close Through: Requires candle close, not just wick
MACD Alignment: Requires MACD direction match
Tip: Turn all three ON for highest quality signals
ATR Stop/Target Multipliers
Default settings (conservative):
Stop Loss: 1.5×ATR
Target 1: 2×ATR (1.33:1 R:R)
Target 2: 3×ATR (2:1 R:R)
Target 3: 4×ATR (2.67:1 R:R)
Aggressive traders might use:
Stop Loss: 1.0×ATR
Target 1: 2×ATR (2:1 R:R)
Target 2: 4×ATR (4:1 R:R)
Conservative traders might use:
Stop Loss: 2.0×ATR
Target 1: 3×ATR (1.5:1 R:R)
Target 2: 5×ATR (2.5:1 R:R)
Example Trade Scenarios
Scenario 1: Perfect Long Setup ✅
Stock consolidating near EMA 21
MACD curling up toward signal line
Volume bar turns yellow (high volume)
🚀 LONG label appears
Red stop line and green target lines appear
Result: High probability trade
Scenario 2: Fake Breakout Avoided ✅
Price breaks above resistance
Volume is normal (gray bar)
⚠️ FAKE label appears (hover shows "Low volume")
No entry signal
Price falls back below breakout level
Result: Avoided losing trade
Scenario 3: Premature Entry ❌
MACD crosses up
Volume is high
BUT trend is NEUTRAL (no background color)
No signal appears (trend filter blocks it)
Result: Avoided choppy/sideways market
Quick Reference
Entry Checklist
🚀 or 🔻 label on chart
Dashboard shows "✓ HIGH" volume
Dashboard shows aligned MACD + Trend
Colored background (green or red)
ATR lines visible
No ⚠️ FAKE warning
Exit Strategy
Target 1 (2×ATR): Take 50% profit, move stop to breakeven
Target 2 (3×ATR): Take 25% profit, trail stop
Target 3 (4×ATR): Take remaining profit or trail aggressively
Stop Loss: Exit entire position if hit
Alerts
Set up these alerts:
Long Entry: Fires when 🚀 LONG signal appears
Short Entry: Fires when 🔻 SHORT signal appears
Fake Breakout Warning: Fires when ⚠️ appears (optional)
Tips for Success
Use on 5-minute charts for day trading momentum plays
Only trade high volume stocks ($5-20 range works best)
Wait for full confirmation - don't jump early
Respect the stop loss - it's calculated based on volatility
Scale out at targets - don't hold for home runs
Avoid trading first 15 minutes - let market settle
Best during 10am-11am and 2pm-3pm - peak momentum times
Common Questions
Q: Why didn't I get a signal even though MACD crossed?
A: All conditions must be met - check dashboard for what's missing (likely volume or trend alignment)
Q: Can I use this on any timeframe?
A: Yes, but it's designed for 5-15 minute charts. On daily charts, adjust ATR multipliers higher.
Q: The stop loss seems too tight, can I widen it?
A: Yes, increase "Stop Loss (×ATR)" from 1.5 to 2.0 or 2.5 in settings.
Q: I keep seeing FAKE warnings but price keeps going - what gives?
A: The filter is conservative. You can disable some filters in settings, but expect more false signals.
Q: Can I use this for swing trading?
A: Yes, but use larger timeframes (1H or 4H) and adjust ATR multipliers up (3× for stops, 6-9× for targets).

Quantum Market Harmonics [QMH]# Quantum Market Harmonics - TradingView Script Description
## 📊 OVERVIEW
Quantum Market Harmonics (QMH) is a comprehensive multi-dimensional trading indicator that combines four independent analytical frameworks to generate high-probability trading signals with quantifiable confidence scores. Unlike simple indicator combinations that display multiple tools side-by-side, QMH synthesizes temporal analysis, inter-market correlations, behavioral psychology, and statistical probabilities into a unified confidence scoring system that requires agreement across all dimensions before generating a confirmed signal.
---
## 🎯 WHAT MAKES THIS SCRIPT ORIGINAL
### The Core Innovation: Weighted Confidence Scoring
Most indicators provide binary signals (buy/sell) or display multiple indicators separately, leaving traders to interpret conflicting information. QMH's originality lies in its weighted confidence scoring system that:
1. **Combines Four Independent Methods** - Each framework (described below) operates independently and contributes points to an overall confidence score
2. **Requires Multi-Dimensional Agreement** - Signals only fire when multiple frameworks align, dramatically reducing false positives
3. **Quantifies Signal Strength** - Every signal includes a numerical confidence rating (0-100%), allowing traders to filter by quality
4. **Adapts to Market Conditions** - Different market regimes activate different component combinations
### Why This Combination is Useful
Traditional approaches suffer from:
- **Single-dimension bias**: RSI shows oversold, but trend is still down
- **Conflicting signals**: MACD says buy, but volume is weak
- **No prioritization**: All signals treated equally regardless of strength
QMH solves these problems by requiring multiple independent confirmations and weighting each component's contribution to the final signal. This multi-dimensional approach mirrors how professional traders analyze markets - not relying on one indicator, but waiting for multiple pieces of evidence to align.
---
## 🔬 THE FOUR ANALYTICAL FRAMEWORKS
### 1. Temporal Fractal Resonance (TFR)
**What It Does:**
Analyzes trend alignment across four different timeframes simultaneously (15-minute, 1-hour, 4-hour, and daily) to identify periods of multi-timeframe synchronization.
**How It Works:**
- Uses `request.security()` with `lookahead=barmerge.lookahead_off` to retrieve confirmed price data from each timeframe
- Calculates "fractal strength" for each timeframe using this formula:
```
Fractal Strength = (Rate of Change / Standard Deviation) × 100
```
This creates a momentum-to-volatility ratio that measures trend strength relative to noise
- Computes a Resonance Index when all four timeframes show the same directional bias
- The index averages the absolute strength values when all timeframes align
**Why This Method:**
Fractal Market Hypothesis suggests that price patterns repeat across different time scales. When trends align from short-term (15m) to long-term (Daily), the probability of trend continuation increases substantially. The momentum/volatility ratio filters out low-conviction moves where volatility dominates direction.
**Contribution to Confidence Score:**
- TFR Bullish = +25 points
- TFR Bearish = +25 points (to bearish confidence)
- No alignment = 0 points
---
### 2. Cross-Asset Quantum Entanglement (CAQE)
**What It Does:**
Analyzes correlation patterns between the current asset and three reference markets (Bitcoin, US Dollar Index, and Volatility Index) to identify both normal correlation behavior and anomalous breakdowns that often precede significant moves.
**How It Works:**
- Retrieves price data from BTC (BINANCE:BTCUSDT), DXY (TVC:DXY), and VIX (TVC:VIX) using confirmed bars
- Calculates Pearson correlation coefficient between the main asset and each reference:
```
Correlation = Covariance(X,Y) / (StdDev(X) × StdDev(Y))
```
- Computes an Intermarket Pressure Index by weighting each reference asset's momentum by its correlation strength:
```
Pressure = (Corr₁ × ROC₁ + Corr₂ × ROC₂ + Corr₃ × ROC₃) / 3
```
- Detects "correlation breakdowns" when average correlation drops below 0.3
**Why This Method:**
Markets don't operate in isolation. Inter-market analysis (developed by John Murphy) recognizes that:
- Crypto assets often correlate with Bitcoin
- Risk assets inversely correlate with VIX (fear gauge)
- Dollar strength affects commodity and crypto prices
When these normal correlations break down, it signals potential regime changes. The term "quantum" reflects the interconnected nature of these relationships - like quantum entanglement where distant particles influence each other.
**Contribution to Confidence Score:**
- CAQE Bullish (positive pressure, stable correlations) = +25 points
- CAQE Bearish (negative pressure, stable correlations) = +25 points (to bearish)
- Correlation breakdown = Warning marker (potential reversal zone)
---
### 3. Adaptive Market Psychology Matrix (AMPM)
**What It Does:**
Classifies the current market emotional state into six distinct categories by analyzing the interaction between momentum (RSI), volume behavior, and volatility acceleration (ATR change).
**How It Works:**
The system evaluates three metrics:
1. **RSI (14-period)**: Measures overbought/oversold conditions
2. **Volume Analysis**: Compares current volume to 20-period average
3. **ATR Rate of Change**: Detects volatility acceleration
Based on these inputs, the market is classified into:
- **Euphoria**: RSI > 80, volume spike present, volatility rising (extreme bullish emotion)
- **Greed**: RSI > 70, normal volume (moderate bullish emotion)
- **Neutral**: RSI 40-60, declining volatility (balanced state)
- **Fear**: RSI 40-60, low volatility (uncertainty without panic)
- **Panic**: RSI < 30, volume spike present, volatility rising (extreme bearish emotion)
- **Despair**: RSI < 20, normal volume (capitulation phase)
**Why This Method:**
Behavioral finance principles (Kahneman, Tversky) show that markets follow predictable emotional cycles. Extreme psychological states often mark reversal points because:
- At Euphoria/Greed peaks, everyone bullish has already bought (no buyers left)
- At Panic/Despair bottoms, everyone bearish has already sold (no sellers left)
AMPM provides contrarian signals at these extremes while respecting trends during Fear and Greed intermediate states.
**Contribution to Confidence Score:**
- Psychology Bullish (Panic/Despair + RSI < 35) = +15 points
- Psychology Bearish (Euphoria/Greed + RSI > 65) = +15 points
- Neutral states = 0 points
---
### 4. Time-Decay Probability Zones (TDPZ)
**What It Does:**
Creates dynamic support and resistance zones based on statistical probability distributions that adapt to changing market volatility, similar to Bollinger Bands but with enhancements for trend environments.
**How It Works:**
- Calculates a 20-period Simple Moving Average as the basis line
- Computes standard deviation of price over the same period
- Creates four probability zones:
- **Extreme Upper**: Basis + 2.5 standard deviations (≈99% probability boundary)
- **Upper Zone**: Basis + 1.5 standard deviations
- **Lower Zone**: Basis - 1.5 standard deviations
- **Extreme Lower**: Basis - 2.5 standard deviations (≈99% probability boundary)
- Dynamically adjusts zone width based on ATR (Average True Range):
```
Adjusted Upper = Upper Zone + (ATR × adjustment_factor)
Adjusted Lower = Lower Zone - (ATR × adjustment_factor)
```
- The adjustment factor increases during high volatility, widening the zones
**Why This Method:**
Traditional support/resistance levels are static and don't account for volatility regimes. TDPZ zones are probability-based and mean-reverting:
- Price has ≈99% probability of staying within extreme zones in normal conditions
- Touches to extreme zones represent statistical outliers (high-probability reversal opportunities)
- Zone expansion/contraction reflects volatility regime changes
- ATR adjustment prevents false signals during unusual volatility
The "time-decay" concept refers to mean reversion - the further price moves from the basis, the higher the probability of eventual return.
**Contribution to Confidence Score:**
- Price in Lower Extreme Zone = +15 points (bullish reversal probability)
- Price in Upper Extreme Zone = +15 points (bearish reversal probability)
- Price near basis = 0 points
---
## 🎯 HOW THE CONFIDENCE SCORING SYSTEM WORKS
### Signal Generation Formula
QMH calculates separate Bullish and Bearish confidence scores each bar:
**Bullish Confidence (0-100%):**
```
Base Score: 20 points
+ TFR Bullish: 25 points (if all 4 timeframes aligned bullish)
+ CAQE Bullish: 25 points (if intermarket pressure positive)
+ AMPM Bullish: 15 points (if Panic/Despair contrarian signal)
+ TDPZ Bullish: 15 points (if price in lower probability zones)
─────────
Maximum Possible: 100 points
```
**Bearish Confidence (0-100%):**
```
Base Score: 20 points
+ TFR Bearish: 25 points (if all 4 timeframes aligned bearish)
+ CAQE Bearish: 25 points (if intermarket pressure negative)
+ AMPM Bearish: 15 points (if Euphoria/Greed contrarian signal)
+ TDPZ Bearish: 15 points (if price in upper probability zones)
─────────
Maximum Possible: 100 points
```
### Confirmed Signal Requirements
A **QBUY** (Quantum Buy) signal generates when:
1. Bullish Confidence ≥ User-defined threshold (default 60%)
2. Bullish Confidence > Bearish Confidence
3. No active sell signal present
A **QSELL** (Quantum Sell) signal generates when:
1. Bearish Confidence ≥ User-defined threshold (default 60%)
2. Bearish Confidence > Bullish Confidence
3. No active buy signal present
### Why This Approach Is Different
**Example Comparison:**
Traditional RSI Strategy:
- RSI < 30 → Buy signal
- Result: May buy into falling knife if trend remains bearish
QMH Approach:
- RSI < 30 → Psychology shows Panic (+15 points)
- But requires additional confirmation:
- Are all timeframes also showing bullish reversal? (+25 points)
- Is intermarket pressure turning positive? (+25 points)
- Is price at a statistical extreme? (+15 points)
- Only when total ≥ 60 points does a QBUY signal fire
This multi-layer confirmation dramatically reduces false signals while maintaining sensitivity to genuine opportunities.
---
## 🚫 NO REPAINT GUARANTEE
**QMH is designed to be 100% repaint-free**, which is critical for honest backtesting and reliable live trading.
### Technical Implementation:
1. **All Multi-Timeframe Data Uses Confirmed Bars**
```pinescript
tf1_close = request.security(syminfo.tickerid, "15", close , lookahead=barmerge.lookahead_off)
```
Using `close ` instead of `close ` ensures we only reference the previous confirmed bar, not the current forming bar.
2. **Lookahead Prevention**
```pinescript
lookahead=barmerge.lookahead_off
```
This parameter prevents the function from accessing future data that wouldn't be available in real-time.
3. **Signal Timing**
Signals appear on the bar AFTER all conditions are met, not retroactively on the bar where conditions first appeared.
### What This Means for Users:
- **Backtest Accuracy**: Historical signals match exactly what you would have seen in real-time
- **No Disappearing Signals**: Once a signal appears, it stays (though price may move against it)
- **Honest Performance**: Results reflect true predictive power, not hindsight optimization
- **Live Trading Reliability**: Alerts fire at the same time signals appear on the chart
The dashboard displays "✓ NO REPAINT" to confirm this guarantee.
---
## 📖 HOW TO USE THIS INDICATOR
### Basic Trading Strategy
**For Trend Followers:**
1. **Wait for Signal Confirmation**
- QBUY label appears below a bar = Confirmed bullish entry opportunity
- QSELL label appears above a bar = Confirmed bearish entry opportunity
2. **Check Confidence Score**
- 60-70%: Moderate confidence (consider smaller position size)
- 70-85%: High confidence (standard position size)
- 85-100%: Very high confidence (consider larger position size)
3. **Enter Trade**
- Long entry: Market or limit order near signal bar
- Short entry: Market or limit order near signal bar
4. **Set Targets Using Probability Zones**
- Long trades: Target the adjusted upper zone (lime line)
- Short trades: Target the adjusted lower zone (red line)
- Alternatively, target the basis line (yellow) for conservative exits
5. **Set Stop Loss**
- Long trades: Below recent swing low minus 1 ATR
- Short trades: Above recent swing high plus 1 ATR
**For Mean Reversion Traders:**
1. **Wait for Extreme Zones**
- Price touches extreme lower zone (dotted red line below)
- Price touches extreme upper zone (dotted lime line above)
2. **Confirm with Psychology**
- At lower extreme: Look for Panic or Despair state
- At upper extreme: Look for Euphoria or Greed state
3. **Wait for Confidence Build**
- Monitor dashboard until confidence exceeds threshold
- Requires patience - extreme touches don't always reverse immediately
4. **Enter Reversal**
- Target: Return to basis line (yellow SMA 20)
- Stop: Beyond the extreme zone
**For Position Traders (Longer Timeframes):**
1. **Use Daily Timeframe**
- Set chart to daily for longer-term signals
- Signals will be less frequent but higher quality
2. **Require High Confidence**
- Filter setting: Min Confidence Score 80%+
- Only take the strongest multi-dimensional setups
3. **Confirm with Resonance Background**
- Green tinted background = All timeframes bullish aligned
- Red tinted background = All timeframes bearish aligned
- Only enter when background tint matches signal direction
4. **Hold for Major Targets**
- Long trades: Hold until extreme upper zone or opposite signal
- Short trades: Hold until extreme lower zone or opposite signal
---
## 📊 DASHBOARD INTERPRETATION
The QMH Dashboard (top-right corner) provides real-time market analysis across all four dimensions:
### Dashboard Elements:
1. **✓ NO REPAINT**
- Green confirmation that signals don't repaint
- Always visible to remind users of signal integrity
2. **SIGNAL: BULL/BEAR XX%**
- Shows dominant direction (whichever confidence is higher)
- Displays current confidence percentage
- Background color intensity reflects confidence level
3. **Psychology: **
- Current market emotional state
- Color coded:
- Orange = Euphoria (extreme bullish emotion)
- Yellow = Greed (moderate bullish emotion)
- Gray = Neutral (balanced state)
- Purple = Fear (uncertainty)
- Red = Panic (extreme bearish emotion)
- Dark red = Despair (capitulation)
4. **Resonance: **
- Multi-timeframe alignment strength
- Positive = All timeframes bullish aligned
- Negative = All timeframes bearish aligned
- Near zero = Timeframes not synchronized
- Emoji indicator: 🔥 (bullish resonance) ❄️ (bearish resonance)
5. **Intermarket: **
- Cross-asset pressure measurement
- Positive = BTC/DXY/VIX correlations supporting upside
- Negative = Correlations supporting downside
- Warning ⚠️ if correlation breakdown detected
6. **RSI: **
- Current RSI(14) reading
- Background colors: Red (>70 overbought), Green (<30 oversold)
- Status: OB (overbought), OS (oversold), or • (neutral)
7. **Status: READY BUY / READY SELL / WAIT**
- Quick trade readiness indicator
- READY BUY: Confidence ≥ threshold, bias bullish
- READY SELL: Confidence ≥ threshold, bias bearish
- WAIT: Confidence below threshold
### How to Use Dashboard:
**Before Entering a Trade:**
- Verify Status shows READY (not WAIT)
- Check that Resonance matches signal direction
- Confirm Psychology isn't contradicting (e.g., buying during Euphoria)
- Note Intermarket value - breakdowns (⚠️) suggest caution
**During a Trade:**
- Monitor Psychology shifts (e.g., from Fear to Greed in a long)
- Watch for Resonance changes that could signal exit
- Check for Intermarket breakdown warnings
---
## ⚙️ CUSTOMIZATION SETTINGS
### TFR Settings (Temporal Fractal Resonance)
- **Enable/Disable**: Turn TFR analysis on/off
- **Fractal Sensitivity** (5-50, default 14):
- Lower values = More responsive to short-term changes
- Higher values = More stable, slower to react
- Recommendation: 14 for balanced, 7 for scalping, 21 for position trading
### CAQE Settings (Cross-Asset Quantum Entanglement)
- **Enable/Disable**: Turn CAQE analysis on/off
- **Asset 1** (default BTC): Reference asset for correlation analysis
- **Asset 2** (default DXY): Second reference asset
- **Asset 3** (default VIX): Third reference asset
- **Correlation Length** (10-100, default 20):
- Lower values = More sensitive to recent correlation changes
- Higher values = More stable correlation measurements
- Recommendation: 20 for most assets, 50 for less volatile markets
### Psychology Settings (Adaptive Market Psychology Matrix)
- **Enable/Disable**: Turn AMPM analysis on/off
- **Volume Spike Threshold** (1.0-5.0x, default 2.0):
- Lower values = Detect smaller volume increases as spikes
- Higher values = Only flag major volume surges
- Recommendation: 2.0 for stocks, 1.5 for crypto
### Probability Settings (Time-Decay Probability Zones)
- **Enable/Disable**: Turn TDPZ visualization on/off
- **Probability Lookback** (20-200, default 50):
- Lower values = Zones adapt faster to recent price action
- Higher values = Zones based on longer statistical history
- Recommendation: 50 for most uses, 100 for position trading
### Filter Settings
- **Min Confidence Score** (40-95%, default 60%):
- Lower threshold = More signals, more false positives
- Higher threshold = Fewer signals, higher quality
- Recommendation: 60% for active trading, 75% for selective trading
### Visual Settings
- **Show Entry Signals**: Toggle QBUY/QSELL labels on chart
- **Show Probability Zones**: Toggle zone visualization
- **Show Psychology State**: Toggle dashboard display
---
## 🔔 ALERT CONFIGURATION
QMH includes four alert conditions that can be configured via TradingView's alert system:
### Available Alerts:
1. **Quantum Buy Signal**
- Fires when: Confirmed QBUY signal generates
- Message includes: Confidence percentage
- Use for: Entry notifications
2. **Quantum Sell Signal**
- Fires when: Confirmed QSELL signal generates
- Message includes: Confidence percentage
- Use for: Entry notifications or exit warnings
3. **Market Panic**
- Fires when: Psychology state reaches Panic
- Use for: Contrarian opportunity alerts
4. **Market Euphoria**
- Fires when: Psychology state reaches Euphoria
- Use for: Reversal warning alerts
### How to Set Alerts:
1. Right-click on chart → "Add Alert"
2. Condition: Select "Quantum Market Harmonics"
3. Choose alert type from dropdown
4. Configure expiration, frequency, and notification method
5. Create alert
**Recommendation**: Set alerts for Quantum Buy/Sell signals with "Once Per Bar Close" frequency to avoid intra-bar false triggers.
---
## 💡 BEST PRACTICES
### For All Users:
1. **Backtest First**
- Test on your specific market and timeframe before live trading
- Different assets may perform better with different confidence thresholds
- Verify that the No Repaint guarantee works as described
2. **Paper Trade**
- Practice with signals on a demo account first
- Understand typical signal frequency for your timeframe
- Get comfortable with the dashboard interpretation
3. **Risk Management**
- Never risk more than 1-2% of capital per trade
- Use proper stop losses (not just mental stops)
- Position size based on confidence score (larger size at higher confidence)
4. **Consider Context**
- QMH signals work best in clear trends or at extremes
- During tight consolidation, false signals increase
- Major news events can invalidate technical signals
### Optimal Use Cases:
**QMH Works Best When:**
- ✅ Markets are trending (up or down)
- ✅ Volatility is normal to elevated
- ✅ Price reaches probability zone extremes
- ✅ Multiple timeframes align
- ✅ Clear inter-market relationships exist
**QMH Is Less Effective When:**
- ❌ Extremely low volatility (zones contract too much)
- ❌ Sideways choppy markets (conflicting timeframes)
- ❌ Flash crashes or news events (correlations break down)
- ❌ Very illiquid assets (irregular price action)
### Session Considerations:
- **24/7 Markets (Crypto)**: Works on all sessions, but signals may be more reliable during high-volume periods (US/European trading hours)
- **Forex**: Best during London/New York overlap when volume is highest
- **Stocks**: Most reliable during regular trading hours (not pre-market/after-hours)
---
## ⚠️ LIMITATIONS AND RISKS
### This Indicator Cannot:
- **Predict Black Swan Events**: Sudden unexpected events invalidate technical analysis
- **Guarantee Profits**: No indicator is 100% accurate; losses will occur
- **Replace Risk Management**: Always use stop losses and proper position sizing
- **Account for Fundamental Changes**: Company news, economic data, etc. can override technical signals
- **Work in All Market Conditions**: Less effective during extreme low volatility or major news events
### Known Limitations:
1. **Multi-Timeframe Lag**: Uses confirmed bars (`close `), so signals appear one bar after conditions met
2. **Correlation Dependency**: CAQE requires sufficient history; may be less reliable on newly listed assets
3. **Computational Load**: Multiple `request.security()` calls may cause slower performance on older devices
4. **Repaint of Dashboard**: Dashboard updates every bar (by design), but signals themselves don't repaint
### Risk Warnings:
- Past performance doesn't guarantee future results
- Backtesting results may not reflect actual trading results due to slippage, commissions, and execution delays
- Different markets and timeframes may produce different results
- The indicator should be used as a tool, not as a standalone trading system
- Always combine with your own analysis, risk management, and trading plan
---
## 🎓 EDUCATIONAL CONCEPTS
This indicator synthesizes several established financial theories and technical analysis concepts:
### Academic Foundations:
1. **Fractal Market Hypothesis** (Edgar Peters)
- Markets exhibit self-similar patterns across time scales
- Implemented via multi-timeframe resonance analysis
2. **Behavioral Finance** (Kahneman & Tversky)
- Investor psychology drives market inefficiencies
- Implemented via market psychology state classification
3. **Intermarket Analysis** (John Murphy)
- Asset classes correlate and influence each other predictably
- Implemented via cross-asset correlation monitoring
4. **Mean Reversion** (Statistical Arbitrage)
- Prices tend to revert to statistical norms
- Implemented via probability zones and standard deviation bands
5. **Multi-Timeframe Analysis** (Technical Analysis Standard)
- Higher timeframe trends dominate lower timeframe noise
- Implemented via fractal resonance scoring
### Learning Resources:
To better understand the concepts behind QMH:
- Read "Intermarket Analysis" by John Murphy (for CAQE concepts)
- Study "Thinking, Fast and Slow" by Daniel Kahneman (for psychology concepts)
- Review "Fractal Market Analysis" by Edgar Peters (for TFR concepts)
- Learn about Bollinger Bands (for TDPZ foundation)
---
## 🔄 VERSION HISTORY AND UPDATES
**Current Version: 1.0**
This is the initial public release. Future updates will be published using TradingView's Update feature (not as separate publications). Planned improvements may include:
- Additional reference assets for CAQE
- Optional machine learning-based weight optimization
- Customizable psychology state definitions
- Alternative probability zone calculations
- Performance metrics tracking
Check the "Updates" tab on the script page for version history.
---
## 📞 SUPPORT AND FEEDBACK
### How to Get Help:
1. **Read This Description First**: Most questions are answered in the detailed sections above
2. **Check Comments**: Other users may have asked similar questions
3. **Post Comments**: For general questions visible to the community
4. **Use TradingView Messaging**: For private inquiries (if available)
### Providing Useful Feedback:
When reporting issues or suggesting improvements:
- Specify your asset, timeframe, and settings
- Include a screenshot if relevant
- Describe expected vs. actual behavior
- Check if issue persists with default settings
### Continuous Improvement:
This indicator will evolve based on user feedback and market testing. Constructive suggestions for improvements are always welcome.
---
## ⚖️ DISCLAIMER
This indicator is provided for **educational and informational purposes only**. It does **not constitute financial advice, investment advice, trading advice, or any other type of advice**.
**Important Disclaimers:**
- You should **not** rely solely on this indicator to make trading decisions
- Always conduct your own research and due diligence
- Past performance is not indicative of future results
- Trading and investing involve substantial risk of loss
- Only trade with capital you can afford to lose
- Consider consulting with a licensed financial advisor before trading
- The author is not responsible for any trading losses incurred using this indicator
**By using this indicator, you acknowledge:**
- You understand the risks of trading
- You take full responsibility for your trading decisions
- You will use proper risk management techniques
- You will not hold the author liable for any losses
---
## 🙏 ACKNOWLEDGMENTS
This indicator builds upon the collective knowledge of the technical analysis and trading community. While the specific implementation and combination are original, the underlying concepts draw from:
- The Pine Script community on TradingView
- Academic research in behavioral finance and market microstructure
- Classical technical analysis methods developed over decades
- Open-source indicators that demonstrate best practices in Pine Script coding
Special thanks to TradingView for providing the platform and Pine Script language that make indicators like this possible.
---
## 📚 ADDITIONAL RESOURCES
**Pine Script Documentation:**
- Official Pine Script Manual: www.tradingview.com
**Related Concepts to Study:**
- Multi-timeframe analysis techniques
- Correlation analysis in financial markets
- Behavioral finance principles
- Mean reversion strategies
- Bollinger Bands methodology
**Recommended TradingView Tools:**
- Strategy Tester: To backtest signal performance
- Bar Replay: To see how signals develop in real-time
- Alert System: To receive notifications of new signals
---
**Thank you for using Quantum Market Harmonics. Trade safely and responsibly.**

Hidden Impulse═══════════════════════════════════════════════════════════════════
HIDDEN IMPULSE - Multi-Timeframe Momentum Detection System
═══════════════════════════════════════════════════════════════════
OVERVIEW
Hidden Impulse is an advanced momentum oscillator that combines the Schaff Trend Cycle (STC) and Force Index into a comprehensive multi-timeframe trading system. Unlike standard implementations of these indicators, this script introduces three distinct trading setups with specific entry conditions, multi-timeframe confirmation, and trend filtering.
═══════════════════════════════════════════════════════════════════
ORIGINALITY & KEY FEATURES
This indicator is original in the following ways:
1. DUAL-TIMEFRAME STC ANALYSIS
Standard STC implementations work on a single timeframe. This script
simultaneously analyzes STC on both your trading timeframe and a higher
timeframe, providing trend context and filtering out low-probability signals.
2. FORCE INDEX INTEGRATION
The script combines STC with Force Index (volume-weighted price momentum)
to confirm the strength behind price moves. This combination helps identify
when momentum shifts are backed by genuine buying/selling pressure.
3. THREE DISTINCT TRADING SETUPS
Rather than generic overbought/oversold signals, the indicator provides
three specific, rule-based setups:
- Setup A: Classic trend-following entries with multi-timeframe confirmation
- Setup B: Divergence-based reversal entries (highest probability)
- Setup C: Mean-reversion bounce trades at extreme levels
4. INTELLIGENT FILTERING
All signals are filtered through:
- 50 EMA trend direction (prevents counter-trend trades)
- Higher timeframe STC alignment (ensures macro trend agreement)
- Force Index confirmation (validates volume support)
═══════════════════════════════════════════════════════════════════
HOW IT WORKS - TECHNICAL EXPLANATION
SCHAFF TREND CYCLE (STC) CALCULATION:
The STC is a cyclical oscillator that combines MACD concepts with stochastic
smoothing to create earlier and smoother trend signals.
Step 1: Calculate MACD
- Fast MA = EMA(close, Length1) — default 23
- Slow MA = EMA(close, Length2) — default 50
- MACD Line = Fast MA - Slow MA
Step 2: First Stochastic Smoothing
- Apply stochastic calculation to MACD
- Stoch1 = 100 × (MACD - Lowest(MACD, Smoothing)) / (Highest(MACD, Smoothing) - Lowest(MACD, Smoothing))
- Smooth result with EMA(Stoch1, Smoothing) — default 10
Step 3: Second Stochastic Smoothing
- Apply stochastic calculation again to the smoothed stochastic
- This creates the final STC value between 0-100
The dual stochastic smoothing makes STC more responsive than MACD while
being smoother than traditional stochastics.
FORCE INDEX CALCULATION:
Force Index measures the power behind price movements by incorporating volume:
Force Raw = (Close - Close ) × Volume
Force Index = EMA(Force Raw, Period) — default 13
Interpretation:
- Positive Force Index = Buying pressure (bulls in control)
- Negative Force Index = Selling pressure (bears in control)
- Force Index crossing zero = Momentum shift
- Divergences with price = Weakening momentum (reversal signal)
TREND FILTER:
A 50-period EMA serves as the trend filter:
- Price above EMA50 = Uptrend → Only LONG signals allowed
- Price below EMA50 = Downtrend → Only SHORT signals allowed
This prevents counter-trend trading which accounts for most losing trades.
═══════════════════════════════════════════════════════════════════
THE THREE TRADING SETUPS - DETAILED
SETUP A: CLASSIC MOMENTUM ENTRY
Concept: Enter when STC exits oversold/overbought zones with trend confirmation
LONG CONDITIONS:
1. Higher timeframe STC > 25 (macro trend is up)
2. Primary timeframe STC crosses above 25 (momentum turning up)
3. Force Index crosses above 0 OR already positive (volume confirms)
4. Price above 50 EMA (local trend is up)
SHORT CONDITIONS:
1. Higher timeframe STC < 75 (macro trend is down)
2. Primary timeframe STC crosses below 75 (momentum turning down)
3. Force Index crosses below 0 OR already negative (volume confirms)
4. Price below 50 EMA (local trend is down)
Best for: Trending markets, continuation trades
Win rate: Moderate (60-65%)
Risk/Reward: 1:2 to 1:3
───────────────────────────────────────────────────────────────────
SETUP B: DIVERGENCE REVERSAL (HIGHEST PROBABILITY)
Concept: Identify exhaustion points where price makes new extremes but
momentum (Force Index) fails to confirm
BULLISH DIVERGENCE:
1. Price makes a lower low (LL) over 10 bars
2. Force Index makes a higher low (HL) — refuses to follow price down
3. STC is below 25 (oversold condition)
Trigger: STC starts rising AND Force Index crosses above zero
BEARISH DIVERGENCE:
1. Price makes a higher high (HH) over 10 bars
2. Force Index makes a lower high (LH) — refuses to follow price up
3. STC is above 75 (overbought condition)
Trigger: STC starts falling AND Force Index crosses below zero
Why this works: Divergences signal that the current trend is losing steam.
When volume (Force Index) doesn't confirm new price extremes, a reversal
is likely.
Best for: Reversal trading, range-bound markets
Win rate: High (70-75%)
Risk/Reward: 1:3 to 1:5
───────────────────────────────────────────────────────────────────
SETUP C: QUICK BOUNCE AT EXTREMES
Concept: Catch rapid mean-reversion moves when price touches EMA50 in
extreme STC zones
LONG CONDITIONS:
1. Price touches 50 EMA from above (pullback in uptrend)
2. STC < 15 (extreme oversold)
3. Force Index > 0 (buyers stepping in)
SHORT CONDITIONS:
1. Price touches 50 EMA from below (pullback in downtrend)
2. STC > 85 (extreme overbought)
3. Force Index < 0 (sellers stepping in)
Best for: Scalping, quick mean-reversion trades
Win rate: Moderate (55-60%)
Risk/Reward: 1:1 to 1:2
Note: Use tighter stops and quick profit-taking
═══════════════════════════════════════════════════════════════════
HOW TO USE THE INDICATOR
STEP 1: CONFIGURE TIMEFRAMES
Primary Timeframe (STC - Primary Timeframe):
- Leave empty to use your current chart timeframe
- This is where you'll take trades
Higher Timeframe (STC - Higher Timeframe):
- Default: 30 minutes
- Recommended ratios:
* 5min chart → 30min higher TF
* 15min chart → 1H higher TF
* 1H chart → 4H higher TF
* Daily chart → Weekly higher TF
───────────────────────────────────────────────────────────────────
STEP 2: ADJUST STC PARAMETERS FOR YOUR MARKET
Default (23/50/10) works well for stocks and forex, but adjust for:
CRYPTO (volatile):
- Length 1: 15
- Length 2: 35
- Smoothing: 8
(Faster response for rapid price movements)
STOCKS (standard):
- Length 1: 23
- Length 2: 50
- Smoothing: 10
(Balanced settings)
FOREX MAJORS (slower):
- Length 1: 30
- Length 2: 60
- Smoothing: 12
(Filters out noise in 24/7 markets)
───────────────────────────────────────────────────────────────────
STEP 3: ENABLE YOUR PREFERRED SETUPS
Toggle setups based on your trading style:
Conservative Trader:
✓ Setup B (Divergence) — highest win rate
✗ Setup A (Classic) — only in strong trends
✗ Setup C (Bounce) — too aggressive
Trend Trader:
✓ Setup A (Classic) — primary signals
✓ Setup B (Divergence) — for entries on pullbacks
✗ Setup C (Bounce) — not suitable for trending
Scalper:
✓ Setup C (Bounce) — quick in-and-out
✓ Setup B (Divergence) — high probability scalps
✗ Setup A (Classic) — too slow
───────────────────────────────────────────────────────────────────
STEP 4: READ THE SIGNALS
ON THE CHART:
Labels appear when conditions are met:
Green labels:
- "LONG A" — Setup A long entry
- "LONG B DIV" — Setup B divergence long (best signal)
- "LONG C" — Setup C bounce long
Red labels:
- "SHORT A" — Setup A short entry
- "SHORT B DIV" — Setup B divergence short (best signal)
- "SHORT C" — Setup C bounce short
IN THE INDICATOR PANEL (bottom):
- Blue line = Primary timeframe STC
- Orange dots = Higher timeframe STC (optional)
- Green/Red bars = Force Index histogram
- Dashed lines at 25/75 = Entry/Exit zones
- Background shading = Oversold (green) / Overbought (red)
INFO TABLE (top-right corner):
Shows real-time status:
- STC values for both timeframes
- Force Index direction
- Price position vs EMA
- Current trend direction
- Active signal type
═══════════════════════════════════════════════════════════════════
TRADING STRATEGY & RISK MANAGEMENT
ENTRY RULES:
Priority ranking (best to worst):
1st: Setup B (Divergence) — wait for these
2nd: Setup A (Classic) — in confirmed trends only
3rd: Setup C (Bounce) — scalping only
Confirmation checklist before entry:
☑ Signal label appears on chart
☑ TREND in info table matches signal direction
☑ Higher timeframe STC aligned (check orange dots or table)
☑ Force Index confirming (check histogram color)
───────────────────────────────────────────────────────────────────
STOP LOSS PLACEMENT:
Setup A (Classic):
- LONG: Below recent swing low
- SHORT: Above recent swing high
- Typical: 1-2 ATR distance
Setup B (Divergence):
- LONG: Below the divergence low
- SHORT: Above the divergence high
- Typical: 0.5-1.5 ATR distance
Setup C (Bounce):
- LONG: 5-10 pips below EMA50
- SHORT: 5-10 pips above EMA50
- Typical: 0.3-0.8 ATR distance
───────────────────────────────────────────────────────────────────
TAKE PROFIT TARGETS:
Conservative approach:
- Exit when STC reaches opposite level
- LONG: Exit when STC > 75
- SHORT: Exit when STC < 25
Aggressive approach:
- Hold until opposite signal appears
- Trail stop as STC moves in your favor
Partial profits:
- Take 50% at 1:2 risk/reward
- Let remaining 50% run to target
───────────────────────────────────────────────────────────────────
WHAT TO AVOID:
❌ Trading Setup A in sideways/choppy markets
→ Wait for clear trend or use Setup B only
❌ Ignoring higher timeframe STC
→ Always check orange dots align with your direction
❌ Taking signals against the major trend
→ If weekly trend is down, be cautious with longs
❌ Overtrading Setup C
→ Maximum 2-3 bounce trades per session
❌ Trading during low volume periods
→ Force Index becomes unreliable
═══════════════════════════════════════════════════════════════════
ALERTS CONFIGURATION
The indicator includes 8 alert types:
Individual setup alerts:
- "Setup A - LONG" / "Setup A - SHORT"
- "Setup B - DIV LONG" / "Setup B - DIV SHORT" ⭐ recommended
- "Setup C - BOUNCE LONG" / "Setup C - BOUNCE SHORT"
Combined alerts:
- "ANY LONG" — fires on any long signal
- "ANY SHORT" — fires on any short signal
Recommended alert setup:
- Create "Setup B - DIV LONG" and "Setup B - DIV SHORT" alerts
- These are the highest probability signals
- Set "Once Per Bar Close" to avoid false alerts
═══════════════════════════════════════════════════════════════════
VISUALIZATION SETTINGS
Show Labels on Chart:
Toggle on/off the signal labels (green/red)
Disable for cleaner chart once you're familiar with the indicator
Show Higher TF STC:
Toggle the orange dots showing higher timeframe STC
Useful for visual confirmation of multi-timeframe alignment
Info Panel:
Cannot be disabled — always shows current status
Positioned top-right to avoid chart interference
═══════════════════════════════════════════════════════════════════
EXAMPLE TRADE WALKTHROUGH
SETUP B DIVERGENCE LONG EXAMPLE:
1. Market Context:
- Price in downtrend, below 50 EMA
- Multiple lower lows forming
- STC below 25 (oversold)
2. Divergence Formation:
- Price makes new low at $45.20
- Force Index refuses to make new low (higher low forms)
- This indicates selling pressure weakening
3. Signal Trigger:
- STC starts turning up
- Force Index crosses above zero
- Label appears: "LONG B DIV"
4. Trade Execution:
- Entry: $45.50 (current price at signal)
- Stop Loss: $44.80 (below divergence low)
- Target 1: $47.90 (STC reaches 75) — risk/reward 1:3.4
- Target 2: Opposite signal or trail stop
5. Trade Management:
- Price rallies to $47.20
- STC reaches 68 (approaching target zone)
- Take 50% profit, move stop to breakeven
- Exit remaining at $48.10 when STC crosses 75
Result: 3.7R gain
═══════════════════════════════════════════════════════════════════
ADVANCED TIPS
1. MULTI-TIMEFRAME CONFLUENCE
For highest probability trades, wait for:
- Primary TF signal
- Higher TF STC aligned (>25 for longs, <75 for shorts)
- Even higher TF trend in same direction (manual check)
2. VOLUME CONFIRMATION
Watch the Force Index histogram:
- Increasing bar size = Strengthening momentum
- Decreasing bar size = Weakening momentum
- Use this to gauge signal strength
3. AVOID THESE MARKET CONDITIONS
- Major news events (Force Index becomes erratic)
- Market open first 30 minutes (volatility spikes)
- Low liquidity instruments (Force Index unreliable)
- Extreme trending days (wait for pullbacks)
4. COMBINE WITH SUPPORT/RESISTANCE
Best signals occur near:
- Key horizontal levels
- Fibonacci retracements
- Previous day's high/low
- Psychological round numbers
5. SESSION AWARENESS
- Asia session: Use lower timeframes, Setup C works well
- London session: Setup A and B both effective
- New York session: All setups work, highest volume
═══════════════════════════════════════════════════════════════════
INDICATOR WINDOWS LAYOUT
MAIN CHART:
- Price action
- 50 EMA (green/red)
- Signal labels
- Info panel
INDICATOR WINDOW:
- STC oscillator (blue line, 0-100 scale)
- Higher TF STC (orange dots, optional)
- Force Index histogram (green/red bars)
- Reference levels (25, 50, 75)
- Background zones (green oversold, red overbought)
═══════════════════════════════════════════════════════════════════
PERFORMANCE OPTIMIZATION
For best results:
Backtesting:
- Test on your specific instrument and timeframe
- Adjust STC parameters if win rate < 55%
- Record which setup works best for your market
Position Sizing:
- Risk 1-2% per trade
- Setup B can use 2% risk (higher win rate)
- Setup C should use 1% risk (lower win rate)
Trade Frequency:
- Setup B: 2-5 signals per week (be patient)
- Setup A: 5-10 signals per week
- Setup C: 10+ signals per week (scalping)
═══════════════════════════════════════════════════════════════════
CREDITS & REFERENCES
This indicator builds upon established technical analysis concepts:
Schaff Trend Cycle:
- Developed by Doug Schaff (1996)
- Original concept published in Technical Analysis of Stocks & Commodities
- Implementation based on standard STC formula
Force Index:
- Developed by Dr. Alexander Elder
- Described in "Trading for a Living" (1993)
- Classic volume-momentum indicator
The multi-timeframe integration, three-setup system, and specific
entry conditions are original contributions of this indicator.
═══════════════════════════════════════════════════════════════════
DISCLAIMER
This indicator is a technical analysis tool and does not guarantee profits.
Past performance is not indicative of future results. Always:
- Use proper risk management
- Test on demo account first
- Combine with fundamental analysis
- Never risk more than you can afford to lose
═══════════════════════════════════════════════════════════════════
SUPPORT & QUESTIONS
If you find this indicator helpful, please:
- Leave a like and comment
- Share your feedback and results
- Report any bugs or issues
For questions about usage or optimization for specific markets,
feel free to comment below.
═════════════════════════════════════════════════════════════

Sequential Trend + Momentum Long and Short📈 Signals
🟢 Long Entry: EMA trend turns bullish and RSI confirms momentum.
🔴 Short Entry: EMA trend turns bearish and RSI confirms momentum.
🟢 Long Exit: Price drops below EMA Exit zone.
🔴 Short Exit: Price rises above EMA Exit zone.
🧩 Parameters
Input Description
EMA Fast Short-term EMA for trend detection
EMA Slow Medium-term EMA for trend filtering
EMA Exit Longer EMA for trailing exit confirmation
RSI Length Period of RSI used for momentum check
RSI Long Threshold RSI value confirming bullish momentum
RSI Short Threshold RSI value confirming bearish momentum
🚀 How to Use
Apply the indicator on your preferred timeframe (15min–1h recommended).
Use Long Entry and Short Entry markers for potential trade setups.
Combine with your own stop-loss & target rules or automate via webhook.
Alerts are built-in for all entries/exits and can be sent to trading bots or brokers.
🔔 Alerts
Sequential Long Entry Triggered → triggers when bullish conditions align.
Sequential Long Exit Triggered → triggers when long trend weakens.
Sequential Short Entry Triggered → triggers when bearish conditions align.
Sequential Short Exit Triggered → triggers when short trend weakens.
🧭 Best Practices
Works best in trending markets; avoid ranging conditions.
Can be paired with volume filters or higher timeframe confirmation for better accuracy.
Adjustable EMA and RSI values make it flexible across assets (stocks, crypto, indices).
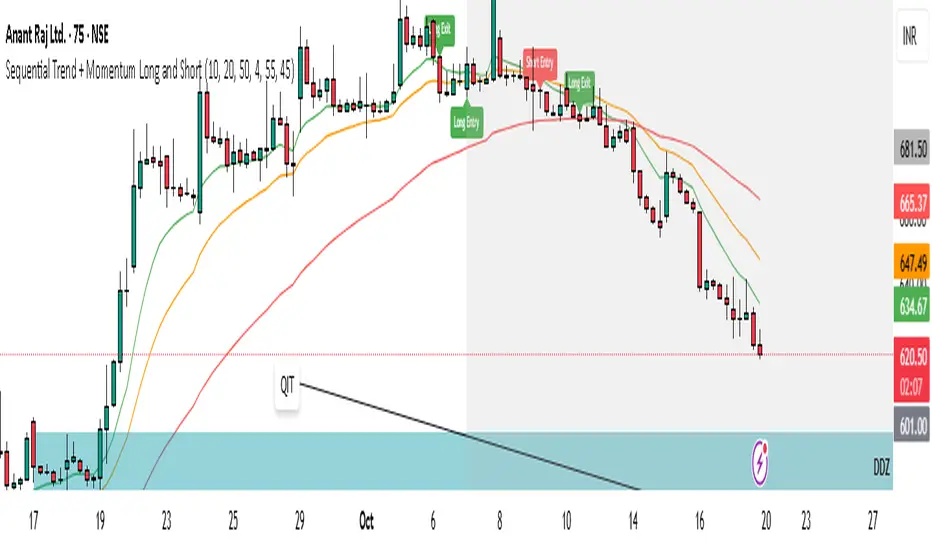
🚀 Ultimate Trading Tool + Strat Method🚀 Ultimate Trading Tool + Strat Method - Complete Breakdown
Let me give you a comprehensive overview of this powerful indicator!
🎯 What This Indicator Does:
This is a professional-grade, all-in-one trading system that combines two proven methodologies:
1️⃣ Technical Analysis System (Original)
Advanced trend detection using multiple EMAs
Momentum analysis with MACD
RSI multi-timeframe analysis
Volume surge detection
Automated trendline drawing
2️⃣ Strat Method (Pattern Recognition)
Inside bars, outside bars, directional bars
Classic patterns: 2-2, 1-2-2
Advanced patterns: 3-1-2, 2-1-2, F2→3
Timeframe continuity filters
📊 How It Generates Signals:
Technical Analysis Signals (Green/Red Triangles):
Buy Signal Triggers When:
✅ Price above EMA 21 & 50 (uptrend)
✅ MACD histogram rising (momentum)
✅ RSI between 30-70 (not overbought/oversold)
✅ Volume surge above 20-period average
✅ Price breaks above resistance trendline
Scoring System:
Trend alignment: +1 point
Momentum: +1 point
RSI favorable: +1 point
Trendline breakout: +2 points
Minimum score required based on sensitivity setting
Strat Method Signals (Blue/Orange Labels):
Pattern Recognition:
2-2 Setup: Down bar → Up bar (or reverse)
1-2-2 Setup: Inside bar → Down bar → Up bar
3-1-2 Setup: Outside bar → Inside bar → Up bar
2-1-2 Setup: Down bar → Inside bar → Up bar
F2→3 Setup: Failed directional bar becomes outside bar
Confirmation Required:
Must break previous bar's high (buy) or low (sell)
Optional timeframe continuity (daily & weekly aligned)
💰 Risk Management Features:
Dynamic Stop Loss & Take Profit:
ATR-Based: Adapts to market volatility
Stop Loss: Entry - (ATR × 1.5) by default
Take Profit: Entry + (ATR × 3.0) by default
Risk:Reward: Customizable 1:2 to 1:5 ratios
Visual Risk Zones:
Colored boxes show risk/reward area
Dark, bold lines for easy identification
Clear entry, stop, and target levels
🎨 What You See On Screen:
Main Signals:
🟢 Green Triangle "BUY" - Technical analysis long signal
🔴 Red Triangle "SELL" - Technical analysis short signal
🎯 Blue Label "STRAT" - Strat method long signal
🎯 Orange Label "STRAT" - Strat method short signal
Trendlines:
Green lines - Support trendlines (bullish)
Red lines - Resistance trendlines (bearish)
Automatically drawn from pivot points
Extended forward to predict future levels
Stop/Target Levels:
Bold crosses at stop loss levels (red color)
Bold crosses at take profit levels (green color)
Line width = 3 for maximum visibility
Trade Zones:
Light green boxes - Long trade risk/reward zone
Light red boxes - Short trade risk/reward zone
Shows potential profit vs risk visually
📊 Information Dashboard (Top Right):
Shows real-time market conditions:
Main Signal: Current technical signal status
Strat Method: Active Strat pattern
Trend: Bullish/Bearish/Neutral
Momentum: Strong/Weak based on MACD
Volume: High/Normal compared to average
TF Continuity: Daily/Weekly alignment
RSI: Current RSI value with color coding
Support/Resistance: Current trendline levels
🔔 Alert System:
Entry Alerts:
Technical Signals:
🚀 BUY SIGNAL TRIGGERED!
Type: Technical Analysis
Entry: 45.23
Stop: 43.87
Target: 48.95
```
**Strat Signals:**
```
🎯 STRAT BUY TRIGGER!
Pattern: 3-1-2
Entry: 45.23
Trigger Level: 44.56
Exit Alerts:
Target hit notifications
Stop loss hit warnings
Helps maintain discipline
⚙️ Customization Options:
Signal Settings:
Sensitivity: High/Medium/Low (controls how many signals)
Volume Filter: Require volume surge or not
Momentum Filter: Require momentum confirmation
Strat Settings:
TF Continuity: Require daily/weekly alignment
Pattern Selection: Enable/disable specific patterns
Confirmation Mode: Show only confirmed triggers
Risk Settings:
ATR Multiplier: Adjust stop/target distance
Risk:Reward: Set preferred ratio
Visual Elements: Show/hide any component
Visual Settings:
Colors: Customize all signal colors
Display Options: Toggle signals, levels, zones
Trendline Length: Adjust pivot detection period
🎯 Best Use Cases:
Day Trading:
Use low sensitivity setting
Enable all Strat patterns
Watch for high volume signals
Quick in/out trades
Swing Trading:
Use medium sensitivity
Require timeframe continuity
Focus on trendline breakouts
Hold for target levels
Position Trading:
Use high sensitivity (fewer signals)
Require strong momentum
Focus on weekly/daily alignment
Larger ATR multipliers
💡 Trading Strategy Tips:
High-Probability Setups:
Double Confirmation: Technical + Strat signal together
Trend Alignment: All timeframes agree
Volume Surge: Institutional participation
Trendline Break: Clear level breakout
Risk Management:
Always use stops - System provides them
Position sizing - Risk 1-2% per trade
Don't chase - Wait for signal confirmation
Take profits - System provides targets
What Makes Signals Strong:
✅ Both technical AND Strat signals fire together
✅ Timeframe continuity (daily & weekly aligned)
✅ Volume surge confirms institutional interest
✅ Multiple indicators align (trend + momentum + RSI)
✅ Clean trendline breakout with no resistance above (or support below)
⚠️ Common Mistakes to Avoid:
Don't ignore stops - System calculates them for a reason
Don't overtrade - Wait for quality setups
Don't disable volume filter - Unless you know what you're doing
Don't use max sensitivity - You'll get too many signals
Don't ignore timeframe continuity - It filters bad trades
🚀 Why This Indicator is Powerful:
Combines Multiple Edge Sources:
Technical analysis (trend, momentum, volume)
Pattern recognition (Strat method)
Risk management (dynamic stops/targets)
Market structure (trendlines, support/resistance)
Professional Features:
No repainting - signals are final when bar closes
Clear risk/reward before entry
Multiple confirmation layers
Adaptable to any market or timeframe
Beginner Friendly:
Clear visual signals
Automatic calculations
Built-in risk management
Comprehensive dashboard
This indicator essentially gives you everything a professional trader uses - trend analysis, momentum, patterns, volume, risk management - all in one clean package!
Any specific aspect you'd like me to explain in more detail? 🎯RetryClaude can make mistakes. Please double-check responses. Sonnet 4.5

FVG Buy/Sell [Multi-TF] by akshaykiriti1443The FVG Buy/Sell indicator is a precision trading tool designed for traders who operate with a clear directional bias. It excels at identifying high-probability entry points by detecting when price interacts with Fair Value Gaps (FVGs).
This indicator is built on a core principle: instead of predicting the market's direction, it provides the timing for an entry after you, the trader, have established your market bias. By automatically pinpointing bullish and bearish imbalances on both the current and a higher timeframe, it allows you to wait for the market to pull back to a key level and then provides a clear signal for execution.
The Core Strategy: Bias First, Entry Second
This indicator is most powerful when used as part of a two-step trading process. It is not a standalone signal generator; it is an entry confirmation tool.
Step 1: Determine Your Directional Bias
Before looking for any signals from this indicator, you must first have an opinion on the market's most likely direction. This bias should be derived from your primary analysis method, such as:
The Golden Rule:
If your bias is BULLISH, you will ONLY look for BUY signals generated by bullish (green/blue) FVGs. You will ignore all SELL signals.
If your bias is BEARISH, you will ONLY look for SELL signals generated by bearish (pink/orange) FVGs. You will ignore all BUY signals.
Step 2: Execute with the FVG Tap-In Signal
Once your bias is set, the indicator does the rest of the work. You simply wait for the price to pull back into an FVG zone that aligns with your bias and then wait for the confirmation arrow to appear.
A green up arrow confirms that price has tapped a bullish FVG and closed above it, signaling that support has held and it's a valid moment to enter a long position.
A red down arrow confirms that price has tapped a bearish FVG and closed below it, signaling that resistance has held and it's a valid moment to enter a short position.
How to Take a Trade (Step-by-Step Examples)
Example of a Bullish (Long) Trade Setup:
Establish Bias: Your primary analysis shows the market is in a clear uptrend. Your bias is Bullish. You are now only looking for buying opportunities.
Identify Zone: The indicator draws a bullish FVG (a green or blue box) during an impulsive up-move.
Wait for Pullback: Be patient and let the price retrace down into this FVG zone. Do not chase the price.
Confirmation Signal: A green UP arrow appears below a candle. This is your signal. It confirms that buyers have stepped in at the FVG level and defended it.
Entry: Enter a long (buy) position at the open of the candle immediately following the signal candle.
Stop Loss: Place your stop loss below the low of the signal candle or, for a safer stop, below the bottom of the FVG zone itself.
Take Profit: Target a previous high, a higher-timeframe resistance level, or use a risk-to-reward ratio like 1:2 or 1:3.
Example of a Bearish (Short) Trade Setup:
Establish Bias: Your primary analysis shows the market is breaking down into a downtrend. Your bias is Bearish. You are now only looking for selling opportunities.
Identify Zone: The indicator draws a bearish FVG (a pink or orange box) during an impulsive down-move.
Wait for Pullback: Patiently wait for the price to rally back up into this FVG zone.
Confirmation Signal: A red DOWN arrow appears above a candle. This is your confirmation that sellers have rejected the price at this level.
Entry: Enter a short (sell) position at the open of the next candle.
Stop Loss: Place your stop loss above the high of the signal candle or above the top of the FVG zone.
Take Profit: Target a previous low, a key support level, or the next major FVG below.
Features Explained in Detail
Multi-Timeframe (MTF) Analysis: HTF zones (dotted lines) carry more weight. A signal from a 4-hour FVG while you are on a 15-minute chart is significantly more powerful than a signal from a 15-minute FVG alone. Use HTF zones as major points of interest.
Confirmed Tap-In Logic: The arrow only appears after price has touched the zone and then closed outside of it in the expected direction. This built-in confirmation filters out wicks that simply pass through a zone without a real market reaction.
Dual Alert System:
Entry Alert ("Price has entered..."): This is a heads-up alert. It tells you to pay attention because price is now in your pre-defined zone of interest.
Tap-In Alert ("Confirmed tap-in..."): This is the execution alert. It signals that the conditions for a trade have been met according to the indicator's logic.
Fade on Tapped: When enabled, a zone will become transparent after a confirmed signal. This visually cleans up your chart, showing you which zones have already been tested and "mitigated."
Minimum FVG Size (Ticks): In volatile or ranging markets, many tiny, insignificant FVGs can form. Use this setting to filter out the noise. Increase the value to only display larger, more significant imbalances.
Disclaimer: Trading involves substantial risk. This indicator is a tool for analysis and should not be used as a sole reason to enter a trade. Always practice robust risk management and use this tool in conjunction with your own trading plan. Past performance is not indicative of future results.

RSI Bollinger Bands [DCAUT]█ RSI Bollinger Bands
📊 ORIGINALITY & INNOVATION
The RSI Bollinger Bands indicator represents a meaningful advancement in momentum analysis by combining two proven technical tools: the Relative Strength Index (RSI) and Bollinger Bands. This combination addresses a significant limitation in traditional RSI analysis - the use of fixed overbought/oversold thresholds (typically 70/30) that fail to adapt to changing market volatility conditions.
Core Innovation:
Rather than relying on static threshold levels, this indicator applies Bollinger Bands statistical analysis directly to RSI values, creating dynamic zones that automatically adjust based on recent momentum volatility. This approach helps reduce false signals during low volatility periods while remaining sensitive to genuine extremes during high volatility conditions.
Key Enhancements Over Traditional RSI:
Dynamic Thresholds: Overbought/oversold zones adapt to market conditions automatically, eliminating the need for manual threshold adjustments across different instruments and timeframes
Volatility Context: Band width provides immediate visual feedback about momentum volatility, helping traders distinguish between stable trends and erratic movements
Reduced False Signals: During ranging markets, narrower bands filter out minor RSI fluctuations that would trigger traditional fixed-threshold signals
Breakout Preparation: Band squeeze patterns (similar to price-based BB) signal potential momentum regime changes before they occur
Self-Referencing Analysis: By measuring RSI against its own statistical behavior rather than arbitrary levels, the indicator provides more relevant context
📐 MATHEMATICAL FOUNDATION
Two-Stage Calculation Process:
Stage 1: RSI Calculation
RSI = 100 - (100 / (1 + RS))
where RS = Average Gain / Average Loss over specified period
The RSI normalizes price momentum into a bounded 0-100 scale, making it ideal for statistical band analysis.
Stage 2: Bollinger Bands on RSI
Basis = MA(RSI, BB Length)
Upper Band = Basis + (StdDev(RSI, BB Length) × Multiplier)
Lower Band = Basis - (StdDev(RSI, BB Length) × Multiplier)
Band Width = Upper Band - Lower Band
The Bollinger Bands measure RSI's standard deviation from its own moving average, creating statistically-derived dynamic zones.
Statistical Interpretation:
Under normal distribution assumptions with default 2.0 multiplier, approximately 95% of RSI values should fall within the bands
Band touches represent statistically significant momentum extremes relative to recent behavior
Band width expansion indicates increasing momentum volatility (strengthening trend or increasing uncertainty)
Band width contraction signals momentum consolidation and potential regime change preparation
📊 COMPREHENSIVE SIGNAL ANALYSIS
Visual Color Signals:
This indicator features dynamic color fills that highlight extreme momentum conditions:
Green Fill (Above Upper Band):
Appears when RSI breaks above the upper band, indicating exceptionally strong bullish momentum
Represents dynamic overbought zone - not necessarily a reversal signal but a warning of extreme conditions
In strong uptrends, green fills can persist as RSI "rides the band" - this indicates sustained momentum strength
Exit of green zone (RSI falling back below upper band) often signals initial momentum weakening
Red Fill (Below Lower Band):
Appears when RSI breaks below the lower band, indicating exceptionally weak bearish momentum
Represents dynamic oversold zone - potential reversal or continuation signal depending on trend context
In strong downtrends, red fills can persist as RSI "rides the band" - this indicates sustained selling pressure
Exit of red zone (RSI rising back above lower band) often signals initial momentum recovery
Position-Based Signals:
Upper Band Interactions:
RSI Touching Upper Band: Dynamic overbought condition - momentum is extremely strong relative to recent volatility, potential exhaustion or continuation depending on trend context
RSI Riding Upper Band: Sustained strong momentum, often seen in powerful trends, not necessarily an immediate reversal signal but warrants monitoring for exhaustion
RSI Crossing Below Upper Band: Initial momentum weakening signal, particularly significant if accompanied by price divergence
Lower Band Interactions:
RSI Touching Lower Band: Dynamic oversold condition - momentum is extremely weak relative to recent volatility, potential reversal or continuation of downtrend
RSI Riding Lower Band: Sustained weak momentum, common in strong downtrends, monitor for potential exhaustion
RSI Crossing Above Lower Band: Initial momentum strengthening signal, early indication of potential reversal or consolidation
Basis Line Signals:
RSI Above Basis: Bullish momentum regime - upward pressure dominant
RSI Below Basis: Bearish momentum regime - downward pressure dominant
Basis Crossovers: Momentum regime shifts, more significant when accompanied by band width changes
RSI Oscillating Around Basis: Balanced momentum, often indicates ranging market conditions
Volatility-Based Signals:
Band Width Patterns:
Narrow Bands (Squeeze): Momentum volatility compression, often precedes significant directional moves, similar to price coiling patterns
Expanding Bands: Increasing momentum volatility, indicates trend acceleration or growing uncertainty
Narrowest Band in 100 Bars: Extreme compression alert, high probability of upcoming volatility expansion
Advanced Pattern Recognition:
Divergence Analysis:
Bullish Divergence: Price makes lower lows while RSI touches or stays above previous lower band touch, suggests downward momentum weakening
Bearish Divergence: Price makes higher highs while RSI touches or stays below previous upper band touch, suggests upward momentum weakening
Hidden Bullish: Price makes higher lows while RSI makes lower lows at the lower band, indicates strong underlying bullish momentum
Hidden Bearish: Price makes lower highs while RSI makes higher highs at the upper band, indicates strong underlying bearish momentum
Band Walk Patterns:
Upper Band Walk: RSI consistently touching or staying near upper band indicates exceptionally strong trend, wait for clear break below basis before considering reversal
Lower Band Walk: RSI consistently at lower band signals very weak momentum, requires break above basis for reversal confirmation
🎯 STRATEGIC APPLICATIONS
Strategy 1: Mean Reversion Trading
Setup Conditions:
Market Type: Ranging or choppy markets with no clear directional trend
Timeframe: Works best on lower timeframes (5m-1H) or during consolidation phases
Band Characteristic: Normal to narrow band width
Entry Rules:
Long Entry: RSI touches or crosses below lower band, wait for RSI to start rising back toward basis before entry
Short Entry: RSI touches or crosses above upper band, wait for RSI to start falling back toward basis before entry
Confirmation: Use price action confirmation (candlestick reversal patterns) at band touches
Exit Rules:
Target: RSI returns to basis line or opposite band
Stop Loss: Fixed percentage or below recent swing low/high
Time Stop: Exit if position not profitable within expected timeframe
Strategy 2: Trend Continuation Trading
Setup Conditions:
Market Type: Clear trending market with higher highs/lower lows
Timeframe: Medium to higher timeframes (1H-Daily)
Band Characteristic: Expanding or wide bands indicating strong momentum
Entry Rules:
Long Entry in Uptrend: Wait for RSI to pull back to basis line or slightly below, enter when RSI starts rising again
Short Entry in Downtrend: Wait for RSI to rally to basis line or slightly above, enter when RSI starts falling again
Avoid Counter-Trend: Do not fade RSI at bands during strong trends (band walk patterns)
Exit Rules:
Trailing Stop: Move stop to break-even when RSI reaches opposite band
Trend Break: Exit when RSI crosses basis against trend direction with conviction
Band Squeeze: Reduce position size when bands start narrowing significantly
Strategy 3: Breakout Preparation
Setup Conditions:
Market Type: Consolidating market after significant move or at key technical levels
Timeframe: Any timeframe, but longer timeframes provide more reliable breakouts
Band Characteristic: Narrowest band width in recent 100 bars (squeeze alert)
Preparation Phase:
Identify band squeeze condition (bands at multi-period narrowest point)
Monitor price action for consolidation patterns (triangles, rectangles, flags)
Prepare bracket orders for both directions
Wait for band expansion to begin
Entry Execution:
Breakout Confirmation: Enter in direction of RSI band breakout (RSI breaks above upper band or below lower band)
Price Confirmation: Ensure price also breaks corresponding technical level
Volume Confirmation: Look for volume expansion supporting the breakout
Risk Management:
Stop Loss: Place beyond consolidation pattern opposite extreme
Position Sizing: Use smaller size due to false breakout risk
Quick Exit: Exit immediately if RSI returns inside bands within 1-3 bars
Strategy 4: Multi-Timeframe Analysis
Timeframe Selection:
Higher Timeframe: Daily or 4H for trend context
Trading Timeframe: 1H or 15m for entry signals
Confirmation Timeframe: 5m or 1m for precise entry timing
Analysis Process:
Trend Identification: Check higher timeframe RSI position relative to bands, trade only in direction of higher timeframe momentum
Setup Formation: Wait for trading timeframe RSI to show pullback to basis in trending direction
Entry Timing: Use confirmation timeframe RSI band touch or crossover for precise entry
Alignment Confirmation: All timeframes should show RSI moving in same direction for highest probability setups
📋 DETAILED PARAMETER CONFIGURATION
RSI Source:
Close (Default): Standard price point, balances responsiveness and reliability
HL2: Reduces noise from intrabar volatility, provides smoother RSI values
HLC3 or OHLC4: Further smoothing for very choppy markets, slower to respond but more stable
Volume-Weighted: Consider using VWAP or volume-weighted prices for additional liquidity context
RSI Length Parameter:
Shorter Periods (5-10): More responsive but generates more signals, suitable for scalping or very active trading, higher noise level
Standard (14): Default and most widely used setting, proven balance between responsiveness and reliability, recommended starting point
Longer Periods (21-30): Smoother momentum measurement, fewer but potentially more reliable signals, better for swing trading or position trading
Optimization Note: Test across different market regimes, optimal length often varies by instrument volatility characteristics
RSI MA Type Parameter:
RMA (Default): Wilder's original smoothing method, provides traditional RSI behavior with balanced lag, most widely recognized and tested, recommended for standard technical analysis
EMA: Exponential smoothing gives more weight to recent values, faster response to momentum changes, suitable for active trading and trending markets, reduces lag compared to RMA
SMA: Simple average treats all periods equally, smoothest output with highest lag, best for filtering noise in choppy markets, useful for long-term position analysis
WMA: Weighted average emphasizes recent data less aggressively than EMA, middle ground between SMA and EMA characteristics, balanced responsiveness for swing trading
Advanced Options: Full access to 25+ moving average types including HMA (reduced lag), DEMA/TEMA (enhanced responsiveness), KAMA/FRAMA (adaptive behavior), T3 (smoothness), Kalman Filter (optimal estimation)
Selection Guide: RMA for traditional analysis and backtesting consistency, EMA for faster signals in trending markets, SMA for stability in ranging markets, adaptive types (KAMA/FRAMA) for varying volatility regimes
BB Length Parameter:
Short Length (10-15): Tighter bands that react quickly to RSI changes, more frequent band touches, suitable for active trading styles
Standard (20): Balanced approach providing meaningful statistical context without excessive lag
Long Length (30-50): Smoother bands that filter minor RSI fluctuations, captures only significant momentum extremes, fewer but higher quality signals
Relationship to RSI Length: Consider BB Length greater than RSI Length for cleaner signals
BB MA Type Parameter:
SMA (Default): Standard Bollinger Bands calculation using simple moving average for basis line, treats all periods equally, widely recognized and tested approach
EMA: Exponential smoothing for basis line gives more weight to recent RSI values, creates more responsive bands that adapt faster to momentum changes, suitable for trending markets
RMA: Wilder's smoothing provides consistent behavior aligned with traditional RSI when using RMA for both RSI and BB calculations
WMA: Weighted average for basis line balances recent emphasis with historical context, middle ground between SMA and EMA responsiveness
Advanced Options: Full access to 25+ moving average types for basis calculation, including HMA (reduced lag), DEMA/TEMA (enhanced responsiveness), KAMA/FRAMA (adaptive to volatility changes)
Selection Guide: SMA for standard Bollinger Bands behavior and backtesting consistency, EMA for faster band adaptation in dynamic markets, matching RSI MA type creates unified smoothing behavior
BB Multiplier Parameter:
Conservative (1.5-1.8): Tighter bands resulting in more frequent touches, useful in low volatility environments, higher signal frequency but potentially more false signals
Standard (2.0): Default setting representing approximately 95% confidence interval under normal distribution, widely accepted statistical threshold
Aggressive (2.5-3.0): Wider bands capturing only extreme momentum conditions, fewer but potentially more significant signals, reduces false signals in high volatility
Adaptive Approach: Consider adjusting multiplier based on instrument characteristics, lower multiplier for stable instruments, higher for volatile instruments
Parameter Optimization Workflow:
Start with default parameters (RSI:14, BB:20, Mult:2.0)
Test across representative sample period including different market regimes
Adjust RSI length based on desired responsiveness vs stability tradeoff
Tune BB length to match your typical holding period
Modify multiplier to achieve desired signal frequency
Validate on out-of-sample data to avoid overfitting
Document optimal parameters for different instruments and timeframes
Reference Levels Display:
Enabled (Default): Shows traditional 30/50/70 levels for comparison with dynamic bands, helps visualize the adaptive advantage
Disabled: Cleaner chart focusing purely on dynamic zones, reduces visual clutter for experienced users
Educational Value: Keeping reference levels visible helps understand how dynamic bands differ from fixed thresholds across varying market conditions
📈 PERFORMANCE ANALYSIS & COMPETITIVE ADVANTAGES
Comparison with Traditional RSI:
Fixed Threshold RSI Limitations:
In ranging low-volatility markets: RSI rarely reaches 70/30, missing tradable extremes
In trending high-volatility markets: RSI frequently breaks through 70/30, generating excessive false reversal signals
Across different instruments: Same thresholds applied to volatile crypto and stable forex pairs produce inconsistent results
Threshold Adjustment Problem: Manually changing thresholds for different conditions is subjective and lagging
RSI Bollinger Bands Advantages:
Automatic Adaptation: Bands adjust to current volatility regime without manual intervention
Consistent Logic: Same statistical approach works across different instruments and timeframes
Reduced False Signals: Band width filtering helps distinguish meaningful extremes from noise
Additional Information: Band width provides volatility context missing in standard RSI
Objective Extremes: Statistical basis (standard deviations) provides objective extreme definition
Comparison with Price-Based Bollinger Bands:
Price BB Characteristics:
Measures absolute price volatility
Affected by large price gaps and outliers
Band position relative to price not normalized
Difficult to compare across different price scales
RSI BB Advantages:
Normalized Scale: RSI's 0-100 bounds make band interpretation consistent across all instruments
Momentum Focus: Directly measures momentum extremes rather than price extremes
Reduced Gap Impact: RSI calculation smooths price gaps impact on band calculations
Comparable Analysis: Same RSI BB appearance across stocks, forex, crypto enables consistent strategy application
Performance Characteristics:
Signal Quality:
Higher Signal-to-Noise Ratio: Dynamic bands help filter RSI oscillations that don't represent meaningful extremes
Context-Aware Alerts: Band width provides volatility context helping traders adjust position sizing and stop placement
Reduced Whipsaws: During consolidations, narrower bands prevent premature signals from minor RSI movements
Responsiveness:
Adaptive Lag: Band calculation introduces some lag, but this lag is adaptive to current conditions rather than fixed
Faster Than Manual Adjustment: Automatic band adjustment is faster than trader's ability to manually modify thresholds
Balanced Approach: Combines RSI's inherent momentum lag with BB's statistical smoothing for stable yet responsive signals
Versatility:
Multi-Strategy Application: Supports both mean reversion (ranging markets) and trend continuation (trending markets) approaches
Universal Instrument Coverage: Works effectively across equities, forex, commodities, cryptocurrencies without parameter changes
Timeframe Agnostic: Same interpretation applies from 1-minute charts to monthly charts
Limitations and Considerations:
Known Limitations:
Dual Lag Effect: Combines RSI's momentum lag with BB's statistical lag, making it less suitable for very short-term scalping
Requires Volatility History: Needs sufficient bars for BB calculation, less effective immediately after major regime changes
Statistical Assumptions: Assumes RSI values are somewhat normally distributed, extreme trending conditions may violate this
Not a Standalone System: Like all indicators, should be combined with price action analysis and risk management
Optimal Use Cases:
Best for swing trading and position trading timeframes
Most effective in markets with alternating volatility regimes
Ideal for traders who use multiple instruments and timeframes
Suitable for systematic trading approaches requiring consistent logic
Suboptimal Conditions:
Very low timeframes (< 5 minutes) where lag becomes problematic
Instruments with extreme volatility spikes (gap-prone markets)
Markets in strong persistent trends where mean reversion rarely occurs
Periods immediately following major structural changes (new trading regime)
USAGE NOTES
This indicator is designed for technical analysis and educational purposes to help traders understand the interaction between momentum measurement and statistical volatility bands. The RSI Bollinger Bands has limitations and should not be used as the sole basis for trading decisions.
Important Considerations:
No Predictive Guarantee: Past band touches and patterns do not guarantee future price behavior
Market Regime Dependency: Indicator performance varies significantly between trending and ranging market conditions
Complementary Analysis Required: Should be used alongside price action, support/resistance levels, and fundamental analysis
Risk Management Essential: Always use proper position sizing, stop losses, and risk controls regardless of signal quality
Parameter Sensitivity: Different instruments and timeframes may require parameter optimization for optimal results
Continuous Monitoring: Band characteristics change with market conditions, requiring ongoing assessment
Recommended Supporting Analysis:
Price structure analysis (support/resistance, trend lines)
Volume confirmation for breakout signals
Multiple timeframe alignment
Market context awareness (news events, session times)
Correlation analysis with related instruments
The indicator aims to provide adaptive momentum analysis that adjusts to changing market volatility, but traders must apply sound judgment, proper risk management, and comprehensive market analysis in their decision-making process.

Keltner Channel Enhanced [DCAUT]█ Keltner Channel Enhanced
📊 ORIGINALITY & INNOVATION
The Keltner Channel Enhanced represents an important advancement over standard Keltner Channel implementations by introducing dual flexibility in moving average selection for both the middle band and ATR calculation. While traditional Keltner Channels typically use EMA for the middle band and RMA (Wilder's smoothing) for ATR, this enhanced version provides access to 25+ moving average algorithms for both components, enabling traders to fine-tune the indicator's behavior to match specific market characteristics and trading approaches.
Key Advancements:
Dual MA Algorithm Flexibility: Independent selection of moving average types for middle band (25+ options) and ATR smoothing (25+ options), allowing optimization of both trend identification and volatility measurement separately
Enhanced Trend Sensitivity: Ability to use faster algorithms (HMA, T3) for middle band while maintaining stable volatility measurement with traditional ATR smoothing, or vice versa for different trading strategies
Adaptive Volatility Measurement: Choice of ATR smoothing algorithm affects channel responsiveness to volatility changes, from highly reactive (SMA, EMA) to smoothly adaptive (RMA, TEMA)
Comprehensive Alert System: Five distinct alert conditions covering breakouts, trend changes, and volatility expansion, enabling automated monitoring without constant chart observation
Multi-Timeframe Compatibility: Works effectively across all timeframes from intraday scalping to long-term position trading, with independent optimization of trend and volatility components
This implementation addresses key limitations of standard Keltner Channels: fixed EMA/RMA combination may not suit all market conditions or trading styles. By decoupling the trend component from volatility measurement and allowing independent algorithm selection, traders can create highly customized configurations for specific instruments and market phases.
📐 MATHEMATICAL FOUNDATION
Keltner Channel Enhanced uses a three-component calculation system that combines a flexible moving average middle band with ATR-based (Average True Range) upper and lower channels, creating volatility-adjusted trend-following bands.
Core Calculation Process:
1. Middle Band (Basis) Calculation:
The basis line is calculated using the selected moving average algorithm applied to the price source over the specified period:
basis = ma(source, length, maType)
Supported algorithms include EMA (standard choice, trend-biased), SMA (balanced and symmetric), HMA (reduced lag), WMA, VWMA, TEMA, T3, KAMA, and 17+ others.
2. Average True Range (ATR) Calculation:
ATR measures market volatility by calculating the average of true ranges over the specified period:
trueRange = max(high - low, abs(high - close ), abs(low - close ))
atrValue = ma(trueRange, atrLength, atrMaType)
ATR smoothing algorithm significantly affects channel behavior, with options including RMA (standard, very smooth), SMA (moderate smoothness), EMA (fast adaptation), TEMA (smooth yet responsive), and others.
3. Channel Calculation:
Upper and lower channels are positioned at specified multiples of ATR from the basis:
upperChannel = basis + (multiplier × atrValue)
lowerChannel = basis - (multiplier × atrValue)
Standard multiplier is 2.0, providing channels that dynamically adjust width based on market volatility.
Keltner Channel vs. Bollinger Bands - Key Differences:
While both indicators create volatility-based channels, they use fundamentally different volatility measures:
Keltner Channel (ATR-based):
Uses Average True Range to measure actual price movement volatility
Incorporates gaps and limit moves through true range calculation
More stable in trending markets, less prone to extreme compression
Better reflects intraday volatility and trading range
Typically fewer band touches, making touches more significant
More suitable for trend-following strategies
Bollinger Bands (Standard Deviation-based):
Uses statistical standard deviation to measure price dispersion
Based on closing prices only, doesn't account for intraday range
Can compress significantly during consolidation (squeeze patterns)
More touches in ranging markets
Better suited for mean-reversion strategies
Provides statistical probability framework (95% within 2 standard deviations)
Algorithm Combination Effects:
The interaction between middle band MA type and ATR MA type creates different indicator characteristics:
Trend-Focused Configuration (Fast MA + Slow ATR): Middle band uses HMA/EMA/T3, ATR uses RMA/TEMA, quick trend changes with stable channel width, suitable for trend-following
Volatility-Focused Configuration (Slow MA + Fast ATR): Middle band uses SMA/WMA, ATR uses EMA/SMA, stable trend with dynamic channel width, suitable for volatility trading
Balanced Configuration (Standard EMA/RMA): Classic Keltner Channel behavior, time-tested combination, suitable for general-purpose trend following
Adaptive Configuration (KAMA + KAMA): Self-adjusting indicator responding to efficiency ratio, suitable for markets with varying trend strength and volatility regimes
📊 COMPREHENSIVE SIGNAL ANALYSIS
Keltner Channel Enhanced provides multiple signal categories optimized for trend-following and breakout strategies.
Channel Position Signals:
Upper Channel Interaction:
Price Touching Upper Channel: Strong bullish momentum, price moving more than typical volatility range suggests, potential continuation signal in established uptrends
Price Breaking Above Upper Channel: Exceptional strength, price exceeding normal volatility expectations, consider adding to long positions or tightening trailing stops
Price Riding Upper Channel: Sustained strong uptrend, characteristic of powerful bull moves, stay with trend and avoid premature profit-taking
Price Rejection at Upper Channel: Momentum exhaustion signal, consider profit-taking on longs or waiting for pullback to middle band for reentry
Lower Channel Interaction:
Price Touching Lower Channel: Strong bearish momentum, price moving more than typical volatility range suggests, potential continuation signal in established downtrends
Price Breaking Below Lower Channel: Exceptional weakness, price exceeding normal volatility expectations, consider adding to short positions or protecting against further downside
Price Riding Lower Channel: Sustained strong downtrend, characteristic of powerful bear moves, stay with trend and avoid premature covering
Price Rejection at Lower Channel: Momentum exhaustion signal, consider covering shorts or waiting for bounce to middle band for reentry
Middle Band (Basis) Signals:
Trend Direction Confirmation:
Price Above Basis: Bullish trend bias, middle band acts as dynamic support in uptrends, consider long positions or holding existing longs
Price Below Basis: Bearish trend bias, middle band acts as dynamic resistance in downtrends, consider short positions or avoiding longs
Price Crossing Above Basis: Potential trend change from bearish to bullish, early signal to establish long positions
Price Crossing Below Basis: Potential trend change from bullish to bearish, early signal to establish short positions or exit longs
Pullback Trading Strategy:
Uptrend Pullback: Price pulls back from upper channel to middle band, finds support, and resumes upward, ideal long entry point
Downtrend Bounce: Price bounces from lower channel to middle band, meets resistance, and resumes downward, ideal short entry point
Basis Test: Strong trends often show price respecting the middle band as support/resistance on pullbacks
Failed Test: Price breaking through middle band against trend direction signals potential reversal
Volatility-Based Signals:
Narrow Channels (Low Volatility):
Consolidation Phase: Channels contract during periods of reduced volatility and directionless price action
Breakout Preparation: Narrow channels often precede significant directional moves as volatility cycles
Trading Approach: Reduce position sizes, wait for breakout confirmation, avoid range-bound strategies within channels
Breakout Direction: Monitor for price breaking decisively outside channel range with expanding width
Wide Channels (High Volatility):
Trending Phase: Channels expand during strong directional moves and increased volatility
Momentum Confirmation: Wide channels confirm genuine trend with substantial volatility backing
Trading Approach: Trend-following strategies excel, wider stops necessary, mean-reversion strategies risky
Exhaustion Signs: Extreme channel width (historical highs) may signal approaching consolidation or reversal
Advanced Pattern Recognition:
Channel Walking Pattern:
Upper Channel Walk: Price consistently touches or exceeds upper channel while staying above basis, very strong uptrend signal, hold longs aggressively
Lower Channel Walk: Price consistently touches or exceeds lower channel while staying below basis, very strong downtrend signal, hold shorts aggressively
Basis Support/Resistance: During channel walks, price typically uses middle band as support/resistance on minor pullbacks
Pattern Break: Price crossing basis during channel walk signals potential trend exhaustion
Squeeze and Release Pattern:
Squeeze Phase: Channels narrow significantly, price consolidates near middle band, volatility contracts
Direction Clues: Watch for price positioning relative to basis during squeeze (above = bullish bias, below = bearish bias)
Release Trigger: Price breaking outside narrow channel range with expanding width confirms breakout
Follow-Through: Measure squeeze height and project from breakout point for initial profit targets
Channel Expansion Pattern:
Breakout Confirmation: Rapid channel widening confirms volatility increase and genuine trend establishment
Entry Timing: Enter positions early in expansion phase before trend becomes overextended
Risk Management: Use channel width to size stops appropriately, wider channels require wider stops
Basis Bounce Pattern:
Clean Bounce: Price touches middle band and immediately reverses, confirms trend strength and entry opportunity
Multiple Bounces: Repeated basis bounces indicate strong, sustainable trend
Bounce Failure: Price penetrating basis signals weakening trend and potential reversal
Divergence Analysis:
Price/Channel Divergence: Price makes new high/low while staying within channel (not reaching outer band), suggests momentum weakening
Width/Price Divergence: Price breaks to new extremes but channel width contracts, suggests move lacks conviction
Reversal Signal: Divergences often precede trend reversals or significant consolidation periods
Multi-Timeframe Analysis:
Keltner Channels work particularly well in multi-timeframe trend-following approaches:
Three-Timeframe Alignment:
Higher Timeframe (Weekly/Daily): Identify major trend direction, note price position relative to basis and channels
Intermediate Timeframe (Daily/4H): Identify pullback opportunities within higher timeframe trend
Lower Timeframe (4H/1H): Time precise entries when price touches middle band or lower channel (in uptrends) with rejection
Optimal Entry Conditions:
Best Long Entries: Higher timeframe in uptrend (price above basis), intermediate timeframe pulls back to basis, lower timeframe shows rejection at middle band or lower channel
Best Short Entries: Higher timeframe in downtrend (price below basis), intermediate timeframe bounces to basis, lower timeframe shows rejection at middle band or upper channel
Risk Management: Use higher timeframe channel width to set position sizing, stops below/above higher timeframe channels
🎯 STRATEGIC APPLICATIONS
Keltner Channel Enhanced excels in trend-following and breakout strategies across different market conditions.
Trend Following Strategy:
Setup Requirements:
Identify established trend with price consistently on one side of basis line
Wait for pullback to middle band (basis) or brief penetration through it
Confirm trend resumption with price rejection at basis and move back toward outer channel
Enter in trend direction with stop beyond basis line
Entry Rules:
Uptrend Entry:
Price pulls back from upper channel to middle band, shows support at basis (bullish candlestick, momentum divergence)
Enter long on rejection/bounce from basis with stop 1-2 ATR below basis
Aggressive: Enter on first touch; Conservative: Wait for confirmation candle
Downtrend Entry:
Price bounces from lower channel to middle band, shows resistance at basis (bearish candlestick, momentum divergence)
Enter short on rejection/reversal from basis with stop 1-2 ATR above basis
Aggressive: Enter on first touch; Conservative: Wait for confirmation candle
Trend Management:
Trailing Stop: Use basis line as dynamic trailing stop, exit if price closes beyond basis against position
Profit Taking: Take partial profits at opposite channel, move stops to basis
Position Additions: Add to winners on subsequent basis bounces if trend intact
Breakout Strategy:
Setup Requirements:
Identify consolidation period with contracting channel width
Monitor price action near middle band with reduced volatility
Wait for decisive breakout beyond channel range with expanding width
Enter in breakout direction after confirmation
Breakout Confirmation:
Price breaks clearly outside channel (upper for longs, lower for shorts), channel width begins expanding from contracted state
Volume increases significantly on breakout (if using volume analysis)
Price sustains outside channel for multiple bars without immediate reversal
Entry Approaches:
Aggressive: Enter on initial break with stop at opposite channel or basis, use smaller position size
Conservative: Wait for pullback to broken channel level, enter on rejection and resumption, tighter stop
Volatility-Based Position Sizing:
Adjust position sizing based on channel width (ATR-based volatility):
Wide Channels (High ATR): Reduce position size as stops must be wider, calculate position size using ATR-based risk calculation: Risk / (Stop Distance in ATR × ATR Value)
Narrow Channels (Low ATR): Increase position size as stops can be tighter, be cautious of impending volatility expansion
ATR-Based Risk Management: Use ATR-based risk calculations, position size = 0.01 × Capital / (2 × ATR), use multiples of ATR (1-2 ATR) for adaptive stops
Algorithm Selection Guidelines:
Different market conditions benefit from different algorithm combinations:
Strong Trending Markets: Middle band use EMA or HMA, ATR use RMA, capture trends quickly while maintaining stable channel width
Choppy/Ranging Markets: Middle band use SMA or WMA, ATR use SMA or WMA, avoid false trend signals while identifying genuine reversals
Volatile Markets: Middle band and ATR both use KAMA or FRAMA, self-adjusting to changing market conditions reduces manual optimization
Breakout Trading: Middle band use SMA, ATR use EMA or SMA, stable trend with dynamic channels highlights volatility expansion early
Scalping/Day Trading: Middle band use HMA or T3, ATR use EMA or TEMA, both components respond quickly
Position Trading: Middle band use EMA/TEMA/T3, ATR use RMA or TEMA, filter out noise for long-term trend-following
📋 DETAILED PARAMETER CONFIGURATION
Understanding and optimizing parameters is essential for adapting Keltner Channel Enhanced to specific trading approaches.
Source Parameter:
Close (Most Common): Uses closing price, reflects daily settlement, best for end-of-day analysis and position trading, standard choice
HL2 (Median Price): Smooths out closing bias, better represents full daily range in volatile markets, good for swing trading
HLC3 (Typical Price): Gives more weight to close while including full range, popular for intraday applications, slightly more responsive than HL2
OHLC4 (Average Price): Most comprehensive price representation, smoothest option, good for gap-prone markets or highly volatile instruments
Length Parameter:
Controls the lookback period for middle band (basis) calculation:
Short Periods (10-15): Very responsive to price changes, suitable for day trading and scalping, higher false signal rate
Standard Period (20 - Default): Represents approximately one month of trading, good balance between responsiveness and stability, suitable for swing and position trading
Medium Periods (30-50): Smoother trend identification, fewer false signals, better for position trading and longer holding periods
Long Periods (50+): Very smooth, identifies major trends only, minimal false signals but significant lag, suitable for long-term investment
Optimization by Timeframe: 1-15 minute charts use 10-20 period, 30-60 minute charts use 20-30 period, 4-hour to daily charts use 20-40 period, weekly charts use 20-30 weeks.
ATR Length Parameter:
Controls the lookback period for Average True Range calculation, affecting channel width:
Short ATR Periods (5-10): Very responsive to recent volatility changes, standard is 10 (Keltner's original specification), may be too reactive in whipsaw conditions
Standard ATR Period (10 - Default): Chester Keltner's original specification, good balance between responsiveness and stability, most widely used
Medium ATR Periods (14-20): Smoother channel width, ATR 14 aligns with Wilder's original ATR specification, good for position trading
Long ATR Periods (20+): Very smooth channel width, suitable for long-term trend-following
Length vs. ATR Length Relationship: Equal values (20/20) provide balanced responsiveness, longer ATR (20/14) gives more stable channel width, shorter ATR (20/10) is standard configuration, much shorter ATR (20/5) creates very dynamic channels.
Multiplier Parameter:
Controls channel width by setting ATR multiples:
Lower Values (1.0-1.5): Tighter channels with frequent price touches, more trading signals, higher false signal rate, better for range-bound and mean-reversion strategies
Standard Value (2.0 - Default): Chester Keltner's recommended setting, good balance between signal frequency and reliability, suitable for both trending and ranging strategies
Higher Values (2.5-3.0): Wider channels with less frequent touches, fewer but potentially higher-quality signals, better for strong trending markets
Market-Specific Optimization: High volatility markets (crypto, small-caps) use 2.5-3.0 multiplier, medium volatility markets (major forex, large-caps) use 2.0 multiplier, low volatility markets (bonds, utilities) use 1.5-2.0 multiplier.
MA Type Parameter (Middle Band):
Critical selection that determines trend identification characteristics:
EMA (Exponential Moving Average - Default): Standard Keltner Channel choice, Chester Keltner's original specification, emphasizes recent prices, faster response to trend changes, suitable for all timeframes
SMA (Simple Moving Average): Equal weighting of all data points, no directional bias, slower than EMA, better for ranging markets and mean-reversion
HMA (Hull Moving Average): Minimal lag with smooth output, excellent for fast trend identification, best for day trading and scalping
TEMA (Triple Exponential Moving Average): Advanced smoothing with reduced lag, responsive to trends while filtering noise, suitable for volatile markets
T3 (Tillson T3): Very smooth with minimal lag, excellent for established trend identification, suitable for position trading
KAMA (Kaufman Adaptive Moving Average): Automatically adjusts speed based on market efficiency, slow in ranging markets, fast in trends, suitable for markets with varying conditions
ATR MA Type Parameter:
Determines how Average True Range is smoothed, affecting channel width stability:
RMA (Wilder's Smoothing - Default): J. Welles Wilder's original ATR smoothing method, very smooth, slow to adapt to volatility changes, provides stable channel width
SMA (Simple Moving Average): Equal weighting, moderate smoothness, faster response to volatility changes than RMA, more dynamic channel width
EMA (Exponential Moving Average): Emphasizes recent volatility, quick adaptation to new volatility regimes, very responsive channel width changes
TEMA (Triple Exponential Moving Average): Smooth yet responsive, good balance for varying volatility, suitable for most trading styles
Parameter Combination Strategies:
Conservative Trend-Following: Length 30/ATR Length 20/Multiplier 2.5, MA Type EMA or TEMA/ATR MA Type RMA, smooth trend with stable wide channels, suitable for position trading
Standard Balanced Approach: Length 20/ATR Length 10/Multiplier 2.0, MA Type EMA/ATR MA Type RMA, classic Keltner Channel configuration, suitable for general purpose swing trading
Aggressive Day Trading: Length 10-15/ATR Length 5-7/Multiplier 1.5-2.0, MA Type HMA or EMA/ATR MA Type EMA or SMA, fast trend with dynamic channels, suitable for scalping and day trading
Breakout Specialist: Length 20-30/ATR Length 5-10/Multiplier 2.0, MA Type SMA or WMA/ATR MA Type EMA or SMA, stable trend with responsive channel width
Adaptive All-Conditions: Length 20/ATR Length 10/Multiplier 2.0, MA Type KAMA or FRAMA/ATR MA Type KAMA or TEMA, self-adjusting to market conditions
Offset Parameter:
Controls horizontal positioning of channels on chart. Positive values shift channels to the right (future) for visual projection, negative values shift left (past) for historical analysis, zero (default) aligns with current price bars for real-time signal analysis. Offset affects only visual display, not alert conditions or actual calculations.
📈 PERFORMANCE ANALYSIS & COMPETITIVE ADVANTAGES
Keltner Channel Enhanced provides improvements over standard implementations while maintaining proven effectiveness.
Response Characteristics:
Standard EMA/RMA Configuration: Moderate trend lag (approximately 0.4 × length periods), smooth and stable channel width from RMA smoothing, good balance for most market conditions
Fast HMA/EMA Configuration: Approximately 60% reduction in trend lag compared to EMA, responsive channel width from EMA ATR smoothing, suitable for quick trend changes and breakouts
Adaptive KAMA/KAMA Configuration: Variable lag based on market efficiency, automatic adjustment to trending vs. ranging conditions, self-optimizing behavior reduces manual intervention
Comparison with Traditional Keltner Channels:
Enhanced Version Advantages:
Dual Algorithm Flexibility: Independent MA selection for trend and volatility vs. fixed EMA/RMA, separate tuning of trend responsiveness and channel stability
Market Adaptation: Choose configurations optimized for specific instruments and conditions, customize for scalping, swing, or position trading preferences
Comprehensive Alerts: Enhanced alert system including channel expansion detection
Traditional Version Advantages:
Simplicity: Fewer parameters, easier to understand and implement
Standardization: Fixed EMA/RMA combination ensures consistency across users
Research Base: Decades of backtesting and research on standard configuration
When to Use Enhanced Version: Trading multiple instruments with different characteristics, switching between trending and ranging markets, employing different strategies, algorithm-based trading systems requiring customization, seeking optimization for specific trading style and timeframe.
When to Use Standard Version: Beginning traders learning Keltner Channel concepts, following published research or trading systems, preferring simplicity and standardization, wanting to avoid optimization and curve-fitting risks.
Performance Across Market Conditions:
Strong Trending Markets: EMA or HMA basis with RMA or TEMA ATR smoothing provides quicker trend identification, pullbacks to basis offer excellent entry opportunities
Choppy/Ranging Markets: SMA or WMA basis with RMA ATR smoothing and lower multipliers, channel bounce strategies work well, avoid false breakouts
Volatile Markets: KAMA or FRAMA with EMA or TEMA, adaptive algorithms excel by automatic adjustment, wider multipliers (2.5-3.0) accommodate large price swings
Low Volatility/Consolidation: Channels narrow significantly indicating consolidation, algorithm choice less impactful, focus on detecting channel width contraction for breakout preparation
Keltner Channel vs. Bollinger Bands - Usage Comparison:
Favor Keltner Channels When: Trend-following is primary strategy, trading volatile instruments with gaps, want ATR-based volatility measurement, prefer fewer higher-quality channel touches, seeking stable channel width during trends.
Favor Bollinger Bands When: Mean-reversion is primary strategy, trading instruments with limited gaps, want statistical framework based on standard deviation, need squeeze patterns for breakout identification, prefer more frequent trading opportunities.
Use Both Together: Bollinger Band squeeze + Keltner Channel breakout is powerful combination, price outside Bollinger Bands but inside Keltner Channels indicates moderate signal, price outside both indicates very strong signal, Bollinger Bands for entries and Keltner Channels for trend confirmation.
Limitations and Considerations:
General Limitations:
Lagging Indicator: All moving averages lag price, even with reduced-lag algorithms
Trend-Dependent: Works best in trending markets, less effective in choppy conditions
No Direction Prediction: Indicates volatility and deviation, not future direction, requires confirmation
Enhanced Version Specific Considerations:
Optimization Risk: More parameters increase risk of curve-fitting historical data
Complexity: Additional choices may overwhelm beginning traders
Backtesting Challenges: Different algorithms produce different historical results
Mitigation Strategies:
Use Confirmation: Combine with momentum indicators (RSI, MACD), volume, or price action
Test Parameter Robustness: Ensure parameters work across range of values, not just optimized ones
Multi-Timeframe Analysis: Confirm signals across different timeframes
Proper Risk Management: Use appropriate position sizing and stops
Start Simple: Begin with standard EMA/RMA before exploring alternatives
Optimal Usage Recommendations:
For Maximum Effectiveness:
Start with standard EMA/RMA configuration to understand classic behavior
Experiment with alternatives on demo account or paper trading
Match algorithm combination to market condition and trading style
Use channel width analysis to identify market phases
Combine with complementary indicators for confirmation
Implement strict risk management using ATR-based position sizing
Focus on high-quality setups rather than trading every signal
Respect the trend: trade with basis direction for higher probability
Complementary Indicators:
RSI or Stochastic: Confirm momentum at channel extremes
MACD: Confirm trend direction and momentum shifts
Volume: Validate breakouts and trend strength
ADX: Measure trend strength, avoid Keltner signals in weak trends
Support/Resistance: Combine with traditional levels for high-probability setups
Bollinger Bands: Use together for enhanced breakout and volatility analysis
USAGE NOTES
This indicator is designed for technical analysis and educational purposes. Keltner Channel Enhanced has limitations and should not be used as the sole basis for trading decisions. While the flexible moving average selection for both trend and volatility components provides valuable adaptability across different market conditions, algorithm performance varies with market conditions, and past characteristics do not guarantee future results.
Key considerations:
Always use multiple forms of analysis and confirmation before entering trades
Backtest any parameter combination thoroughly before live trading
Be aware that optimization can lead to curve-fitting if not done carefully
Start with standard EMA/RMA settings and adjust only when specific conditions warrant
Understand that no moving average algorithm can eliminate lag entirely
Consider market regime (trending, ranging, volatile) when selecting parameters
Use ATR-based position sizing and risk management on every trade
Keltner Channels work best in trending markets, less effective in choppy conditions
Respect the trend direction indicated by price position relative to basis line
The enhanced flexibility of dual algorithm selection provides powerful tools for adaptation but requires responsible use, thorough understanding of how different algorithms behave under various market conditions, and disciplined risk management.

cd_VWAP_mtg_CxCd_VWAP_mtg_Cx
Overview
The most important condition for being successful and profitable in the market is to consistently follow the same rules without compromise, while the price constantly moves in countless different ways.
Regardless of the concept or trading school, those who have rules win.
In this indicator, we will define and use three main sections to set and apply our rules.
The indicator uses the VWAP (Volume Weighted Average Price) — price weighted by volume.
Two VWAPs can be displayed either by manually entering date and time, or by selecting from the menu.
From the menu, you can select the following reference levels:
• HTF Open: Opening candle of the higher timeframe
• ATH / ATL: All-Time High / All-Time Low candles
• PMH / PML, PWH / PWL, PDH / PDL, PH4H / PH4L: Previous Month, Week, Day, or H4 Highs/Lows
• MH / ML, WH / WL, DH / DL, H4H / H4L: Current Month, Week, Day, or H4 Highs/Lows
Additionally, it includes:
• Mitigation / Order Block zones (local buyer-seller balance) across two timeframes.
• Buy/Sell Side Liquidity levels (BSL / SSL) from the aligned higher timeframe (target levels).
________________________________________
Components and Usage
1 – VWAP
Calculated using the classical method:
• High + Volume for the upper value
• Close + Volume for the middle value
• Low + Volume for the lower value
The VWAP is displayed as a colored band, where the coloring represents the bias.
Let’s call this band FVB (Fair Value Band) for ease of explanation.
The FVB represents the final line of defense, the buyer/seller boundary, and in technical terms, it can be viewed as premium/discount zones or support/resistance levels.
Within this critical area, the strong side continues its move, while the weaker side is forced to retreat.
But does the side that breaks beyond the band always keep going?
We all know that’s not always the case — in different pairs and timeframes, price often violates both the upper and lower edges multiple times.
To achieve more consistent analysis, we’ll define a new set of rules.
________________________________________
2 – Mitigation / Order Blocks
In trading literature, there are dozens of different definitions and uses of mitigation or order blocks.
Here, we will interpret the candlesticks to create our own definition, and we’ll use the zones defined by candles that fit this pattern.
For simplicity, let’s abbreviate mitigation as “mtg.”
For a candle to be selected as an mtg, it must clearly show strength from one side (buyers or sellers) — which can also be observed visually on the chart.
________________________________________
Bullish mtg criteria:
1. The first candle must be bullish (close > open) → buyers are strong.
2. The next candle makes a new high (buyers push higher) but fails to close above and pulls back to close inside the previous range → sellers react.
It also must not break the previous low → buyers defend.
3. In the following candle(s), as long as the first candle’s low is protected and the second candle’s high is broken, it indicates buyer strength → a bullish mtg is confirmed.
When price returns to this zone later (gets mitigated), the expectation is that the zone holds and price pushes upward again.
If the low is violated, the mtg becomes invalid.
In technical terms:
If the previous candle’s high is broken but no close occurs above it, the expectation is a reversal move that will retest its low.
Question:
What if the low is protected and in the next candle(s) a new high forms?
Answer: → Bullish mtg.
Bearish mtg (opposite)
3 – Buy/Sell Side Liquidity Levels
With the help of the aligned higher timeframe (swing points), we will define our market structure framework and set our liquidity targets accordingly.
Let’s put the pieces together.
If we continue explaining from a trade-focused perspective, our first priority should be our bias — our projection or expectation of the market’s potential movement.
We will determine this bias using the FVB.
Since we know the band often gets violated on both sides, we want the price action to convince us of its strength.
To do that, we’ll use the first candle that closes beyond the band.
The distance from that candle’s high to low will be our threshold range
Bullish level = high + (candle length × coefficient)
Bearish level = low - (candle length × coefficient)
When the price closes beyond this threshold, it demonstrates strength, and our bias will now align in that direction.
How long will this bias remain valid?
→ Until a closing candle appears on the opposite side of the band.
If a close occurs on the opposite side, then a new bias will only be confirmed once the new threshold level is broken.
During the period in between, we have no bias.
Let’s continue on the chart:
Now that our bias has been established, where and how do we look for trade opportunities?
There are two possible entry approaches:
• Aggressive entry: Enter immediately with the breakout.
• Conservative entry: Wait for a pullback and enter once a suitable structure forms.
(The choice depends on the user’s preference.)
At this stage, the user can apply their own entry model. Let’s give an example:
Let’s assume we’re looking for setups using HTF sweep + LTF CISD confirmation.
Once our bias turns bearish, we look for an HTF sweep forming on or near an FVB or mtg block, and then confirm the entry with a CISD signal.
In summary:
• FVB defines the bias, the entry zone, and the target zone.
• Mtg blocks represent entry zones.
• BSL / SSL levels suggest target zones.
Overlapping FVB and mtg blocks are expected to be more effective.
The indicator also provides an option for a second FVB.
A band attached to a lower timeframe can be used as confirmation.
• Main band: Bias + FVB
• Extra band: Entry trigger confirmed by a close beyond it.
Mtg blocks can provide trade entry opportunities, especially when the price is moving strongly in one direction (flow).
Consecutive or complementary mtg blocks indicate that the price is decisive in one direction, while sometimes also showing areas where we should wait before entering.
Mtg blocks that contain an FVG (Fair Value Gap) within their body are expected to be more effective.
Settings:
The default values are set to 1-3-5m, optimized for scalping trades.
VWAP settings:
Main VWAP (FVB):
• Can be set by selecting a start time, manually entering date and time, or choosing a predefined level.
Extra VWAP (FVB):
• Set from the menu. If not needed, select “none.”
• Visibility, color, and fill settings for VWAP are located here.
• Threshold levels visibility and color options are also in this section.
• The multiplier is used for calculating the threshold level.
Important:
• If the Extra VWAP is selected but not displayed, you need to increase the chart timeframe.
o Example: If the chart is on 3m and you select WH from the extra options, it will not display correctly.
• Upper limits for VWAP:
o 1m and 3m charts: daily High/Low
o 5m chart: weekly High/Low
________________________________________
Mtg Settings:
• Visibility and color settings for blocks are configured here.
• To display on a second timeframe, the box must be checked and the timeframe specified.
• Optional display modes: “only active blocks,” “only last violated mtg,” or “all.”
• For confirmation and removal criteria, choosing high/low or close determines the source used for mtg block formation and deletion conditions.
BSL/SSL Settings:
• Visibility, color, font size, and line style can be configured in this section.
When “Auto” is selected, the aligned timeframe is determined automatically by the indicator, while in manual mode, the user defines the timeframe.
Final Words:
Simply opening trades every time the price touches the VWAP or mtg blocks will not make you a profitable trader. Searching for setups with similar structures while maintaining proper risk management will yield better results in the long run.
I would be happy to hear your feedback and suggestions.
Happy trading!

GRG/RGR Signal, MA, Ranges and PivotsThis indicator is a combination of several indicators.
It is a combination of two of my indicators which I solely use for trading
1. EMA 10-20-50-200, Pivots and Previous Day/Week/Month range
2. 3/4-Bar GRG / RGR Pattern (Conditional 4th Candle)
You can use them individually if you already have some of them or just use this one. Belive me when I say, this is all you need, along with market structure knowlege and even if you don’t have that, this indicator has been doing wonders for me. This is all I use. I do not use anything else.
**Note - Do checkout the indicators individually as I have added valuable information in the comment section.
It contains the following,
1. 10 EMA/SMA - configurable
2. 20 EMA/SMA - configurable
3. 50 EMA/SMA - configurable
4. 200 EMA/SMA - configurable
5. Previous Day's Range - configurable
6. Previous Week's Range - configurable
7. Previous Month's Range - configurable
8. Pivots - configurable
9. Buy Sell Signal - configurable
The Moving Averages
It is a very important combination and using it correctly with price action will strengthen your entries and exits.
The ema's or sma's added are the most powerful ones and they do definitely act as support and resistance.
The Daily/Weekly/Monthly Ranges
The Daily/Weekly/Monthly ranges are extremely important for any trader and should be used for targets and reversals.
Pivots
Pivots can provide support and resistance level. R5 and S5 can be used to check for over stretched conditions. You can customise them however you like. It is a full pivot indicator.
It is defaulted to show R5 and S5 only to reduce noise in the chart but it can be customised.
The 3/4 RGR or GRG Signal Generator
Combined with a 3/4 RGR or GRG setup can be all a trader needs.
You don't need complex strategies and SMC concepts to trade. Simple EMAs, ranges and RGR/GRG setup is the most winning combination.
This indicator can be used to identify the Green-Red-Green or Red-Green-Red pattern.
It is a price action indicator where a price action which identifies the defeat of buyers and sellers.
If the buyers comprehensively defeat the sellers then the price moves up and if the sellers defeat the buyers then the price moves down.
In my trading experience this is what defines the price movement.
It is a 3 or 4 candle pattern, beyond that i.e, 5 or more candles could mean a very sideways market and unnecessary signal generation.
How does it work?
Upside/Green signal
1. Say candle 1 is Green, which means buyers stepped in, then candle 2 is Red or a Doji, that means sellers brought the price down. Then if candle 3 is forming to be Green and breaks the closing of the 1st candle and opening of the 2nd candle, then a green arrow will appear and that is the place where you want to take your trade.
2. Here the buyers defeated the sellers.
3. Sometimes candle 3 falls short but candle 4 breaks candle 1's closing and candle 2's opening price. We can enter on candle 4.
4. Important - We need to enter the trade as soon as the price moves above the candle 1 and 2's body and should not wait for the 3rd or 4th candle to close. Ignore wicks.
5. But for a more optimised entry I have added an option to use candle’s highs and lows instead of open and close. This reduces lot of noise and provides us with more precise entry. This setting is turned on by default.
6. I have restricted it to 4 candles and that is all that is needed. More than that is a longer sideways market.
7. I call it the +-+ or GRG pattern or Green-Red-Green or Buyer-Seller-Buyer or Seller defeated or just Buyer pattern.
8. Stop loss can be candle 2's mid for safe traders (that includes me) or candle 2's body low for risky traders.
9. Back testing suggests that body low will be useless and result in more points in loss because for the bigger move this point will not be touched, so why not get out faster.
Downside/Red signal
1. Say candle 1 is Red, which means sellers stepped in, then candle 2 is Green or a Doji, that means buyers took the price up. Then if candle 3 is forming to be Red and breaks the closing of the 1st candle and opening of the 2nd candle then a Red arrow will appear and that is the place where you want to take your trade.
2. Sometimes candle 3 falls short but candle 4 breaks candle 1's closing and candle 2's opening price. We can enter on candle 4.
3. We need to enter the trade as soon as the price moves below the candle 1 and 2's body and should not wait for the 3rd or 4th candle to close.
4. But for a more optimised entry I have added an option to use candle’s highs and lows instead of open and close. This reduces lot of noise and provides us with more precise entry. This setting is turned on by default.
5. I have restricted it to 4 candles and that is all that is needed. More than that is a longer sideways market.
6. I call it the -+- or RGR pattern or Red-Green-Red or Seller-Buyer-Seller or Buyer defeated or just Seller pattern.
7. Stop loss can be candle 2's mid for safe traders ( that includes me) or candle 2's body high for risky traders.
8. Back testing suggests that body high will be useless and result in more points in loss because for the bigger move this point will not be touched, so why not get out faster.
Combining Indicators and Signal
Combining these indicators with GRG/RGR signal can be very powerful and can provide big moves.
1. MA crossover and Signal - This is very powerful and provides a very big move. Trades can be held for longer. If after taking the trade we notice that the MA crossover has happened then trades can be held for higher targets.
2. Pivots and Signal - Pivots and add a support or resistance point. Take profits on these points. R5/S5 are over streched conditions so we can start looking for reversal signals and ignore other signals
3. Intraday Range - first 1, 5, 15 min of the day - Sideways days is when price will stay in these ranges. You can take profits at these ranges or if the range is broken and we get a signal, then it can mean that the direction will be sustained.
4. Previous Day/Week/Month Ranges - These can be used as Take Profit points if the price is moving towards them after getting the signal. If the range is broken and we get a signal then it can be a strong signal. They can also be used as reversal points if a strong signal is generated.
Important Settings
1. Include 4th Candle Confirmation - You can enable or disable the 4th candle signal to avoid the noise, but at times I have noticed that the 4th candle gives a very strong signal or I can say that the strong signal falls on the 4th candle. This is mostly a coincidence.
2. Bars to check (default 10) - You can also configure how many previous bars should the signal be generated for. 10 to 30 is good enough. To backtest increase it to 2000 or 5000 for example.
3. Use Candle High/Low for confirmation instead of Candle Open/Close - More optimized entry and noise reduction. This option is now defaulted to false.
4. Show Green-Red-Green (bull) signals - Show only bull entries. Useful when I have a predefined view i.e, I know market is going to go up today.
5. Show Red-Green-Red (bear) signals - Show only bear entries. Useful when I have a predefined view i.e, I know market is going to go down today.
6. 3rd candle should be a Strong candle before considering 4th candle - This will enforce additional logic in 4 candle setup that the 3rd candle is the candle in our direction of breakout. This means something like GRGG is mandatory, which is still the default behaviour. If disabled, the 3rd candle can be any candle and 4th candle will act as our breakout candle. This behaviour has led to breakouts and breakdowns as times, hence I added this as a separate feature. Vice-versa for a RGGR.
For a 4 candle setup till now we were expecting GRGG or RGRR but we can let the system ignore the 3rd candle completely if needed.
This will result in additional signals.
7. Three intraday ranges added for index and stock traders - 1 min, 5 min and 15 min ranges will be displayed. These are disabled by default except 15 min. These are very important ranges and in sideways days the price will usually move within the 15 min. A breakout of this range and a positive signal can be a very powerful setup.
Safe traders can avoid taking a trade in this range as it can lead to fakeouts.
The line style, width, color and opacity are configurable.
Pointers/Golden Rules
1. If after taking the trade, the next candle moves in your direction and closes strong bullish or bearish, then move SL to break even and after that you can trail it.
2. If a upside trade hits SL and immediately a down side trade signal is generated on the next candle then take it. Vice versa is true.
3. Trades need to be taken on previous 2 candle's body high or low combined and not the wicks.
4. The most losses a trader takes is on a sideways day and because in our strategy the stop loss is so small that even on a sideways day we'll get out with a little profit or worst break even.
5. Hold trades for longer targets and don't panic.
6. If last 3-4 days have been sideways then there is a good probability that today will be trending so we can hold our trade for longer targets. Inverse is true when the market has been trending for 2-3 days then volatility followed by sideways is coming (DOW theory). Target to hold the trade for whole day and not exit till the day closes.
7. In general avoid trading in the middle of the day for index and stocks. Divide the day into 3 parts and avoid the middle.
8. Use Support/Resistance, 10, 20, 50, 200 EMA/SMA, Gaps, Whole/Round numbers(very imp) for identifying targets.
9. Trail your SL.
10. For indexes I would use 5 min and 15 min timeframe and at times 10 mins.
11. For commodities and crypto we can use higher timeframe as well. Look for signals during volatile time durations and avoid trading the whole day. Signal usually gives good targets on those times.
12. If a GRG or RGR pattern appears on a daily timeframe then this is our time to go big.
13. Minimum Risk to Reward should be 1:2 and for longer targets can be 1:4 to 1:10.
14. Trade with small lot size. Money management will happen automatically.
15. With small lot size and correct Risk-Reward we can be very profitable. Don't trade with big lot size.
16. Stay in the market for longer and collect points not money.
17. Very imp - Watch market and learn to generate a market view.
18. Very imp - Only 3 type of candles are needed in trading -
Strong Bullish (Big Green candle), Strong Bearish (Big Red candle),
Hammer (it is Strong Bullish), Inverse Hammer (it is Strong Bearish)
and Doji (indecision or confusion).
If on daily timeframe I see Strong Bullish candle previous day then I am biased to the upside the next day, if I see Strong Bearish candle the previous day then I am biased to the downside the next day, if I see Doji on the previous day then I am cautious the next day, if there are back to back Dojis forming in daily or weekly then I am preparing for big move so time to go big once I get the signal.
19. Most Important Candlestick pattern - Bullish and Bearish Engulfing
20. The only Chart patterns I need -
a) Falling Wedge/Channel Bullish Pattern Uptrend or Bull Flag - Buying - Forming over a couple days for intraday and forming over a couple of weeks for swing
b) Falling Wedge/Channel Bullish Pattern Downtrend or Falling Channel - Buying
c) Rising Wedge Bearish Pattern Uptrend or Rising Channel - Selling
d) Rising Wedge Bearish Pattern Downtrend or Bear flag - Selling
e) Head and Shoulder - Over a longer period not for intraday. In 15 min takes few days and for swing 1hr or 4h or daily can take few days
f) M and W pattern - Reversal Patterns - They form within the above 4 patterns, usually resulting in the break of trend line
21. How Gaps work -
a) Small Gap up in Uptrend - Market can fill the gap and reverse. The perception is that people are buying. If previous day candle was Strong Bullish then market view is up.
b) Big Gap up in Uptrend - Not news driven - Profit booking will come but may not fill the entire gap
c) Big Gap up in Uptrend - News driven, war related, tax, interest rate - Market can keep going up without stopping.
c) Flat opening in Uptrend - Big chance of market going up. If previous day candle was Strong Bullish then view is upwards, if it was Doji then still upwards.
d) Gap down in Uptrend - Market is surprised. After going down initially it can go up
e) Small Gap down in Downtrend - Market can fill the gap and keep moving down. If previous day candle was Strong Bearish then view is still down.
f) Flat opening in Downtrend - View is down, short today.
g) Big Gap down in Downtrend - Profit booking and foolish buying will come but market view is still down.
h) Gap down with News - Volatility, sideways then down.
i) Gap Up in Downtrend - Can move up - Price can move up during 2/3rd of the day and End of the day revert and close in red.
22. Go big on bearish days for option traders. Puts are better bought and Calls are better sold.
23. Cluster of green signals can lead to bigger move on the upside and vice versa for red signals.
24. Most of this is what I learned from successful traders (from the top 2%) only the indicator is mine.

Triple Close Indicator (TCI)Triple Close Indicator (TCI)
Overview:
The Triple Close Indicator (TCI) is a trend-following and entry signal tool designed to simplify market decision-making. Using a 50-period moving average (MA) as the primary trend filter, TCI identifies consecutive close patterns to generate high-probability bullish and bearish entry signals. Its clean design ensures minimal chart clutter while highlighting actionable points.
How It Works:
Trend Identification
The 50 MA is the core trend filter:
Price above 50 MA → bullish trend
Price below 50 MA → bearish trend
Signal Lines (Green/Red Lines)
Green Line: Marks every 3rd consecutive higher close
Red Line: Marks every 3rd consecutive lower close
Signal lines extend 6 bars forward for reference
Users can customize line width, transparency, and style (solid/dotted)
Entry Signals (Triangles)
Bullish Entry:
Green line above 50 MA → look for a candle closing above this line within the next configurable lookback window (default 5 bars)
Red line above 50 MA → if a candle closes above this line within the lookback window, bullish entry is triggered
Bearish Entry:
Red line below 50 MA → look for a candle closing below this line within the lookback window
Green line below 50 MA → if a candle closes below this line within the lookback window, bearish entry is triggered
Visuals
50 MA line – yellow, main trend filter
Signal lines – green/red with customizable width, transparency, and style
Entry triangles – lime for bullish, red for bearish
Alerts are available for real-time notifications
How to Use Effectively:
Trend Confirmation
Only take long entries above 50 MA and short entries below 50 MA
Avoid counter-trend entries to reduce false signals
Signal Validation
Wait for a candle close beyond the signal line to confirm the entry
Use the configurable lookback window to capture the most recent valid candle
Combine with Other Filters (Optional)
Use volume, ATR, or RSI to filter low-probability setups
Multi-timeframe analysis can enhance signal reliability
Alerts
Use built-in TradingView alerts for real-time execution
Customize messages for notifications on mobile, email, or webhook
Inputs & Customization:
MA Type & Length: Choose SMA, EMA, WMA, or VWMA for 50 MA
Signal Line Colors: Green (bullish), Red (bearish)
Line Width & Transparency: Adjust visual clarity
Line Style: Solid or Dotted
Lookback Window: Number of bars to check for valid entry after a signal line
Best Practices:
Use higher timeframes (1H, 4H, daily) for more reliable signals
Avoid trading in tight consolidation zones; the indicator works best in trending markets
Combine with risk management: define stop-loss below/above signal lines or ATR multiples

AI Trading Alerts v6 — SL/TP + Confidence + Panel (Fixed)Overview
This Pine Script is designed to identify high-probability trading opportunities in Forex, commodities, and crypto markets. It combines EMA trend filters, RSI, and Stochastic RSI, with automatic stop-loss (SL) & take-profit (TP) suggestions, and provides a confidence panel to quickly assess the trade setup strength.
It also includes TradingView alert conditions so you can set up notifications for Long/Short setups and EMA crosses.
⚙️ Features
EMA Trend Filter
Uses EMA 50, 100, 200 for trend confirmation.
Bull trend = EMA50 > EMA100 > EMA200
Bear trend = EMA50 < EMA100 < EMA200
RSI Filter
Bullish trades require RSI > 50
Bearish trades require RSI < 50
Stochastic RSI Filter
Prevents entries during overbought/oversold extremes.
Bullish entry only if %K and %D < 80
Bearish entry only if %K and %D > 20
EMA Proximity Check
Price must be near EMA50 (within ATR × adjustable multiplier).
Signals
Continuation Signals:
Long if all bullish conditions align.
Short if all bearish conditions align.
Cross Events:
Long Cross when price crosses above EMA50 in bull trend.
Short Cross when price crosses below EMA50 in bear trend.
Automatic SL/TP Suggestions
SL size adjusts depending on asset:
Gold/Silver (XAU/XAG): 5 pts
Bitcoin/Ethereum: 100 pts
FX pairs (default): 20 pts
TP = SL × Risk:Reward ratio (default 1:2).
Confidence Score (0–4)
Based on conditions met (trend, RSI, Stoch, EMA proximity).
Labels:
Strongest (4/4)
Strong (3/4)
Medium (2/4)
Low (1/4)
Visual Panel on Chart
Shows ✅/❌ for each condition (trend, RSI, Stoch, EMA proximity, signal now).
Confidence row with color-coded strength.
Alerts
Long Setup
Short Setup
Long Cross
Short Cross
🖥️ How to Use
1. Add the Script
Open TradingView → Pine Editor.
Paste the full script.
Click Add to chart.
Save as "AI Trading Alerts v6 — SL/TP + Confidence + Panel".
2. Configure Inputs
EMA Lengths: Default 50/100/200 (works well for swing trading).
RSI Length: 14 (standard).
Stochastic Length/K/D: Default 14/3/3.
Risk:Reward Ratio: Default 2.0 (can change to 1.5, 3.0, etc.).
EMA Proximity Threshold: Default 0.20 × ATR (adjust to be stricter/looser).
3. Read the Panel
Top-right of chart, you’ll see ✅ or ❌ for:
Trend → Are EMAs aligned?
RSI → Above 50 (bull) or below 50 (bear)?
Stoch OK → Not extreme?
Near EMA50 → Close enough to EMA50?
Above/Below OK → Price position vs. EMA50 matches trend?
Signal Now → Entry triggered?
Confidence row:
🟢 Green = Strongest
🟩 Light green = Strong
🟧 Orange = Medium
🟨 Yellow = Low
⬜ Gray = None
4. Alerts Setup
Go to TradingView Alerts (⏰ icon).
Choose the script under “Condition”.
Select alert type:
Long Setup
Short Setup
Long Cross
Short Cross
Set notification method (popup, sound, email, mobile).
Click Create.
Now TradingView will notify you automatically when signals appear.
5. Example Workflow
Wait for Confidence = Strong/Strongest.
Check if market session supports volatility (e.g., XAU in London/NY).
Review SL/TP suggestions:
Long → Entry: current price, SL: close - risk_pts, TP: close + risk_pts × RR.
Short → Entry: current price, SL: close + risk_pts, TP: close - risk_pts × RR.
Adjust based on your own price action analysis.
📊 Best Practices
Use on H1 + D1 combo → align higher timeframe bias with intraday entries.
Risk only 1–2% of account per trade (position sizing required).
Filter with market sessions (Asia, Europe, US).
Strongest signals work best with trending pairs (e.g., XAUUSD, USDJPY, BTCUSD).

Trading Mastery Indicator# Trading Mastery Indicator - Complete User Guide
## Overview
The Trading Mastery Indicator is a professional-grade technical analysis tool that provides high-probability trading signals with complete trade management information including entry, stop loss, and take profit levels.
## Key Features
- High-Quality Signal Detection: Identifies strong, medium, and weak trading opportunities
- Complete Trade Setup: Provides entry, stop loss, and take profit for every signal
- Risk Management: Calculates risk-to-reward ratios automatically
- Elliott Wave Analysis: Integrated wave pattern and position analysis
- Active Signal Tracking: Shows when you're currently in a trade
- Professional Alerts: Detailed notifications with all trade parameters
## Signal Quality Classification
### STRONG Signals (Premium Quality)
- Reliability: Highest probability setups
- Market Conditions: Strong trending environments
- Color: Teal for buys, Red for sells
- When to Trade: These are your primary trading opportunities
- Risk Profile: Lowest risk, highest reward potential
### MEDIUM Signals (Standard Quality)
- Reliability: Good probability setups
- Market Conditions: Moderate trend or consolidation breakouts
- Color: Gold for buys, Purple for sells (Change to Blue Gray)
- When to Trade: Secondary opportunities when strong signals are scarce
- Risk Profile: Moderate risk, good reward potential
### WEAK Signals (Entry Quality)
- Reliability: Lower probability setups
- Market Conditions: Counter-trend or unclear market structure
- Color: Coral for buys, Pink for sells
- When to Trade: Only for experienced traders in specific market conditions
- Risk Profile: Higher risk, variable reward
## How to Use the Indicator
### 1. Signal Settings Configuration
Signal Filter Options:
- All Signals: Shows every trading opportunity (strong, medium, weak)
- High Quality Only: Shows only the highest probability setups
- High + Medium Quality**: Balanced approach filtering out weak signals
Recommended Settings by Experience:
- Beginner: Use "High Quality Only"
- Intermediate: Use "High + Medium Quality"
- Advanced: Use "All Signals" with proper risk management
Label Controls:
- Label Position: Adjust how close labels appear to candles
- Label Text Size: Choose based on screen size and preference
- Maximum Labels: Control chart clutter (recommended: 20)
### 2. Understanding the Professional Panel
The panel provides real-time market intelligence:
Primary Trend: Market direction analysis
- BULLISH TREND: Look for buy opportunities only
- BEARISH TREND: Look for sell opportunities only
- CONSOLIDATION: Market indecision, trade with caution
Wave Pattern: Elliott Wave structure analysis
- IMPULSE UP: Strong bullish momentum
- IMPULSE DOWN: Strong bearish momentum
- CORRECTION: Sideways/corrective movement
Wave Position: Current Elliott Wave position
- WAVE 3 (STRONG): Most powerful moves, best for trend following
- WAVE 1 OR 5: Beginning or ending waves
- WAVE 2 OR 4: Corrective phases, lower probability
- CORRECTIVE ABC: Wait for pattern completion
Signal Grade: Current signal status
- SIGNAL ACTIVE: You're currently in a trade
- PREMIUM/STANDARD/SPECULATIVE: New signal quality
- NO SIGNAL: No current opportunities
Trading Bias: Overall market direction
- LONG BIAS: Focus on buy opportunities
- SHORT BIAS: Focus on sell opportunities
- NEUTRAL: No clear directional bias
### 3. Reading Signal Labels
Each signal provides complete trade setup information:
```
STRONG BUY
━━━━━━━━━━━━━━━━━━━━
💰 Entry: 1875.50
🛡️ SL: 1860.25
🎯 TP: 1905.75
📈 R:R = 1:2.0
━━━━━━━━━━━━━━━━━━━━
```
Understanding the Information:
- Entry: Exact price level to enter the trade
- SL: Stop loss level (risk management)
- TP: Take profit level (profit target)
- R:R: Risk-to-reward ratio (1:2.0 means you risk 1 to make 2)
### 4. Entry/TP/SL Level Lines
Visual trade management aids:
- Blue Solid Line: Entry level
- Red Dashed Line: Stop loss level
- Green Dashed Line: Take profit level
- Small Labels: "ENTRY", "SL", "TP" markers
## Trading Strategy Guidelines
### Trend Following Strategy
1. Check Panel: Ensure trend aligns with your trade direction
2. Wait for Signals: Only trade in the direction of the primary trend
3. Quality First: Focus on STRONG signals during trending markets
4. Wave Timing: WAVE 3 positions offer the best trending opportunities
### Reversal Strategy
1. Look for Divergence: Panel shows trend change signals
2. Wait for Confirmation: Don't jump early on potential reversals
3. Use MEDIUM Signals: Often good for catching early trend changes
4. Watch Wave Position: CORRECTIVE ABC patterns may signal trend completion
### Risk Management Rules
Position Sizing:
- Risk no more than 1-2% of account per trade
- Use the provided R:R ratios to calculate position sizes
- Stronger signals can justify slightly larger positions
Stop Loss Management:
- Always use the provided stop loss levels
- Never move stops against your position
- Consider trailing stops once trade moves in your favor
Take Profit Strategy:
- Use provided TP levels as minimum targets
- Consider taking partial profits at TP level
- Let strong trends run beyond TP in trending markets
## Best Practices by Timeframe
### Scalping (M1-M5)
- Use "High Quality Only" filter
- Focus on STRONG signals only
- Quick entry and exit
- Expect more false signals due to market noise
### Intraday Trading (M15-H1)
- Use "High + Medium Quality" filter
- Good balance of opportunity and reliability
- Hold trades for several hours
- Most versatile timeframe for the indicator
### Swing Trading (H4-Daily)
- Use "All Signals" with proper analysis
- Hold trades for days to weeks
- Most reliable signals on higher timeframes
- Best for beginners due to less noise
## Panel Customization
Position Options:
- Top Right: Default, doesn't interfere with price action
- Top Left: Good for wide screens
- Bottom corners: Keeps important info visible while analyzing tops
- Middle positions: Central reference, good for multi-monitor setups
Size Options:
- Small: Minimal screen space, good for small screens
- Normal: Balanced visibility and space usage
- Large: Easy reading, good for detailed analysis
Transparency: Adjust 0-95% based on preference and chart background
## Common Mistakes to Avoid
### Signal Interpretation Errors
- Don't ignore the trend: Trading against primary trend reduces success
- Don't chase weak signals: Focus on quality over quantity
- Don't ignore wave position: WAVE 2/4 corrections are lower probability
### Risk Management Errors
- Don't skip stop losses: Every signal includes SL for a reason
- Don't risk too much: Even strong signals can fail
- Don't move stops against position: Stick to the plan
### Psychological Errors
- Don't overtrade: Wait for quality setups
- Don't second-guess strong signals: Trust the analysis
- Don't panic on normal drawdowns: Expect some losing trades
## Alert Configuration
Enable alerts for:
- Strong signals: Primary trading opportunities
- Medium signals: Secondary opportunities (optional)
- Signal active status: Know when you're in trades
Alert messages include complete trade information for easy execution.
## Performance Optimization
### For Best Results:
1. Combine with price action: Look for confluence with support/resistance
2. Consider market sessions: Different sessions have different characteristics
3. Monitor news events: Avoid trading during high-impact news
4. Keep a trading journal: Track which signals work best for your style
### Regular Review:
- Weekly analysis: Review which signal types performed best
- Timeframe assessment: Determine your most profitable timeframes
- Strategy refinement: Adjust filters based on performance data
## Troubleshooting
If you're not seeing signals:
- Check that "Show Buy/Sell Signals" is enabled
- Verify your signal filter isn't too restrictive
- Market may be in a consolidation phase
If labels are cluttered:
- Reduce "Maximum Labels to Show"
- Change label position to "Far from Candle"
- Use smaller label text size
If panel is in the way:
- Change panel position
- Increase transparency
- Reduce panel size
- Toggle panel off temporarily
Remember: This indicator provides analysis and signals, but successful trading also requires proper risk management, emotional discipline, and understanding of market conditions. Always practice with demo accounts before risking real capital, and never risk more than you can afford to lose.

Colby Cheese VWAP Setup [v1.0]🧀 Colby Cheese VWAP Setup
A tribute to Colby’s structural clarity, refined for sniper-grade entries.
🧭 Strategy Overview
This setup blends CHoCH (Change of Character) detection with VWAP deviation bands, EMA stack bias, delta/CVD conviction, and FRVP-based entry zones. It’s designed for traders who value narratable structure, directional conviction, and modular clarity.
🔍 Core Modules
• CHoCH Detection: Identifies structural breaks using swing highs/lows from local or 3-minute feeds.
• VWAP Bands: Dynamic support/resistance zones based on VWAP ± standard deviation.
• EMA Stack Bias: Confirms directional bias using 13/35/50 EMA alignment.
• Delta/CVD Filter: Measures volume aggression and cumulative conviction.
• Strongest Imbalance Logic: Scores recent bars for directional strength using delta, CVD, and price change.
• Engulfing Confirmation (optional): Adds candle strength validation post-CHoCH.
• FRVP Entry Zones: Pullback entries based on recent range extremes—directionally aware.
• Visual Aids: CHoCH lines, candle coloring, entry labels, and optional stop loss markers.
🎯 Trade Logic
• Bullish CHoCH:
• Trigger: Price closes above last swing high
• Filters: Strong body, volume, delta, optional engulfing
• Bias: EMA stack bullish
• Entry: Pullback to bottom of FRVP range
• Visual: Green CHoCH line + “Enter” label
• Bearish CHoCH:
• Trigger: Price closes below last swing low
• Filters: Strong body, volume, delta, optional engulfing
• Bias: EMA stack bearish
• Entry: Pullback to top of FRVP range
• Visual: Red CHoCH line + “Enter” label
🛠 Notes for Overlay Builders
• All modules are toggleable for clarity and experimentation.
• CHoCH logic is atomic and timestamped—ideal for audit trails.
• FRVP zones are now directionally aware (thanks to David’s refinement).
• Imbalance scoring is reversible and narratable—perfect for diagnostic overlays.

Katz Calypso Indicator (Refactored)Overview
The Katz Calypso Indicator is a comprehensive momentum oscillator designed to identify potential entry and exit points in the market. At its core, it uses the True Strength Index (TSI) to gauge the strength and direction of a trend. To enhance signal accuracy and reduce false positives, the indicator integrates several optional filters, including the Waddah Attar Explosion, an EMA filter, and an ATR filter. It also provides an optional RVGI-based exit signal system.
This tool is designed to provide a clear, visual representation of market momentum, with customizable filters to adapt to various trading styles and market conditions.
How to Use the Indicator
The indicator is displayed in a separate pane below the main price chart.
TSI Line (Blue): This is the main oscillator line. Its position relative to the zero line indicates the overall trend bias (above 0 is bullish, below is bearish).
Signal Line (Red): A moving average of the TSI line. Crossovers between the TSI and Signal Line are the primary triggers for trade signals.
Zero Line: The centerline of the oscillator. A cross of the Zero Line can indicate a significant shift in momentum.
Overbought/Oversold Levels: These user-defined levels (defaulting to 65 and -65) help identify potential exhaustion points in a trend, which can be used for taking profits.
On-Chart Signals: The indicator plots shapes directly on the chart to make signals easy to spot:
Green Triangles (Up): Indicate long entry or continuation signals.
Red Triangles (Down): Indicate short entry or continuation signals.
Yellow Triangles: Suggest taking profits.
Maroon/Lime Triangles: Indicate an exit based on a signal cross (like RVGI or the Zero Line).
Trading Rules
Long Trade Rules
Entry: A long trade is signaled when ALL of the following conditions are met:
The blue TSI Line crosses above the red Signal Line.
The blue TSI Line is above the 0 Zero Line.
All enabled filters (Waddah Attar, EMA, ATR) confirm bullish conditions.
A green triangle labeled "Long" will appear below the price.
Exit (Take Profit): A take-profit signal for a long trade is generated when either of these occurs:
The TSI Line crosses below the Overbought level.
The TSI Line crosses back below the Signal Line while still above zero.
A yellow triangle labeled "TPL" (Take Profit Long) will appear above the price.
Exit (Stop/Reverse): A signal to exit a long trade is generated when either of these occurs:
The TSI Line crosses below the 0 Zero Line.
The RVGI Exit filter is enabled and generates a bearish crossover signal.
A maroon triangle labeled "Exit Long" will appear above the price.
Short Trade Rules
Entry: A short trade is signaled when ALL of the following conditions are met:
The blue TSI Line crosses below the red Signal Line.
The blue TSI Line is below the 0 Zero Line.
All enabled filters (Waddah Attar, EMA, ATR) confirm bearish conditions.
A red triangle labeled "Short" will appear above the price.
Exit (Take Profit): A take-profit signal for a short trade is generated when either of these occurs:
The TSI Line crosses above the Oversold level.
The TSI Line crosses back above the Signal Line while still below zero.
A yellow triangle labeled "TPS" (Take Profit Short) will appear below the price.
Exit (Stop/Reverse): A signal to exit a short trade is generated when either of these occurs:
The TSI Line crosses above the 0 Zero Line.
The RVGI Exit filter is enabled and generates a bullish crossover signal.
A lime green triangle labeled "Exit Short" will appear below the price.
Optional Filters
You can enable or disable these filters in the indicator's settings to fine-tune its sensitivity.
Waddah Attar Explosion Filter: This filter measures trend strength and volatility. When enabled, it ensures that entries are only taken during periods of strong, confirmed momentum, helping to avoid sideways or choppy markets.
EMA Price Filter: A classic trend filter. When enabled, it will only allow long entries if the price is above the specified Exponential Moving Average and short entries only if the price is below it.
ATR Filter: This acts as a volatility-based filter to prevent chasing a move. It helps ensure that you are not entering a long trade when the price has already moved too far above its EMA, or vice-versa for a short trade.
RVGI Exit Filter: The Relative Vigor Index (RVGI) is used here exclusively as an exit signal. When enabled, a crossover of the RVGI and its signal line can provide an earlier exit signal before the TSI crosses the zero line, potentially locking in profits sooner.
Disclaimer: This indicator is provided for educational and informational purposes only. It is not financial advice. Trading carries a high level of risk, and you can lose more than your initial investment. You should use this indicator at your own risk and discretion. Always conduct your own research and consider your risk tolerance before making any trading decisions.

Advanced Trading System - [WOLONG X DBG]Advanced Multi-Timeframe Trading System
Overview
This technical analysis indicator combines multiple established methodologies to provide traders with market insights across various timeframes. The system integrates SuperTrend analysis, moving average clouds, MACD-based candle coloring, RSI analysis, and multi-timeframe trend detection to suggest potential entry and exit opportunities for both swing and day trading approaches.
Methodology
The indicator employs a multi-layered analytical approach based on established technical analysis principles:
Core Signal Generation
SuperTrend Engine: Utilizes adaptive SuperTrend calculations with customizable sensitivity (1-20) combined with SMA confirmation filters to identify potential trend changes and continuations
Braid Filter System: Implements moving average filtering using multiple MA types (McGinley Dynamic, EMA, DEMA, TEMA, Hull, Jurik, FRAMA) with percentage-based strength filtering to help reduce false signals
Multi-Timeframe Analysis: Analyzes trend conditions across 10 different timeframes (1-minute to Daily) using EMA-based trend detection for broader market context
Advanced Features
MACD Candle Coloring: Applies dynamic 4-level candle coloring system based on MACD histogram momentum and signal line relationships for visual trend strength assessment
RSI Analysis: Identifies potential reversal areas using RSI oversold/overbought conditions with SuperTrend confirmation
Take Profit Analysis: Features dual-mode TP detection using statistical slope analysis and Parabolic SAR integration for exit timing analysis
Key Components
Signal Types
Primary Signals: Green ▲ for potential long entries, Red ▼ for potential short entries with trend and SMA alignment
Reversal Signals: Small circular indicators for RSI-based counter-trend possibilities
Take Profit Markers: X-cross symbols indicating statistical TP analysis zones
Pullback Signals: Purple arrows for potential trend continuation entries using Parabolic SAR
Visual Elements
8-Layer MA Cloud: Customizable moving average cloud system with 3 color themes for trend visualization
Real-Time Dashboard: Multi-timeframe trend analysis table showing bullish/bearish status across all timeframes
Dynamic Candle Colors: 4-intensity MACD-based coloring system (ranging from light to strong trend colors)
Entry/SL/TP Labels: Automatic calculation and display of suggested entry points, stop losses, and multiple take profit levels
Usage Instructions
Basic Configuration
Sensitivity Setting: Start with default value 6
Increase (7-15) for more frequent signals in volatile markets
Decrease (3-5) for higher quality signals in trending markets
MA Filter Type: McGinley Dynamic recommended for smoother signals
Filter Strength: Set to 80% for balanced filtering, adjust based on market conditions
Signal Interpretation
Long Entry: Green ▲ suggests when price crosses above SuperTrend with bullish SMA alignment
Short Entry: Red ▼ suggests when price crosses below SuperTrend with bearish SMA alignment
Reversal Opportunities: Small circles indicate RSI-based counter-trend analysis
Take Profit Zones: X-crosses mark statistical TP areas based on slope analysis
Dashboard Analysis
Green Cells: Bullish trend detected on that timeframe
Red Cells: Bearish trend detected on that timeframe
Multi-Timeframe Confluence: Look for alignment across multiple timeframes for stronger signal confirmation
Risk Management Features
Automatic Calculations
ATR-Based Stop Loss: Dynamic stop loss calculation using ATR multiplier (default 1.9x)
Multiple Take Profit Levels: Three TP targets with 1:1, 1:2, and 1:3 risk-reward ratios
Position Sizing Guidance: Entry labels display suggested price levels for order placement
Confirmation Requirements
Trend Alignment: Requires SuperTrend and SMA confirmation before signal generation
Filter Validation: Braid filter must show sufficient strength before signals activate
Multi-Timeframe Context: Dashboard provides broader market context for decision making
Optimal Settings
Timeframe Recommendations
Scalping: 1M-5M charts with sensitivity 8-12
Day Trading: 15M-1H charts with sensitivity 6-8
Swing Trading: 4H-Daily charts with sensitivity 4-6
Market Conditions
Trending Markets: Reduce sensitivity, increase filter strength
Ranging Markets: Increase sensitivity, enable reversal signals
High Volatility: Adjust ATR risk factor to 2.0-2.5
Advanced Features
Customization Options
MA Cloud Periods: 8 customizable periods for cloud layers (default: 2,6,11,18,21,24,28,34)
Color Themes: Three professional color schemes plus transparent option
Dashboard Position: 9 positioning options with 4 size settings
Signal Filtering: Individual toggle controls for each signal type
Technical Specifications
Moving Average Types: 21 different MA calculations including advanced types (Jurik, FRAMA, VIDA, CMA)
Pullback Detection: Parabolic SAR with customizable start, increment, and maximum values
Statistical Analysis: Linear regression slope calculation for trend-based TP analysis
Important Limitations
Lagging Nature: Some signals may appear after potential entry points due to confirmation requirements
Ranging Markets: May produce false signals during extended sideways price action
High Volatility: Requires parameter adjustment during news events or unusual market conditions
Computational Load: Multiple timeframe analysis may impact performance on slower devices
No Guarantee: All signals are suggestions based on technical analysis and may be incorrect
Educational Disclaimers
This indicator is designed for educational and analytical purposes only. It represents a technical analysis tool based on mathematical calculations of historical price data and should not be considered as financial advice or trading recommendations.
Risk Warning: Trading involves substantial risk of loss and is not suitable for all investors. Past performance of any trading system or methodology is not necessarily indicative of future results. The high degree of leverage can work against you as well as for you.
Important Notes:
Always conduct your own analysis before making trading decisions
Use appropriate position sizing and risk management strategies
Never risk more than you can afford to lose
Consider your investment objectives, experience level, and risk tolerance
Seek advice from qualified financial professionals when needed
Performance Disclaimer: Backtesting results do not guarantee future performance. Market conditions change constantly, and what worked in the past may not work in the future. Always paper trade new strategies before risking real capital.

Adaptive HMA Trendfilter & Profit SpikesShort Description
Adaptive trend-following filter using Hull Moving Average (HMA) slope.
Includes optional Keltner Channel entries/exits and dynamic spike-based take-profit markers (ATR/Z-Score).
Optional Fast HMA for early entry visualization (not included in logic).
USER GUIDE:
1) Quick Overview
Trend Filter: Slow HMA defines Bull / Bear / Sideways (via slope & direction).
Entries / Exits:
Entry: Color change of the slow HMA (red→green = Long, green→red = Short), optionally filtered by the Keltner basis.
Exit: Preferably via Keltner Band (Long: Close under Upper Band; Short: Close above Lower Band).
Fallback: exit on opposite HMA color change.
Take-Profit Spikes: Marks abnormal moves (ATR, Z-Score, or both) as discretionary TP signals.
Fast HMA (optional): Purely visual for early entry opportunities; not part of the core trading logic (see §5).
2) Adding & Basic Setup
Add the indicator to your chart.
Open Settings (gear icon) and configure:
HMA: Slow HMA Length = 55, Slope Lookback = 10, Slope Threshold = 0.20%.
Keltner: KC Length = 20, Multiplier = 1.5.
Spike-TP: Mode = ATR+Z, ATR Length = 14, Z Length = 20, Cooldown = 5.
Optionally: enable Fast HMA (e.g., length = 20).
3) Input Parameters – Key Controls
Slow HMA Length: Higher = smoother, fewer but cleaner signals.
Slope Lookback: How far back HMA slope is compared against.
Slope Threshold (%): Minimum slope to avoid “Sideways” regime.
KC Length / Multiplier: Width and reactivity of Keltner Channels.
Exits via KC Bands: Toggle on/off (recommended: on).
Entries only above/below KC Basis: Helps filter out chop.
Spike Mode: Choose ATR, Z, or ATR+Z (stricter, fewer signals).
Spikes only when in position: TP markers show only when you’re in a trade.
4) Entry & Exit Logic
Entries
Long: Slow HMA turns from red → green, and (if filter enabled) Close > KC Basis.
Short: Slow HMA turns from green → red, and (if filter enabled) Close < KC Basis.
Exits
KC Exit (recommended):
Long → crossunder(close, Upper KC) closes trade.
Short → crossover(close, Lower KC).
Fallback Exit: If KC Exits are off → exit on opposite HMA color change.
Spike-TP (Discretionary)
Marks unusually large deviations from HMA.
Use for partial profits or tightening stops.
⚠️ Not auto-traded — only marker/alert.
5) Early Entry Opportunities (Fast HMA Cross – visual only)
The script can optionally display a Fast HMA (e.g., 20) alongside the Slow HMA (e.g., 55).
Bullish early hint: Fast HMA crosses above Slow HMA, or stays above, before the Slow HMA officially turns green.
Bearish early hint: opposite.
⚠️ These signals are not part of the built-in logic — they are purely discretionary:
Advantage: Earlier entries, more profit potential.
Risk: Higher chance of whipsaws.
Practical workflow (early long entry):
Fast HMA crosses above Slow HMA AND Close > KC Basis.
Enter small position with tight stop (under KC Basis or HMA swing).
Once Slow HMA confirms green → add to position or trail stop tighter.
6) Recommended Presets
Crypto (1h/2h):
HMA: 55 / 10 / 0.20–0.30%
KC: 20 / 1.5–1.8
Spikes: ATR+Z, ATR=14, Z=20, Cooldown 5
FX (1h/4h):
HMA: 55 / 8–10 / 0.10–0.25%
KC: 20 / 1.2–1.5
Indices (15m/1h):
HMA: 50–60 / 8–12 / 0.15–0.30%
KC: 20 / 1.3–1.6
Fine-tuning:
Too noisy? → Raise slope threshold or increase HMA length.
Too sluggish? → Lower slope threshold or shorten HMA length.
7) Alerts – Best Practice
Long/Short Entry – get notified when trend color switches & KC filter is valid.
Long/Short Exit – for KC exits or fallback exits.
Long/Short Spike TP – for discretionary profit-taking.
Set via TradingView: Create Alert → Select this indicator → choose condition.
8) Common Pitfalls & Tips
Too many false signals?
Raise slope threshold (more “Sideways” filtering).
Enable KC filter for entries.
Entries too late?
Use Fast HMA cross for early discretionary entries.
Or lower slope threshold slightly.
Spikes too rare/frequent?
More frequent → ATR mode or lower ATR multiplier / Z-threshold.
Rarer but stronger → ATR+Z with higher thresholds.
9) Example Playbook (Long Trade)
Regime: Slow HMA still red, Fast HMA crosses upward (early hint).
Filter: Close > KC Basis.
Early Entry: Small size, stop below KC Basis or recent swing low.
Confirmation: Slow HMA turns green → scale up or trail stop.
Management: Partial profits at Spike-TP marker; full exit at KC upper band break.
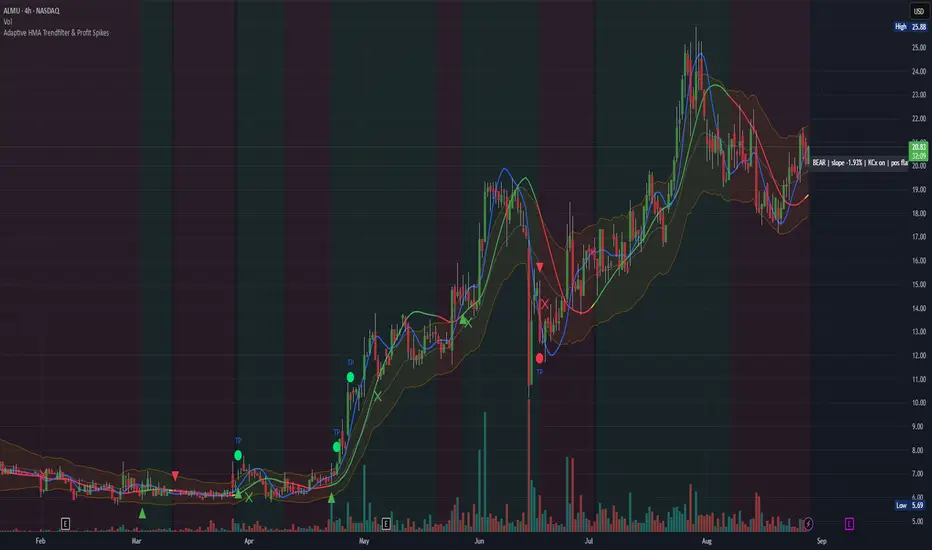
Dual Stochastic with Trend FilterThe "Dual Stochastic with Trend Filter" is an oscillator indicator designed to provide clearer, trend-aligned trading signals. It uses two distinct stochastic oscillators to identify potential entry points and incorporates an optional EMA-based trend filter to ensure that you are trading in the direction of the broader market momentum.
How It Works and How to Use It
This indicator combines two key technical analysis concepts: momentum (via stochastics) and trend (via moving averages).
Core Components:
Dual Stochastic Oscillators:
Signal Line 1 (Blue): A standard stochastic oscillator.
Signal Line 2 (Red): A second stochastic oscillator, often using a different source (like hlcc4) to provide a smoother, more reliable signal.
A buy signal is generated when the Blue Line (d1) crosses above the Red Line (d2).
A sell signal is generated when the Blue Line (d1) crosses below the Red Line (d2).
Trend Filter (Optional):
This feature uses a fast and a slow Exponential Moving Average (EMA) to determine the overall market trend.
When the fast EMA is above the slow EMA, the background will turn green, indicating an uptrend.
When the fast EMA is below the slow EMA, the background will turn red, indicating a downtrend.
This filter can be toggled on or off in the indicator settings.
How to Use:
With Trend Filter Enabled (Recommended):
Long (Buy) Entry: Look for a green triangle buy signal (▲). This signal only appears when:
The Blue Signal Line crosses above the Red Signal Line.
The market is in a confirmed uptrend (green background).
Short (Sell) Entry: Look for a red triangle sell signal (▼). This signal only appears when:
The Blue Signal Line crosses below the Red Signal Line.
The market is in a confirmed downtrend (red background).
Exit Signal:
A yellow circle (●) appears to suggest closing an open trade. This signal is triggered for a long position if either the stochastics have a bearish cross or the trend flips to a downtrend. Conversely, for a short position, it's triggered by a bullish stochastic cross or a trend flip to an uptrend.
With Trend Filter Disabled:
If you turn off the "Use Trend Filter" option, the indicator will function as a simple dual stochastic crossover system.
A green triangle (▲) will appear every time the Blue Line crosses above the Red Line.
A red triangle (▼) will appear every time the Blue Line crosses below the Red Line.
The background coloring and exit signals based on trend flips will be deactivated. This mode is more sensitive but may produce more false signals in choppy markets.
Key Visuals:
Blue Line: The primary signal line.
Red Line: The secondary, often smoother, signal line.
Green Triangle (▲): Bullish entry signal.
Red Triangle (▼): Bearish entry signal.
Yellow Circle (●): Suggested trade exit/stop.
Green/Red Background: Visual confirmation of the current uptrend or downtrend.
By filtering stochastic signals with the dominant trend, this indicator helps traders avoid common pitfalls like entering short positions during a strong uptrend or buying into a bearish market. This alignment of momentum and trend is key to improving signal quality.
Disclaimer
This indicator is provided for educational and informational purposes only and should not be considered as financial advice or a recommendation to buy or sell any asset. All trading and investment decisions are your own sole responsibility.
Trading financial markets involves a high level of risk, and you may lose more than your initial investment. Past performance is not indicative of future results. The signals generated by this indicator are not guaranteed to be accurate, and you should always use this tool in conjunction with other forms of analysis and sound risk management practices.
Before using this indicator in a live trading environment, it is strongly recommended that you backtest it thoroughly and practice with it on a demo account. The author is not responsible for any financial losses you may incur from using this script.

AI-Powered ScalpMaster Pro [By TraderMan]🧠 AI-Powered ScalpMaster Pro How It Works
📊 What Is the Indicator and What Does It Do?
🧠 AI-Powered ScalpMaster Pro is a powerful technical analysis tool designed for scalping (short-term, fast-paced trading) in financial markets such as forex, crypto, or stocks. It combines multiple technical indicators (RSI, MACD, Stochastic, Momentum, EMA, SuperTrend, CCI, and OBV) to identify market trends and generate AI-driven buy (🟢) or sell (🔴) signals. The goal is to help traders seize profitable scalping opportunities with quick and precise decisions. 🚀
Key Features:
🧠 AI-Driven Logic: Analyzes signals from multiple indicators to produce reliable trend signals.
📈 Signal Strength: Displays buy (bull) and sell (bear) signal strength as percentages.
✅ Success Rate: Tracks the performance of the last 5 trades and calculates the success rate.
🎯 Entry, TP, and SL Levels: Automatically sets entry points, take profit (TP), and stop loss (SL) levels.
📏 EMA Zone: Analyzes price movement around the EMA 200 to confirm trend direction.
⚙️ How Does It Work?
The indicator uses a scoring system by combining the following technical indicators:
RSI (14): Evaluates whether the price is in overbought or oversold zones.
MACD (12, 26, 9): Analyzes trend direction and momentum.
Stochastic (%K): Measures the speed of price movement.
Momentum: Checks the price change over the last 10 bars.
EMA 200: Determines the long-term trend direction.
SuperTrend: Tracks trends based on volatility.
CCI (20): Measures price deviation from its normal range.
OBV ROC: Analyzes volume changes.
Each indicator generates a buy (bull) or sell (bear) signal. If 6 or more indicators align in the same direction (e.g., bullScore >= 6 for buy), the indicator produces a strong trend signal:
📈 Strong Buy Signal: bullScore >= 6 and bullScore > bearScore.
📉 Strong Sell Signal: bearScore >= 6 and bearScore > bullScore.
🔸 Neutral: No dominant direction.
Additionally, the EMA Zone feature confirms the trend based on the price’s position relative to a zone around the EMA 200:
Price above the zone and sufficiently distant → Uptrend (UP). 🟢
Price below the zone and sufficiently distant → Downtrend (DOWN). 🔴
Price within the zone → Neutral. 🔸
🖥️ Display on the Chart
Table: A table in the top-right corner shows the status of all indicators (✅ Buy / ❌ Sell), signal strength (as %), success rate, and results of the last 5 trades.
Lines and Labels:
🎯 Entry Level: A gray line at the price level when a new signal is generated.
🟢 TP (Take Profit): A green line showing the take-profit level.
🔴 SL (Stop Loss): A red line showing the stop-loss level.
EMA Zone: The EMA 200 and its surrounding colored zone visualize the trend direction (green: uptrend, red: downtrend, gray: neutral).
📝 How to Use It?
Platform Setup:
Add the indicator to the TradingView platform.
Customize settings as needed (e.g., EMA length, risk/reward ratio).
Monitoring Signals:
Check the table: Look for 📈 STRONG BUY or 📉 STRONG SELL signals to prepare for a trade.
AI Text: Trust signals more when it says "🧠 FULL CONFIDENCE" (success rate ≥ 50%). Be cautious if it says "⚠️ LOW CONFIDENCE."
Entering a Position:
🟢 Buy Signal:
Table shows "📈 STRONG BUY" and bullScore >= 6.
Price is above the EMA Zone (green zone).
Entry: Current price (🎯 entry line).
TP: 2% above the entry price (🟢 TP line).
SL: 1% below the entry price (🔴 SL line).
🔴 Sell Signal:
Table shows "📉 STRONG SELL" and bearScore >= 6.
Price is below the EMA Zone (red zone).
Entry: Current price (🎯 entry line).
TP: 2% below the entry price (🟢 TP line).
SL: 1% above the entry price (🔴 SL line).
Position Management:
If the price hits TP, the trade closes profitably (✅ Successful).
If the price hits SL, the trade closes with a loss (❌ Failed).
Results are updated in the "Last 5 Trades" section of the table.
Risk Management:
Default risk/reward ratio is 1:2 (1% risk, 2% reward).
Always adjust position size based on your capital.
Consider smaller lot sizes for "⚠️ LOW CONFIDENCE" signals.
💡 Tips
Timeframe: Use 1-minute, 5-minute, or 15-minute charts for scalping.
Market Selection: Works best in volatile markets (e.g., BTC/USD, EUR/USD).
Confirmation: Ensure the EMA Zone trend aligns with the signal.
Discipline: Stick to TP and SL levels, avoid emotional decisions.
⚠️ Warnings
No indicator is 100% accurate. Always use additional analysis (e.g., support/resistance).
Be cautious during high-volatility periods (e.g., news events).
The success rate is based on past performance and does not guarantee future results.
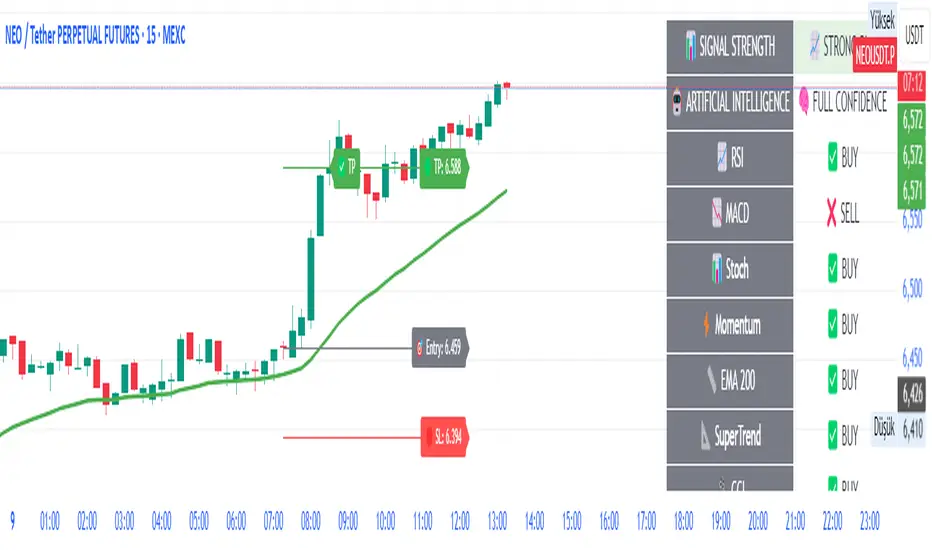
EMA 6/21/50 PROIndicator Description: EMAs 6/21/50 + MACD + AO + Panel + Alerts
This technical indicator combines several analysis tools to help identify opportunities to enter consolidated trends. It integrates Exponential Moving Averages (EMAs), the MACD, the Amazing Oscillator (AO), and an interactive information panel that allows you to visualize entry signals, trend direction, and potential exit levels (Take Profit and Stop Loss). It is designed for day or swing traders who want a quick and structured reading of the market.
What does the script do? The indicator does the following: It draws 6, 21, and 50-period EMAs on the chart to detect the direction of the trend. It generates LONG/SHORT entry signals based on EMA crossover, alignment with the overall trend (EMA50), and confirmation by indicators: MACD:
Momentum filter. AO: Impulse depletion filter. It visually displays the TP (Take Profit) and SL (Stop Loss) levels when there is a signal. It includes an informative graphical panel with icons and text summarizing the market status and entry conditions.
It issues customizable alerts for entry signals, allowing it to be used in automated strategies or as a manual guide. Allows you to enable/disable visual elements with buttons to customize the experience.
How does it do it?
EMAs and crossover signals: It uses three EMAs: 6 (fast), 21 (medium), and 50 (slow).
A LONG signal occurs when the 6-EMA crosses above the 21-EMA, the price is above the 50-EMA, the MACD confirms bullish momentum, and the AO shows no exhaustion.
A SHORT signal is given in reverse conditions, with the option to limit the system to long signals only (Long signals only).
Additional filters:
MACD: Entry is avoided if there is no favorable crossover between the MACD line and its signal.
AO: Entry is avoided if the OA shows signs of weakness or exhaustion. TP/SL Visual:
TP and SL levels are calculated based on user-defined pips, and are automatically drawn on the chart when there is a valid signal.
Information panel: Each bar is automatically updated. Samples: general trend, EMA crossover, MACD/AO filters, and presence of LONG/SHORT signal. It is possible to hide it with a button from the settings panel.
Alerts: Alerts are generated when the full LONG or SHORT entry conditions are met. They are useful for receiving automatic notifications or integrating them into automated systems.
How to use it?
Add to chart and configure options: Year of start of the analysis.
Activate only long signals if you wish.
Show/hide panel, EMAs, or TP/SL levels. Interpreting signals:
Green triangle under a candle = Possible LONG entry.
Red triangle above a candle = Possible SHORT entry.
Green Line = Suggested Take Profit. Red Line = Suggested Stop Loss. Trigger alerts from TradingView's alert settings to be notified in real-time.
Important Note
This script does not execute orders or represent an automated trading strategy.
It is a visual analysis tool that can support decision-making, but it is recommended to use it in conjunction with other elements of analysis and proper risk management.

Gold 3min Trading Pro [XAU/USD]# Gold 3min Trading Pro - User Guide
## Overview
This is a professional scalping indicator specifically designed for Gold (XAU/USD) trading on 3-minute timeframes. It combines multiple technical analysis methods to provide high-probability entry signals for short-term trading.
## Key Features
### 1. Multi-Timeframe Trend Analysis
- **Major Trend**: Analyzes 15min, 1H, and 4H timeframes using moving averages
- **Short-term Trend**: Focuses on 3-minute price action and moving average alignment
- **Trend Strength**: Rated from 1-3 based on timeframe agreement
### 2. Core Indicators
- **RSI (9-period)**: Momentum oscillator for overbought/oversold conditions
- **Stochastic (9-period)**: %K and %D lines for entry timing
- **MACD**: Additional trend confirmation
- **Volume Analysis**: Detects volume spikes for signal validation
- **ATR-based Volatility Filter**: Ensures adequate market movement
### 3. Signal Types
- **Primary Signals**: Green triangles (LONG) and Red triangles (SHORT)
- **Enhanced Signals**: Stronger signals with multiple confirmations
- **Confirmation Signals**: Small circles for stochastic crossovers
## How to Use
### 1. Setup
- **Timeframe**: Use on 3-minute charts for Gold (XAU/USD)
- **Settings**: Default settings are optimized for Gold scalping
- **Session Filter**: Enable for London/New York sessions (recommended)
### 2. Entry Conditions
#### LONG Entry:
- Major trend is bullish (green background)
- Short-term trend is up or neutral
- RSI shows bullish momentum
- Stochastic indicates oversold recovery
- Volume spike confirmation
- Strong price action (bullish candle)
#### SHORT Entry:
- Major trend is bearish (red background)
- Short-term trend is down or neutral
- RSI shows bearish momentum
- Stochastic indicates overbought reversal
- Volume spike confirmation
- Strong price action (bearish candle)
### 3. Trade Management
- **Quick Target**: 50% of ATR-based calculation
- **Main Target**: Full ATR-based target
- **Stop Loss**: 60% of ATR below/above entry
- **Time Limit**: Exit if no progress within 20 bars (60 minutes)
### 4. Risk Management
- **Position Size**: Risk 1-2% of account per trade
- **Maximum Trades**: 3-5 trades per session
- **Avoid**: Low volatility periods and major news events
## Visual Elements
### Background Colors
- **Light Green**: Bullish major trend
- **Light Red**: Bearish major trend
- **Yellow**: Volume spike detected
- **Intense Colors**: Very strong trend alignment
### Chart Indicators
- **RSI Line (Blue)**: Main momentum indicator
- **Stochastic %K (Orange)**: Fast stochastic line
- **Stochastic %D (Yellow)**: Slow stochastic line
- **Horizontal Lines**: 70 (overbought), 30 (oversold), 50 (midline)
### Information Table (Top Right)
- Total signal count and performance statistics
- Current market conditions and trend strength
- RSI levels and volatility status
- Trading session information
- Last signal timing
## Alert System
### Standard Alerts
- **Scalp Long Signal**: Basic long entry signal
- **Scalp Short Signal**: Basic short entry signal
- **Premium Signals**: High-quality signals with strong confirmation
- **Trend Reversal**: Major trend change notifications
### Alert Setup
1. Right-click on chart → "Add Alert"
2. Select desired alert condition
3. Configure notification method (popup, email, webhook)
4. Set alert frequency to "Once Per Bar Close"
## Best Practices
### 1. Trading Sessions
- **Optimal**: London-NY overlap (3:00-5:00 PM EST)
- **Good**: London session (2:00-11:00 AM EST)
- **Avoid**: Asian session and major news releases
### 2. Market Conditions
- **Best**: Trending markets with normal to high volatility
- **Moderate**: Ranging markets during active sessions
- **Avoid**: Extremely low volatility or choppy conditions
### 3. Confirmation Rules
- Wait for signal triangle to appear
- Check that major trend aligns with signal direction
- Verify volume spike (yellow background)
- Ensure volatility is adequate (check info table)
### 4. Entry Timing
- Enter immediately after signal confirmation
- Use market orders for scalping speed
- Set stop loss and take profit levels immediately
## Settings Customization
### Essential Settings
- **MA Type**: EMA (recommended) or SMA
- **RSI Length**: 9 (default, can adjust 5-14)
- **Volume Threshold**: 1.8 (higher = fewer but stronger signals)
- **Volatility Filter**: Keep enabled for better signal quality
### Display Options
- **Show Scalping Signals**: Main entry signals
- **Show Performance Stats**: Information table
- **Show Trend Filter**: Background trend colors
- **Use Time Filter**: Session-based filtering
## Performance Optimization
### 1. Backtesting Tips
- Test on different market conditions
- Analyze win rate and average profit/loss
- Adjust settings based on historical performance
### 2. Signal Quality
- Higher trend strength (2-3) = better signals
- Volume confirmation improves success rate
- Enhanced signals have higher probability
### 3. Risk Control
- Never risk more than 2% per trade
- Use proper position sizing
- Stop trading after 3 consecutive losses
## Troubleshooting
### Common Issues
1. **No Signals**: Check volatility filter and session timing
2. **Too Many Signals**: Increase volume threshold or enable filters
3. **Poor Performance**: Verify timeframe (must be 3-minute) and symbol (XAU/USD)
### Support
- Ensure TradingView Pro+ subscription for multi-timeframe data
- Verify Gold symbol matches your broker's format
- Update to latest TradingView version
This indicator is designed for experienced traders familiar with scalping techniques and risk management. Always practice on demo accounts before live trading.
