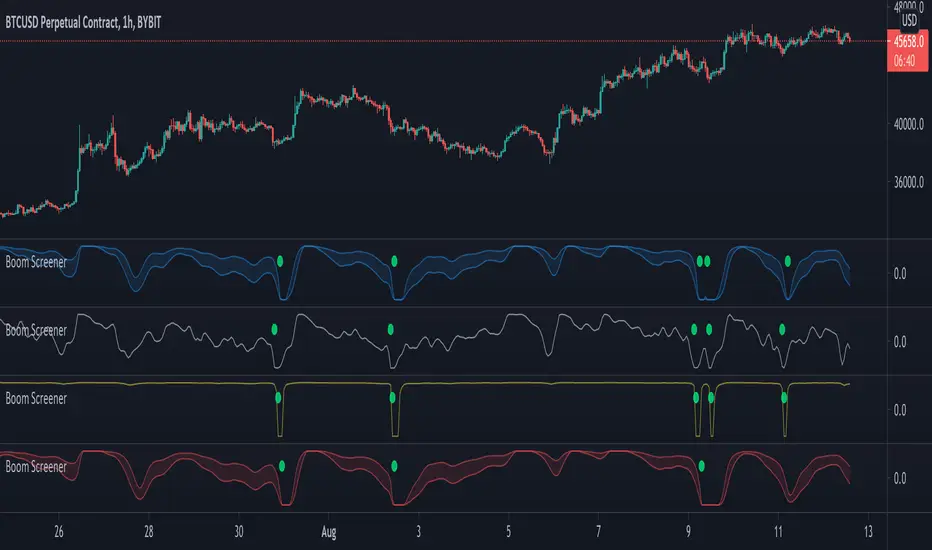
Boom Hunter - Entry Point Screener AlertsStock screener for Boom Hunter and Boom Hunter Pro entry zones. This script will screen 18 different stocks for entry zones.
1. Enter in any ticker ID's from charts you wish to scan in the settings.
2. Go to desired timeframe.
3. Click add alert button at top toolbar.
4. Select Boom Screener indicator, input alert notification settings and/or change alert name and click create.
The script will then scan the stocks and alert you of any entry zones from the timeframe you set the alerts.
A new alert needs to be created for each timeframe you wish to screen.
Pesquisar nos scripts por "entry"
Easy Entry/Exit Trend Colors (With Alerts)This is an updated version of user Algokid's script called 'AK MACD BB INDICATOR V 1.00'. You can find that original script here:
I added many alerts along with the Bullish and Bearish alerts when the MACD crosses over the Upperband or crosses down on the Lowerband.
I personally use this indicator with Crypto charts (Bitcoin on a 15min, 1hour, and 4 hour timeframe) as one of many confirmations that it's a good time to enter a trade. This script was made to be easy to follow with the colors of GREEN triangles being a good uptrend or entry confirmation, and RED being a confirmation to sell/short or exit your trade.
It's important to use this indicator in combination with other indicators that can give you more confirmations to enter or exit a trade, and make sure you are on normal candles and not HA or any other candles as you can get wildly inaccurate results.
This script also has the Death & Golden crosses, which is the slow and fast moving averages crossing over each other. I don't use this as an additional confirmation, it's just nice to know where the cross happens.

Fractal Adaptive Entry IndicatorThis entry indicator was inspired by John Ehle'rs "Fractal Adaptive Moving Average"
It's a very sensitive entry indicator that must be paired with a long-term trend detector in order to filter false positives.
Warning I have not backtested this indicator and will not make any claims to its performance.
Visually, it looks promising, however, backtesting and statistical analysis takes time.
Happy trading
<3
BERLIN Renegade - Entry and ExitThis is the entry and exit part of a larger algorithm called the "BERLIN Renegade". It is based on the NNFX way of trading, with some modifications.
For entry, it consists of Modified Chaikin Oscillator and Advanced MACD. The Advanced MACD is not available on its own, but all others are publically
available.
For exit it consists of the DIDI Index and the QQE line (original idea by Jie). Special thanks to Michael Kuczynski for the idea to include the FTLM digital filter.
Long signal: Green bars (upper and lower are both green)
Short signal: Red bars (upper and lower are both red)
Exit signal: Purple bars (bottom) - DIDI Index with QQE line
Peakestsignal Indicator - Valuetrading Indicator - Cheap Entry'sPrivate indicator.
HI BIG PLAYERS
Are you looking for the cheapest entry signal for trading?
This indicator gives the really cheaply entry signals. For buysignals you get a green background vertical line and for sellsignals you get a red background vertical line.
If you have a trend strategy and only need THE TREND for trading: believe me, this indicator give you the right signals.
Alerts are possible with the TradingView Alertsystem.
More examples of another markets:
HOT TO GET ACCESS: looking on below signature.
Kind regards
NXT2017


Entry (MTF) - Three phase Reversal patternOf course. We can absolutely reframe the explanation to give the strategy a more unique or generalized name, focusing on the concepts rather than the specific mentor.
Here is a revised, in-depth guide for your "Entry(MTF)" indicator, presented as the **"Momentum Shift Entry Model."**
***
### Entry (MTF) Indicator: A Guide to the Momentum Shift Model
This powerful indicator is designed to automatically detect a high-probability **Momentum Shift Entry Pattern**. The core strategy is to identify moments where the market's direction is likely to make a significant and sustained reversal, often driven by institutional order flow.
The indicator's key advantage is its **Multi-Timeframe (MTF)** functionality. It allows you to find these robust setups on a higher timeframe (like the daily chart) and then projects those signals onto your active, lower timeframe chart (like the 15-minute), providing a clear strategic edge for timing your entries.
---
## The Core Logic: The Three-Phase Reversal Pattern
This indicator is not based on a simple lagging condition. It looks for a specific three-step sequence of events. This sequence validates a genuine shift in market control from sellers to buyers (or vice-versa), filtering out false moves.
### Step 1: The Liquidity Purge 🎯
First, the indicator identifies recent, significant swing highs and lows on the chart. These price levels are natural magnets for liquidity, as many traders place their stop-loss orders there.
* **A Bullish Setup** begins when the price first dips **below a recent swing low**. This action is often an engineered move to "purge" or "sweep" the sell-side liquidity resting there before a move higher.
* **A Bearish Setup** begins with a price spike **above a recent swing high**, clearing out the buy-side liquidity.
This initial phase is designed to trap traders on the wrong side of the market before the true move begins.
### Step 2: The Market Structure Shift (The Confirmation) 🔄
After the liquidity has been taken, the indicator needs confirmation that a real power shift has occurred. This is confirmed by a **Market Structure Shift (MSS)**.
* After a **bullish purge (of a low)**, an MSS is confirmed when the price aggressively rallies and closes **above a recent swing *high***. This proves that buyers have not only absorbed all the selling but are now strong enough to break previous resistance levels.
* After a **bearish purge (of a high)**, an MSS is confirmed when the price falls and closes **below a recent swing *low***, showing that sellers are now decisively in command.
### Step 3: The Price Imbalance (The Entry Zone) GAP) is created during the same powerful move that caused the Market Structure Shift. A Fair Value Gap, or **price imbalance**, is a three-candle pattern that signifies a very aggressive, one-sided move, leaving a gap in the market that price will often seek to re-fill.
This FVG acts as the signature of institutional activity and becomes a high-probability zone for planning a trade entry.
---
## How to Use the Indicator in Your Trading
The true strength of this indicator lies in combining the higher-timeframe signal with the immediate context of your trading timeframe.
### Reading the Signals and Visuals
* **`BUY` / `SELL` Labels:** These are your primary signals, generated from the **"Signal Timeframe"** you select (e.g., Daily). A "BUY" label indicates that the complete three-phase bullish pattern has been confirmed on that higher timeframe.
* **Dotted Lines (Liquidity Levels):** The red and green dotted lines on your chart mark the most recent swing high and low on your **current timeframe**. These are the levels to watch for a potential "Liquidity Purge."
* **Colored Boxes (Imbalance Zones):** The green (bullish) and red (bearish) boxes highlight the Fair Value Gaps on your **current timeframe**. These are your potential entry zones.
### A Potential Trading Strategy
1. **Set Your Signal Timeframe:** Choose a higher timeframe that you use to define the overall trend (e.g., 'D' for daily, '4H' for 4-hour).
2. **Wait for an HTF Signal:** Patiently wait for a `BUY` or `SELL` label to appear. This is your cue to begin actively looking for an entry.
3. **Find a Local Entry Zone:** Once a `BUY` signal from the higher timeframe appears, look for the price on your current chart to retrace into a nearby **bullish FVG (green box)**. For a `SELL` signal, look for a pullback into a **bearish FVG (red box)**.
4. **Entry:** Plan your entry as the price tests this imbalance zone.
5. **Stop Loss:** A logical stop loss is critical. For a buy trade, place your stop below the swing low that was formed during the MSS. For a sell trade, place it above the corresponding swing high.
6. **Take Profit:** Aim for a significant liquidity level on a higher timeframe or use a predetermined risk-to-reward ratio (e.g., 1:2, 1:3).
---
## Customizing the Settings
* **`Signal Timeframe`**: The most critical setting. It determines the timeframe from which the core buy/sell logic originates. A Daily signal will carry more weight than an H1 signal.
* **`Liquidity/MSS Lookback`**: This controls the significance of the swing points the indicator uses.
* **Higher value:** Finds major, long-term swing points, leading to fewer but more powerful signals.
* **Lower value:** Finds minor, short-term swing points, leading to more frequent but potentially less reliable signals.
* **`Show Current TF Fair Value Gaps`**: This toggles the visibility of the imbalance zones (FVG boxes) on your chart. It is highly recommended to keep this enabled to easily spot your entry areas.

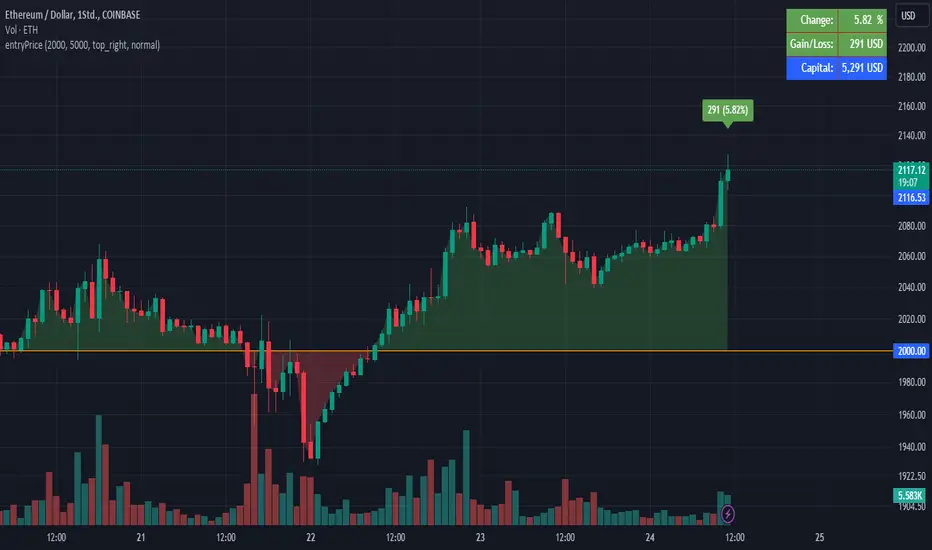
EntryPrice Gain&Loss IndicatorThis indicator takes (1) an entry price or average position price and (2) position size (denominator) to calculate current gain or loss and returns those as well as the position change in percent. It will also draw into the Chart and show relevant data in a table.
It is mainly supposed to help tracking an (average) spot position easily.
It is recommended to switch it to invisible when switching to other charts.
You can also use several instances of the indicator to track your positions in different assets.
Features:
- table position and text size can be adjusted
- colors can be changed
(recommending 25% opacity for plot backgrounds)
- several instances possible
(recommended to tuen indicator invisible when switching to other charts or analyzing
Version 1.0
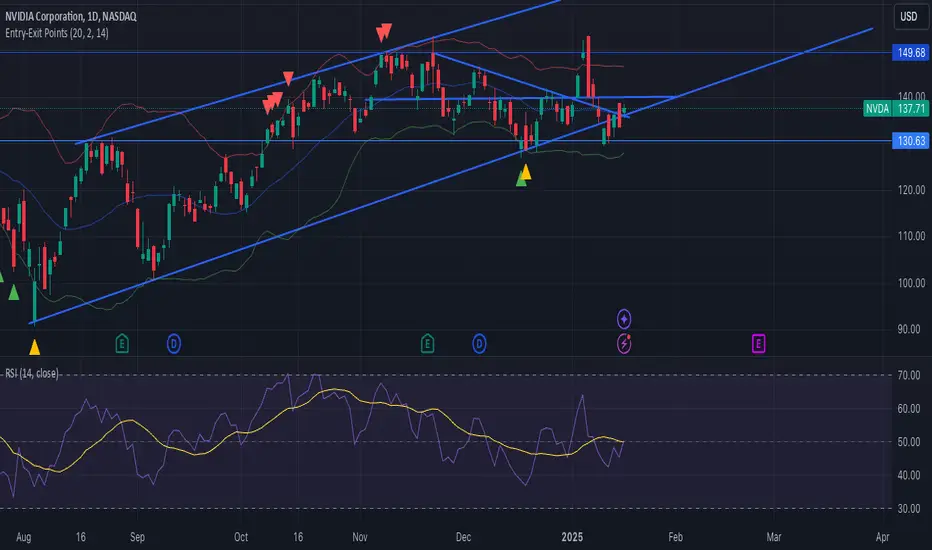
Entry-Exit pointThis indicator combines Bollinger Bands and RSI (Relative Strength Index) to generate entry and exit signals based on price movements and trend conditions.
### Key Features:
- **Bollinger Bands**: The indicator uses Bollinger Bands to assess volatility, with the upper and lower bands plotted around a simple moving average (SMA) of the price. The bands expand and contract based on the standard deviation, providing insights into potential overbought or oversold conditions.
- **RSI**: The RSI is used to determine if the price is overbought or oversold. In this case, it highlights conditions when the RSI is below 40 (oversold) for bullish signals and above 65 (overbought) for bearish signals.
- **Trend Analysis**: The indicator analyzes the previous high and low values to determine the market trend. It identifies uptrend and downtrend conditions based on recent price action.
- **Entry Signals**:
- **Bullish Entry (Green Arrows)**: A signal is generated when the price touches or dips below the lower Bollinger Band, the RSI is under 40, and the current candle shows a downtrend (lower high and low).
- **Bearish Entry (Red Arrows)**: A signal is triggered when the price touches or rises above the upper Bollinger Band, the RSI is above 65, and the current candle shows an uptrend (higher high and low).
### Visuals:
- **Green Up Arrows**: Indicate a potential bullish entry point, plotted below the bar.
- **Red Down Arrows**: Indicate a potential bearish entry point, plotted above the bar.
- **Bollinger Bands**: The upper and lower bands are shown in red and green, with the basis (SMA) in blue.
This indicator provides a clear, rule-based system for detecting potential price reversals based on both volatility (Bollinger Bands) and momentum (RSI), making it useful for traders looking to enter positions during strong trend reversals.
by Frank R.
Abraço primo Lucas Rodrigues
Entry Weight Indicator(Dual Labels)이 지표는 트레이더가 동적으로 진입 비중을 결정할 수 있도록 도와주는 도구입니다. 이전 캔들의 종가를 기준으로 두 가지 다른 진입 비중을 계산하여 표시합니다.
주요 특징:
1. 두 가지 진입 비중 계산:
- 저점 기준 (EW Long): 이전 캔들 종가와 룩백 기간 내 최저가 사이의 거리를 기준으로 계산
- 고점 기준 (EW Short): 이전 캔들 종가와 룩백 기간 내 최고가 사이의 거리를 기준으로 계산
2. 시각적 표시:
- 초록색 라벨 (EW Long): 캔들 위에 표시
- 빨간색 라벨 (EW Short): 캔들 아래에 표시
- 룩백 기간 내 최고가와 최저가를 녹색과 빨간색 선으로 표시
3. 사용자 정의 파라미터:
- 원하는 손실 비율 (Desired Loss Percentage)
- 레버리지 (Leverage)
- 룩백 기간 (Lookback Period)
4. 추가 정보 표시:
- 차트 우측 상단에 이전 종가, 최고가, 최저가, 손실 비율 등의 정보를 표시
사용 방법:
1. 원하는 손실 비율, 레버리지, 룩백 기간을 설정합니다.
2. 차트에 표시되는 라벨을 통해 각 캔들에 대한 두 가지 진입 비중을 확인합니다.
3. EW Long (초록색)은 Long 진입 시 비중을, EW Short (빨간색)는 Short 진입 시 비중을 나타냅니다.
주의: 이 지표는 투자 시 직접적인 성과를 가져다주는 지표가 아니며, 실제 거래 결정 시에는 다른 분석 도구와 함께 사용하는 것이 좋습니다.
This indicator is a tool that helps traders dynamically determine their entry weight. It calculates and displays two different entry weights based on the closing price of the previous candle.
Key features:
1. Calculation of two entry weights:
- Low-based (EW Long): Calculated based on the distance between the previous candle's close and the lowest price within the lookback period
- High-based (EW Short): Calculated based on the distance between the previous candle's close and the highest price within the lookback period
2. Visual display:
- Green label (EW Long): Displayed above the candle
- Red label (EW Short): Displayed below the candle
- Highest and lowest prices within the lookback period are shown as green and red lines
3. User-defined parameters:
- Desired Loss Percentage
- Leverage
- Lookback Period
4. Additional information display:
- Information such as previous close, highest price, lowest price, and loss percentage is displayed in the upper right corner of the chart
How to use:
1. Set the desired loss percentage, leverage, and lookback period.
2. Check the two entry weights for each candle through the labels displayed on the chart.
3. EW Long (green) represents the entry weight for long positions, while EW Short (red) represents the entry weight for short positions.
Caution: This indicator does not directly lead to investment performance. When making actual trading decisions, it is advisable to use it in conjunction with other analytical tools.

Entry helperHello traders,
This is a script I use daily as a scalper and it helps me a lot, maybe it can help you, this is why I am sharing it!
PART 1 - DESCRIPTION
This program is specifically designed to help scalpers but can be used for all types of trading but won't be as useful.
This script is what I call an entry helper as it calculates dynamically the position size, stop loss and take profit levels and more.
When scalping and placing market entry orders, the price can move significantely while you are calculating your position size according to your stop loss, capital, risk and especially close price that changes very quickly, this results in a risk that is not ideally controlled and personally was a source of frustration and stress. I wanted to enter my quantity and stop loss values as fast as possible and make the process easier.
This script automates the calculation of the position size, stop loss and take profit levels according the the users input and prints the data visibly on the screen so it is easy to copy by the trader. It allows the trader to be confident that his risk is as controlled as possible.
The script is easy to use and set up, this guide will help you if you have any difficulies or questions.
PART 2 - HOW TO USE THE SCRIPT
- SET THE CAPITAL SETTINGS
1 - Set your capital value in $
- SET THE TRADE SETTINGS
2 - Set your trade side (BUY or SELL)
3 - Set you desired risk in % of your capital
- ENTRY SETTINGS
4 - Set your entry from 2 different options
|MARKET| (default option)
This option will place the entry level at the last available price
|LIMIT|
This option allows you to input a fixed price level for the entry
- STOP LOSS SETTINGS
5 - Select your stop loss placement from 4 different options
|EXTREMA STOP LOSS| (default option)
This option will place the stop loss at the highest/lowest (extrema) price level within the last N candles
|ATR EXTREMA|
This option uses the same price level as the EXTREMA STOP LOSS but will add/soustract the last ATR value (calculated on the N last candles) multiplied by a coefficient that you input
|TICKS EXTREMA|
This option uses the same price level as the EXTREMA STOP LOSS but will add/soustract a number of ticks that you input
|PRICE LEVEL|
This option allows you to input a fixed price level for the stop loss
- TAKE PROFIT SETTINGS
6 - Select your take profit from 3 different options
|NONE| (default option)
This option will not display any take profit level, I have added this option as I don't have take profit targets
|RR|
This option uses a risk to reward ratio (reward/risk) that you input, it will automatically calculate the take profit level that corresponds
|PRICE LEVEL|
This option allows you to input a fixed price level for the take profit
- QUANTITY AND FEE SETTINGS
7 - Set the quantity settings, it represents the quantity in a lot (usually 100 000 in forex, 100 in stocks 1 for crypto currencies)
8 - Set the fee per quantity (turning lot)
- VISUAL SETTINGS
9 - Show or remove the tab
- TAB SETTINGS
10 - Select the data that you want to display in the tab (the tab will adapt automatically)
NOTES:
The vertical dashed line shows what candle has been used for the calculation of the stop loss, it allows you to visualize what candle the script has selected in case of an EXTREMA stop loss option.
I hope this helps you out! Any suggestions are welcome and I hope that the guide is clear enough.
Happy trading!

Entry Scanner Conservative Option AKeeping it simple,
Trend,
RSI,
Stoch RSI,
MACD, checked.
Do not have entry where there is noise on selection, look for cluster of same entry signals.
If you can show enough discipline, you will be profitable.
CT

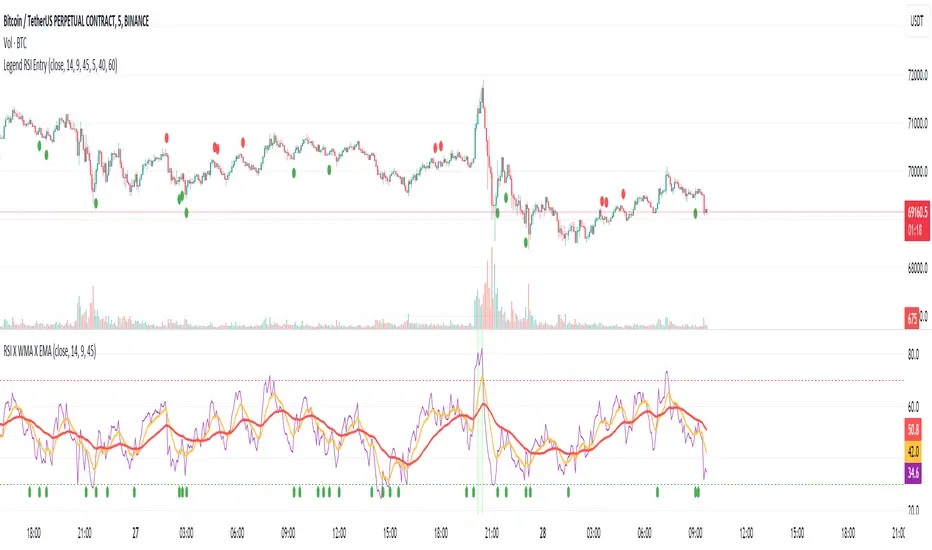
ENTRY CONFIRMATION V2// This source code is subject to the terms of the Mozilla Public License 2.0 at mozilla.org
// © Zerocapitalmx
//@version=5
indicator(title="ENTRY CONFIRMATION V2", format=format.price, timeframe="", timeframe_gaps=true)
len = input.int(title="RSI Period", minval=1, defval=50)
src = input(title="RSI Source", defval=close)
lbR = input(title="Pivot Lookback Right", defval=5)
lbL = input(title="Pivot Lookback Left", defval=5)
rangeUpper = input(title="Max of Lookback Range", defval=60)
rangeLower = input(title="Min of Lookback Range", defval=5)
plotBull = input(title="Plot Bullish", defval=true)
plotHiddenBull = input(title="Plot Hidden Bullish", defval=false)
plotBear = input(title="Plot Bearish", defval=true)
plotHiddenBear = input(title="Plot Hidden Bearish", defval=false)
bearColor = color.red
bullColor = color.green
hiddenBullColor = color.new(color.green, 80)
hiddenBearColor = color.new(color.red, 80)
textColor = color.white
noneColor = color.new(color.white, 100)
osc = ta.rsi(src, len)
rsiPeriod = input.int(50, minval = 1, title = "RSI Period")
bandLength = input.int(1, minval = 1, title = "Band Length")
lengthrsipl = input.int(1, minval = 0, title = "Fast MA on RSI")
lengthtradesl = input.int(50, minval = 1, title = "Slow MA on RSI")
r = ta.rsi(src, rsiPeriod) // RSI of Close
ma = ta.sma(r, bandLength ) // Moving Average of RSI
offs = (1.6185 * ta.stdev(r, bandLength)) // Offset
fastMA = ta.sma(r, lengthrsipl) // Moving Average of RSI 2 bars back
slowMA = ta.sma(r, lengthtradesl) // Moving Average of RSI 7 bars back
plot(slowMA, "Slow MA", color=color.black, linewidth=1) // Plot Slow MA
plot(osc, title="RSI", linewidth=2, color=color.purple)
hline(50, title="Middle Line", color=#787B86, linestyle=hline.style_dotted)
obLevel = hline(70, title="Overbought", color=#787B86, linestyle=hline.style_dotted)
osLevel = hline(30, title="Oversold", color=#787B86, linestyle=hline.style_dotted)
plFound = na(ta.pivotlow(osc, lbL, lbR)) ? false : true
phFound = na(ta.pivothigh(osc, lbL, lbR)) ? false : true
_inRange(cond) =>
bars = ta.barssince(cond == true)
rangeLower <= bars and bars <= rangeUpper
//------------------------------------------------------------------------------
// Regular Bullish
// Osc: Higher Low
oscHL = osc > ta.valuewhen(plFound, osc , 1) and _inRange(plFound )
// Price: Lower Low
priceLL = low < ta.valuewhen(plFound, low , 1)
bullCond = plotBull and priceLL and oscHL and plFound
plot(
plFound ? osc : na,
offset=-lbR,
title="Regular Bullish",
linewidth=1,
color=(bullCond ? bullColor : noneColor)
)
plotshape(
bullCond ? osc : na,
offset=-lbR,
title="Regular Bullish Label",
text=" EDM ",
style=shape.labelup,
location=location.absolute,
color=bullColor,
textcolor=textColor
)
//------------------------------------------------------------------------------
// Hidden Bullish
// Osc: Lower Low
oscLL = osc < ta.valuewhen(plFound, osc , 1) and _inRange(plFound )
// Price: Higher Low
priceHL = low > ta.valuewhen(plFound, low , 1)
hiddenBullCond = plotHiddenBull and priceHL and oscLL and plFound
plot(
plFound ? osc : na,
offset=-lbR,
title="Hidden Bullish",
linewidth=1,
color=(hiddenBullCond ? hiddenBullColor : noneColor)
)
plotshape(
hiddenBullCond ? osc : na,
offset=-lbR,
title="Hidden Bullish Label",
text=" EDM ",
style=shape.labelup,
location=location.absolute,
color=bullColor,
textcolor=textColor
)
//------------------------------------------------------------------------------
// Regular Bearish
// Osc: Lower High
oscLH = osc < ta.valuewhen(phFound, osc , 1) and _inRange(phFound )
// Price: Higher High
priceHH = high > ta.valuewhen(phFound, high , 1)
bearCond = plotBear and priceHH and oscLH and phFound
plot(
phFound ? osc : na,
offset=-lbR,
title="Regular Bearish",
linewidth=1,
color=(bearCond ? bearColor : noneColor)
)
plotshape(
bearCond ? osc : na,
offset=-lbR,
title="Regular Bearish Label",
text=" EDM ",
style=shape.labeldown,
location=location.absolute,
color=bearColor,
textcolor=textColor
)
//------------------------------------------------------------------------------
// Hidden Bearish
// Osc: Higher High
oscHH = osc > ta.valuewhen(phFound, osc , 1) and _inRange(phFound )
// Price: Lower High
priceLH = high < ta.valuewhen(phFound, high , 1)
hiddenBearCond = plotHiddenBear and priceLH and oscHH and phFound
plot(
phFound ? osc : na,
offset=-lbR,
title="Hidden Bearish",
linewidth=1,
color=(hiddenBearCond ? hiddenBearColor : noneColor)
)
plotshape(
hiddenBearCond ? osc : na,
offset=-lbR,
title="Hidden Bearish Label",
text=" EDM ",
style=shape.labeldown,
location=location.absolute,
color=bearColor,
textcolor=textColor
)

SMC POI Entry System HUDEntry, RR, Exit, of supply and demand zones taught in smart money trading. 12 types of zones and setups around Flips, Order Blocks, High Probability, and Extreme Demand Zones. Includes Checklist for Entry, Exit Rules, Take Profit Targets, Stop Loss spots, and Context

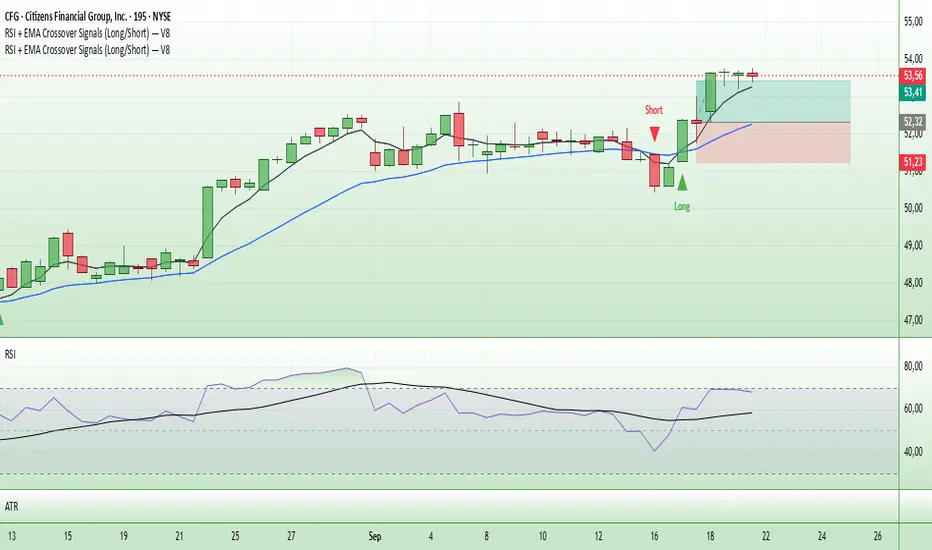
Entry Signals (Long/Short)The indicator visualizes precise entry signals for long and short setups directly on the price chart. Long is marked with a green triangle-up, short with a red triangle-down. To contextualize trend structure, the Fast EMA (5) is plotted in black and the Slow EMA (20) in blue (line width 1). Signals print only at bar close for reproducible execution. Applicable across all timeframes—ideal for top-down analysis from the 195-minute chart through daily to weekly.
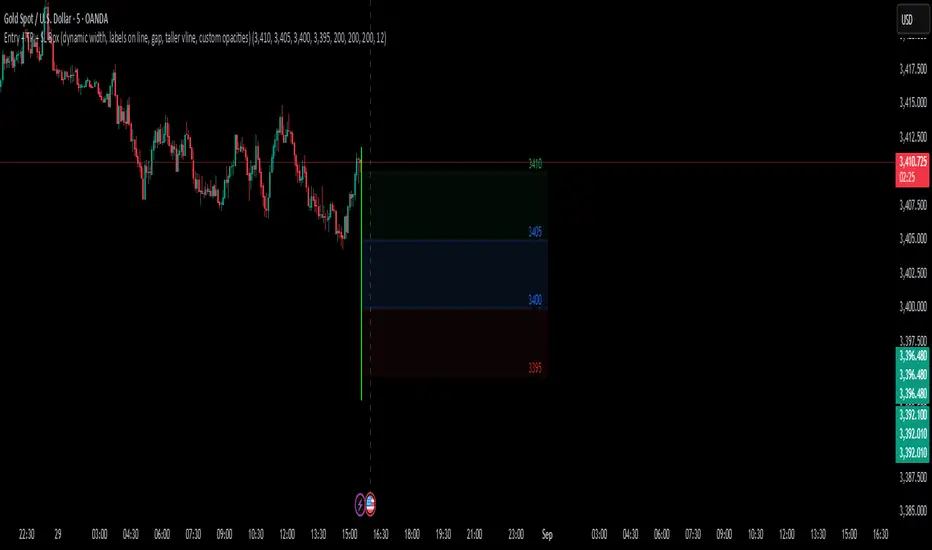
Entry + TP + SL Box (dynamic )The purpose of creating this indicator is to quickly draw the entry price range box, price target box, and price loss box.
Entry Buy/Sell with Adjustable EMA-WMA Difference by Brian LeThe "Entry Buy/Sell with RSI-WMA Conditions" script, crafted by Brian Le, is a specialized TradingView indicator designed for traders who seek to capitalize on specific RSI (Relative Strength Index) crossover events relative to key moving averages, specifically the EMA (Exponential Moving Average) and WMA (Weighted Moving Average). This tool is particularly useful for identifying potential entry points in a trading strategy, marked by distinctive visual signals on the chart.
Key Features:
Customizable Timeframes and Lengths: Users can adjust the lengths of the RSI, EMA, and WMA, making the indicator versatile across various timeframes and trading styles.
RSI Crossover Signals: The script generates signals based on the RSI crossing over the EMA. A green dot signifies a potential buy signal when the RSI crosses above the EMA, while a red dot indicates a potential sell signal when the RSI crosses below the EMA.
Special Conditions Based on WMA: The indicator enhances decision-making by including the WMA in its analysis. Buy signals (green dots) are only shown when the RSI is below the WMA, and sell signals (red dots) are displayed when the RSI is above the WMA. This additional condition helps in filtering out less probable trades.
EMA and WMA Difference Filter: A unique feature of this script is the ability to set a minimum point difference between the EMA and WMA, adding another layer of specificity to the generated signals.
RSI Threshold Filters: The indicator includes optional filters to show signals only when the RSI is above 40 (for buy signals) or below 60 (for sell signals), aiding in avoiding overbought or oversold conditions.
Enhanced Visuals for Significant Events: For more prominent trading events, such as the RSI crossing both the EMA and WMA within a single candle, the script plots larger symbols (triangles), making these significant events stand out on the chart.
Entry Assistant by IvanIntention Of This Indicator
This indicator is intended to be used as an assistant in combination with a technical strategy.
This indicator has several functions intended to assist you at entering positions.
This indicator is intended to be used with strategies that place Stop Losses above / below candles, and entries at the BOC ( Break Of The Previous Candle , For Longs it is when price goes above the previous candles high, For Shorts it is when price goes below the previous candles low)
This indicator Draw / Displays the following
A line below ( for Longs ) / above ( for Shorts ) the current candle, with an additional pip value for extra space ( this displays where to place your Stop Loss )
A label displaying the price of the Stop Loss line, to assist in placing the Stop Loss
A line displaying where the BOC is ( based off of going Long or going Short )
A box that appears when the BOC has occurred ( entry signal )
Inputs
Inputs to change the aesthetics ( colours etc. )
Numeric inputs to modify the placement / spacing of the Stop Loss / Entry signal
Toggles to activate or deactivate features
Disclaimer
This indicator does not currently work for every instrument ( it only works for most Forex pairs and some Indices )
It is not at all intended to be a signal indicator on its own, but rather only to give a signal when used with specific technical strategies that us BOC entries.
This indicator is not guaranteed to be accurate, or error free.
This indicator is not signalling winning entries or high probability entries.

Entry Alert BotThis bot is SIMPLY to trigger an external webhook. You simply enter you take profit, entry, and stop loss %, and it will auto-populate the variables listed to the calculated values. That is all this script does. It does draw the trade on the chart for you. If you want a long, and price crosses up over you entry it will trigger the webhook. If you want a short and price crosses below your entry, it will trigger the webhook.

Entry OHL 5 Min It is 5 min open range break out.
take buy entry above the green line closing
sell below red line closeing

Entry master RSI pullbackSimply using a single RSI and placing a signal after it crosses the 50 level after being overbought or oversold in the same direction.

Entry Exits: Check and Set Entry & Exits Easily in PIPS or PriceThis is a simple yet super useful script I made and use. I have learned so much from the community here at TV I thought I should give back a little. Hope you all like it. Comments and suggestions are welcome.
Note: By default it uses an entry point of the 500 bar high just so that when you add it your chart doesn't dissappear into a single line, which happens if the entry was set to 0 by default.
HOW TO USE: Simply input your entry point for the trade. By default it will show various popular SL and TP levels. You can modify to suit your preference. You can specify PIPS or actual prices below. Before I wrote this script I was forever calculating (and making mistakes) pips to price and pips to price. This does it all for you simply and easily.
PS. The FLOATINGLABEL function is uper useful as well. I found little docs out there so hopefully this will help you create floating labels for various things easily.
I hope you all enjoy.
Dougie Pips

