Raeinex Momentum Liquidity IndexEntry arrow signals with volumetric momentum (buying and selling pressure) and the possibility to use all entry signals as liquidity area for price retest.
Pesquisar nos scripts por "entry"

Momentum Swing 1–3 Weeks
✅ Entry (LONG) Conditions
Price above EMA9 and SMA20
SMA20 > SMA50 (trend confirmation)
MACD above the signal line
RSI between 50–65 (healthy momentum)
Volume at least 20% above the 20-day average
When all conditions align, a LONG signal is generated.
✅ Exit (SELL) Conditions
Price closes below EMA9
MACD gives a bearish crossover
Or TP/SL levels are hit
Position is closed.
✅ Multi-Stage Take Profit
TP1: ATR × 1.5 → closes 50% of the position
TP2: ATR × 3.0 → closes remaining 50%
✅ Stop Loss
ATR × 1.5 dynamic SL
✅ What This Strategy Aims For
Catching early trend continuation signals
Filtering weak / low-volume breakouts
Exiting when momentum fades
Eliminating emotional decision-making through rules
📌 Note
Backtest performance may vary by symbol and volatility. Proper risk management is strongly recommended.

ENTRY CONFIRMATION V2An indicator from candle man. Helps determine whether supply and demand zone are truly supply or demand.

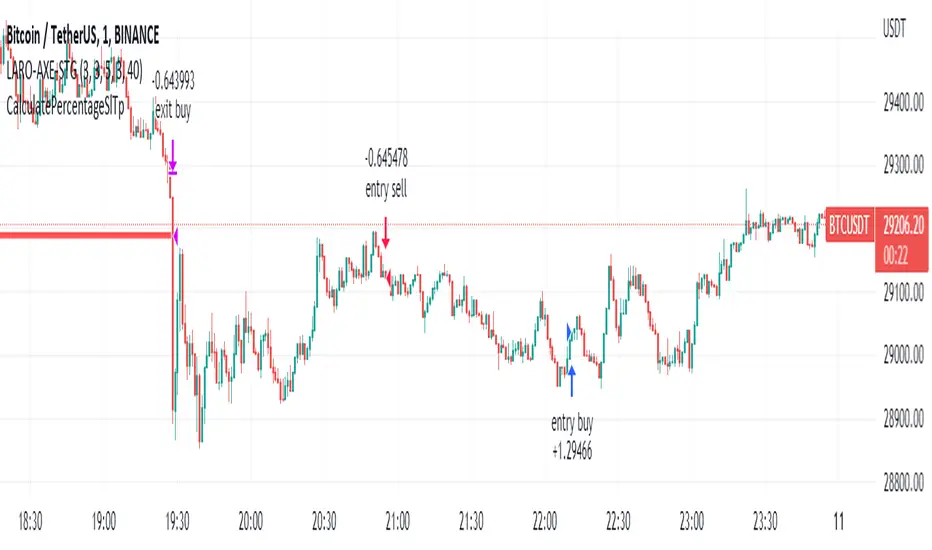
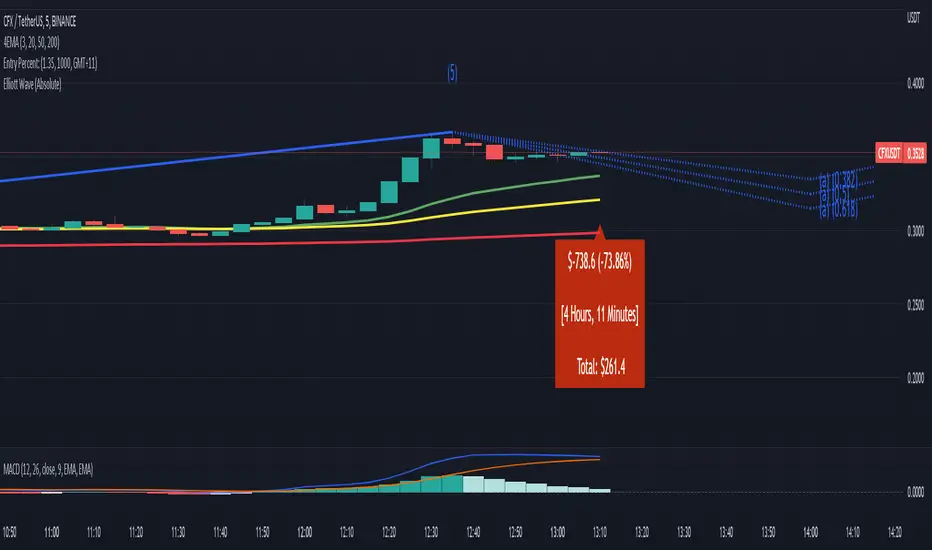
Entry Percent: EssamThis Pine Script code is designed to perform the task of computing and showcasing the profit percentage, profit value, and the duration for which a specific asset is held, all in real-time. The script effectively leverages the built-in resources to provide a seamless and robust experience, as it presents the calculated figures in an easily readable format on the chart, without causing any lag or disruptions to the chart.
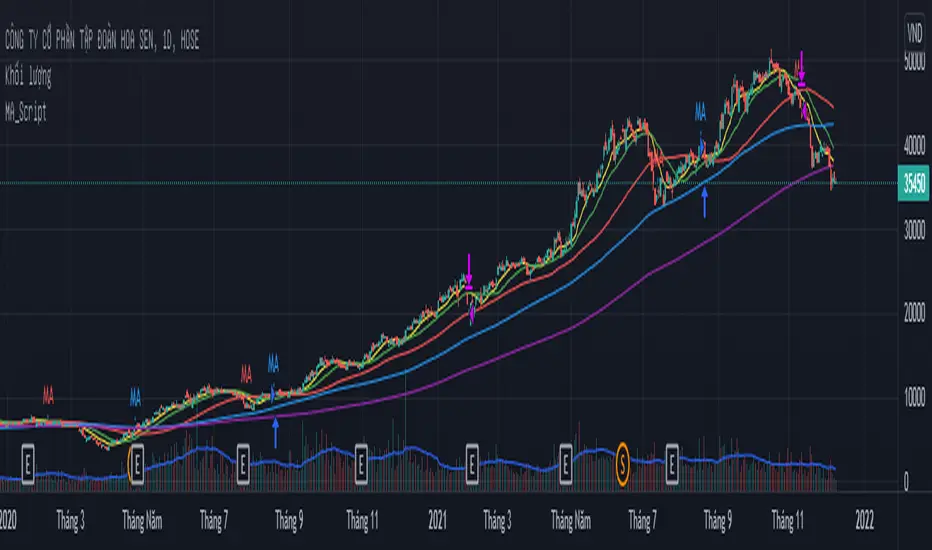
MA_Script- Entry Point : base on MA20, MA50, MA100, MA200.
- Exit Point : base on stop loss, MA and trailing stop.
sa-strategy with HTF-TSLEntry- based on HA close above HMA confirmation done with ST and HTF ATR
Exit- based on close below ATR which works as trailing SL

[MV] %B with SMA + Volume Based Colored Bars
Entry Signal when %B Crosses with SMA and this is more meaningful if it supports colored bars.
Black Bar when prices go down and volume is bigger than 150% of its average, that indicates us price action is supported by a strong bearish volume
Blue Bar when prices go up and volume bigger than 150% of its average, that indicates us price action is supported by a strong bullish volume
VBC author @KIVANCfr3762

FX Sniper: T3-CCI Strategy - With 100 IndicatorsEntry signal when moving above -100, sell signal when going below 100

Amazing Crossover SystemEntry Rules
BUY when the 5 EMA crosses above the 10 EMA from underneath and the RSI crosses above the 50.0 mark from the bottom.
SELL when the 5 EMA crosses below the 10 EMA from the top and the RSI crosses below the 50.0 mark from the top.
Make sure that the RSI did cross 50.0 from the top or bottom and not just ranging tightly around the level.
How to setup Alert:
1) Add the Amazing Crossover System to your chart via Indicators
2) Find your currency pair
3) Set the timeframe on the chart to 1 hour
4) Press 'Alt + A' (create alert shortcut)
5) Set the following criteria for the alert:
Condition = 'Amazing Crossover System', Plot, ' BUY Signal'
The rest of the alert can be customized to your preferences
5) Repeat steps 1 - 4, but set the Condition = 'Amazing Crossover System', Plot, ' SELL Signal'

Iron Fly 0DTE StrategyOverview
This indicator identifies optimal entry and exit points for 0DTE (zero days to expiration) Iron Fly options strategies on SPX. It uses a combination of DMI (Directional Movement Index) regime classification and ATR (Average True Range) volatility measurement to determine when market conditions favor non-directional premium selling.
An Iron Fly is a neutral options strategy that profits when price stays near a central strike. This indicator automates the decision of WHEN to enter and at WHAT strikes, based on quantifiable market conditions rather than discretionary judgment.
How It Works
Market Regime Classification
The core logic uses DMI and ADX to classify market conditions into four regimes:
SAFE - ADX below 25 AND DI Spread below 20: Low directional momentum, ideal for Iron Flies
CAUTION - ADX below 35 AND DI Spread below 30: Moderate conditions, wider wings recommended
WARNING - ADX below 45 OR DI Spread below 45: Elevated risk, no new entries
NO ENTRY - ADX above 45 AND DI Spread above 45: Strong trend, avoid premium selling
The DI Spread is calculated as the absolute difference between DI+ and DI-. A low spread indicates balanced buying and selling pressure, which favors range-bound price action.
Dynamic Wing Width Calculation
Wing width (the distance between the short strikes and protective long strikes) is calculated dynamically using:
Wing Width = ATR(14) × Multiplier × Late Session Factor
The multiplier varies by Entry Aggressiveness setting (5x to 7x ATR). Wings are widened by 20% in CAUTION regime for additional protection. Late in the session (after 50% elapsed), wings narrow by up to 20% as less time remains for adverse moves.
Wing width is bounded between 15 and 50 points and rounded to the nearest 5-point strike.
Entry Logic
New positions open when:
Market regime is SAFE or CAUTION
Current open positions are below the maximum limit
Daily trade count is below the daily limit
Price has moved sufficiently from the last entry (trigger distance)
No existing position at the calculated strike
Exit Logic
Positions close when price exceeds a dynamic exit threshold:
Exit Threshold = Wing Width × (Base Exit Percent + Time Decay Bonus)
The Base Exit Percent varies by Exit Aggressiveness (50% to 80%). The Time Decay Bonus increases throughout the session (0% to 25%), allowing wider tolerance as theta decay works in your favor.
What Makes This Original
This indicator differs from simple moving average or RSI-based approaches by:
Using DMI spread (not just ADX) to measure directional balance, which better identifies consolidation
Dynamically sizing wings based on current ATR rather than fixed widths
Adjusting exit tolerance based on session progress to account for theta decay
Implementing regime-based position management that automatically steps aside during trending conditions
Providing complete strike calculations for the 4-leg Iron Fly structure
Settings Guide
Strategy Settings
Entry Aggressiveness - Controls how often new trades open. LOW: fewer trades, wider wings, more selective. MID: balanced. HIGH: more trades, tighter wings.
Exit Aggressiveness - Controls how long positions are held. LOW: exits early at 50% of wing. MID: exits at 65% plus time bonus. HIGH: holds longer, exits at 80%.
Max Concurrent Flies - Maximum simultaneous open positions (1-5). Start with 1-2.
Max Trades Per Day - Daily limit to prevent overtrading (3-30).
Session Settings
Session Start/End - Trading hours in Eastern Time. Default 10:00-16:00.
How to Use
Add indicator to SPX chart (1-5 minute timeframe recommended)
Create alert with condition "Any alert() function call"
When OPEN alert fires, execute the 4-leg Iron Fly in your broker at the specified strikes
When CLOSE alert fires, close the position
Always verify the premium collected justifies the risk before entering
Alert Messages
OPEN alerts provide: Strike price, wing width, and all four leg strikes (short call, short put, long call, long put).
CLOSE alerts provide: Strike price and exit reason (price exceeded threshold or session ended).
Status Panel
The on-chart panel displays:
Positions - Current open count vs maximum
Market - Current regime classification
Wings - Current calculated wing width
Exit @ - Current exit threshold distance
Trades - Daily trade count vs limit
Limitations
Designed specifically for SPX 0DTE options; may not suit other underlyings
Does not account for bid-ask spreads or execution slippage
Market regime classification may lag during rapid regime changes
Past performance of signals does not guarantee future results
Requires manual execution in your options broker
Best Conditions
This strategy performs best during:
Range-bound, choppy market conditions
Normal volatility days (avoid major news events)
Regular trading hours (10 AM - 4 PM ET)
Avoid using during:
Strong trending days
FOMC announcements, CPI releases, earnings
Pre-market or after-hours
Disclaimer
This indicator is for educational and informational purposes only. It does not constitute financial advice.
Options trading involves substantial risk of loss
Iron Flies can result in losses up to the wing width minus premium collected
Past indicator signals do not guarantee future performance
Always understand your maximum risk before entering any trade
Never risk more than you can afford to lose
Conduct your own research and consider consulting a financial advisor

Cross-Market Regime Scanner [BOSWaves]Cross-Market Regime Scanner - Multi-Asset ADX Positioning with Correlation Network Visualization
Overview
Cross-Market Regime Scanner is a multi-asset regime monitoring system that maps directional strength and trend intensity across correlated instruments through ADX-based coordinate positioning, where asset locations dynamically reflect their current trending versus ranging state and bullish versus bearish bias.
Instead of relying on isolated single-asset trend analysis or static correlation matrices, regime classification, spatial positioning, and intermarket relationship strength are determined through ADX directional movement calculation, percentile-normalized coordinate mapping, and rolling correlation network construction.
This creates dynamic regime boundaries that reflect actual cross-market momentum patterns rather than arbitrary single-instrument levels - visualizing trending assets in right quadrants when ADX strength exceeds thresholds, positioning ranging assets in left quadrants during consolidation, and incorporating correlation web topology to reveal which instruments move together or diverge during regime transitions.
Assets are therefore evaluated relative to ADX-derived regime coordinates and correlation network position rather than conventional isolated technical indicators.
Conceptual Framework
Cross-Market Regime Scanner is founded on the principle that meaningful market insights emerge from simultaneous multi-asset regime awareness rather than sequential single-instrument analysis.
Traditional trend analysis examines assets individually using separate chart windows, which often obscures the broader cross-market regime structure and correlation patterns that drive coordinated moves. This framework replaces isolated-instrument logic with unified spatial positioning informed by actual ADX directional measurements and correlation relationships.
Three core principles guide the design:
Asset positioning should be determined by ADX-based regime coordinates that reflect trending versus ranging state and directional bias simultaneously.
Spatial mapping must normalize ADX values to place assets within consistent quadrant boundaries regardless of instrument volatility characteristics.
Correlation network visualization reveals which assets exhibit coordinated behavior versus divergent regime patterns during market transitions.
This shifts regime analysis from isolated single-chart monitoring into unified multi-asset spatial awareness with correlation context.
Theoretical Foundation
The indicator combines ADX directional movement calculation, coordinate normalization methodology, quadrant-based regime classification, and rolling correlation network construction.
A Wilder's smoothing implementation calculates ADX, +DI, and -DI for each monitored asset using True Range and directional movement components. The ADX value relative to a configurable threshold determines X-axis positioning (ranging versus trending), while the difference between +DI and -DI determines Y-axis positioning (bearish versus bullish). Coordinate normalization caps values within fixed boundaries for consistent quadrant placement. Pairwise correlation calculations over rolling windows populate a network graph where line thickness and opacity reflect correlation strength.
Five internal systems operate in tandem:
Multi-Asset ADX Engine : Computes smoothed ADX, +DI, and -DI values for up to 8 configurable instruments using Wilder's directional movement methodology.
Coordinate Transformation System : Converts ADX strength and directional movement into normalized X/Y coordinates with threshold-relative scaling and boundary capping.
Quadrant Classification Logic : Maps coordinate positions to four distinct regime states—Trending Bullish, Trending Bearish, Ranging Bullish, Ranging Bearish—with color-coded zones.
Historical Trail Rendering : Maintains rolling position history for each asset, drawing gradient-faded trails that visualize recent regime trajectory and velocity.
Correlation Network Calculator : Computes pairwise return correlations across all enabled assets, rendering weighted connection lines in circular web topology with strength-based styling.
This design allows simultaneous cross-market regime awareness rather than reacting sequentially to individual instrument signals.
How It Works
Cross-Market Regime Scanner evaluates markets through a sequence of multi-asset spatial processes:
Data Request Processing : Security function retrieves high, low, and close values for up to 8 configurable symbols with lookahead offset to ensure confirmed bar data.
ADX Calculation Per Asset : True Range computed from high-low-close relationships, directional movement derived from up-moves versus down-moves, smoothed via Wilder's method over configurable period.
Directional Index Derivation : +DI and -DI calculated as smoothed directional movement divided by smoothed True Range, scaled to percentage values.
Coordinate Transformation : X-axis position equals (ADX - threshold) * 2, capped between -50 and +50; Y-axis position equals (+DI - -DI), capped between -50 and +50.
Quadrant Assignment : Positive X indicates trending (ADX > threshold), negative X indicates ranging; positive Y indicates bullish (+DI > -DI), negative Y indicates bearish.
Trail History Management : Configurable-length position history maintains recent coordinates for each asset, rendering gradient-faded lines connecting sequential positions.
Velocity Vector Calculation : 7-bar coordinate change converted to directional arrow overlays showing regime momentum and trajectory.
Return Correlation Processing : Bar-over-bar returns calculated for each asset, pairwise correlations computed over rolling window.
Network Graph Construction : Assets positioned in circular topology, correlation lines drawn between pairs exceeding threshold with thickness/opacity scaled by correlation strength, positive correlations solid green, negative correlations dashed red.
Risk Regime Scoring : Composite score aggregates bullish risk-on assets (equities, crypto, commodities) minus bullish risk-off assets (gold, dollar, VIX), generating overall market risk sentiment with colored candle overlay.
Together, these elements form a continuously updating spatial regime framework anchored in multi-asset momentum reality and correlation structure.
Interpretation
Cross-Market Regime Scanner should be interpreted as unified spatial regime boundaries with correlation context:
Top-Right Quadrant (TREND ▲) : Assets positioned here exhibit ADX above threshold with +DI exceeding -DI - confirmed bullish trending conditions with directional conviction.
Bottom-Right Quadrant (TREND ▼) : Assets positioned here exhibit ADX above threshold with -DI exceeding +DI - confirmed bearish trending conditions with directional conviction.
Top-Left Quadrant (RANGE ▲) : Assets positioned here exhibit ADX below threshold with +DI exceeding -DI - ranging consolidation with bullish bias but insufficient trend strength.
Bottom-Left Quadrant (RANGE ▼) : Assets positioned here exhibit ADX below threshold with -DI exceeding +DI - ranging consolidation with bearish bias but insufficient trend strength.
Position Trails : Gradient-faded lines connecting recent coordinate history reveal regime trajectory - curved paths indicate regime rotation, straight paths indicate sustained directional conviction.
Velocity Arrows : Directional vectors overlaid on current positions show 7-bar regime momentum - arrow length indicates speed of regime change, angle indicates trajectory direction.
Correlation Web : Circular network graph positioned left of main quadrant map displays pairwise asset relationships - solid green lines indicate positive correlation (moving together), dashed red lines indicate negative correlation (diverging moves), line thickness reflects correlation strength magnitude.
Asset Dots : Multi-layer glow effects with color-coded markers identify each asset on both quadrant map and correlation web-symbol labels positioned adjacent to current location.
Regime Summary Bar : Vertical boxes on right edge display condensed regime state for each enabled asset - box background color reflects quadrant classification, border color matches asset identifier.
Risk Regime Candles : Overlay candles on price chart colored by composite risk score - green indicates risk-on dominance (bullish equities/crypto exceeding bullish safe-havens), red indicates risk-off dominance (bullish gold/dollar/VIX exceeding bullish risk assets), gray indicates neutral balance.
Quadrant positioning, trail trajectory, correlation network topology, and velocity vectors outweigh isolated single-asset readings.
Signal Logic & Visual Cues
Cross-Market Regime Scanner presents spatial positioning insights rather than discrete entry signals:
Regime Clustering : Multiple assets congregating in same quadrant suggests broad market regime consensus - all assets in TREND ▲ indicates coordinated bullish momentum across instruments.
Regime Divergence : Assets splitting across opposing quadrants reveals intermarket disagreement - equities in TREND ▲ while safe-havens in TREND ▼ suggests healthy risk-on environment.
Quadrant Transitions : Assets crossing quadrant boundaries mark regime shifts - movement from left (ranging) to right (trending) indicates breakout from consolidation into directional phase.
Trail Curvature Patterns : Sharp curves in position trails signal rapid regime rotation, straight trails indicate sustained directional conviction, loops indicate regime uncertainty with back-and-forth oscillation.
Velocity Acceleration : Long arrows indicate rapid regime change momentum, short arrows indicate stable regime persistence, arrow direction reveals whether asset moving toward trending or ranging state.
Correlation Breakdown Events : Previously strong correlation lines (thick, opaque) suddenly thinning or disappearing indicates relationship decoupling - often precedes major regime transitions.
Correlation Inversion Signals : Assets shifting from positive correlation (solid green) to negative correlation (dashed red) marks structural market regime change - historically correlated assets beginning to diverge.
Risk Score Extremes : Composite score reaching maximum positive (all risk-on bullish, all risk-off bearish) or maximum negative (all risk-on bearish, all risk-off bullish) marks regime conviction extremes.
The primary value lies in simultaneous multi-asset regime awareness and correlation pattern recognition rather than isolated timing signals.
Strategy Integration
Cross-Market Regime Scanner fits within macro-aware and intermarket analysis approaches:
Regime-Filtered Entries : Use quadrant positioning as directional filter for primary trading instrument - favor long setups when asset in TREND ▲ quadrant, short setups in TREND ▼ quadrant.
Correlation Confluence Trading : Enter positions when target asset and correlated instruments occupy same quadrant - multiple assets in TREND ▲ provides conviction for long exposure.
Divergence-Based Reversal Anticipation : Monitor for regime divergence between correlated assets - if historically aligned instruments split to opposite quadrants, anticipate mean-reversion or regime rotation.
Breakout Confirmation via Cross-Asset Validation : Confirm primary instrument breakouts by verifying correlated assets simultaneously transitioning from ranging to trending quadrants.
Risk-On/Risk-Off Positioning : Use composite risk score and safe-haven positioning to determine overall market environment - scale risk exposure based on risk regime dominance.
Velocity-Based Timing : Enter during periods of high regime velocity (long arrows) when momentum carries assets decisively into new quadrants, avoid entries during low velocity regime uncertainty.
Multi-Timeframe Regime Alignment : Apply higher-timeframe regime scanner to establish macro context, use lower-timeframe price action for entry timing within aligned regime structure.
Correlation Web Pattern Recognition : Identify regime transitions early by monitoring correlation network topology changes - previously disconnected assets forming strong correlations suggests regime coalescence.
Technical Implementation Details
Core Engine : Wilder's smoothing-based ADX calculation with separate True Range and directional movement tracking per asset
Coordinate Model : Threshold-relative X-axis scaling (trending versus ranging) with directional movement differential Y-axis (bullish versus bearish)
Normalization System : Boundary capping at ±50 for consistent spatial positioning regardless of instrument volatility
Trail Rendering : Rolling array-based position history with gradient alpha decay and width tapering
Correlation Engine : Return-based pairwise correlation calculation over rolling window with configurable lookback
Network Visualization : Circular topology with trigonometric positioning, weighted line rendering based on correlation magnitude
Risk Scoring : Composite calculation aggregating directional states across classified risk-on and risk-off asset categories
Performance Profile : Optimized for 8 simultaneous security requests with efficient array management and conditional rendering
Optimal Application Parameters
Timeframe Guidance:
1 - 5 min : Micro-regime monitoring for intraday correlation shifts and short-term regime rotations
15 - 60 min : Intraday regime structure with meaningful ADX development and correlation stability
4H - Daily : Swing and position-level macro regime identification with sustained trend classification
Weekly - Monthly : Long-term regime cycle tracking with structural correlation pattern evolution
Suggested Baseline Configuration:
ADX Period : 14
ADX Smoothing : 14
Trend Threshold : 25.0
Trail Length : 15
Correlation Period : 50
Min |Correlation| to Show Line : 0.3
Web Radius : 30
Show Quadrant Colors : Enabled
Show Regime Summary Bar : Enabled
Show Velocity Arrows : Enabled
Show Correlation Web : Enabled
These suggested parameters should be used as a baseline; their effectiveness depends on the selected assets' volatility profiles, correlation characteristics, and preferred spatial sensitivity, so fine-tuning is expected for optimal performance.
Parameter Calibration Notes
Use the following adjustments to refine behavior without altering the core logic:
Assets clustering too tightly : Decrease Trend Threshold (e.g., 20) to spread ranging/trending separation, or increase ADX Period for smoother ADX calculation reducing noise.
Assets spreading too widely : Increase Trend Threshold (e.g., 30-35) to demand stronger ADX confirmation before classifying as trending, tightening quadrant boundaries.
Trail too short to show trajectory : Increase Trail Length (20-25) to visualize longer regime history, revealing sustained directional patterns.
Trail too cluttered : Decrease Trail Length (8-12) for cleaner visualization focusing on recent regime state, reducing visual complexity.
Unstable ADX readings : Increase ADX Period and ADX Smoothing (18-21) for heavier smoothing reducing bar-to-bar regime oscillation.
Sluggish regime detection : Decrease ADX Period (10-12) for faster response to directional changes, accepting increased sensitivity to noise.
Too many correlation lines : Increase Min |Correlation| threshold (0.4-0.6) to display only strongest relationships, decluttering network visualization.
Missing significant correlations : Decrease Min |Correlation| threshold (0.2-0.25) to reveal weaker but potentially meaningful relationships.
Correlation too volatile : Increase Correlation Period (75-100) for more stable correlation measurements, reducing network line flickering.
Correlation too stale : Decrease Correlation Period (30-40) to emphasize recent correlation patterns, capturing regime-dependent relationship changes.
Velocity arrows too sensitive : Modify 7-bar lookback in code to longer period (10-14) for smoother velocity representation, or increase magnitude threshold for arrow display.
Adjustments should be incremental and evaluated across multiple session types rather than isolated market conditions.
Performance Characteristics
High Effectiveness:
Macro-aware trading approaches requiring cross-market regime context for directional bias
Intermarket analysis strategies monitoring correlation breakdowns and regime divergences
Portfolio construction decisions requiring simultaneous multi-asset regime classification
Risk management frameworks using safe-haven positioning and risk-on/risk-off scoring
Trend-following systems benefiting from cross-asset regime confirmation before entry
Mean-reversion strategies identifying regime extremes via clustering patterns and correlation stress
Reduced Effectiveness:
Single-asset focused strategies not incorporating cross-market context in decision logic
High-frequency trading approaches where multi-security request latency impacts execution
Markets with consistently weak correlations where network topology provides limited insight
Extremely low volatility environments where ADX remains persistently below threshold for all assets
Instruments with erratic or unreliable ADX characteristics producing unstable coordinate positioning
Integration Guidelines
Confluence : Combine with BOSWaves structure, volume analysis, or primary instrument technical indicators for entry timing within aligned regime
Quadrant Respect : Trust signals occurring when primary trading asset occupies appropriate quadrant for intended trade direction
Correlation Context : Prioritize setups where target asset exhibits strong correlation with instruments in same regime quadrant
Divergence Awareness : Monitor for safe-haven assets moving opposite to risk assets - regime divergence validates directional conviction
Velocity Confirmation : Favor entries during periods of strong regime velocity indicating decisive momentum rather than regime oscillation
Risk Score Alignment : Scale position sizing and exposure based on composite risk score - larger positions during clear risk-on/risk-off environments
Trail Pattern Recognition : Use trail curvature to identify regime stability (straight) versus rotation (curved) versus uncertainty (looped)
Multi-Timeframe Structure : Apply higher-timeframe regime scanner for macro filter, lower-timeframe for tactical positioning within established regime
Disclaimer
Cross-Market Regime Scanner is a professional-grade multi-asset regime visualization and correlation analysis tool. It uses ADX-based coordinate positioning and rolling correlation calculation but does not predict future regime transitions or guarantee relationship persistence. Results depend on selected assets' characteristics, parameter configuration, correlation stability, and disciplined interpretation. Security request timing may introduce minor latency in real-time data retrieval. BOSWaves recommends deploying this indicator within a broader analytical framework that incorporates price structure, volume context, fundamental macro awareness, and comprehensive risk management.

LDEF SENS Loss Dependent Error Filter Dominance Regime SwitchCAPITALCOM:GOLD
LDEF SENS stands for Loss Dependent Error Filter. This indicator is a dominance regime filter with an adaptive switch boundary. It separates the market into two main states.
Directional tradeable tape (trend and impulse conditions)
Balanced noisy tape (higher fakeout probability)
It also provides a dominance direction bias (bull vs bear) and an adaptive boundary you can use as a market switch signal.
What you see in the indicator pane (bottom panel)
Main line (0 to 100): dominance sensitivity score
Line color meaning
Green: bullish dominance (L greater than R)
Red: bearish dominance (R greater than L)
Gray: low strength or mixed tape
Purple line: adaptive regime boundary (moving threshold)
Violet shading: regime ON (tradeable conditions)
Key idea: height equals strength, color equals direction, violet shading equals regime state.
How to read the three images
Image A - Regime ON in a trending environment
Where to look
Price panel: left to middle shows a clean up move
Indicator panel: directly below the same time window
Violet band is present for a sustained stretch
Main line stays high and mostly green
What it means
When the violet band stays ON, the tape is directional enough for trend following setups to have higher quality. This is not an entry signal. It is an environment filter.
Image B - Switch boundary and state changes
Where to look
Indicator panel: focus on the purple adaptive line and the main line crossing relative to it
Watch the moment the main line moves above the purple line. In the same region, violet shading turns ON.
What it means
The purple line is the adaptive regime boundary.
Cross above: regime switches toward directional tape (state change confirmation)
Cross below: regime fades and chop risk returns
Image C - Direction semantics inside a regime
Where to look
Indicator panel: inside violet shaded regions
Main line is green during bullish dominance (L greater than R)
Main line is red during bearish dominance (R greater than L)
What it means
Violet answers: is this a tradeable regime
Green or red answers: which side is dominating
Together, they provide a filter plus bias framework.
Practical usage
Regime filter
Prefer setups only when the violet band is ON
Reduce size or tighten criteria when the violet band is OFF
Direction bias
Prefer longs when the line is green
Prefer shorts when the line is red
Treat gray as no edge or mixed tape
Switch boundary analysis
Cross above purple: treat as regime shift confirmation
Cross below purple: treat as regime cooling off and higher chop risk
Limitations
This is a regime and dominance tool, not a standalone entry generator. Regime confirmation can be late by design, especially after shocks. Use it with structure, liquidity, and risk management.

Gold Decisions [DayFunded]Gold Decisions 🎯
A multi-timeframe decision system designed specifically for XAUUSD (Gold) traders who want clarity, not noise.
🔍 What It Does
This indicator helps you identify high-probability trade setups by checking 5 key conditions:
1️⃣ Direction — Weekly + Daily must agree (no fighting the trend!)
2️⃣ Breakout — Daily closes beyond a key H4 zone
3️⃣ Pullback — Price returns to the cleared level (no chasing!)
4️⃣ Structure — 15-minute confirms with a break of structure
5️⃣ Entry — Clean directional close = signal
When all gates pass, you get a simple BUY or SELL label with confidence level (H/M/L).
📊 Features
✅ Clean, minimal chart labels (no spam!)
✅ Smart panel showing exactly what to watch for
✅ Win/Loss tracking to see historical performance
✅ H4 Supply/Demand zones auto-detected
✅ Asia session levels (Gold reacts to these!)
✅ Weekly/Daily high-low reference points
✅ Pullback target line for easy visual
⚠️ Important Notes
This is an indicator, not an EA — it does NOT place trades
Signals fire on confirmed bar close — no repainting
Works best on 15m to 4H timeframes
Designed for XAUUSD but may work on other pairs
🎁 Free to Use
This script is completely free. If you find it helpful, a follow or comment is always appreciated!
📖 How to Use
Add to your Gold chart (15m-4H recommended)
Watch the panel for "WATCH FOR" guidance
Wait for BUY/SELL signal
Check confidence level (H = High, M = Medium, L = Low)
Manage your own risk
Not financial advice. Trade responsibly. ✌️

Swing IA Cockpit [v2]//@version=5
indicator("Swing IA Cockpit ", overlay=true, max_bars_back=500)
// === INPUTS ===
mode = input.string("Pullback", title="Entry Mode", options= )
corrLen = input.int(60, "Correlation Window Length")
scoreWeightBias = input.float(0.6, title="Weight: Bias", minval=0, maxval=1)
scoreWeightTiming = 1.0 - scoreWeightBias
// === INDICATEURS H1 ===
ema200_H1 = ta.ema(close, 200)
ema50_H1 = ta.ema(close, 50)
rsi_H1 = ta.rsi(close, 14)
donchianHigh = ta.highest(high, 20)
donchianLow = ta.lowest(low, 20)
atr_H1 = ta.atr(14)
avgATR_H1 = ta.sma(atr_H1, 50)
body = math.abs(close - open)
avgBody = ta.sma(body, 20)
// === H4 / D1 ===
close_H4 = request.security(syminfo.tickerid, "240", close)
ema200_H4 = request.security(syminfo.tickerid, "240", ta.ema(close, 200))
rsi_H4 = request.security(syminfo.tickerid, "240", ta.rsi(close, 14))
atr_H4 = request.security(syminfo.tickerid, "240", ta.atr(14))
avgATR_H4 = request.security(syminfo.tickerid, "240", ta.sma(ta.atr(14), 50))
close_D1 = request.security(syminfo.tickerid, "D", close)
ema200_D1 = request.security(syminfo.tickerid, "D", ta.ema(close, 200))
// === CORRÉLATIONS ===
dxy = request.security("TVC:DXY", "60", close)
spx = request.security("SP:SPX", "60", close)
gold = request.security("OANDA:XAUUSD", "60", close)
corrDXY = ta.correlation(close, dxy, corrLen)
corrSPX = ta.correlation(close, spx, corrLen)
corrGold = ta.correlation(close, gold, corrLen)
// === LOGIQUE BIAIS ===
biasLong = close_D1 > ema200_D1 and close_H4 > ema200_H4 and rsi_H4 >= 55
biasShort = close_D1 < ema200_D1 and close_H4 < ema200_H4 and rsi_H4 <= 45
bias = biasLong ? "LONG" : biasShort ? "SHORT" : "NEUTRAL"
// === LOGIQUE TIMING ===
isBreakoutLong = mode == "Breakout" and high > donchianHigh and close > ema200_H1 and rsi_H1 > 50
isBreakoutShort = mode == "Breakout" and low < donchianLow and close < ema200_H1 and rsi_H1 < 50
var float breakoutPrice = na
var int breakoutBar = na
if isBreakoutLong or isBreakoutShort
breakoutPrice := close
breakoutBar := bar_index
validPullbackLong = mode == "Pullback" and not na(breakoutBar) and bar_index <= breakoutBar + 3 and close > ema50_H1 and low <= ema50_H1
validPullbackShort = mode == "Pullback" and not na(breakoutBar) and bar_index <= breakoutBar + 3 and close < ema50_H1 and high >= ema50_H1
timingLong = isBreakoutLong or validPullbackLong
timingShort = isBreakoutShort or validPullbackShort
// === SCORES ===
scoreTrend = (close_D1 > ema200_D1 ? 20 : 0) + (close_H4 > ema200_H4 ? 20 : 0)
scoreMomentumBias = (rsi_H4 >= 55 or rsi_H4 <= 45) ? 20 : 10
scoreCorr = 0
scoreCorr += biasLong and corrDXY < 0 ? 10 : 0
scoreCorr += biasLong and corrSPX > 0 ? 10 : 0
scoreCorr += biasLong and corrGold >= 0 ? 10 : 0
scoreCorr += biasShort and corrDXY > 0 ? 10 : 0
scoreCorr += biasShort and corrSPX < 0 ? 10 : 0
scoreCorr += biasShort and corrGold <= 0 ? 10 : 0
scoreCorr := math.min(scoreCorr, 30)
scoreVolBias = atr_H4 > avgATR_H4 ? 10 : 0
scoreBias = scoreTrend + scoreMomentumBias + scoreCorr + scoreVolBias
scoreStruct = (timingLong or timingShort) ? 40 : 0
scoreMomentumTiming = rsi_H1 > 50 or rsi_H1 < 50 ? 25 : 10
scoreTrendH1 = (close > ema50_H1 and ema50_H1 > ema200_H1) or (close < ema50_H1 and ema50_H1 < ema200_H1) ? 20 : 10
scoreVolTiming = atr_H1 > avgATR_H1 ? 15 : 5
scoreTiming = scoreStruct + scoreMomentumTiming + scoreTrendH1 + scoreVolTiming
scoreTotal = scoreBias * scoreWeightBias + scoreTiming * scoreWeightTiming
scoreLong = biasLong ? scoreTotal : 0
scoreShort = biasShort ? scoreTotal : 0
delta = scoreLong - scoreShort
scoreExtMomentum = (rsi_H4 > 55 ? 10 : 0)
scoreExtVol = atr_H4 > avgATR_H4 ? 10 : 0
scoreExtStructure = body > avgBody ? 10 : 5
scoreExtCorr = (scoreCorr > 15 ? 10 : 5)
scoreExtension = scoreExtMomentum + scoreExtVol + scoreExtStructure + scoreExtCorr
// === VERDICT FINAL ===
verdict = "NO TRADE"
verdict := bias == "NEUTRAL" or math.abs(delta) < 10 or scoreTotal < 70 ? "NO TRADE" :
scoreTotal < 80 ? "WAIT" :
scoreTotal >= 85 and math.abs(delta) >= 20 and scoreExtension >= 60 ? "TRADE A+" :
"TRADE"
// === TABLE COCKPIT ===
var table cockpit = table.new(position.top_right, 2, 9, border_width=1)
if bar_index % 5 == 0
table.cell(cockpit, 0, 0, "Bias", bgcolor=color.gray)
table.cell(cockpit, 1, 0, bias)
table.cell(cockpit, 0, 1, "ScoreBias", bgcolor=color.gray)
table.cell(cockpit, 1, 1, str.tostring(scoreBias))
table.cell(cockpit, 0, 2, "ScoreTiming", bgcolor=color.gray)
table.cell(cockpit, 1, 2, str.tostring(scoreTiming))
table.cell(cockpit, 0, 3, "ScoreTotal", bgcolor=color.gray)
table.cell(cockpit, 1, 3, str.tostring(scoreTotal))
table.cell(cockpit, 0, 4, "ScoreLong", bgcolor=color.gray)
table.cell(cockpit, 1, 4, str.tostring(scoreLong))
table.cell(cockpit, 0, 5, "ScoreShort", bgcolor=color.gray)
table.cell(cockpit, 1, 5, str.tostring(scoreShort))
table.cell(cockpit, 0, 6, "Delta", bgcolor=color.gray)
table.cell(cockpit, 1, 6, str.tostring(delta))
table.cell(cockpit, 0, 7, "Extension", bgcolor=color.gray)
table.cell(cockpit, 1, 7, str.tostring(scoreExtension))
table.cell(cockpit, 0, 8, "Verdict", bgcolor=color.gray)
table.cell(cockpit, 1, 8, verdict, bgcolor=verdict == "TRADE A+" ? color.green : verdict == "TRADE" ? color.lime : verdict == "WAIT" ? color.orange : color.red)
// === ALERTS ===
alertcondition(verdict == "TRADE A+" and bias == "LONG", title="TRADE A+ LONG", message="TRADE A+ signal long")
alertcondition(verdict == "TRADE A+" and bias == "SHORT", title="TRADE A+ SHORT", message="TRADE A+ signal short")
alertcondition(verdict == "NO TRADE", title="NO TRADE / RANGE", message="Marché confus ou neutre — pas de trade")

Jurik MA Trend Breakouts [BigBeluga]🔵 OVERVIEW
Jurik MA Trend Breakouts is a precision trend-breakout detector built on a custom Jurik-smoothed moving average.
It identifies trend direction with ultra-low lag and maps breakout levels using pivot-based swing highs/lows.
The indicator plots dynamic breakout lines and confirms trend continuation or reversal when price breaks them — providing clean, minimalistic yet extremely accurate trend signals.
🔵 CONCEPTS
Jurik Moving Average (JMA) — A highly smooth and low-lag moving average that reacts quickly to trend shifts without noise. This becomes the core trend baseline.
Trend Bias —
• JMA rising → bullish trend
• JMA falling → bearish trend
The JMA color updates instantly based on slope.
Swing Pivots — Recent pivot highs/lows are detected to define structural break levels while filtering out weak noise.
Trend Breakout Levels —
The indicator draws horizontal levels at the last valid pivot in the direction of the trend.
These levels act as “confirmation gates” for breakout entries.
ATR Validity Filter — Ensures only meaningful pivots within a threshold are used to prevent fake breakouts.
🔵 FEATURES
Ultra-Smooth Jurik Trend Line — A visually clean trend baseline changing color based on direction.
Automatic Swing High Breakout Setup (Bullish) —
• During an uptrend, the indicator tracks the most recent pivot high.
• A horizontal breakout line is extended across the chart.
• A ✔ marker appears at both pivot points when the breakout structure becomes valid.
Automatic Swing Low Breakout Setup (Bearish) —
• During a downtrend, pivot lows are tracked.
• A horizontal breakout line marks the breakdown level.
• ✔ markers confirm valid structure before the breakout triggers.
Breakout Detection —
• Price closing above the bullish breakout line → “↑” signal printed on the chart.
• Price closing below the bearish breakout line → “↓” signal printed on the chart.
Automatic Reset on Trend Change —
When the JMA trend flips, all breakout structures are cleared and the model starts tracking new pivot levels.
Trend-Colored Visualization —
Glow + main JMA line give instant clarity of market direction.
🔵 HOW IT WORKS
1. JurikMA defines the main trend — Slope determines bullish or bearish state.
2. The indicator continuously searches for pivots in the direction of the trend.
3. When a valid pivot forms and passes ATR proximity filter, a structural breakout level is drawn.
4. As long as price stays below that level (bullish case), the trend setup remains active.
5. When price finally breaks the level , the indicator prints a directional arrow (↑ or ↓).
6. Trend flip instantly resets all levels and begins tracking pivots on the opposite side.
🔵 HOW TO USE
Breakout Trading — Enter long on “↑” and short on “↓” signals when price breaks key pivot structure.
Trend Confirmation — Use the JurikMA color to stay aligned with the main trend direction.
Reversals — Trend flips often mark major turning points.
Structure Mapping — Use the horizontal breakout lines to understand how close price is to confirming a new trend leg.
🔵 CONCLUSION
Jurik MA Trend Breakouts combines the speed of a Jurik MA with structural breakout logic to deliver clean, reliable entry signals.
Its minimal design, pivot-based confirmation, and trend-aligned logic make it suitable for scalping, swing trading, and intraday trend continuation setups.
If you want fast yet filtered breakout recognition with almost zero noise, this tool gives you everything you need.

Big Candle Identifier with RSI Divergence and Advanced Stops1. Strategy Objective
The main goal of this strategy is to:
Identify significant price momentum (big candles).
Enter trades at opportune moments based on market signals (candlestick patterns and RSI divergence).
Limit initial risk through a fixed stop loss.
Maximize profits by using a trailing stop that activates only after the trade moves a specified distance in the profitable direction.
2. Components of the Strategy
A. Big Candle Identification
The strategy identifies big candles as indicators of strong momentum.
A big candle is defined as:
The body (absolute difference between close and open) of the current candle (body0) is larger than the bodies of the last five candles.
The candle is:
Bullish Big Candle: If close > open.
Bearish Big Candle: If open > close.
Purpose: Big candles signal potential continuation or reversal of trends, serving as the primary entry trigger.
B. RSI Divergence
Relative Strength Index (RSI): A momentum oscillator used to detect overbought/oversold conditions and divergence.
Fast RSI: A 5-period RSI, which is more sensitive to short-term price movements.
Slow RSI: A 14-period RSI, which smoothens fluctuations over a longer timeframe.
Divergence: The difference between the fast and slow RSIs.
Positive divergence (divergence > 0): Bullish momentum.
Negative divergence (divergence < 0): Bearish momentum.
Visualization: The divergence is plotted on the chart, helping traders confirm momentum shifts.
C. Stop Loss
Initial Stop Loss:
When entering a trade, an immediate stop loss of 200 points is applied.
This stop loss ensures the maximum risk is capped at a predefined level.
Implementation:
Long Trades: Stop loss is set below the entry price at low - 200 points.
Short Trades: Stop loss is set above the entry price at high + 200 points.
Purpose:
Prevents significant losses if the price moves against the trade immediately after entry.
D. Trailing Stop
The trailing stop is a dynamic risk management tool that adjusts with price movements to lock in profits. Here’s how it works:
Activation Condition:
The trailing stop only starts trailing when the trade moves 200 ticks (profit) in the right direction:
Long Position: close - entry_price >= 200 ticks.
Short Position: entry_price - close >= 200 ticks.
Trailing Logic:
Once activated, the trailing stop:
For Long Positions: Trails behind the price by 150 ticks (trail_stop = close - 150 ticks).
For Short Positions: Trails above the price by 150 ticks (trail_stop = close + 150 ticks).
Exit Condition:
The trade exits automatically if the price touches the trailing stop level.
Purpose:
Ensures profits are locked in as the trade progresses while still allowing room for price fluctuations.
E. Trade Entry Logic
Long Entry:
Triggered when a bullish big candle is identified.
Stop loss is set at low - 200 points.
Short Entry:
Triggered when a bearish big candle is identified.
Stop loss is set at high + 200 points.
F. Trade Exit Logic
Trailing Stop: Automatically exits the trade if the price touches the trailing stop level.
Fixed Stop Loss: Exits the trade if the price hits the predefined stop loss level.
G. 21 EMA
The strategy includes a 21-period Exponential Moving Average (EMA), which acts as a trend filter.
EMA helps visualize the overall market direction:
Price above EMA: Indicates an uptrend.
Price below EMA: Indicates a downtrend.
H. Visualization
Big Candle Identification:
The open and close prices of big candles are plotted for easy reference.
Trailing Stop:
Plotted on the chart to visualize its progression during the trade.
Green Line: Indicates the trailing stop for long positions.
Red Line: Indicates the trailing stop for short positions.
RSI Divergence:
Positive divergence is shown in green.
Negative divergence is shown in red.
3. Key Parameters
trail_start_ticks: The number of ticks required before the trailing stop activates (default: 200 ticks).
trail_distance_ticks: The distance between the trailing stop and price once the trailing stop starts (default: 150 ticks).
initial_stop_loss_points: The fixed stop loss in points applied at entry (default: 200 points).
tick_size: Automatically calculates the minimum tick size for the trading instrument.
4. Workflow of the Strategy
Step 1: Entry Signal
The strategy identifies a big candle (bullish or bearish).
If conditions are met, a trade is entered with a fixed stop loss.
Step 2: Initial Risk Management
The trade starts with an initial stop loss of 200 points.
Step 3: Trailing Stop Activation
If the trade moves 200 ticks in the profitable direction:
The trailing stop is activated and follows the price at a distance of 150 ticks.
Step 4: Exit the Trade
The trade is exited if:
The price hits the trailing stop.
The price hits the initial stop loss.
5. Advantages of the Strategy
Risk Management:
The fixed stop loss ensures that losses are capped.
The trailing stop locks in profits after the trade becomes profitable.
Momentum-Based Entries:
The strategy uses big candles as entry triggers, which often indicate strong price momentum.
Divergence Confirmation:
RSI divergence helps validate momentum and avoid false signals.
Dynamic Profit Protection:
The trailing stop adjusts dynamically, allowing the trade to capture larger moves while protecting gains.
6. Ideal Market Conditions
This strategy performs best in:
Trending Markets:
Big candles and momentum signals are more effective in capturing directional moves.
High Volatility:
Larger price swings improve the probability of reaching the trailing stop activation level (200 ticks).

Nef33 Forex & Crypto Trading Signals PRO
1. Understanding the Indicator's Context
The indicator generates signals based on confluence (trend, volume, key zones, etc.), but it does not include predefined SL or TP levels. To establish them, we must:
Use dynamic or static support/resistance levels already present in the script.
Incorporate volatility (such as ATR) to adjust the levels based on market conditions.
Define a risk/reward ratio (e.g., 1:2).
2. Options for Determining SL and TP
Below, I provide several ideas based on the tools available in the script:
Stop Loss (SL)
The SL should protect you from adverse movements. You can base it on:
ATR (Volatility): Use the smoothed ATR (atr_smooth) multiplied by a factor (e.g., 1.5 or 2) to set a dynamic SL.
Buy: SL = Entry Price - (atr_smooth * atr_mult).
Sell: SL = Entry Price + (atr_smooth * atr_mult).
Key Zones: Place the SL below a support (for buys) or above a resistance (for sells), using Order Blocks, Fair Value Gaps, or Liquidity Zones.
Buy: SL below the nearest ob_lows or fvg_lows.
Sell: SL above the nearest ob_highs or fvg_highs.
VWAP: Use the daily VWAP (vwap_day) as a critical level.
Buy: SL below vwap_day.
Sell: SL above vwap_day.
Take Profit (TP)
The TP should maximize profits. You can base it on:
Risk/Reward Ratio: Multiply the SL distance by a factor (e.g., 2 or 3).
Buy: TP = Entry Price + (SL Distance * 2).
Sell: TP = Entry Price - (SL Distance * 2).
Key Zones: Target the next resistance (for buys) or support (for sells).
Buy: TP at the next ob_highs, fvg_highs, or liq_zone_high.
Sell: TP at the next ob_lows, fvg_lows, or liq_zone_low.
Ichimoku: Use the cloud levels (Senkou Span A/B) as targets.
Buy: TP at senkou_span_a or senkou_span_b (whichever is higher).
Sell: TP at senkou_span_a or senkou_span_b (whichever is lower).
3. Practical Implementation
Since the script does not automatically draw SL/TP, you can:
Calculate them manually: Observe the chart and use the levels mentioned.
Modify the code: Add SL/TP as labels (label.new) at the moment of the signal.
Here’s an example of how to modify the code to display SL and TP based on ATR with a 1:2 risk/reward ratio:
Modified Code (Signals Section)
Find the lines where the signals (trade_buy and trade_sell) are generated and add the following:
pinescript
// Calculate SL and TP based on ATR
atr_sl_mult = 1.5 // Multiplier for SL
atr_tp_mult = 3.0 // Multiplier for TP (1:2 ratio)
sl_distance = atr_smooth * atr_sl_mult
tp_distance = atr_smooth * atr_tp_mult
if trade_buy
entry_price = close
sl_price = entry_price - sl_distance
tp_price = entry_price + tp_distance
label.new(bar_index, low, "Buy: " + str.tostring(math.round(bull_conditions, 1)), color=color.green, textcolor=color.white, style=label.style_label_up, size=size.tiny)
label.new(bar_index, sl_price, "SL: " + str.tostring(math.round(sl_price, 2)), color=color.red, textcolor=color.white, style=label.style_label_down, size=size.tiny)
label.new(bar_index, tp_price, "TP: " + str.tostring(math.round(tp_price, 2)), color=color.blue, textcolor=color.white, style=label.style_label_up, size=size.tiny)
if trade_sell
entry_price = close
sl_price = entry_price + sl_distance
tp_price = entry_price - tp_distance
label.new(bar_index, high, "Sell: " + str.tostring(math.round(bear_conditions, 1)), color=color.red, textcolor=color.white, style=label.style_label_down, size=size.tiny)
label.new(bar_index, sl_price, "SL: " + str.tostring(math.round(sl_price, 2)), color=color.red, textcolor=color.white, style=label.style_label_up, size=size.tiny)
label.new(bar_index, tp_price, "TP: " + str.tostring(math.round(tp_price, 2)), color=color.blue, textcolor=color.white, style=label.style_label_down, size=size.tiny)
Code Explanation
SL: Calculated by subtracting/adding sl_distance to the entry price (close) depending on whether it’s a buy or sell.
TP: Calculated with a double distance (tp_distance) for a 1:2 risk/reward ratio.
Visualization: Labels are added to the chart to display SL (red) and TP (blue).
4. Practical Strategy Without Modifying the Code
If you don’t want to modify the script, follow these steps manually:
Entry: Take the trade_buy or trade_sell signal.
SL: Check the smoothed ATR (atr_smooth) on the chart or calculate a fixed level (e.g., 1.5 times the ATR). Also, review nearby key zones (OB, FVG, VWAP).
TP: Define a target based on the next key zone or multiply the SL distance by 2 or 3.
Example:
Buy at 100, ATR = 2.
SL = 100 - (2 * 1.5) = 97.
TP = 100 + (2 * 3) = 106.
5. Recommendations
Test in Demo: Apply this logic in a demo account to adjust the multipliers (atr_sl_mult, atr_tp_mult) based on the market (forex or crypto).
Combine with Zones: If the ATR-based SL is too wide, use the nearest OB or FVG as a reference.
Risk/Reward Ratio: Adjust the TP based on your tolerance (1:1, 1:2, 1:3)

Risk & Position DashboardRisk & Position Dashboard
Overview
The Risk & Position Dashboard is a comprehensive trading tool designed to help traders calculate optimal position sizes, manage risk, and visualize potential profit/loss scenarios before entering trades. This indicator provides real-time calculations for position sizing based on account size, risk percentage, and stop-loss levels, while displaying multiple take-profit targets with customizable risk-reward ratios.
Key Features
Position Sizing & Risk Management:
Automatic position size calculation based on account size and risk percentage
Support for leveraged trading with maximum leverage limits
Fractional shares support for brokers that allow partial share trading
Real-time fee calculation including entry, stop-loss, and take-profit fees
Break-even price calculation including trading fees
Multi-Target Profit Management:
Support for up to 3 take-profit levels with individual portion allocations
Customizable risk-reward ratios for each take-profit target
Visual profit/loss zones displayed as colored boxes on the chart
Individual profit calculations for each take-profit level
Visual Dashboard:
Clean, customizable table display showing all key metrics
Configurable label positioning and styling options
Real-time tracking of whether stop-loss or take-profit levels have been reached
Color-coded visual zones for easy identification of risk and reward areas
Advanced Configuration:
Comprehensive input validation and error handling
Support for different chart timeframes and symbols
Customizable colors, fonts, and display options
Hide/show individual data fields for personalized dashboard views
How to Use
Set Account Parameters: Configure your account size, maximum risk percentage per trade, and trading fees in the "Account Settings" section.
Define Trade Setup: Use the "Entry" time picker to select your entry point on the chart, then input your entry price and stop-loss level.
Configure Take Profits: Set your desired risk-reward ratios and portion allocations for each take-profit level. The script supports 1-3 take-profit targets.
Analyze Results: The dashboard will automatically calculate and display position size, number of shares, potential profits/losses, fees, and break-even levels.
Visual Confirmation: Colored boxes on the chart show profit zones (green) and loss zones (red), with lines extending to current price levels.
Reset Entry and SL:
You can easily reset the entry and stop-loss by clicking the "Reset points..." button from the script's "More" menu.
This is useful if you want to quickly clear your current trade setup and start fresh without manually adjusting the points on the chart.
Calculations
The script performs sophisticated calculations including:
Position size based on risk amount and price difference between entry and stop-loss
Leverage requirements and position amount calculations
Fee-adjusted risk-reward ratios for realistic profit expectations
Break-even price including all trading costs
Individual profit calculations for partial position closures
Detailed Take-Profit Calculation Formula:
The take-profit prices are calculated using the following mathematical formula:
// Core variables:
// risk_amount = account_size * (risk_percentage / 100)
// total_risk_per_share = |entry_price - sl_price| + (entry_price * fee%) + (sl_price * fee%)
// shares = risk_amount / total_risk_per_share
// direction_factor = 1 for long positions, -1 for short positions
// Take-profit calculation:
net_win = total_risk_per_share * shares * RR_ratio
tp_price = (net_win + (direction_factor * entry_price * shares) + (entry_price * fee% * shares)) / (direction_factor * shares - fee% * shares)
Step-by-step example for a long position (based on screenshot):
Account Size: 2,000 USDT, Risk: 2% = 40 USDT
Entry: 102,062.9 USDT, Stop Loss: 102,178.4 USDT, Fee: 0.06%
Risk per share: |102,062.9 - 102,178.4| + (102,062.9 × 0.0006) + (102,178.4 × 0.0006) = 115.5 + 61.24 + 61.31 = 238.05 USDT
Shares: 40 ÷ 238.05 = 0.168 shares (rounded to 0.17 in display)
Position Size: 0.17 × 102,062.9 = 17,350.69 USDT
Position Amount (with 9x leverage): 17,350.69 ÷ 9 = 1,927.85 USDT
For 2:1 RR: Net win = 238.05 × 0.17 × 2 = 80.94 USDT
TP1 price = (80.94 + (1 × 102,062.9 × 0.17) + (102,062.9 × 0.0006 × 0.17)) ÷ (1 × 0.17 - 0.0006 × 0.17) = 101,464.7 USDT
For 3:1 RR: TP2 price = 101,226.7 USDT (following same formula with RR=3)
This ensures that after accounting for all fees, the actual risk-reward ratio matches the specified target ratio.
Risk Management Features
Maximum Trade Amount: Optional setting to limit position size regardless of account size
Leverage Limits: Built-in maximum leverage protection
Fee Integration: All calculations include realistic trading fees for accurate expectations
Validation: Automatic checking that take-profit portions sum to 100%
Historical Tracking: Visual indication when stop-loss or take-profit levels are reached (within last 5000 bars)
Understanding Max Trade Amount - Multiple Simultaneous Trades:
The "Max Trade Amount" feature is designed for traders who want to open multiple positions simultaneously while maintaining proper risk management. Here's how it works:
Key Concept:
- Risk percentage (2%) always applies to your full Account Size
- Max Trade Amount limits the capital allocated per individual trade
- This allows multiple trades with full risk on each trade
Example from Screenshot:
Account Size: 2,000 USDT
Max Trade Amount: 500 USDT
Risk per Trade: 2% × 2,000 = 40 USDT per trade
Stop Loss Distance: 0.11% from entry
Result: Position Size = 17,350.69 USDT with 35x leverage
Total Risk (including fees): 40.46 USDT
Multiple Trades Strategy:
With this setup, you can open:
Trade 1: 40 USDT risk, 495.73 USDT position amount (35x leverage)
Trade 2: 40 USDT risk, 495.73 USDT position amount (35x leverage)
Trade 3: 40 USDT risk, 495.73 USDT position amount (35x leverage)
Trade 4: 40 USDT risk, 495.73 USDT position amount (35x leverage)
Total Portfolio Exposure:
- 4 simultaneous trades = 4 × 495.73 = 1,982.92 USDT position amount
- Total risk exposure = 4 × 40 = 160 USDT (8% of account)

TJR asia session sweep//@version=5
strategy("TJR asia session sweep", "TJR Asia Sweep", overlay=true, max_lines_count=500, max_labels_count=500)
// Input settings
show_asian = input.bool(true, "Show Asian Session", group="Visual Settings")
show_london = input.bool(true, "Show London Session", group="Visual Settings")
show_swing_points = input.bool(true, "Show Asian Swing Points", group="Visual Settings")
show_market_structure = input.bool(true, "Show Market Structure", group="Visual Settings")
show_bos = input.bool(true, "Show Break of Structure", group="Visual Settings")
// Session Time Settings
asian_start_hour_input = input.int(22, "Asian Session Start Hour", minval=0, maxval=23, group="Session Times")
asian_end_hour_input = input.int(3, "Asian Session End Hour", minval=0, maxval=23, group="Session Times")
london_start_hour_input = input.int(3, "London Session Start Hour", minval=0, maxval=23, group="Session Times")
london_end_hour_input = input.int(8, "London Session End Hour", minval=0, maxval=23, group="Session Times")
session_timezone = input.string("America/New_York", "Session Timezone", options= , group="Session Times")
// Risk Management Settings
use_atr_sl = input.bool(false, "Use ATR Multiplier for Stop Loss", group="Risk Management")
atr_length = input.int(14, "ATR Length", minval=1, maxval=50, group="Risk Management")
atr_multiplier = input.float(2.0, "ATR Multiplier for Stop Loss", minval=0.5, maxval=10.0, group="Risk Management")
force_london_close = input.bool(true, "Force Close at London Session End", group="Risk Management")
cutoff_minutes = input.int(60, "Minutes Before Session End to Stop New Trades", minval=0, maxval=300, group="Risk Management")
// Position Sizing Settings
position_sizing_method = input.string("USD Risk", "Position Sizing Method", options= , group="Position Sizing")
usd_risk_per_trade = input.float(100.0, "USD Risk Per Trade", minval=1.0, maxval=10000.0, group="Position Sizing")
fixed_contracts = input.float(1.0, "Fixed Number of Contracts", minval=0.01, maxval=1000.0, step=0.01, group="Position Sizing")
// Color settings
asian_color = input.color(color.red, "Asian Session Color")
london_color = input.color(color.blue, "London Session Color")
swing_high_color = input.color(color.orange, "Swing High Color")
swing_low_color = input.color(color.lime, "Swing Low Color")
bullish_structure_color = input.color(color.green, "Bullish Structure Color")
bearish_structure_color = input.color(color.red, "Bearish Structure Color")
bos_color = input.color(color.orange, "Break of Structure Color")
// Line settings
line_width = input.int(2, "Line Width", minval=1, maxval=5)
// ATR calculation for stop loss
atr = ta.atr(atr_length)
// Position size calculation function
calculate_position_size(entry_price, stop_loss_price) =>
var float position_size = na
if position_sizing_method == "Fixed Contracts"
position_size := fixed_contracts
else // USD Risk method
stop_distance = math.abs(entry_price - stop_loss_price)
if stop_distance > 0
// Calculate position size based on USD risk per trade
// For forex: position_size = risk_amount / (stop_distance * point_value)
// For most forex pairs, point value = 1 (since we're dealing with price differences directly)
position_size := usd_risk_per_trade / stop_distance
else
position_size := fixed_contracts // Fallback to fixed contracts if stop distance is 0
position_size
// Session time definitions (using input variables)
asian_start_hour = asian_start_hour_input
asian_end_hour = asian_end_hour_input
london_start_hour = london_start_hour_input
london_end_hour = london_end_hour_input
// Get current hour using selected timezone
current_hour = hour(time, session_timezone)
// Previous hour for transition detection
prev_hour = hour(time , session_timezone)
// Session transition detection
asian_start = current_hour == asian_start_hour and prev_hour != asian_start_hour
asian_end = current_hour == asian_end_hour and prev_hour != asian_end_hour
london_start = current_hour == london_start_hour and prev_hour != london_start_hour
london_end = current_hour == london_end_hour and prev_hour != london_end_hour
// Session activity detection
asian_active = (current_hour >= asian_start_hour) or (current_hour < asian_end_hour)
london_active = (current_hour >= london_start_hour) and (current_hour < london_end_hour)
// Session boxes - keep previous sessions visible
var box asian_session_box = na
var box london_session_box = na
// Create Asian session box
if show_asian and asian_start
// Create new box at session start (previous box remains visible)
asian_session_box := box.new(bar_index, high, bar_index + 1, low,
border_color=asian_color, bgcolor=color.new(asian_color, 90),
border_width=2, border_style=line.style_solid)
// Pre-calculate session highs and lows for consistency
asian_session_length = asian_active and not na(asian_session_box) ? bar_index - box.get_left(asian_session_box) + 1 : 1
current_asian_high = ta.highest(high, asian_session_length)
current_asian_low = ta.lowest(low, asian_session_length)
// Update Asian session box continuously during session
if show_asian and asian_active and not na(asian_session_box)
box.set_right(asian_session_box, bar_index)
// Update box to contain session highs and lows
box.set_top(asian_session_box, current_asian_high)
box.set_bottom(asian_session_box, current_asian_low)
// Create London session box
if show_london and london_start
// Create new box at session start (previous box remains visible)
london_session_box := box.new(bar_index, high, bar_index + 1, low,
border_color=london_color, bgcolor=color.new(london_color, 90),
border_width=2, border_style=line.style_solid)
// Pre-calculate London session highs and lows for consistency
london_session_length = london_active and not na(london_session_box) ? bar_index - box.get_left(london_session_box) + 1 : 1
current_london_high = ta.highest(high, london_session_length)
current_london_low = ta.lowest(low, london_session_length)
// Update London session box continuously during session
if show_london and london_active and not na(london_session_box)
box.set_right(london_session_box, bar_index)
// Update box to contain session highs and lows
box.set_top(london_session_box, current_london_high)
box.set_bottom(london_session_box, current_london_low)
// Asian Session Swing Points Detection
var float asian_session_high = na
var float asian_session_low = na
var int asian_high_bar = na
var int asian_low_bar = na
// Asian Session Absolute High/Low for TP levels
var float asian_absolute_high = na
var float asian_absolute_low = na
var line asian_high_line = na
var line asian_low_line = na
var label asian_high_label = na
var label asian_low_label = na
var bool high_broken = false
var bool low_broken = false
// London Session High/Low tracking for stop loss
var float london_session_high = na
var float london_session_low = na
// Market structure tracking variables
var string breakout_direction = na // "bullish" or "bearish"
var float last_hh_level = na // Last Higher High level
var float last_hl_level = na // Last Higher Low level
var float last_ll_level = na // Last Lower Low level
var float last_lh_level = na // Last Lower High level
var int structure_count = 0
var string last_structure_type = na // "HH", "HL", "LL", "LH"
// Legacy variables for compatibility
var float last_swing_high = na
var float last_swing_low = na
var int last_high_bar = na
var int last_low_bar = na
// Market structure state tracking
var float pending_high = na
var float pending_low = na
var int pending_high_bar = na
var int pending_low_bar = na
var bool waiting_for_confirmation = false
// Break of Structure tracking variables
var float most_recent_hl = na
var float most_recent_lh = na
var int most_recent_hl_bar = na
var int most_recent_lh_bar = na
var bool bos_detected = false
// Trading variables
var bool trade_taken = false
// Trade visualization boxes (based on Casper strategy approach)
var box current_profit_box = na
var box current_sl_box = na
// Update swing points during Asian session
if asian_active and show_swing_points
// Always track absolute high/low for both TP levels and breakout detection
if na(asian_absolute_high) or high > asian_absolute_high
asian_absolute_high := high
if na(asian_absolute_low) or low < asian_absolute_low
asian_absolute_low := low
// Use absolute high/low for breakout levels (simplified logic)
if na(asian_session_high) or high > asian_session_high
asian_session_high := high
asian_high_bar := bar_index
if na(asian_session_low) or low < asian_session_low
asian_session_low := low
asian_low_bar := bar_index
// Track London session high/low for stop loss levels
if london_active
if na(london_session_high) or high > london_session_high
london_session_high := high
if na(london_session_low) or low < london_session_low
london_session_low := low
// Draw initial lines when Asian session ends
if asian_end and show_swing_points
if not na(asian_session_high) and not na(asian_high_bar)
// Draw extending line for high
asian_high_line := line.new(asian_high_bar, asian_session_high, bar_index + 200, asian_session_high,
color=swing_high_color, width=2, style=line.style_dashed, extend=extend.right)
asian_high_label := label.new(bar_index + 5, asian_session_high, "Asian High: " + str.tostring(asian_session_high, "#.####"), style=label.style_label_left, color=swing_high_color, textcolor=color.white, size=size.small)
if not na(asian_session_low) and not na(asian_low_bar)
// Draw extending line for low
asian_low_line := line.new(asian_low_bar, asian_session_low, bar_index + 200, asian_session_low,
color=swing_low_color, width=2, style=line.style_dashed, extend=extend.right)
asian_low_label := label.new(bar_index + 5, asian_session_low, "Asian Low: " + str.tostring(asian_session_low, "#.####"), style=label.style_label_left, color=swing_low_color, textcolor=color.white, size=size.small)
// Reset break flags for new session
high_broken := false
low_broken := false
// Check for breakouts during London session
if london_active and show_swing_points and not na(asian_session_high) and not na(asian_session_low)
// Check if Asian high is broken
if not high_broken and not low_broken and high > asian_session_high
high_broken := true
// Update high line to end at break point
if not na(asian_high_line)
line.set_x2(asian_high_line, bar_index)
line.set_extend(asian_high_line, extend.none)
// Remove the low line (first break wins)
if not na(asian_low_line)
line.delete(asian_low_line)
if not na(asian_low_label)
label.delete(asian_low_label)
// Add break marker
label.new(bar_index, asian_session_high * 1.001, "HIGH BREAK!",
style=label.style_label_down, color=color.red, textcolor=color.white, size=size.normal)
// Set breakout direction and initialize structure tracking
breakout_direction := "bullish"
last_swing_high := asian_session_high
last_swing_low := asian_session_low
last_high_bar := bar_index
structure_count := 0
// Check if Asian low is broken
if not low_broken and not high_broken and low < asian_session_low
low_broken := true
// Update low line to end at break point
if not na(asian_low_line)
line.set_x2(asian_low_line, bar_index)
line.set_extend(asian_low_line, extend.none)
// Remove the high line (first break wins)
if not na(asian_high_line)
line.delete(asian_high_line)
if not na(asian_high_label)
label.delete(asian_high_label)
// Add break marker
label.new(bar_index, asian_session_low * 0.999, "LOW BREAK!",
style=label.style_label_up, color=color.red, textcolor=color.white, size=size.normal)
// Set breakout direction and initialize structure tracking
breakout_direction := "bearish"
last_swing_high := asian_session_high
last_swing_low := asian_session_low
last_low_bar := bar_index
structure_count := 0
// Stop extending lines when London session ends (if not already broken)
if london_end and show_swing_points
if not high_broken and not na(asian_high_line)
line.set_x2(asian_high_line, bar_index)
line.set_extend(asian_high_line, extend.none)
if not low_broken and not na(asian_low_line)
line.set_x2(asian_low_line, bar_index)
line.set_extend(asian_low_line, extend.none)
// Force close all trades at London session end (if enabled)
if london_end and force_london_close
if strategy.position_size != 0
// Extend boxes immediately before session close to prevent timing issues
if not na(current_profit_box)
// Ensure minimum 8 bars width or extend to current bar, whichever is longer
box_left = box.get_left(current_profit_box)
min_right = box_left + 8
final_right = math.max(min_right, bar_index)
box.set_right(current_profit_box, final_right)
current_profit_box := na // Clear reference after extending
if not na(current_sl_box)
// Ensure minimum 8 bars width or extend to current bar, whichever is longer
box_left = box.get_left(current_sl_box)
min_right = box_left + 8
final_right = math.max(min_right, bar_index)
box.set_right(current_sl_box, final_right)
current_sl_box := na // Clear reference after extending
strategy.close_all(comment="London Close")
trade_taken := false // Reset trade flag for next session
// Market structure detection after breakout (only during London session and before first BoS)
if show_market_structure and not na(breakout_direction) and london_active and not bos_detected
// Bullish structure tracking (HH, HL alternating)
if breakout_direction == "bullish"
// Check for Higher High pattern: Bullish candle followed by bearish candle
pattern_high = math.max(high , high)
prev_hh = na(last_hh_level) ? last_swing_high : last_hh_level
// HH Detection: Only if we expect HH next (no last structure or last was HL)
if (na(last_structure_type) or last_structure_type == "HL") and close > open and close < open and pattern_high > prev_hh and close > prev_hh
// Check consolidation
is_too_close = not na(last_high_bar) and (bar_index - last_high_bar) <= 4
should_create_hh = true
if is_too_close and structure_count > 0 and pattern_high <= last_hh_level
should_create_hh := false
if should_create_hh
structure_count := structure_count + 1
label.new(bar_index - 1, high + (high * 0.0003), "HH" + str.tostring(structure_count),
style=label.style_none, color=color.new(color.white, 100),
textcolor=color.white, size=size.small)
last_hh_level := pattern_high
last_swing_high := pattern_high
last_high_bar := bar_index
last_structure_type := "HH"
// HL Detection: Only if we expect HL next (last was HH)
pattern_low = math.min(low , low)
prev_hl = na(last_hl_level) ? last_swing_low : last_hl_level
if last_structure_type == "HH" and close < open and close > open and pattern_low > prev_hl and close > prev_hl
// Check consolidation
is_too_close = not na(last_low_bar) and (bar_index - last_low_bar) <= 4
should_create_hl = true
if is_too_close and pattern_low <= last_hl_level
should_create_hl := false
if should_create_hl
structure_count := structure_count + 1
label.new(bar_index - 1, low - (low * 0.0003), "HL" + str.tostring(structure_count),
style=label.style_none, color=color.new(color.white, 100),
textcolor=color.white, size=size.small)
last_hl_level := pattern_low
most_recent_hl := pattern_low // Update most recent HL for BoS detection
most_recent_hl_bar := bar_index - 1 // Store HL bar position
last_low_bar := bar_index
last_structure_type := "HL"
// Bearish structure tracking (LL, LH alternating)
if breakout_direction == "bearish"
// Check for Lower Low pattern: Bearish candle followed by bullish candle
pattern_low = math.min(low , low)
prev_ll = na(last_ll_level) ? last_swing_low : last_ll_level
// LL Detection: Only if we expect LL next (no last structure or last was LH)
if (na(last_structure_type) or last_structure_type == "LH") and close < open and close > open and pattern_low < prev_ll and close < prev_ll
// Check consolidation
is_too_close = not na(last_low_bar) and (bar_index - last_low_bar) <= 4
should_create_ll = true
if is_too_close and structure_count > 0 and pattern_low >= last_ll_level
should_create_ll := false
if should_create_ll
structure_count := structure_count + 1
label.new(bar_index - 1, low - (low * 0.0003), "LL" + str.tostring(structure_count),
style=label.style_none, color=color.new(color.white, 100),
textcolor=color.white, size=size.small)
last_ll_level := pattern_low
last_swing_low := pattern_low
last_low_bar := bar_index
last_structure_type := "LL"
// LH Detection: Only if we expect LH next (last was LL)
pattern_high = math.max(high , high)
prev_lh = na(last_lh_level) ? last_swing_high : last_lh_level
if last_structure_type == "LL" and close > open and close < open and pattern_high < prev_lh and close < prev_lh
// Check consolidation
is_too_close = not na(last_high_bar) and (bar_index - last_high_bar) <= 4
should_create_lh = true
if is_too_close and pattern_high >= last_lh_level
should_create_lh := false
if should_create_lh
structure_count := structure_count + 1
label.new(bar_index - 1, high + (high * 0.0003), "LH" + str.tostring(structure_count),
style=label.style_none, color=color.new(color.white, 100),
textcolor=color.white, size=size.small)
last_lh_level := pattern_high
most_recent_lh := pattern_high // Update most recent LH for BoS detection
most_recent_lh_bar := bar_index - 1 // Store LH bar position
last_high_bar := bar_index
last_structure_type := "LH"
// Check if we're within the cutoff period before London session end
current_minute = minute(time, session_timezone)
london_end_time_minutes = london_end_hour * 60 // Convert London end hour to minutes
current_time_minutes = current_hour * 60 + current_minute // Current time in minutes
// Calculate minutes remaining in London session
london_session_minutes_remaining = london_end_time_minutes - current_time_minutes
// Handle day rollover case (e.g., if london_end is 8:00 (480 min) and current is 23:30 (1410 min))
if london_session_minutes_remaining < 0
london_session_minutes_remaining := london_session_minutes_remaining + (24 * 60) // Add 24 hours in minutes
// Only allow trades if more than cutoff_minutes remaining in London session
allow_new_trades = london_session_minutes_remaining > cutoff_minutes
// Break of Structure (BoS) Detection and Trading Logic - Only first BoS per London session and outside cutoff period
if show_bos and london_active and show_market_structure and not bos_detected and not trade_taken and allow_new_trades
// Bullish BoS: Price closes below the most recent HL (after bullish breakout) - SELL SIGNAL
if breakout_direction == "bullish" and not na(most_recent_hl) and not na(most_recent_hl_bar)
// Check minimum distance requirement (at least 4 candles between BoS and HL)
if close < most_recent_hl and (bar_index - most_recent_hl_bar) >= 4
// Draw dotted line from HL position to BoS point
line.new(most_recent_hl_bar, most_recent_hl, bar_index, most_recent_hl,
color=bos_color, width=2, style=line.style_dotted, extend=extend.none)
// Calculate center position for BoS label
center_bar = math.round((most_recent_hl_bar + bar_index) / 2)
// Draw BoS label below the line for HL break
label.new(center_bar, most_recent_hl - (most_recent_hl * 0.0005), "BoS",
style=label.style_none, color=color.new(color.white, 100),
textcolor=bos_color, size=size.normal)
// SELL ENTRY
if not na(london_session_high) and not na(asian_absolute_low)
// Calculate stop loss based on settings
stop_loss_level = use_atr_sl ? close + (atr * atr_multiplier) : london_session_high
take_profit_level = asian_absolute_low
entry_price = close
// Calculate position size based on user settings
position_size = calculate_position_size(entry_price, stop_loss_level)
strategy.entry("SELL", strategy.short, qty=position_size, comment="BoS Sell")
strategy.exit("SELL EXIT", "SELL", stop=stop_loss_level, limit=take_profit_level, comment="SL/TP")
// Create trade visualization boxes (TradingView style) - minimum 8 bars width
// Blue profit zone box (from entry to take profit)
current_profit_box := box.new(left=bar_index, top=take_profit_level, right=bar_index + 8, bottom=entry_price,
bgcolor=color.new(color.blue, 70), border_width=0)
// Red stop loss zone box (from entry to stop loss)
current_sl_box := box.new(left=bar_index, top=entry_price, right=bar_index + 8, bottom=stop_loss_level,
bgcolor=color.new(color.red, 70), border_width=0)
trade_taken := true
bos_detected := true // Mark BoS as detected for this session
// Bearish BoS: Price closes above the most recent LH (after bearish breakout) - BUY SIGNAL
if breakout_direction == "bearish" and not na(most_recent_lh) and not na(most_recent_lh_bar)
// Check minimum distance requirement (at least 4 candles between BoS and LH)
if close > most_recent_lh and (bar_index - most_recent_lh_bar) >= 4
// Draw dotted line from LH position to BoS point
line.new(most_recent_lh_bar, most_recent_lh, bar_index, most_recent_lh,
color=bos_color, width=1, style=line.style_dotted, extend=extend.none)
// Calculate center position for BoS label
center_bar = math.round((most_recent_lh_bar + bar_index) / 2)
// Draw BoS label above the line for LH break
label.new(center_bar, most_recent_lh + (most_recent_lh * 0.0005), "BoS",
style=label.style_none, color=color.new(color.white, 100),
textcolor=bos_color, size=size.normal)
// BUY ENTRY
if not na(london_session_low) and not na(asian_absolute_high)
// Calculate stop loss based on settings
stop_loss_level = use_atr_sl ? close - (atr * atr_multiplier) : london_session_low
take_profit_level = asian_absolute_high
entry_price = close
// Calculate position size based on user settings
position_size = calculate_position_size(entry_price, stop_loss_level)
strategy.entry("BUY", strategy.long, qty=position_size, comment="BoS Buy")
strategy.exit("BUY EXIT", "BUY", stop=stop_loss_level, limit=take_profit_level, comment="SL/TP")
// Create trade visualization boxes (TradingView style) - minimum 8 bars width
// Blue profit zone box (from entry to take profit)
current_profit_box := box.new(left=bar_index, top=entry_price, right=bar_index + 8, bottom=take_profit_level,
bgcolor=color.new(color.blue, 70), border_width=0)
// Red stop loss zone box (from entry to stop loss)
current_sl_box := box.new(left=bar_index, top=stop_loss_level, right=bar_index + 8, bottom=entry_price,
bgcolor=color.new(color.red, 70), border_width=0)
trade_taken := true
bos_detected := true // Mark BoS as detected for this session
// Position close detection for extending boxes (based on Casper strategy)
if barstate.isconfirmed and strategy.position_size == 0 and strategy.position_size != 0
// Extend trade visualization boxes to exact exit point when position closes
if not na(current_profit_box)
// Ensure minimum 8 bars width or extend to current bar, whichever is longer
box_left = box.get_left(current_profit_box)
min_right = box_left + 8
final_right = math.max(min_right, bar_index)
box.set_right(current_profit_box, final_right)
current_profit_box := na // Clear reference after extending
if not na(current_sl_box)
// Ensure minimum 8 bars width or extend to current bar, whichever is longer
box_left = box.get_left(current_sl_box)
min_right = box_left + 8
final_right = math.max(min_right, bar_index)
box.set_right(current_sl_box, final_right)
current_sl_box := na // Clear reference after extending
// Backup safety check - extend boxes if position is closed but boxes still active
if not na(current_profit_box) and strategy.position_size == 0
box_left = box.get_left(current_profit_box)
min_right = box_left + 8
final_right = math.max(min_right, bar_index)
box.set_right(current_profit_box, final_right)
current_profit_box := na
if not na(current_sl_box) and strategy.position_size == 0
box_left = box.get_left(current_sl_box)
min_right = box_left + 8
final_right = math.max(min_right, bar_index)
box.set_right(current_sl_box, final_right)
current_sl_box := na
// Reset everything when new Asian session starts
if asian_start and show_swing_points
asian_session_high := na
asian_session_low := na
asian_high_bar := na
asian_low_bar := na
// Reset absolute levels
asian_absolute_high := na
asian_absolute_low := na
asian_high_line := na
asian_low_line := na
asian_high_label := na
asian_low_label := na
high_broken := false
low_broken := false
// Reset London session levels
london_session_high := na
london_session_low := na
// Reset market structure tracking
breakout_direction := na
last_hh_level := na
last_hl_level := na
last_ll_level := na
last_lh_level := na
last_swing_high := na
last_swing_low := na
last_high_bar := na
last_low_bar := na
structure_count := 0
last_structure_type := na
pending_high := na
pending_low := na
pending_high_bar := na
pending_low_bar := na
waiting_for_confirmation := false
// Reset BoS tracking
most_recent_hl := na
most_recent_lh := na
most_recent_hl_bar := na
most_recent_lh_bar := na
bos_detected := false
// Reset trading
trade_taken := false
// Reset current trade boxes
current_profit_box := na
current_sl_box := na
// Debug info (optional)
show_debug = input.bool(false, "Show Debug Info")
if show_debug
var table debug_table = table.new(position.top_right, 2, 3, bgcolor=color.white, border_width=1)
if barstate.islast
table.cell(debug_table, 0, 0, "Current Hour:", text_color=color.black)
table.cell(debug_table, 1, 0, str.tostring(current_hour), text_color=color.black)
table.cell(debug_table, 0, 1, "Asian Active:", text_color=color.black)
table.cell(debug_table, 1, 1, str.tostring((current_hour >= asian_start_hour) or (current_hour < asian_end_hour)), text_color=color.black)
table.cell(debug_table, 0, 2, "London Active:", text_color=color.black)
table.cell(debug_table, 1, 2, str.tostring((current_hour >= london_start_hour) and (current_hour < london_end_hour)), text_color=color.black)

LO1_TradersPostLibrary "LO1_TradersPost"
Enhanced TradersPost integration library with comprehensive order management
_buildJSONField(key, value, required)
Build a JSON field with proper handling of required vs optional fields
Parameters:
key (string) : The JSON key name
value (string) : The value to include (any type, will be converted to string)
required (bool) : If true, field is always included even if value is na/empty
Returns: String containing JSON field or empty string if optional and na/empty
_buildConditionalField(key, value)
Build a conditional JSON field that's only included if value is valid
Parameters:
key (string) : The JSON key name
value (string) : The value to include
Returns: String containing JSON field or empty string if value is na/empty
_buildConditionalNumericField(key, value)
Build a conditional JSON field for numeric values
Parameters:
key (string) : The JSON key name
value (float) : The numeric value
Returns: String containing JSON field or empty string if value is na
_buildNestedObject(objectType, price, amount, percent, stopType, limitPrice, trailAmount, trailPercent)
Build nested JSON objects for takeProfit/stopLoss
Parameters:
objectType (string) : The type of object being built ("takeProfit" or "stopLoss")
price (float) : The limit price for TP or stop price for SL
amount (float) : The dollar amount (optional)
percent (float) : The percentage (optional)
stopType (series StopLossType) : The stop loss type - only for stopLoss
limitPrice (float) : The limit price for stop_limit orders - only for stopLoss
trailAmount (float) : Trailing amount for trailing stops - only for stopLoss
trailPercent (float) : Trailing percent for trailing stops - only for stopLoss
Returns: String containing nested JSON object or empty string if no valid data
_validateAndBuildJSON(ticker, action, quantity, quantityType, orderType, sentiment, cancel, timeInForce, limitPrice, stopPrice, trailAmount, trailPercent, takeProfitPrice, takeProfitAmount, takeProfitPercent, stopLossPrice, stopLossAmount, stopLossPercent, stopLossType, stopLossLimitPrice, extendedHours, optionType, intrinsicValue, expiration, strikePrice, signalPrice, comment)
Master JSON builder that validates parameters and constructs JSON
Parameters:
ticker (string) : The trading symbol
action (series Action) : The order action (buy, sell, exit, etc.)
quantity (float) : The order quantity
quantityType (series QuantityType) : The type of quantity (fixed, dollar, percent)
orderType (series OrderType) : The order type (market, limit, stop, etc.)
sentiment (series Sentiment) : The position sentiment (long, short, flat) - optional
cancel (bool) : Controls order cancellation (true = cancel existing orders, false = don't cancel)
timeInForce (series TimeInForce) : Time in force for the order (DAY, GTC, IOC, FOK)
limitPrice (float) : Price for limit orders
stopPrice (float) : Price for stop orders
trailAmount (float) : Trailing amount for trailing stops
trailPercent (float) : Trailing percent for trailing stops
takeProfitPrice (float) : Take profit limit price (absolute)
takeProfitAmount (float) : Take profit dollar amount (relative)
takeProfitPercent (float) : Take profit percentage (relative)
stopLossPrice (float) : Stop loss price (absolute)
stopLossAmount (float) : Stop loss dollar amount (relative)
stopLossPercent (float) : Stop loss percentage (relative)
stopLossType (series StopLossType) : Stop loss order type
stopLossLimitPrice (float) : Limit price for stop_limit orders
extendedHours (bool) : Enable extended hours trading (boolean)
optionType (series OptionType) : Option type for options trading (both/call/put)
intrinsicValue (series IntrinsicValue) : Intrinsic value filter for options (itm/otm)
expiration (string) : Option expiration (date string)
strikePrice (float) : Option strike price
signalPrice (float) : The market price at alert time (for slippage tracking)
comment (string) : Optional comment for the order (shows in TradersPost UI for debugging)
Returns: ErrorResponse with success status and JSON string or error details
ValidateOrder(ticker, action, orderType, limitPrice, stopPrice)
Validate order parameters before JSON construction
Parameters:
ticker (string) : Trading symbol
action (series Action) : Order action
orderType (series OrderType) : Order type (market, limit, stop, etc.)
limitPrice (float) : Limit price for limit orders
stopPrice (float) : Stop price for stop orders
Returns: ErrorResponse with validation results
ValidateQuantity(quantity, quantityType)
Validate quantity based on type and constraints
Parameters:
quantity (float) : The quantity value
quantityType (series QuantityType) : The type of quantity
Returns: ErrorResponse with validation results
ValidatePrices(entryPrice, stopPrice, takeProfitPrice, action)
Validate price relationships and values
Parameters:
entryPrice (float) : Entry price for the order
stopPrice (float) : Stop loss price
takeProfitPrice (float) : Take profit price
action (series Action) : Order action (buy/sell)
Returns: ErrorResponse with validation results
ValidateSymbol(ticker)
Validate trading symbol format
Parameters:
ticker (string) : The symbol to validate
Returns: ErrorResponse with validation results
CombineValidationResults(validationResults)
Create validation error collection and reporting system
Parameters:
validationResults (array) : Array of ErrorResponse objects from multiple validations
Returns: Combined ErrorResponse with all validation results
ValidateCompleteOrder(ticker, action, quantity, quantityType, orderType, limitPrice, stopPrice, takeProfitPrice)
Comprehensive validation for all order parameters
Parameters:
ticker (string) : Trading symbol
action (series Action) : Order action
quantity (float) : Order quantity
quantityType (series QuantityType) : Type of quantity
orderType (series OrderType) : Order type
limitPrice (float) : Limit price (optional)
stopPrice (float) : Stop price (optional)
takeProfitPrice (float) : Take profit price (optional)
Returns: ErrorResponse with complete validation results
CreateErrorResponse(success, errorMessages, message, severity, context, functionName)
Create standardized error response
Parameters:
success (bool) : Whether the operation succeeded
errorMessages (array) : Array of error messages
message (string) : Summary message
severity (series ErrorSeverity) : Error severity level
context (string) : Context where error occurred
functionName (string) : Name of function that generated error
Returns: EnhancedErrorResponse with all error details
HandleValidationError(validationResult, context, functionName)
Handle validation errors with context
Parameters:
validationResult (ErrorResponse) : The validation result to handle
context (string) : Description of what was being validated
functionName (string) : Name of calling function
Returns: Processed error response with enhanced context
LogError(errorResponse, displayOnChart)
Log error with appropriate level
Parameters:
errorResponse (EnhancedErrorResponse) : The error response to log
displayOnChart (bool) : Whether to show error on chart
CreateSuccessResponse(message, context, functionName)
Create success response
Parameters:
message (string) : Success message
context (string) : Context of successful operation
functionName (string) : Name of function
Returns: Success response
_validateJSONConstruction(jsonString)
Validate JSON construction and handle malformed data
Parameters:
jsonString (string) : The constructed JSON string
Returns: ErrorResponse indicating if JSON is valid
CreateDetailedError(success, errors, warnings, severity, context)
Create detailed error response with context
Parameters:
success (bool) : Operation success status
errors (array) : Array of error messages
warnings (array) : Array of warning messages
severity (series ErrorSeverity) : Error severity level
context (string) : Context where error occurred
Returns: DetailedErrorResponse object
LogDetailedError(response)
Log detailed error response with appropriate severity
Parameters:
response (DetailedErrorResponse) : DetailedErrorResponse to log
Returns: Nothing - logs to Pine Script console
CombineIntoDetailedResponse(responses, context)
Combine multiple error responses into detailed response
Parameters:
responses (array) : Array of ErrorResponse objects to combine
context (string) : Context for the combined operation
Returns: DetailedErrorResponse with combined results
SendAdvancedOrder(ticker, action, quantity, quantityType, orderType, sentiment, cancel, limitPrice, stopPrice, trailAmount, trailPercent, takeProfitPrice, takeProfitAmount, takeProfitPercent, stopLossPrice, stopLossAmount, stopLossPercent, stopLossType, stopLossLimitPrice, extendedHours, optionType, intrinsicValue, expiration, strikePrice, signalPrice, comment)
Send advanced order with comprehensive parameter validation and JSON construction
Parameters:
ticker (string) : Symbol to trade (defaults to syminfo.ticker)
action (series Action) : Order action (buy/sell/exit/cancel/add)
quantity (float) : Order quantity
quantityType (series QuantityType) : Type of quantity (fixed/dollar/percent)
orderType (series OrderType) : Type of order (market/limit/stop/stop_limit/trailing_stop)
sentiment (series Sentiment) : Position sentiment (long/short/flat, optional)
cancel (bool) : Controls order cancellation (true = cancel existing, false = don't cancel, na = use defaults)
limitPrice (float) : Limit price for limit orders
stopPrice (float) : Stop price for stop orders
trailAmount (float) : Trailing amount for trailing stops
trailPercent (float) : Trailing percent for trailing stops
takeProfitPrice (float) : Take profit limit price (absolute)
takeProfitAmount (float) : Take profit dollar amount (relative)
takeProfitPercent (float) : Take profit percentage (relative)
stopLossPrice (float) : Stop loss price (absolute)
stopLossAmount (float) : Stop loss dollar amount (relative)
stopLossPercent (float) : Stop loss percentage (relative)
stopLossType (series StopLossType) : Stop loss order type
stopLossLimitPrice (float) : Limit price for stop_limit orders
extendedHours (bool) : Enable extended hours trading (boolean)
optionType (series OptionType) : Option type for options trading (both/call/put)
intrinsicValue (series IntrinsicValue) : Intrinsic value filter for options (itm/otm)
expiration (string) : Option expiration (date string)
strikePrice (float) : Option strike price
signalPrice (float) : The market price at alert time (for slippage tracking)
comment (string) : Optional comment for the order (shows in TradersPost UI for debugging)
Returns: ErrorResponse with success status and JSON or error details
SendSentiment(ticker, sentiment, quantity, quantityType, signalPrice, comment)
Send sentiment-based position management order
Parameters:
ticker (string) : Symbol to manage (defaults to syminfo.ticker)
sentiment (series Sentiment) : Target position sentiment (long/short/flat)
quantity (float) : Position size (optional, uses account default if not specified)
quantityType (series QuantityType) : Type of quantity specification
signalPrice (float) : The market price at alert time (for slippage tracking)
comment (string) : Optional comment
Returns: ErrorResponse with success status
SendCancelAll(ticker, comment)
Cancel all open orders for the specified symbol
Parameters:
ticker (string) : Symbol to cancel orders for (defaults to syminfo.ticker)
comment (string) : Optional comment for the cancellation
Returns: ErrorResponse with success status
SendOrderNoCancelExisting(ticker, action, quantity, quantityType, orderType, sentiment, limitPrice, stopPrice, takeProfitPrice, takeProfitAmount, takeProfitPercent, stopLossPrice, stopLossAmount, stopLossPercent, stopLossType, stopLossLimitPrice, signalPrice, comment)
Send order without canceling existing orders
Parameters:
ticker (string) : Symbol to trade (defaults to syminfo.ticker)
action (series Action) : Order action (buy/sell/exit)
quantity (float) : Order quantity
quantityType (series QuantityType) : Type of quantity (fixed/dollar/percent)
orderType (series OrderType) : Type of order (market/limit/stop/stop_limit)
sentiment (series Sentiment) : Position sentiment (long/short/flat, optional)
limitPrice (float) : Limit price for limit orders
stopPrice (float) : Stop price for stop orders
takeProfitPrice (float) : Take profit price
takeProfitAmount (float) : Take profit amount (optional)
takeProfitPercent (float)
stopLossPrice (float) : Stop loss price
stopLossAmount (float) : Stop loss amount (optional)
stopLossPercent (float) : Stop loss percentage (optional)
stopLossType (series StopLossType) : Stop loss order type
stopLossLimitPrice (float) : Limit price for stop_limit orders
signalPrice (float) : The market price at alert time (for slippage tracking)
comment (string) : Optional comment
Returns: ErrorResponse with success status
_buildBracketOrderParams(orderType, entryPrice, entryLimitPrice)
Build bracket order parameters by routing entryPrice to correct parameter based on orderType
This helper function maps the conceptual "entryPrice" to the technical parameters needed
Parameters:
orderType (series OrderType) : The order type for the entry order
entryPrice (float) : The desired entry price (trigger for stops, limit for limits)
entryLimitPrice (float) : The limit price for stop_limit orders (optional)
Returns: array with correct routing
SendBracketOrder(ticker, action, quantity, quantityType, orderType, entryPrice, entryLimitPrice, takeProfitPrice, stopLossPrice, takeProfitAmount, takeProfitPercent, stopLossAmount, stopLossPercent, stopLossType, stopLossLimitPrice, signalPrice, comment)
Send bracket order (entry + take profit + stop loss)
Parameters:
ticker (string) : Symbol to trade
action (series Action) : Entry action (buy/sell)
quantity (float) : Order quantity
quantityType (series QuantityType) : Type of quantity specification
orderType (series OrderType) : Type of entry order
entryPrice (float) : Entry price (trigger price for stop orders, limit price for limit orders)
entryLimitPrice (float) : Entry limit price (only for stop_limit orders, defaults to entryPrice if na)
takeProfitPrice (float) : Take profit price
stopLossPrice (float) : Stop loss price
takeProfitAmount (float) : Take profit dollar amount (alternative to price)
takeProfitPercent (float) : Take profit percentage (alternative to price)
stopLossAmount (float) : Stop loss dollar amount (alternative to price)
stopLossPercent (float) : Stop loss percentage (alternative to price)
stopLossType (series StopLossType) : Stop loss order type
stopLossLimitPrice (float) : Limit price for stop_limit orders
signalPrice (float) : The market price at alert time (for slippage tracking)
comment (string) : Optional comment
Returns: ErrorResponse with success status
SendOTOOrder(primaryTicker, primaryAction, primaryQuantity, primaryOrderType, primaryPrice, secondaryTicker, secondaryAction, secondaryQuantity, secondaryOrderType, secondaryPrice, signalPrice, comment)
Send One-Triggers-Other (OTO) order sequence
Note: OTO linking must be configured in TradersPost strategy settings
This sends two separate orders - TradersPost handles the OTO logic
Parameters:
primaryTicker (string) : Primary order ticker
primaryAction (series Action) : Primary order action
primaryQuantity (float) : Primary order quantity
primaryOrderType (series OrderType) : Primary entry type
primaryPrice (float) : Primary order price
secondaryTicker (string) : Secondary order ticker (defaults to primary ticker)
secondaryAction (series Action) : Secondary order action
secondaryQuantity (float) : Secondary order quantity
secondaryOrderType (series OrderType) : Secondary entry type
secondaryPrice (float) : Secondary order price
signalPrice (float) : The market price at alert time (for slippage tracking)
comment (string) : Optional comment for both orders
Returns: ErrorResponse with success status
SendOCOOrder(ticker, firstAction, firstQuantity, firstOrderType, firstPrice, secondAction, secondQuantity, secondOrderType, secondPrice, signalPrice, comment)
Send One-Cancels-Other (OCO) order pair
Note: OCO linking must be configured in TradersPost strategy settings
This sends two separate orders - TradersPost handles the OCO logic
Parameters:
ticker (string) : Symbol for both orders
firstAction (series Action) : Action for first order
firstQuantity (float) : Quantity for first order
firstOrderType (series OrderType) : Order type for first order
firstPrice (float) : Price for first order
secondAction (series Action) : Action for second order
secondQuantity (float) : Quantity for second order
secondOrderType (series OrderType) : Order type for second order
secondPrice (float) : Price for second order
signalPrice (float) : The market price at alert time (for slippage tracking)
comment (string) : Optional comment
Returns: ErrorResponse with success status
ErrorResponse
Fields:
success (series bool)
errors (array)
message (series string)
EnhancedErrorResponse
Fields:
success (series bool)
errors (array)
message (series string)
severity (series ErrorSeverity)
context (series string)
timestamp (series int)
functionName (series string)
DetailedErrorResponse
Fields:
success (series bool)
errors (array)
warnings (array)
severity (series ErrorSeverity)
context (series string)
message (series string)

CalculatePercentageSlTpLibrary "CalculatePercentageSlTp"
This Library calculate the sl and tp amount in percentage
sl_percentage(entry_price, sl_price)
this function calculates the sl value in percentage
Parameters:
entry_price : indicates the entry level
sl_price : indicates the stop loss level
Returns: stop loss in percentage
tp_percentage(entry_price, tp_price)
this function calculates the tp value in percentage
Parameters:
entry_price : indicates the entry level
tp_price : indicates the take profit level
Returns: take profit in percentage
sl_level(entry_price, sl_percentage)
this function calculates the sl level price
Parameters:
entry_price : indicates the entry level
sl_percentage : indicates the stop loss percentage
Returns: stop loss price in $
tp_level(entry_price, tp_percentage)
this function calculates the tp level price
Parameters:
entry_price : indicates the entry level
tp_percentage : indicates the take profit percentage
Returns: take profit price in $