OPAL - ZoroToday I present you a good old script for Price Action analysis & Key levels spotting.
This indicator include : 4 pivots validation scripts on different scales (two for Zig-Zags, one for H/L Spotting, one for Support and Resistances drawing)
1) Dual Zig-Zags] = combination of 2 Zig-Zags draws inner and outer price waves, great for Elliott Waves counts
Faster Zig-Zag is set by default to 3 candles confirmations then it will start a new wave
Slower Zig-Zag is set by default to 15 candles confirmations then it will start a new wave
2) H/L Spotter] = prints Higher-Highs/Higher-Lows for bullish Price Action / Lower-Highs/Lower-Lows for bearish Price Action
Default settings of 2 candles confirmations (periods) reduces lag making it a very fast way to spot high and low movements, each time 2 successive candles respects the last high or low
If Period is set to 1, it will print each counter-trend closes (more levels)
"Right" and "Left" are used for lookbacks, by default 1
Options :
-Show HH/HL/LH/LL labels
-Show HH/HL/LH/LL prices
-Draw Support/Resistance line when a pivot is found, until a new pivot is found in the same direction, great to visualize when a candle close above or below last highs or lows.
3) Supports/Resistances extensions] = calculates its own pivots from differents settings, and extends last 10 pivots (5 highs, 5 lows)
Everything is customizable, all the pivots settings are unlocked
Prices often pullback on naked H/L (naked = untested), thoses levels are powerfull on high timeframes, and such a great tool to make a trading plan.
A great combination for both Smart Money concepts and Elliot Waves trading, on short or high timeframes;
The purpose is to help lazy traders (like me) visualize Market Structures and key levels easier;
Pretty reliable on high timeframes, especially on crypto bull markets.
I strongly believe that candles and prices are the best indicator, there is no lag in Price Action.
Making a plan, sticking to the plan, a strong way to find peace.
Wishing you success !
<o/ This indicator is a gift for the community
Pesquisar nos scripts por "elliott"

High Volume EMA Cross EW Filtered Trading SignalsThis script signals on 8/21 Ema crosses that are confirmed by MACD, volume osc, and Elliott Wave count filtering. The effort is to limit the noise of crossover signals to the best volume supported moves. This was built using TD Wave and tested only on 15m chart forex pairs. Users can adjust the minimum volume osc score required for a signal. It will miss moves that start off slow (low volume). It can get faked out but the good out weight the bad in number and distance of move.

Signal Money PlusSignal Money Plus is a trend analysis indicator including Signal Money and Signal Money Plus.
Signal Money:
- Signal Money enters the overbought or oversold area and the price fluctuates around the strong support or resistance area, giving a reliable signal.
- Signal Money creates a divergence, and the price fluctuates around a strong support or resistance area, giving a reliable signal.
- The price fluctuates in a narrow range but the Signal Money correcting according to the elliott wave pattern gives a reliable signal.
Signal Money Plus:
- Money Plus > 0 for positive cash flow trend. Money Plus < 0 for negative cash flow trend. Money Plus fluctuates around -20 to 20, showing an accumulation trend waiting for a confirmation signal.
- Money Plus creates divergence for reliable signal
Use combination Signal Money Plus:
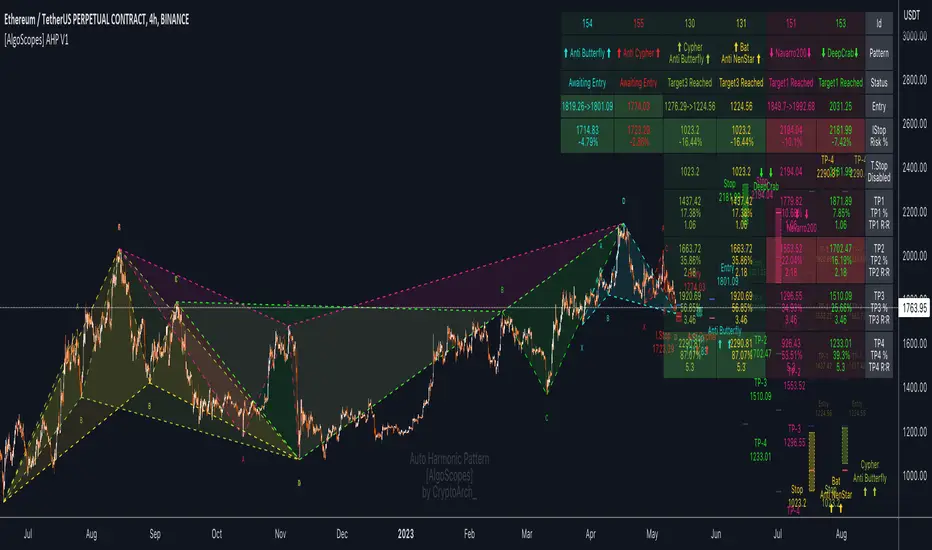
Auto Harmonic Pattern - PRO [AlgoScopes] V1Harmonic Patterns is a powerful tool for identifying potential reversal areas in the financial markets. Auto Harmonic Pattern Pro it is based on the work of Scott Carney, a renowned trader and author who developed the concept of harmonic patterns.
Scott Carney's extensive research and contributions have greatly enhanced our understanding of market patterns and their application in trading. Auto Harmonic Pattern Pro is adapted from Scott Carney's original work on harmonic patterns, as well as other sources that have contributed to the recognition and understanding of harmonic patterns beyond Carney's initial research.
Auto Harmonic Pattern Pro offers traders a valuable tool for identifying potential reversal zones in the markets. We would like to express our gratitude to Scott Carney for his pioneering work in developing harmonic patterns, as well as to the various contributors and sources that have expanded our knowledge and understanding of harmonic patterns beyond Carney's original research.
Remember to always practice proper risk management and combine the indicator's signals with other technical analysis tools for a comprehensive trading approach.
For more information about Scott Carney and his work on harmonic patterns, you can find additional resources on his official website.
💠 ABOUT THE SCRIPT
💎 DISPLAY
⚬ The following things are displayed by default on the chart
🔸 Live patterns in trade with XABCD labels. (filled major triangle)
🔸 Entry, Stop and Target levels on chart for all live patterns. Target level are dimmed along with reducing size when they become irrelevant
🔸 Open Trades Stat table - Show patterns ID, patterns name, status for patterns, size&age, Entry, I.Stop, T.Stop and Targets (TP1 - TP4).
⚬ Highlighted present stop (and/or trailing stop if is enabled) and next target
⚬ When there are multiple patterns on chart, Entry, Stop, and Target labels & lines & PRZ* boxes are created with specific distance from each other to provide clarity to the users
*(potential reversal zone)
⬜ SETTINGS
⚬ Let's talk about some of the settings. Almost all of these settings have already been optimized and tested over time, but for some tickers it might be better to do a new test.
💎 ZIGZAG
🔸 Length - Default is set to 8. User can change settings but it is a good idea to keep with fibonacci (5, 13, 21, 34, 55 etc)
🔸 Depth - This setting is for how many pivots indicator scan to find harmonic pattern. By default it is set as 200
🔸 Recursive Algorithm - Enabled will use recursive instead standard zigzag
💎 HARMONIC PATTERN SETTINGS
🔸 Trade Direction - Default is set to show all (bearish and bullish) harmonic patterns. Can be filtered to bullish or bearish direction.
🔸 Error Percent - Default is 8. That is error percent tolerance from perfect pattern ratio.
🔸 Maximum patterns - Maximum patterns allowed on chart at any time
⚬ When it reaches the maximum patterns and the indicator finds a new one, the old patterns will be removed
- (important for algo traders because alerts for those removed patterns will no longer be a trigger)
🔸 Pattern size
⚬ Without filter will show all patterns (regardless of size)
⚬ Show only patterns for user preference size (no more two patterns because is smaller of 280 bars)
🔸 External Filter - It can be used to filter harmonic patterns. You can build your own custom trend based scripts and use it with AHP to filter trades.
⚬ The structure of the external script must be
1 for Long/Bullish patterns
-1 for Short/Bearish patterns
2 for all (Long and Short patterns)
0 Trade is not allowed
🔸 Filter Pattern Starts
⚬ When Filter starts is enabled pattern will start for logical pivot (see example)
⚬ Disabled filter will show more patterns (still can be very profitable)
💎 STOP & ENTRY & TRAILING STOP
🔸 Trail Entry Price - If Entry is still not reached and the price is still in PRZ zone, at the new high/low will adjust Entry.
⚬ Open Stats table will show the first Entry (when patterns were found) as well as the last corrected Entry (when patterns reached Entry level).
⚬ Disable this option Entry will remain at the level when patterns are found.
🔸 Enable Targets (awaiting entry) - enabled will show potential Targets for "awaiting entry" patterns (not active patterns because they have not yet reached Entry).
⚬ The Open stats table will show all other information, risk %, R:R etc).
⚬ Risky trade but with very good R:R (not recommended for inexperienced traders, very high risk of trading hitting Stop before reaching a Target)
🔸 Stop Distance - By default is set to 5. That is percent from the last low/high when the pattern reaches Entry. Stop trail from price till pattern reached Entry level.
🔸 Entry Distance - By default is set to 16. Same for SL that is percent distance from live price. You can increase/decrease percent but remember you have to give space between live price and the entry.
⚬ If entry is close to price, trade will become active too quickly
⚬ Remember if you change Stop Distance as well as Entry Distance to check Risk : Reward (recommended R:R for the first target is about 1:1)
🔸 Trailing Type - Options for trailing type, Continuous, Stepped, Breakeven and Disabled.
⚬ Continuous - When the price reaches "Trailing Active" (initial level for activating the trailing stop), T.Stop will start from Entry or Initial Stop (based on "Trailing Starts") and follow the price by Distance or Percent (based on "Trailing by").
- example one (trailing starts from Initial Stop when TP1 reached by distance/price on picture 1 and by percent on picture 2)
- example two (trailing starts from Entry when TP1 reached by distance/price on picture 1 and by percent on picture 2)
⚬ Stepped - when price reaches Trailing Active (initial level for activating the trailing stop), T.Stop will move to the previous level
- (If "Trailing Active" is set to Target2, then T.Stop will move to Target1 when price reached TP2)
⚬ Breakeven - when price reaches Trailing Active (initial level for activating the trailing stop), T.Stop will move to Entry and stay there the entire time for that harmonic trade
- (till reached all targets or reached T.Stop)
🔸 Trailing Active - When will the Trailing Stop be activated ("Trailing Type" must be enabled)
🔸 Trailing by - Distance or Percent
⚬ Distance - T.Stop will follow live price by initial distance
⚬ Percent - T.Stop will follow live price by initial percent
🔸 Trailing Starts - Entry or Initial Stop
⚬ Entry - T.Stop will start trailing from Entry level
⚬ I.Stop - T.Stop will start trailing from initial Stop level
- (Check Continuous picture for information)
💎 TARGET
🔸 Base - The level from which the calculation for Targets is made.
🔸 Target 1/Target 4 dropdown - Targets are set by default and set in the dropdown most often used for those targets.
🔸 Target 1/Target 4 custom - If the desired ratio is not in the dropdown, then it is possible to manually enter the desired ratio.
⚬ (If you want to change some of the targets, maybe to confluence with support/resistance)
💎 PATTERNS
🔸 Harmonic Patterns Type
⚬ Enable/Disable harmonic patterns by Type of patterns (for Classic and Anti patterns)
⚬ By default all patterns are enabled (for standard patterns). Users can control and select/deselect all Classic, Anti or Non Standard patterns but also disable individual patterns.
⚬ For some patterns (like Shark and Navarro 200) we change PRZ or place in different Type groups. That is just cosmetic things.
🔸 Classic - This includes all and most popular Harmonic Patterns.
⚬ Gartley (Type I)
⚬ Bat (Type I)
⚬ Butterfly (Type II)
⚬ Crab (Type II)
⚬ Deep Crab (Type II)
⚬ Cypher (Type II)
⚬ Shark (Type III)
⚬ Nenstar (Type IV)
🔸 Anti Patterns
⚬ Anti Nenstar (Type I)
⚬ Anti Shark (Type II)
⚬ Anti Cypher (Type II)
⚬ Anti Crab (Type II)
⚬ Anti Butterfly (Type III)
⚬ Anti Bat (Type IV)
⚬ Anti Gartley (Type IV)
⚬ Navarro 200 (Type IV)
🔸 Non Standard -
⚬ White Swan
⚬ Black Swan
⚬ 3 Drive
⚬ Anti 3 Drive
⚬ Wolfe
⚬ Snorm
⚬ 121 Pattern
⚬ 5-0 Pattern
⚬ Sea Pony
⚬ Leonardo
💎 PATTERN DISPLAY OPTION
🔸 Pattern Lines Size - thickness for harmonic patterns
🔸 Pattern Lines Type - type for harmonic pattern lines (solid, dotted, dashed)
🔸 Fill XAB/BCD - major harmonic triangle
🔸 Fill ABC/XBD - minor harmonic triangle
🔸 Enable XABCD Label - labels for harmonic pattern
🔸 XABCD Label Size - size for harmonic xabcd labels
🔸 Enable Ratio Label & Line - lines and labels that connect harmonic patterns levels and that show the patterns ratio
🔸 Ratio Label Size - ratio labels size
⚬ Lines for pattern ratio are set by default dashed and can’t be changed.
💎 PRZ & ENTRY | STOP | TARGET SETTINGS
🔸 Entry & Stop & Target Labels - by default is set to small (opt small & normal)
🔸 Entry & Stop & Target Lines - by default is set to show lines & labels & price (opt lines & labels & price or lines & labels or disable all)
🔸 PRZ Box size - size in bars for PRZ box
⚬ Added option when it is not readable on chart pattern names or entry/stop/targets offset
⚬ Maximum (last pattern) can be drawn up to 500 bars in future or you will get error for script (use this option only when you need)
🔸 PRZ Box Type of Spacing - distance between PRZ boxes. "Auto" will make the maximum distance when there are more than 3 patterns on the chart for better visibility
- (the maximum can be projected up to 500 bars in the future)
🔸 PRZ Box Manual Spacing - manual distance between PRZ boxes if is “PRZ Box Type of Spacing” set to manual
💎 STATS AND DISPLAY
⚬ These settings can be used to manage display of open and close statistic tables
🔸 Open Trades - By default is enabled and set to the top right position.
🔸 Closed Trades - By default is disabled and set to bottom left position.
⚬ The size of the table can be changed (by default it is set to small)
🔸 Enable Tool Tip for Table - can be enabled/disabled. Shows important information for each section related to Open or Closed tables.
⚬ Recommended enabled until everything related to tables is understood, and later disabled (it starts to get annoying when you accidentally cross the tables with the mouse and tooltip box pop up)
💎 OPEN STATS
🔸 Percentage - show percentage for Targets and Stops
🔸 Risk/Reward - show patterns risk to reward for each Targets
🔸 Size/Age - show patterns size (from X to D in bars) and patterns age (distance in bars when patterns “In Trade”)
🔸 Live % & R:R - enabled will show live % and R:R if you take trade in that moment
💎 CLOSED STATS
🔸 Percentage - show stats by percent instead of numbers
🔸 Display Mode - Closed trade table have three display option, Compact, Detailed and Selective
⚬ Compact - show stats for Long/Bullish and Short/Bearish patterns
⚬ Selective - show stats just for active patterns
⚬ Detailed - show stats for each enabled patterns
- All stats is for “Backtest Bars” if enabled.
- I removed some things from the previous indicator (R:R as well as trailing R:R and win rate) because I think they are not relevant in Closed Table for trade or for statistics (Open Table have that)
💎 PATTERN | CHART COLOR THEME
⚬ By default it is set to Light color theme. Color theme will affect pattern lines, XABCD labels, ratio lines and label, entry/sl/targets labels and text in the open statistics table.
🔸 Dark Theme / Light Theme - Users can change any default individual color for dark or light theme (transparency too).
⚬ Light/Dark Theme suits dark or light chart background or user can change all color to preferred trade style.
⚬ Users have extra control to change all color to preferred trade style.
💎 ALERTS
⚬ Alerts - These settings help users to choose the type of alerts they want to receive.
🔸 New - New Harmonic Pattern is identified
🔸 Entry - Harmonic Pattern reached Entry level
🔸 Target 1/Target4 - Alert when patterns reached on of Target levels
🔸 Closure - Harmonic Pattern trade is closed. Reached all Targets or Stop or Trailing Stop (if is enabled)
🔸 Long & Short placeholders - Enabled will change for alerts Bullish/Bearish text for Long/Short text
⚬ example of custom alerts with some placeholders
💎 BACKTEST WINDOW
🔸 Backtest bars - Enabled will scan patterns for that bar range (default is set to 5000)
🔷 TOOL TIP
⚬ In setting you have help from tooltip to give you almost all this information for easy understanding. Hover mouse above tool tip and windows with info will appear.
⚬ On the chart, tool tip is added for each individual Harmonic pattern to show extra information (pattern ratio, type of harmonic and where often that pattern appears in Elliott wave fractal)
⚬ Tooltip for tables will also provide all the information related to Open and Closed tables. Disabled tooltip for tables will hide all information, but the tooltip for patterns will still remain.
🔴 Possible Errors
⚬ If a mistake is made in the settings and, for example, TP2 is set to 0.618 ratio and TP3 is changed to 0.5 ratio
- (the larger target is set to a smaller ratio than the smaller target), a red text will appear over most charts to indicate the error.
⚬ If Trailing Type is enabled and "Trailing Active" and "Trailing Starts" are set to the same level (Entry), a red text will appear on the charts to indicate an error
- (change "Trailing Active" to a higher level, TP1, or lower "Trailing Starts " to "I.Start")
Cash Data Chart (Wave Chart)This Indicator is applicable to plot Cash Data Chart in tradingview and it will be very useful for traders who analyze with NEoWave method.
NEoWave analysis method was invented by Glenn Neely and it is a revolutionary style of Elliott Wave Theory.
For analyzing with NEoWave method, we need a particular chart called Wave Chart or Cash Data chart. Wave charts provide a very accurate representation of the Wave movement of the market and allow for much better Wave analysis as a result. To draw this chart, Highs and Lows should be plotted in the order that they occurred. This could be a very challenging and time-consuming task to do for any symbol on any Timeframe. This indicator can calculate and plot Cash Data Charts fast and accurately.
Cash Data Chart is not only useful for people who want to analyze with the NEoWave method, but can also can have a wide range of research areas and can be used in other research and analytical methods.
Some features of this indicator:
- Draw the chart in the desired time frame fast and accurately
- Detect intervals with two duplicate highs or two duplicate lows
- View wave chart and Candlestick chart simultaneously or separately
- Draw charts automatically or draw a chart with the desired interval length and desired start time
- Auto updating Cash Data Charts
- Draw charts on logarithmic and linear price scales
special thanks to www.tradingview.com

3rd WaveHello All,
In Elliott Wave Theory, 3rd wave is not the shortest one in the waves 1/3/5 and it's usually longest one. so if we can catch it then we may get good opportunities to trade. This script finds 3rd wave experimentally. it can be also the 3rd waves in the waves 1, 3, 5, A and C. the 3rd wave should have greater volume than other waves, the script can check its volume and compare with the volumes of the waves 1 and 2 optionally.
Pine Team released Pine version 5! This script was developed in v5 and it uses Library feature of Pine v5 for the zigzag functions. This script is also an example for the Pine developers who learn Pine v5 and Libraries.
Options:
Zigzag Period: is the length that is used to calculate highest/lowest and the zigzag waves
Min/Max Retracements: is the retracement rates to check the wave 2 according to wave 1. for example; if min/max values are 0.500-0.618 then wave 2 must be minimum 0.500 of wave 1 and maximum 0.618 of wave 1.
Check Volume Support: is an option to compare the volumes of1. 2. and . waves. if you enable this option then the script checks their volume and 3rd wave volume must be greater then 1 and 2
there are 4 options for the targets. you can enable/disable and change their levels. targets are calculated using length of wave 1.
Options to show breakout zone, zigzag, wave 1 and 2.
and some options for the colors.
The Library that is used in this script:
P.S. This is an experimental work and can be improved. So do not hesitate to drop your comments under the script ;)
Enjoy!

MACD PlusMoving Average Convergence Divergence – MACD
The MACD is an extremely popular indicator used in technical analysis. It can be used to identify aspects of a security's overall trend. Most notably these aspects are momentum, as well as trend direction and duration. What makes the MACD so informative is that it is actually the combination of two different types of indicators. First, the MACD employs two Moving Averages of varying lengths (which are lagging indicators) to identify trend direction and duration. Then, it takes the difference in values between those two Moving Averages (MACD Line) and an EMA of those Moving Averages (Signal Line) and plots that difference between the two lines as a histogram which oscillates above and below a center Zero Line. The histogram is used as a good indication of a security's momentum.
Added Color Plots to Settings Pane.
Switched MTF Logic to turn ON/OFF automatically w/ TradingView's Built in Feature.
Added Ability to Turn ON/OFF Show MacD & Signal Line.
Added Ability to Turn ON/OFF Show Histogram.
Added Ability to Change MACD Line Colors Based on Trend.
Added Ability to Highlight Price Bars Based on Trend.
Added Alerts to Settings Pane.
Customized Alerts to Show Symbol, TimeFrame, Closing Price, MACD Crosses Up & MACD Crosses Down Signals in Alert.
Alerts are Pre-Set to only Alert on Bar Close.
Added ability to show Dots when MACD Crosses.
Added Ability to Change Plot Widths in Settings Pane.
Added in Alert Feature where Cross Up if above 0 or cross down if below 0 (OFF By Default).
Squeeze Pro
Traditionally, John Carter's version uses 20 period SMAs as the basis lines on both the BB and the KC.
In this version, I've given the freedom to change this and try out different types of moving averages.
The original squeeze indicator had only one Squeeze setting, though this new one has three.
The gray dot Squeeze, call it a "low squeeze" or an "early squeeze" - this is the easiest Squeeze to form based on its settings.
The orange dot Squeeze is the original from the first Squeeze indicator.
And finally, the yellow dot squeeze, call it a "high squeeze" or "power squeeze" - is the most difficult to form and suggests price is under extreme levels of compression.
Colored Directional Movement Index (CDMI) , a custom interpretation of J. Welles Wilder’s Directional Movement Index (DMI), where :
DMI is a collection of three separate indicators ( ADX , +DI , -DI ) combined into one and measures the trend’s strength as well as its direction
CDMI is a custom interpretation of DMI which presents ( ADX , +DI , -DI ) with a color scale - representing the trend’s strength, color density - representing momentum/slope of the trend’s strength, and triangle up/down shapes - representing the trend’s direction. CDMI provides all the information in a single line with colored triangle shapes plotted on the bottom. DMI can provide quality information and even trading signals but it is not an easy indicator to master, whereus CDMI simplifies its usage. The CDMI adds additional insight of verifying/confirming the trend as well as its strength
Label :
Displaying the trend strength and direction
Displaying adx and di+/di- values
Displaying adx's momentum (growing or falling)
Where tooltip label describes "howto read colored dmi line"
Ability to display historical values of DMI readings displayed in the label.
Added "Expert Trend Locator - XTL"
The XTL was developed by Tom Joseph (in his book Applying Technical Analysis ) to identify major trends, similar to Elliott Wave 3 type swings.
Blue bars are bullish and indicate a potential upwards impulse.
Red bars are bearish and indicate a potential downwards impulse.
White bars indicate no trend is detected at the moment.
Added "Williams Vix Fix" signal. The Vix is one of the most reliable indicators in history for finding market bottoms. The Williams Vix Fix is simply a code from Larry Williams creating almost identical results for creating the same ability the Vix has to all assets.
The VIX has always been much better at signaling bottoms than tops. Simple reason is when market falls retail traders panic and increase volatility , and professionals come in and capitalize on the situation. At market tops there is no one panicking... just liquidity drying up.
The FE green triangles are "Filtered Entries"
The AE green triangles are "Aggressive Filtered Entries"

Super_Macd_Alerts_EMA_publicQuickly find market caps, risk management and predict the timing of contrarian tensions.
By automatically receiving trend changes, we support trend follow, push and return strategies simply and quickly.
Make the most of this all-in-one system and take your trading style one step further.
・ Main functions
MACD slope change signal (UP / DN)
MACD hidden divergence signal (HL / HS)
Histogram divergence signal (vertical background: blue / pink)
You need to use signals without going against the trend.
·idea
Recommended for use with Elliott Wave, SUPER TREND
・ Chart example
WTI Crude Oil Futures | HS Signal Before Crash
GOLD CFD 1D
2021/7/1
UP signal before returning to the UP trend
2021/8/5
HS signal before the crash
BTCUSD 4H
2021/08/10
Signals to use: UP / HL on uptrend, Histogram divergence (pink)

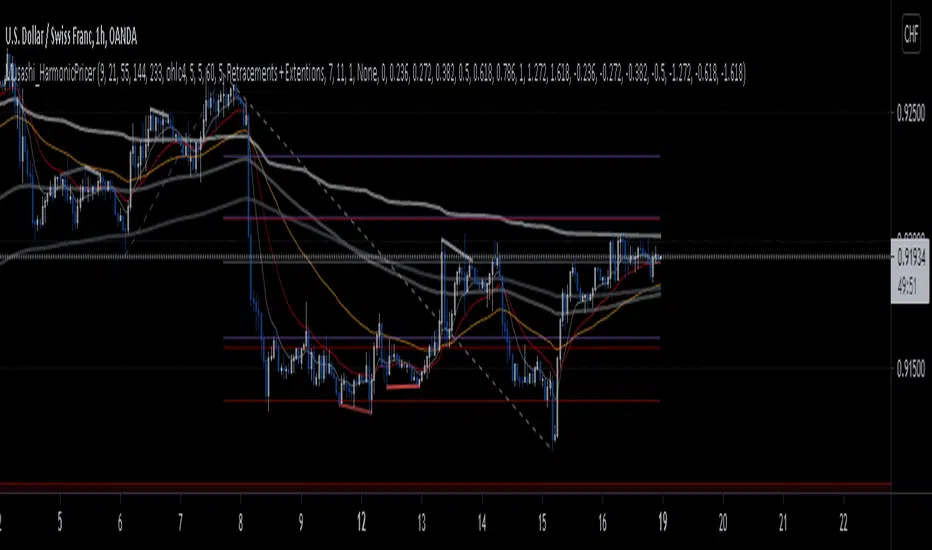
Musashi_HarmonicPricerMusashi HarmonicPricer was designed to my a tool for my personal trading strategy, and help me plot what I call ''Harmonic Structure', which is just a sophisticated way of using Fibonacci ratios based on the Elliott Wave Principle, Harmonic Patterns, and market structure.
- A distinctive element will be the integrated Fibonacci cluster tool, which plots automatically retracements and extensions of .272 (red) and .618 (purple) ratios, using the last two significant swings. For powerful usage, adjust the timeframes until they group into clusters or adjust the setup. You can also adjust the settings and select to plot only retracement, only extensions, both (default), the deviation (default = 7), and the historical approach.
- To be used wisely properly, you require multi-timeframe analysis, reason why you will find Monthly and Yearly VWAPs, as they won't change while you're switching timeframes, and fib-based EMAs to provide trend and dynamic support.
- Finally, the indicator will plot in price Hidden and Regular divergences for any oscillator you have on screen.
Have a good day.
macBar is a script for displaying the trend with colored barsThis script is based on educational materials I received at a webinar by Jeffrey Kennedy of Elliott Wave International. I didn't find such a script in the Tradingview library, so I wrote it myself.
This is a simple script that colors the bars depending on where the price is and its extremes relative to a simple moving average.
The green bars say the market is bullish.
The gray bars indicate that the market is neutral.
The red bars say the market is bearish.
In the script, you can change the period of the simple moving average, by default it is 10.

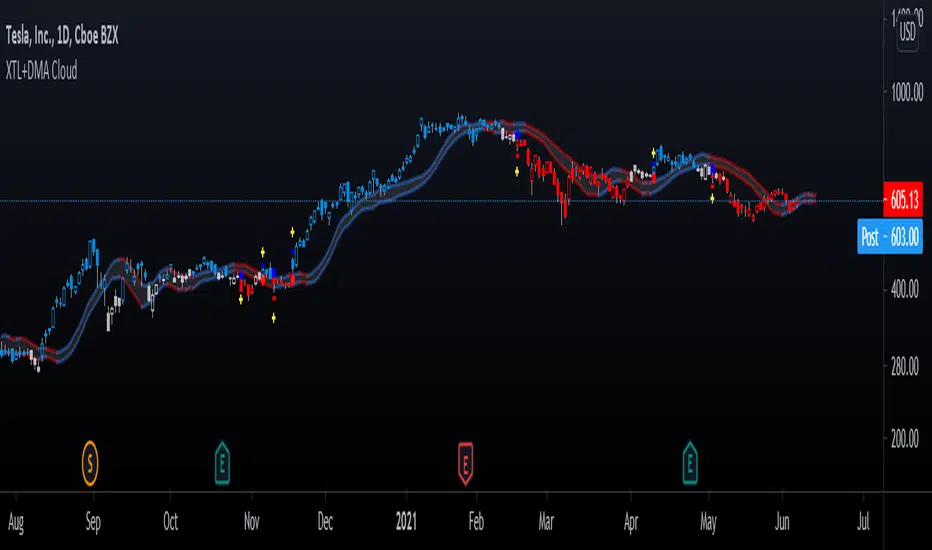
Advanced GET: Tom Joseph's XTL, DMA Cloud & Breakout SignalsThe Expert Trend Locator ( XTL ) was developed by Tom Joseph to identify major trends, similar to elliott wave 3 type swings.
Blue bars are bullish and indicate a potential upwards impulse.
Red bars are bearish and indicate a potential downwards impulse.
White bars indicate no trend is detected at the moment.
Added to the indicator is the recommended use to enter a position, as explained by Tom Joseph in his book Applying Technical Analysis:
Once a blue or red bar appears, the indicator signals an entry level, a stop loss level and two target levels (2nd is optional).
The levels can be shown until a new signal emerges or just above/below the breakout bar.
Finally, a cloud formed by two displaced moving averages (DMA) is included, which allow the trend to continue its momentum. During an uptrend the lower moving average could serve as a trailing stop, and during a downtrend the upper moving average could serve as the trailing stop.
Enjoy!
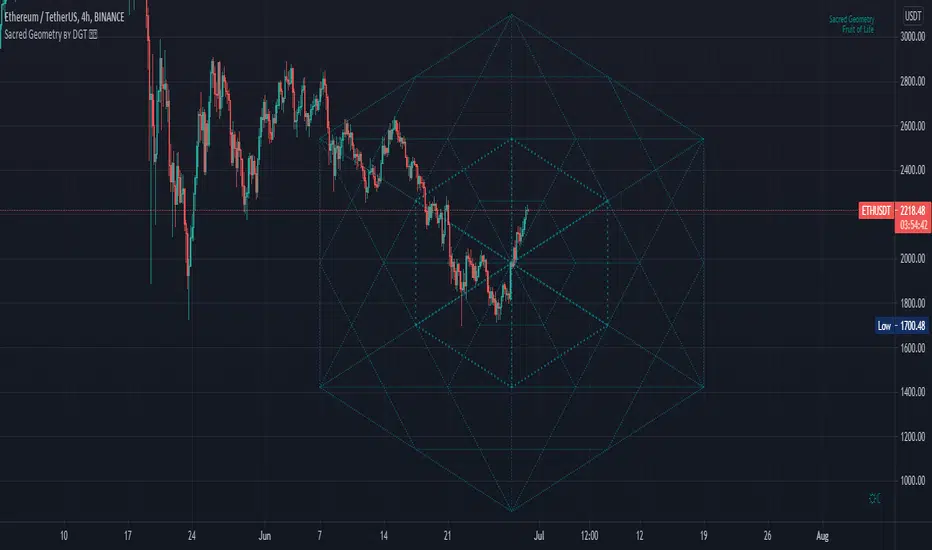
Sacred Geometry by DGTSacred geometry ascribes symbolic and sacred meanings to certain geometric shapes and certain geometric proportions. The study of sacred geometry has its roots in the study of nature, and the mathematical principles at work therein
In trading, using geometry for technical analysis is highly used concept, such as Gann Tools, Fibonacci Tools, Elliott Wave Theory are some examples that are based on the idea that the market is geometric and cyclical in nature
Thanks to @AtomOfScent's "almost like sacred geometry" comment to FibFans on Previous HTF HL
study give me the idea to go further and to demonstrate just how far we can go with this style of analysis. And here comes an experimental attempt to present some of sacred geometric shapes such as Seed of Life, Fruit of Life and Spiral, where the resulting image may help technical analysts to predict price changes.
Fruit of Life, example and how it is derived (maximum line limitation does not allow to draw all circles, so red circles are drawn manually to present the idea). Fruit of Life is base for the Metatron’s Cube and we can create all five Platonic Solids from it (Hexahedron, Tetrahedron, Octahedron, Icosahedron and Dodecahedron)
Spiral Examples :
Again special thanks to @AtomOfScent for commenting on the draft version of the study as well as providing valuable suggestions.
Disclaimer :
Trading success is all about following your trading strategy and the indicators should fit within your trading strategy, and not to be traded upon solely
The script is for informational and educational purposes only. Use of the script does not constitute professional and/or financial advice. You alone have the sole responsibility of evaluating the script output and risks associated with the use of the script. In exchange for using the script, you agree not to hold dgtrd TradingView user liable for any possible claim for damages arising from any decision you make based on use of the script
Ichimoku Kinkō HyōThe Ichimoku Kinko Hyo is an trading system developed by the late Goichi Hosoda (pen name "Ichimokusanjin") when he was the general manager of the business conditions department of Miyako Shinbun, the predecessor of the Tokyo Shimbun. Currently, it is a registered trademark of Economic Fluctuation Research Institute Co., Ltd., which is run by the bereaved family of Hosoda as a private research institute.
The Ichimoku Kinko Hyo is composed of time theory, price range theory (target price theory) and wave movement theory. Ichimoku means "At One Glace". The equilibrium table is famous for its span, but the first in the equilibrium table is the time relationship.
In the theory of time, the change date is the day after the number of periods classified into the basic numerical value such as 9, 17, 26, etc., the equal numerical value that takes the number of periods of the past wave motion, and the habit numerical value that appears for each issue is there. The market is based on the idea that the buying and selling equilibrium will move in the wrong direction. Another feature is that time is emphasized in order to estimate when changes will occur.
In the price range theory, there are E・V・N・NT calculated values and multiple values of 4 to 8E as target values. In addition, in order to determine the momentum and direction of the market, we will consider other price ranges and ying and yang numbers.
If the calculated value is realized on the change date calculated by each numerical value, the market price is likely to reverse.
転換線 (Tenkansen) (Conversion Line) = (highest price in the past 9 periods + lowest price) ÷ 2
基準線 (Kijunsen) (Base Line) = (highest price in the past 26 periods + lowest price) ÷ 2
It represents Support/Resistance for 16 bars. It is a 50% Fibonacci Retracement. The Kijun sen is knows as the "container" of the trend. It is prefect to use as an initial stop and/or trailing stop.
先行スパン1 (Senkou span 1) (Lagging Span 1) = {(conversion value + reference value) ÷ 2} 25 periods ahead (26 periods ahead including the current day, that is)
先行スパン2 (Senkou span 2) (Lagging Span 2) = {(highest price in the past 52 periods + lowest price) ÷ 2} 25 periods ahead (26 periods ahead including the current day, that is)
遅行スパン (Chikou span) (Lagging Span) = (current candle closing price) plotted 26 periods before (that is, including the current day) 25 periods ago
It is the only Ichimoku indicator that uses the closing price. It is used for momentum of the trend.
The area surrounded by the two lagging span lines is called a cloud. This is the foundation of the system. It determines the sentiment (Bull/Bear) for the insrument. If price is above the cloud, the instrument is bullish. If price is below the cloud, the instrument is bearish.
-
The wave theory of the Ichimoku Kinko Hyo has the following waves.
All about the rising market. If it is the falling market, the opposite is true.
I wave rise one market price.
V wave the market price that raises and lowers.
N wave the market price for raising, lowering, and raising.
P wave the high price depreciates and the low price rises with the passage of time. Leave either.
Y wave the high price rises and the low price falls with the passage of time. Leave either.
S wave A market in which the lowered market rebounds and rises at the previous high level.
There are the above 6 types but the basis of the Ichimoku Kinko Hyo is the N wave of 3 waves.
In Elliott wave theory and similar theories, basically there are 5 waves but 5 waves are a series of 2 and 3 waves N, 3 for 7 waves, 4 for 9 waves and so on.
Even if it keep continuing, it will be based on N wave. In addition, since the P wave and the Y wave are separated from each other, they can be seen as N waves from a large perspective.
-
There are basic E・V・N・NT calculated values and several other calculation methods for the Ichimoku Kinko Hyo. It is the only calculated value that gives a concrete value in the Ichimoku Kinko Hyo, which is difficult to understand, but since we focus only on the price difference and do not consider the supply and demand, it is forbidden to stick to the calculated value alone.
(The calculation method of the following five calculated values is based on the rising market price, which is raised from the low price A to the high price B and lowered from the high price B to the low price C. Therefore, the low price C is higher than the low price A)
E calculated value The amount of increase from the low price A to the high price B is added to the high price B. = B + (BA)
V calculated value Adds the amount of decline from the high price B to the low price C to the high price B. = B + (BC)
N calculated value The amount of increase from the low price A to the high price B is added to the low price C. = C + (BA)
NT calculated value Adds the amount of increase from the low price A to the low price C to the low price C. = C + (CA)
4E calculated value (four-layer double / quadruple value) Adds three times the amount of increase from the low price A to the high price B to the high price B. = B + 3 × (BA)
Calculated value of P wave The upper price is devalued and the lower price is rounded up, and the price range of both is the same.
Calculated value of Y wave The upper price is rounded up and the lower price is rounded down, and the price range of both is the same.

TTT_Swing_and_Orderblock_Ver_1.0.2Hello, dear traders from all over the world! This is Tommy from Tommy Trading Team.
Many inquires were delivered to us from traders recently wishing to use one of our cutting-edge technologies that was developed days ago and was only used by us. We have edited and supplemented this indicator both logically and visually. Accordingly, our team is officially launching with a new brought up name, which is “SOB(Version1.0.2), shorten for “Swing & OB(Orderblock).”
This technical indicator is quite straightforward and effective to utilize since it shows traders the essential variables that are considered by many recently developed theories and state-of-the-art methodologies. And they are ‘Dow’ and ‘Orderblock’.
Swing High and Low (Dow Theory) has been applied fundamentally by many other theories and methodologies such as Elliott wave theory and SR Flip techniques. A swing can be interpreted as a wave with a trend composed of a high and a low each. After succeeding on making significant highs/lows, in any existing wave theories, it is essential to monitor and spot when the next waves make HH(Higher high), LH(Lower high), HL(Higher low), or LL(Lower low).
OB(Orderblock) technique is a very advanced methodology that captures the contraction, consolidation, and attraction zone. This so called ‘zone’ is interpreted differently by various stakeholders, such as institutional(whales) average entry/exit price range or peak price range with higher traded volumes. In TA perspective, it’s just a major support/resistance to consider and when this zone fails to support/resist, the price momentum tends to boost up towards the direction it failed. To give you a little tip, look for the spots usually forming horizontal parallel channel, before a big wave with a clear trend (whether up or down) appears. There are numerous ways to identify OB and we have concluded that signaling the double engulfing candles is one of the highly effective one.
As just mentioned, comprehending a trend utilizing ‘Swing HL’ is fundamental and yet definite TA concept and strategy. Furthermore, OB can also be useful to spot major support and resistance area. SOB automatically identify and captures major Highs, Lows, and OBs. In addition, SOB can let traders know when the highs and lows are being replaced by higher/lower highs/lows by changing pivots color. If you are familiar with SR(Support and Resistance) Flip concept, this can be a helpful tool for you since it can signal when highs/lows are being broken above/below and by planning a retest entry trading setup.
If you would like to try SOB_ver1.0.2, please let us know through comments, DM, or Telegram in English/Korean. I assure you that our SOB won’t disappoint you on your trading chart.
Thank you.
안녕하세요. 트레이더 여러분!
토미 트레이딩 팀입니다~
최근에 저희 팀이 개인적으로 사용했던 지표에 관해서 많은 분들이 문의를 주셨습니다. 약간의 보안 및 개선 작업 이후에 SOB(Version1.0.2)이라는 이름으로 정식 출시합니다.
해당 알고리즘은 기존의 여러 이론 및 방법론들에게 원천적으로 기반이 되는 다우이론(스윙 고/저점)과 오더블럭(OB)을 바로바로 잡아주기 때문에 주요 고/저점과 매물대 지지/저항 컨펌하는 용도로 활용하기 매우 유용합니다.
변동하는 가격의 흐름, 즉 추세를 파악하는 방법은 수만가지가 있습니다. 단 하나의 방법, 지표, 혹은 이론만 가지고 추세를 파악하는 건 당연히 바보 같은 짓이겠죠. 여러가지의 요소들을 복합적으로 봐야하는데 그 중에 가장 근본적이면서 중요한 게 바로 다우이론이라고 생각합니다. 이름만 거창하지 정말 별거 없습니다. 한문장으로 “전 고/저점에 비해서 이번에 나오는 고/저점이 높아졌냐 낮아졌냐”입니다. 다우 이론은 엘리엇 파동 이론 및 SR Flip 전략 등 대부분들의 기법들에 적용된 만큼 차트 보시려면 꼭 알아야 되는 개념입니다. 스윙이란 변곡이 나오기 전까지의 가격 흐름, 즉 하나의 파동이라고 생각하시면 되겠습니다. 주요 고/저점은 통상적으로 하나의 파동을 규명하기 위해 참고하는 기준들입니다. 고/저점 혹은 변곡점이 출현하고 나서 후행적으로 우리는 전 상승/하락 파동이었다고 인지를 합니다. 여기서 중요한 건 다음 파동이 전 파동보다 고/저점을 높였냐/낮추었냐입니다. 고/저점을 높여가는 파동이 나오면 상승, 낮추어가는 파동이 나오면 하락 추세에 가중을 더 두고, 고/저점을 높이다가 내리기 시작하면 혹은 내리다가 높이기 시작하면 추세가 어느정도 전환될 수 있는 시그널로 해석할 수 있습니다.
OB(오더블럭) 기법은 요즘 장에 그나마 잘 먹히는 가격매물대를 찾는 방법론 중 하나입니다. 매물대란 다양한 시장참여자들에 따라 시시각각 해석될 수 있습니다. 기관(세력)들의 매집구간, 많은 참여자들의 평균 진입/청산/평단 가격 범위, 혹은 시체 쌓인 구간으로도 해석해볼 수 있습니다. 더 쉽게 설명해드리자면 거래량이 상대적으로 많은 가격 범위대라고 보시면 되겠습니다. 기술적분석 관점에서는 매물대를 주요 지지/저항구간대라고 고려하실 수 있으며 지지/저항을 실패하면, 그 실패한 방향으로 추세가 터질 가능성을 두고 전략 설계에 활용합니다. 매물대를 효과적으로 찾을 수 있는 팁 하나를 드리자면, 어느정도 명확하고 큰 추세가 나오기 전에 형성된 수평 평행 채널들을 먼저 의심해보세요. 만약에 해당 가격범위 내에 OB가 많이 내포되어 있다면 신빙성을 더 부여하실 수 있습니다. 이렇게 OB는 매물대를 식별하고 컨펌하는 용도로 매우 용이하게 활용될 수 있으며, 요즘에 유행하는 기법인 마스터패턴에도 찰떡궁합입니다. OB를 정의하는 여러가지 기법들 중 캔들봉을 활용한 방법이 그나마 가장 효과적이며 저희 개발팀은 장악형(Engulfing) 패턴이 두번 이상 출현하는 캔들봉들의 몸통들을 기준으로 OB를 찾는 로직을 지표화했습니다.
언급 드렸듯, 다우이론은 기술적 분석 기법 중 가장 근본적이면서도 동시에 실용도가 높아 차트 보시려면 무조건 숙지해야하는 개념 및 전략입니다. 또한 상대적으로 최근 시장에 효율적인 매물대 색출 전략 중 하나인 OB기법으로 주요 지지/저항으로 해석될 수 있는 메이저 매물대들의 가격 범위를 더 세분화시킬 수 있습니다. 저희 SOB 지표는 주요 고점, 저점, 그리고 OB들을 자동으로 피봇으로 잡아줄뿐더러 주요 고/저점이 뚫렸을 때, 해당 피봇의 색깔들이 변경됩니다. SR Flip (저항선이 뚫리면 지지선, 지지선이 뚫리면 저항선)개념 및 전략을 자주 활용하시는 트레이더분들은 고/저점 뚫릴 때, 즉 더 높은/낮은 고/저점이 출현하고 나서 전 고/저점을 활용해 리테스트 진입 자리 찾으실 때 유용하게 사용하실 수 있습니다.
저희 SOB_Version1.0.2 지표를 사용하고 싶으신 분들은 댓글, DM, 또는 저희 개인 채널에 문의 주십시오. 차트와 캔들 위에서만큼은 우리 SOB이 여러분들을 실망시키지 않을 것입니다.
감사합니다. 성투하세요.

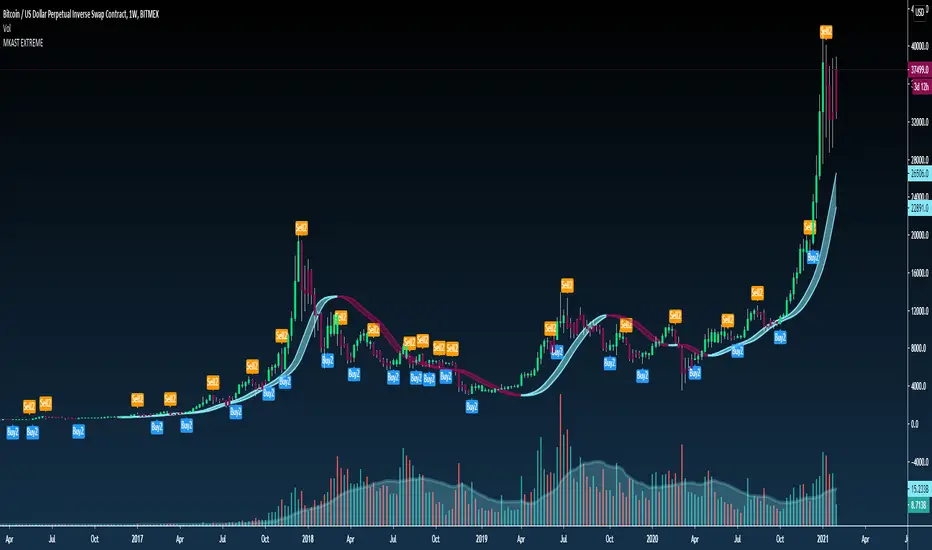
MyAlgo EXTREMEPLEASE READ THE ENTIRE POST BEFORE PURCHASING & USING THE MyAlgo Tool. Saves you and me some time in emails and messages. :)
This is the official version of MyAlgo EXTREME
PLEASE UNDERSTAND THAT THIS IS A DIFFERENT AND SEPARATE PRODUCT AND SCRIPT FROM "MyAlgo SLIM" FROM THE MyAlgo TRADING TOOL SERIES
Description
Buy & Sell Alerts can be set on all Tickers. This includes, but is not limited to Crypto, Commodities , FOREX, Equities and Indices. Also all candle Types are compatible.
Recommended Time-frames - Due to the complexity of MyAlgo-SLIM the user has a choice between three algorithms and is like that able to trade on all timeframes with the highest returns.
MyAlgo combines many different aspects at the same time, scans multiple other Algorithms and comes to a conclusion based on over 1350 lines of code.
It is based on Divergences, Elliott Waves , Ichimoku , MACD , MACD Histogram, RSI , Stoch , CCI , Momentum, OBV, DIOSC, VWMACD, CMF and multiple EMAs.
Every single aspect is weighted into the decision before giving out an indication.
Most buy/sell Algorithms FAIL because they try to apply the same strategy to every single chart, which
are as individual as humans. To conquer this problem, MyAlgo has a wide range of settings and variables which can be easily
modified.
To make it a true strategy, MyAlgo has as well settings for Take Profit Points and Stop
Losses. Everything with an Alert Feature of course so that FULL AUTOMATION IS POSSIBLE.
I know from experience that many people take one Algorithm and are simply too LAZY to add multiple Algorithms to make a rational choice. The result of that is that they lose money, by following blatantly only one Algorithm.
MyAlgo has additional 15 Indicators, perfect for all markets, which can be turned on and off individually.
Side Notes
MyAlgo is being updated and upgraded very frequently to suit the requests of our customers.
This is not financial advice. Please read our disclaimer before using it.
Please refer to the signature field if you are interested in gaining access to this script.
Anything below this sentence will be Updates regarding MyAlgo
MTP Wave Price TargetsThe MTP Wave Price Targets script allows you to project “in advance” WPT (Wave Price Target) zones on your chart, these anticipate where the next Elliott Wave swing is likely to end. WPT zones are calculated using clusters of Fibonacci Price levels that are specific to the Wave in question.
This is designed to be used with the users own “manual” Elliot Wave count. The user can use the MTP Pivots (that are included in the MTP Analysis Script) as a guide to see the swings to choose on the Chart. The user has several options (Pivot Number, Last Pivot, Pivots Back or Bar Number) on how to choose the Pivot to display the WPT Targets from.
There is a risk in Trading and Investing. Losses can and will unfold.
The script is available as an “invite-only” script, as part of the MTPredictor suite of tools on Trading View.
To obtain access, please go to the web page in our signature that appears below.

Volume Contraction and ExpansionA simple indicator that shows volume expansion and contraction of a trend through colorization of the candles. It indicates the underlying volume support of a trend. This indicator might come in handy for any Elliott Wave analyst trying to incorporate volume into his analysis.

Buy and Sell PERFECT ENTRY V2"Buy and Sell PERFECT ENTRY V2" Product Description:
The indicator quickly identifies market trends with visual buy/sell alerts on the chart.
The "Buy and Sell Perfect Entry" Indicator combines various exponential moving averages and RSI in order to deliver an early entry to a buy or sell trend. The indicator also has red and green areas for overbought (red) and oversold (green) in order to identify better the entry. The different color range of the candles make you also visualize better the trend. The dark red candles, for example, can announce an early reversal bullish signal.
The indicator has swing lines for better understanding of the trends so you can easily draw Elliott waves on the chart.
The LL means Lower Low and HH means Higher High.
The indicator is useful on any timeframe available on TradingView, even for 5 minute scalping. I like best the 5,6 and 7 hours timeframes, but also 2 or 3 days charts!
The indicator can be used for every type of market: indices, stocks, cryptocurrencies, currencies and others.
This study is not a guarantee profit. You should backtest or trade virtual money before using this study on your real portfolio, as it is intended to be a tool and not a fortune teller.
Disclaimer: Trading and investing in the stock market and cryptocurrencies involves substantial risk of loss and is not suitable for every investor. The content covered in this videos is NOT to be considered as investment advice. I’m NOT a financial adviser. All trading strategies are used at your own risk.
Please send me a private message on TradingView to gain access to the script.

ApexBull Momentum OscillatorOfficial ApexBull Momentum Oscillator
Description:
An oscillator that gauges long term momentum to keep you in the trades. It utilizes moving averages and other momentum gauging indicators and price action to ensure that you stay in your trades.
Elliott Wavers found this to be extremely useful to identify waves. This oscillator will not only help you identify waves better as it will highly accurately predict when it begins and ends but will simply keep you in trades so you dont take profits too soon. Can be used to gauge waves on any time frame and works best in combination with our ApexBull Trend Trading Indicator (Conservative and Aggressive versions).
If you would like to try out my indicator please send me a direct message here.

MACD for WA1) I updated MACD formula to work with the Elliott Wave Principle
2) I changed the standard parameters and indicator’s display type as default for use in Wave Analysis
1) Актуализировал формулу MACD для работы по Волновому Принципу Эллиотта
2) Изменил по умолчанию стандартные параметры и вид отображения индикатора для использования в Волновом Анализе

Stoch X, an Indicator of Indicators by DGTStochastic refers to a randomly determined process and financial markets use stochastic models to represent the seemingly random behaviour of assets and then used by quantitative analysts to value options on asset prices
The stochastic oscillator, developed by George Lane, presents the location of the closing price of a stock in relation to the high and low range of the price of a stock over a period of time. Lane has said that the stochastic oscillator does not follow price or volume or anything similar. He indicates that the oscillator follows the speed or momentum of price.
Traditionally, readings over 80 are considered in the overbought range, and readings under 20 are considered oversold. Please note that, very strong trends can maintain overbought or oversold conditions for an extended period and traders should look to changes in the stochastic oscillator for clues about future trend shifts. It is advised to check the higher timeframe of your trading timeframe and see where you are in the “big picture”
Signal crosses , intersection of stochastic and its signal line is considered to be a signal that a reversal may be in the works
Divergence between the stochastic oscillator and trending price action is also seen as an important reversal signal
Lane also reveals in interviews that, as a rule, the momentum or speed of the price of a stock changes before the price changes itself . In this way, the stochastic oscillator can be used to foreshadow reversals when the indicator reveals bullish or bearish divergences. This signal is the first, and arguably the most important, trading signal Lane identified.
What is Stochastic X ?
Stochastic X , is essentially an indicator of an indicator, providing stochastic calculation to some of well known indicators, such as RSI, MFI, OBV, etc. This means that it is a measure of selected specific indicator relative to its own high/low range over a user defined period of time.
Features of Stoch X
1- Displays Stoch of and indicator plus a companion indicator (companion display can be disabled from user dialog box)
Available options
Stoch Source plus PM A, where Source is close price and PMA refers to Price Distance to its Moving Average (for further details you may check my study of Price Distance to its MA by DGT, and different application of distance concept available with “MACD-X, More Than MACD" And “P-MACD”)
Stoch RSI plus RSI , Stoch RSI, developed by Tushar Chande and Stanley Kroll, is a build-in indicator available on Trading View, where Stoch X adds RSI as a companion indicator to Stoch RSI
Stoch MFI and MFI , where MFI is Money Flow Index, measures buying and selling pressure through analyzing both price and volume
Stoch OBV + VO , Where OBV is On Balance Volume, is a momentum indicator that measures positive and negative volume flow. VO stands for Volume Oscillator which aims to confirm a market turnaround or trend reversal
Stoch EWO + EWO , EWO stands for Elliott Wave Oscillator
By default the threshold levels are indicated and are displayed differently for the regular Stoch or Stoch RSI. Overbought band (70-80), oversold band (20-30) and middle line (0) are emphasized
Warning : Centered Oscillators base line is moved from 0 to 50 to better suit with Stoch X, which is applied to PMA, VO and EWO
2- Can be plotted along with Stoch in the same window using the same scaling
To avoid misinterpreting the area between Stoch X and its Signal Line is highlighted automatically in case Stoch is selected to be plotted
3- Squeeze Indicator added as Add-on in the bottom of the Stoch X
During volatile market conditions the stochastic oscillator has been known to produce false signals. One way to help with this is to take the price trend as a filter, or basic chart pattern analysis can help to identify major, underlying trends and increase the Stoch X's accuracy.
This study implements Squeeze Indicator to help and add additional insight for filtering false signals. Blue diamond shapes indicates the squeeze release, that is volatility increased and according to momentum direction the buy/sell possibility can be considered. Orange ones displays consolidation periods, that is low volatility and the market is assumed to be in squeeze and no trade is recommended. in this phase.
Disclaimer: Trading success is all about following your trading strategy and the indicators should fit within your trading strategy, and not to be traded upon solely
The script is for informational and educational purposes only. Use of the script does not constitutes professional and/or financial advice. You alone the sole responsibility of evaluating the script output and risks associated with the use of the script. In exchange for using the script, you agree not to hold dgtrd TradingView user liable for any possible claim for damages arising from any decision you make based on use of the script

NCTA Adaptive Entry SystemAdaptive Entry System (AES)
Price action of stocks, indexes, and futures consists of periods of trending action, retracements within the trend and then a resumption of the original trend. Trending patterns do not move straight up or straight down. They move in cycles which, when properly identified, can offer traders an opportunity to “follow the trend” while also recognizing the probability of a near term retracement before resuming movement in the direction of the trend. Experienced traders with advanced skills at interpreting wave patterns (Elliott Wave), Fibonacci retracements, Stochastics (overbought / oversold conditions), Momentum, and Moving Averages apply their advanced knowledge to trading and identifying these trend - retracement - continuation of trend cycles. These skills require an advanced knowledge of these complex indicators and can be difficult for traders without the same skill set to optimize their trading performance.
The Adaptive Entry System (AES) was created as a technical market metrics system to interpret a variety of advanced signals and present to the trader a “single actionable signal” displayed in an easy to recognize format for traders of most any skill level to benefit from.
AES is a “system” as opposed to a single indicator. It was designed with the goal of simplifying a traders ability to recognize an entry opportunity by summarizing the consensus of several key indicators and displaying a single entry / exit signal in a color highlighted, strategy labeled format. The work of comparing a variety of indicators and assessing the strength of alignment is performed for the trader by the Adaptive Entry System.
There are three possible entry signals displayed. A trader may trade all three or customize the settings to choose just a single signal to trade. It is important for any trader incorporating AES into their toolset that they trade in sim / virtual mode for a period of time to confirm they understand how price action responds to the signals and to personally track the performance of each. A good trading system still requires due diligence on the part of the trader to confirm understanding of how the system performs.
Entry Signal #1 Description:
Trend Bias Plus Signal is intended to provide traders with an early view of the probable directional bias of the stock, index, or futures being traded. Trend Bias was designed to recognize the probability of the early stages of the strongest segment of a wave pattern. Recognizing the probable bias of the trend at an early stage and also having an indication of when that trend may be ending offers traders an opportunity to enhance their ability to optimally benefit from the trend.
How to Read the Trend Bias Plus Signal:
The Trend Bias Plus Signal is displayed as a simple to recognize color coding of the price bars. Blue price bars indicate a probable rising price bias. Red price bars indicate a probable declining price bias. White bars indicate a neutral period with no clear directional bias.
How to Trade the Trend Bias Plus Signal:
The Trend Bias Plus Signal is simple to interpret. When a price bar closes blue and the next price bar opens blue, this signals to the trader to open an upward bias position. Buy-to-open a call option, buy the stock, or open a long futures position. When a price bar closes red and the next price bar opens red, this signals to the trader to open a downward bias position. Buy-to-open a put option, short the stock or close a long stock position, or open a short futures position.
When holding a short or long position based on the Trend Bias Plus, there are a variety of exit methods which a trader can use including stops, limit price orders with fixed profit targets, or trail stops. Regardless, the end of a Trend Bias Plus cycle is indicated when a new price bar opens white. This is evidence that the current rising or declining trend is shifting to a neutral state. A trend may also be viewed as having ended when an opposite color bar prints at the open of a new price bar.
Entry Signal #2 Description:
The Momentum Signal is a near term indication of a probable retracement of the current trend. It identifies a temporary reversal of an overarching trend in a stock's price. Retracements are short-term periods of movement against a trend, followed by a return to the previous trend. Momentum signals are usually counter-trend trades identifying that part of the wave sequence where price temporarily moves opposite the direction of the trend. The momentum signal can be an opportunity for traders to take advantage of the natural pattern of trend - retracements - continuation.
How to Read the Momentum Signal:
The Momentum signal is displayed as a vertical color highlight on the price bar with a “M” label inside a directional indicator box. A red vertical highlight with an arrow box and “M” label pointing lower is a signal that the near term price movement may be downward bias. For an upward bias price movement signal, the Momentum indicator will display a green highlight across the price bar with an arrow box and “M” label pointing higher.
How to Trade the Momentum Signal:
When the highlighted directional labeled box prints at the open of a new price bar, take the trade based on the directional bias displayed. Momentum signals are generally counter trend indicators so a downward bias red bar, prompting the trader to go short may print on a long bias blue Trend Bias Plus price bar. This should not be viewed as a conflict but instead as a probable indication of a short term retracement following the natural sequence of cycles in price movement.
Momentum signals may be traded using stocks, options, or futures.
Entry Signal #3 Description:
The Consensus Signal is an indication that price action may be resuming in the direction of the primary trend.
How to Read the Consensus Signal:
The Consensus Signal is displayed as a vertical color highlight on the price bar with a “C” label inside a directional indicator box. A red vertical highlight and an arrow box with a “C” label pointing lower is a signal that the price movement may be resuming a downward bias trend or strengthening a conviction to the current trend. For an upward bias price movement signal, the Consensus indicator will display a green highlight across the price bar and an arrow box with a “C” label pointing higher. This is a signal that the retracement off of the trend may be concluding and/or a strengthening of a conviction to the current trend.
How to Trade the Consensus Signal:
When the highlighted directional labeled box prints at the open of a new price bar, take the trade based on the directional bias displayed. Consensus signals are generally most productive when traded aligned with the trend, as displayed by the Trend Bias Plus price bar color or when a white bar indicates a neutral state of the price trend. Counter trend trades using the Consensus Signal are not advised and considered to be less productive / higher risk.
Consensus signals may be traded using stocks, options, or futures.
Some General Rules:
Trade signals are only considered valid when they display at the open of a new price bar.
The signals can be traded on different timeframe charts from short term 3 minute charts to longer timeframe daily charts.
The signals are designed to be a generic indication of probable price movement and as such, can be used effectively for trading futures, stocks, options on stocks, options on ETFs, and options on cash settled indexes.
AES offers traders an opportunity to optimize performance from the natural cycles of the market….trend - retracement - continuation.
AES offers an opportunity for traders to have a clear entry / exit criteria. However, it is still imperative that each trader understands the trading strategy they intend to use and the risks and opportunities associated with that strategy. It is highly advised, regardless of the system or strategies being used, that a trader validates their understanding of the system/strategy by trading in a simulated, paper account format to self test the system and personal ability to trade it successfully.
Next Bar Alert:
Included is an optional "Next Bar Alert" setting. Since many of these signals benefit from very prompt action at the beginning of a price bar, there is an additional option in Settings to set an arbitrary number of seconds to be alerted before the next price bar opens. Simply set this to a level you prefer, then set an alert in TradingView on the indicator using the "Next Bar Alert" alert parameter.
Summary:
The color highlight indicator allows the trader to be 100% certain that the rules/criteria for confirming a valid entry were met at the open of the price bar. This feature, along with the alert settings in Trading View, provide clear confirmation of the timing and print of the signal as either valid or not.
Adaptive Entry System has been designed to help traders of all skill levels to trade the natural sequence of patterns in price action using a simple to recognize, single signal entry/exit format. The natural cycle of trend (Trend Bias Plus), then retracement (Momentum), followed by a continuation of the original trend (Consensus) can be identified within this system and offers traders a simple signal to take advantage of each phase in the cycle. Stock investors, options traders, and futures traders can benefit from the simple design of the AES on a variety of time frames.
Trend Bias Plus signals on NASDAQ:TSLA Daily chart:
Trend Bias Plus signals on NASDAQ:AMZN Daily chart:
