Donchian Channel Alerts R1 by JustUncleLThis idea is based on the Donchain Channel centre line Price action. When price moves from the highest/lowest point, the price will move to the center line first. At this point, the center line acts as dynamic support/resistance and often price will bounce back up. However, if price successfully breaks the centre line (primary entry condition), then prices will tend to catch up to the bottom channel line, many times making further moves in that direction (secondary entry condition).
This script alert idea is designed to be used with Renko (10pip brick recommended) Renko or Heikin Ashi (1 hour recommended) charts. It combines the Donchian Channel centre line price action with a directional coloured EMA (default length 8) to provide entry and exit signals.
There are three options to exit trade:
MA Cross (default exit) = exit occur when price breaks EMA in opposite direction.
Centre Cross = exit occurs when price breaks back passed the centre line in opposite direction.
Brick Colour = exit when a brick/bar paints in the opposite colour to trade direction.
Each Entry and Exit signal creates an Alertcondition that can be picked up by the TradingView Alarm system.
TIPS:
This type of Trading technique only works well in a trending market. Do not try to trade this technique in a ranging/flat market, wait for market to return to trend or pick another pair.
To get 10pip Bricks set Renko to "Traditional" type bricks and 0.001 for non-JPY currency pairs and 0.1 for JPY currency pairs. Also set chart Time frame to 5min or 15mins.
Renko chart:
Pesquisar nos scripts por "donchian"

Curved Price Channels (Zeiierman)█ Overview
The Curved Price Channels (Zeiierman) is designed to plot dynamic channels around price movements, much like the traditional Donchian Channels, but with a key difference: the channels are curved instead of straight. This curvature allows the channels to adapt more fluidly to price action, providing a smoother representation of the highest high and lowest low levels.
Just like Donchian Channels, the Curved Price Channels help identify potential breakout points and areas of trend reversal. However, the curvature offers a more refined approach to visualizing price boundaries, making it potentially more effective in capturing price trends and reversals in markets that exhibit significant volatility or price swings.
The included trend strength calculation further enhances the indicator by offering insight into the strength of the current trend.
█ How It Works
The Curved Price Channels are calculated based on the asset's average true range (ATR), scaled by the chosen length and multiplier settings. This adaptive size allows the channels to expand and contract based on recent market volatility. The central trendline is calculated as the average of the upper and lower curved bands, providing a smoothed representation of the overall price trend.
Key Calculations:
Adaptive Size: The ATR is used to dynamically adjust the width of the channels, making them responsive to changes in market volatility.
Upper and Lower Bands: The upper band is calculated by taking the maximum close value and adjusting it downward by a factor proportional to the ATR and the multiplier. Similarly, the lower band is calculated by adjusting the minimum close value upward.
Trendline: The trendline is the average of the upper and lower bands, representing the central tendency of the price action.
Trend Strength
The Trend Strength feature in the Curved Price Channels is a powerful feature designed to help traders gauge the strength of the current trend. It calculates the strength of a trend by analyzing the relationship between the price's position within the curved channels and the overall range of the channels themselves.
Range Calculation:
The indicator first determines the distance between the upper and lower curved channels, known as the range. This range represents the overall volatility of the price within the given period.
Range = Upper Band - Lower Band
Relative Position:
The next step involves calculating the relative position of the closing price within this range. This value indicates where the current price sits in relation to the overall range.
RelativePosition = (Close - Trendline) / Range
Normalization:
To assess the trend strength over time, the current range is normalized against the maximum and minimum ranges observed over a specified look-back period.
NormalizedRange = (Range - Min Range) / (Max Range - Min Range)
Trend Strength Calculation:
The final Trend Strength is calculated by multiplying the relative position by the normalized range and then scaling it to a percentage.
TrendStrength = Relative Position * Normalized Range * 100
This approach ensures that the Trend Strength not only reflects the direction of the trend but also its intensity, providing a more comprehensive view of market conditions.
█ Comparison with Donchian Channels
Curved Price Channels offer several advantages over Donchian Channels, particularly in their ability to adapt to changing market conditions.
⚪ Adaptability vs. Fixed Structure
Donchian Channels: Use a fixed period to plot straight lines based on the highest high and lowest low. This can be limiting because the channels do not adjust to volatility; they remain the same width regardless of how much or how little the price is moving.
Curved Price Channels: Adapt dynamically to market conditions using the Average True Range (ATR) as a measure of volatility. The channels expand and contract based on recent price movements, providing a more accurate reflection of the market's current state. This adaptability allows traders to capture both large trends and smaller fluctuations more effectively.
⚪ Sensitivity to Market Movements
Donchian Channels: Are less sensitive to recent price action because they rely on a fixed look-back period. This can result in late signals during fast-moving markets, as the channels may not adjust quickly enough to capture new trends.
Curved Price Channels: Respond more quickly to changes in market volatility, making them more sensitive to recent price action. The multiplier setting further allows traders to adjust the channel's sensitivity, making it possible to capture smaller price movements during periods of low volatility or filter out noise during high volatility.
⚪ Enhanced Trend Strength Analysis
Donchian Channels: Do not provide direct insight into the strength of a trend. Traders must rely on additional indicators or their judgment to gauge whether a trend is strong or weak.
Curved Price Channels: Includes a built-in trend strength calculation that takes into account the distance between the upper and lower channels relative to the trendline. A broader range between the channels typically indicates a stronger trend, while a narrower range suggests a weaker trend. This feature helps traders not only identify the direction of the trend but also assess its potential longevity and strength.
⚪ Dynamic Support and Resistance
Donchian Channels: Offer static support and resistance levels that may not accurately reflect changing market dynamics. These levels can quickly become outdated in volatile markets.
Curved Price Channels: Offer dynamic support and resistance levels that adjust in real-time, providing more relevant and actionable trading signals. As the channels curve to reflect price movements, they can help identify areas where the price is likely to encounter support or resistance, making them more useful in volatile or trending markets.
█ How to Use
Traders can use the Curved Price Channels in similar ways to Donchian Channels but with the added benefits of the adaptive, curved structure:
Breakout Identification:
Just like Donchian Channels, when the price breaks above the upper curved band, it may signal the start of a bullish trend, while a break below the lower curved band could indicate a bearish trend. The curved nature of the channels helps in capturing these breakouts more precisely by adjusting to recent volatility.
Volatility:
The width of the price channels in the Curved Price Channels indicator serves as a clear indicator of current market volatility. A wider channel indicates that the market is experiencing higher volatility, as prices are fluctuating more dramatically within the period. Conversely, a narrower channel suggests that the market is in a lower volatility state, with price movements being more subdued.
Typically, higher volatility is observed during negative trends, where market uncertainty or fear drives larger price swings. In contrast, lower volatility is often associated with positive trends, where prices tend to move more steadily and predictably. The adaptive nature of the Curved Price Channels reflects these volatility conditions in real time, allowing traders to assess the market environment quickly and adjust their strategies accordingly.
Support and Resistance:
The trend line act as dynamic support and resistance levels. Due to it's adaptive nature, this level is more reflective of the current market environment than the fixed level of Donchian Channels.
Trend Direction and Strength:
The trend direction and strength are highlighted by the trendline and the directional candle within the Curved Price Channels indicator. If the price is above the trendline, it indicates a positive trend, while a price below the trendline signals a negative trend. This directional bias is visually represented by the color of the directional candle, making it easy for traders to quickly identify the current market trend.
In addition to the trendline, the indicator also displays Max and Min values. These represent the highest and lowest trend strength values within the lookback period, providing a reference point for understanding the current trend strength relative to historical levels.
Max Value: Indicates the highest recorded trend strength during the lookback period. If the Max value is greater than the Min value, it suggests that the market has generally experienced more positive (bullish) conditions during this time frame.
Min Value: Represents the lowest recorded trend strength within the same period. If the Min value is greater than the Max value, it indicates that the market has been predominantly negative (bearish) over the lookback period.
By assessing these Max and Min values, traders gain an immediate understanding of the underlying trend. If the current trend strength is close to the Max value, it indicates a strong bullish trend. Conversely, if the trend strength is near the Min value, it suggests a strong bearish trend.
█ Settings
Trend Length: Defines the number of bars used to calculate the core trendline and adaptive size. A length of 200 will create a smooth, long-term trendline that reacts slowly to price changes, while a length of 20 will create a more responsive trendline that tracks short-term movements.
Multiplier: Adjusts the width of the curved price channels. A higher value tightens the channels, making them more sensitive to price movements, while a lower value widens the channels. A multiplier of 10 will create tighter channels that are more sensitive to minor price fluctuations, which is useful in low-volatility markets. A multiplier of 2 will create wider channels that capture larger trends and are better suited for high-volatility markets.
Trend Strength Length: Defines the period over which the maximum and minimum ranges are calculated to normalize the trend strength. A length of 200 will smooth out the trend strength readings, providing a stable indication of trend health, whereas a length of 50 will make the readings more reactive to recent price changes.
-----------------
Disclaimer
The information contained in my Scripts/Indicators/Ideas/Algos/Systems does not constitute financial advice or a solicitation to buy or sell any securities of any type. I will not accept liability for any loss or damage, including without limitation any loss of profit, which may arise directly or indirectly from the use of or reliance on such information.
All investments involve risk, and the past performance of a security, industry, sector, market, financial product, trading strategy, backtest, or individual's trading does not guarantee future results or returns. Investors are fully responsible for any investment decisions they make. Such decisions should be based solely on an evaluation of their financial circumstances, investment objectives, risk tolerance, and liquidity needs.
My Scripts/Indicators/Ideas/Algos/Systems are only for educational purposes!

Market Cycle IndicatorThe Market Cycle Indicator is a tool that integrates the elements of RSI, Stochastic RSI, and Donchian Channels. It is designed to detect market cycles, enabling traders to enter and exit the market at the most opportune times.
This indicator provides a unique perspective on the market, combining multiple strategies into one unified and weighted approach. By factoring in the inputs from each of these popular technical analysis methods, it offers a more holistic view of the market trends and cycles.
Parameter Details:
Donchian Channels (DCO):
- donchianPeriod: Sets the period for the Donchian Channel calculation. Default is set to 14.
- donchianSmoothing: Sets the smoothing factor for the Donchian Channel calculation. Default is set to 3.
- donchianPrice: Selects the price type to be used in the Donchian Channel calculation. Default is set to the closing price.
Relative Strength Index (RSI):
- rsiPeriod: Sets the period for the RSI calculation. Default is set to 14.
- rsiSmoothing: Sets the smoothing factor for the RSI calculation. Default is set to 3.
- rsiPrice: Selects the price type to be used in the RSI calculation. Default is set to the closing price.
Stochastic RSI (StochRSI):
- srsiPeriod: Sets the period for the Stochastic RSI calculation. Default is set to 20.
- srsiSmoothing: Sets the smoothing factor for the Stochastic RSI calculation. Default is set to 3.
- srsiK: Sets the period for the %K line in the Stochastic RSI calculation. Default is set to 5.
- srsiD: Sets the period for the %D line in the Stochastic RSI calculation. Default is set to 5.
- srsiPrice: Selects the price type to be used in the Stochastic RSI calculation. Default is set to the closing price.
Weights:
- rsiWeight: Sets the weight for the RSI in the final aggregate calculation. Default is set to 1.
- srsiWeight: Sets the weight for the Stochastic RSI in the final aggregate calculation. Default is set to 1.
- dcoWeight: Sets the weight for the Donchian Channel in the final aggregate calculation. Default is set to 1.
Limits:
- limitHigh: Sets the upper limit for the indicator. Default is set to 80.
- limitLow: Sets the lower limit for the indicator. Default is set to 20.
By customizing these parameters, users can tweak the indicator to align with their own trading strategies and risk tolerance levels. Whether you're a novice or an experienced trader, the Comprehensive Market Cycle Indicator provides valuable insights into the market's behavior.
Uses library HelperTA

MyVolatilityBandsLibrary "MyVolatilityBands"
Just a lil' library of volatility bands that I use in some scripts
bollingerbands(src, lkbk, mult, basis)
Bollinger Bands
Parameters:
src (float) : float
lkbk (int) : int
mult (float) : float
basis (float)
Returns: Bollinger Bands
donchianchannels(src, lkbk, band_width)
Donchian Channels
Parameters:
src (float) : float
lkbk (int) : int
band_width (float) : float
Returns: Donchian Channels with an outer band of varying thickness adjusted by the band_width input
doublehalfdonchianchannels(src, lkbk, divisor)
Double Half Donchian Channels
Parameters:
src (float) : float
lkbk (int) : int
divisor (float) : float
Returns: two adjustable bases calculated using Donchian Channels calculation that act as a measure of volatility

VWAP Price ChannelVWAP Price Channel cuts the crust off of a traditional price channel (Donchian Channel) by anchoring VWAPs at the highs and lows. By doing this, the flat levels, characteristic of traditional Donchian Channels, are no more!
Author's Note: This indicator is formed with no inherent use, and serves solely as a thought experiment.
> Concept
I would be hesitant to call this a "predictive" indicator, however the behavior of it would suggest it could be considered at least partially predictive
Essentially, the Anchored VWAPs creates something from otherwise nothing.
While the DC upper or lower values are staying flat, the VWAPs improvise based on price and volume to project a level that may be a better representation of where future highs or lows may settle.
Visually, this looks like we have cut off the corners of the Donchian Channel.
Note: Notice how we are calculating values before the corners are realized.
> Implementation
While this is only a concept indicator, The specific application I've gone with for this, is a sort of supertrend-ish display (A Trend Flipping Trailing Stop Loss).
The script uses basic logic to create a trend direction, and then displays the Anchored VWAPs as a form of trailing stop loss.
While "In Trend", the script fills in the area between the VWAP and Price in the direction of trend.
When new highs or lows are made while in trend, the opposite VWAP will start to generate at the new highs or lows. These happen on every new high or low, so they are not indicating the trend shift, but could be interpreted as breakout levels for the current trend direction in order for continuation.
Note: All values are drawn live, but when using higher timeframes, there is a natural calculation discrepancy when using live data vs. historical.
> Technicals
In this script, I'm simply detecting new highs or lows from the DC and using those as the anchor frequency on the built-in VWAP function.
So each time a new high or low is made based on DC, the VWAP function re-anchors to the high or low of the candle.
Past that, I have implemented some logic in order to account for a common occurrence I faced during development.
Frequently, the price would outpace the anchored VWAP, so we would end up with the VWAP being further from price than the actual DC upper or lower.
Due to this, what I have ended up with was a third value which, rather than switching between raw VWAP values and DC values, it adjusts the value based on the change in the VWAP value.
This can be simply thought of as a "Start + Change" type of setup.
By doing this, I can use the change values from the actual anchored VWAP, and under normal conditions, this will also be the true VWAP value.
However, situationally, I am able to update the start value which we're applying the VWAP change to.
In other words, when these situations happen, the VWAP change is added to the new (closer to price) DC value.
The specific trend logic being used is nothing fancy at all, we are simply checking if a new high or low is created and setting the trend in that direction.
This is in line with some traditional DC Strategies.
To those who made it here,
Just remember:
The chart may be ugly, but it's the fastest analysis of the data you can get.
Nicer displays often come at the hidden cost of latency.
You have to shoot your shot to make it.
Choose 2: Fast, Clean, Useful
Enjoy!

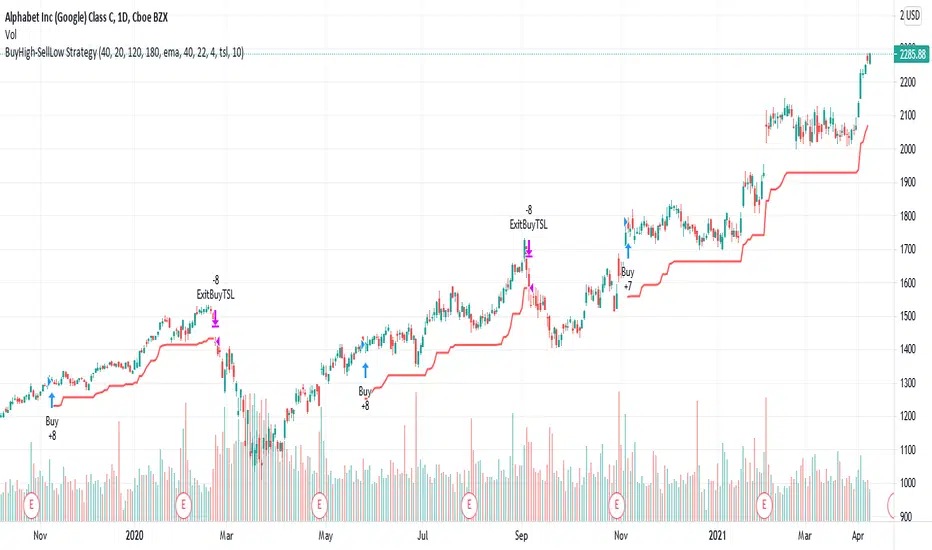
BuyHigh-SellLow StrategyYeah. You read it right. It's not a mistake. It is buy high and sell low strategy.
Main entry condition is to buy when price hits 40 day Donchian channel top. This is combined with my other regular filters which are aligned moving average and new high/low filter and yearly high/low filter.
Exit condition can be based on two things:
Donchian channel : Set appropriate DonchianExitLength. Lower line of donchian channel acts as trailing stop.
ATR Based trailing stop : Select appropriate ATR multiplier and length.
What a surprise!! You can buy high, sell low and still make money.
Expanded Cloud [LuxAlgo]The Expanded Cloud tool allows traders to identify and follow trends accurately. It is based on the well-known Donchian Channels, but with enhanced features.
It features a trailing cloud that expands with the price and a trading stats dashboard.
🔶 USAGE
The tool is super easy to use. Traders can identify bigger or smaller trends just by adjusting the length from the settings panel.
Trend identification is based on Donchian Channels. An uptrend is indicated when the cloud is located below the price, while a downtrend is indicated when the cloud is above it.
Dots signal the start of a new trend, and the width of the clouds identifies the strength of the price expansion. The wider the cloud, the bigger the move.
The expanded cloud, due to its visual, can also act as a trailing stop.
🔹 Trend Identification
As we can see in the chart above, different length values identify different trends on the same BTC daily chart. Larger values identify larger trends.
🔹 Cloud Expansion
From the settings panel, traders can adjust how the clouds expand based on the Expansion % parameter. It accepts values from 0 to 100, which controls how much of the expansion is taken into account. Higher values will make the cloud expand and get closer to the price faster.
When the cloud moves opposite to the direction of the indicated trend (e.g: the cloud decreases while being below the price), it is often indicative of the end of a retracement, and we can expect the price to move with the indicated trend.
The chart above shows the effect of different Expansion % values.
🔹 Dashboard
The trading statistics dashboard informs traders of key metrics derived from the tool. The following are notable:
PNL: Theoretical profit or loss from all trends identified by the tool in the right scale units.
EXPECT.: Expected value of each trade. It is derived from win rate and risk-to-reward metrics.
AVG: 1st TOUCH: The average number of bars from the beginning of a new trend until the price touches the cloud for the first time.
🔶 SETTINGS
Length: Length for trend detection
Expansion %: Percentage of price expansion for cloud formation
Source: Source of the data
🔹 Dashboard
Show Dashboard: Enable/disable the statistics dashboard
Location: Dashboard location
Size: Dashboard size

TASC 2024.06 REIT ETF Trading System█ OVERVIEW
This strategy script demonstrates the application of the Real Estate Investment Trust (REIT) ETF trading system presented in the article by Markos Katsanos titled "Is The Price REIT?" from TASC's June 2024 edition of Traders' Tips .
█ CONCEPTS
REIT stocks and ETFs offer a simplified, diversified approach to real estate investment. They exhibit sensitivity to interest rates, often moving inversely to interest rate and treasury yield changes. Markos Katsanos explores this relationship and the correlation of prices with the broader market to develop a trading strategy for REIT ETFs.
The script employs Bollinger Bands and Donchian channel indicators to identify oversold conditions and trends in REIT ETFs. It incorporates the 10-year treasury yield index (TNX) as a proxy for interest rates and the S&P 500 ETF (SPY) as a benchmark for the overall market. The system filters trade entries based on their behavior and correlation with the REIT ETF price.
█ CALCULATIONS
The strategy initiates long entries (buy signals) under two conditions:
1. Oversold condition
The weekly ETF low price dips below the 15-week Bollinger Band bottom, the closing price is above the value by at least 0.2 * ATR ( Average True Range ), and the price exceeds the week's median.
Either of the following:
– The TNX index is down over 15% from its 25-week high, and its correlation with the ETF price is less than 0.3.
– The yield is below 2%.
2. Uptrend
The weekly ETF price crosses above the previous week's 30-week Donchian channel high.
The SPY ETF is above its 20-week moving average.
Either of the following:
– Over ten weeks have passed since the TNX index was at its 30-week high.
– The correlation between the TNX value and the ETF price exceeds 0.3.
– The yield is below 2%.
The strategy also includes three exit (sell) rules:
1. Trailing (Chandelier) stop
The weekly close drops below the highest close over the last five weeks by over 1.5 * ATR.
The TNX value rises over the latest 25 weeks, with a yield exceeding 4%, or its value surges over 15% above the 25-week low.
2. Stop-loss
The ETF's price declines by at least 8% of the previous week's close and falls below the 30-week moving average.
The SPY price is down by at least 8%, or its correlation with the ETF's price is negative.
3. Overbought condition
The ETF's value rises above the 100-week low by over 50%.
The ETF's price falls over 1.5 * ATR below the 3-week high.
The ETF's 10-week Stochastic indicator exceeds 90 within the last three weeks.
█ DISCLAIMER
This strategy script educates users on the system outlined by the TASC article. However, note that its default properties might not fully represent real-world trading conditions for an individual. By default, it uses 10% of equity as the order size and a slippage amount of 5 ticks. Traders should adjust these settings and the commission amount when using this script. Additionally, since this strategy utilizes compound conditions on weekly data to trigger orders, it will generate significantly fewer trades than other, higher-frequency strategies.

[RS]Support and Resistance V0Support and Resistance using donchian channels to validate tops/bottoms
(note: while donchians follow price closely within look back window, this will only update new top/bottom when making new extremes in the donchian channel)
combo with other systems:

Breakaway Fair Value Gaps [LuxAlgo]The Breakaway Fair Value Gap (FVG) is a typical FVG located at a point where the price is breaking new Highs or Lows.
🔶 USAGE
In the screenshot above, the price range is visualized by Donchian Channels.
In theory, the Breakaway FVGs should generally be a good indication of market participation, showing favor in the FVG's breaking direction. This is a combination of buyers or sellers pushing markets quickly while already at the highest high or lowest low in recent history.
While this described reasoning seems conventional, looking into it inversely seems to reveal a more effective use of these formations.
When the price is pushed to the extremities of the current range, the price is already potentially off balance and over-extended. Then an FVG is created, extending the price further out of balance.
With this in consideration, After identifying a Breakaway FVG, we could logically look for a reversion to re-balance the gap.
However, it would be illogical to believe that the FVG will immediately mitigate after formation. Because of this, the dashboard display for this indicator shows the analysis for the mitigation likelihood and timeliness.
In the example above, the information in the dashboard would read as follows (Bearish example):
Out of 949 Bearish Breakaway FVGs, 80.19% are shown to be mitigated within 60 bars, with the average mitigation time being 13 bars.
The other 19.81% are not mitigated within 60 bars. This could mean the FVG was mitigated after 60 bars, or it was never mitigated.
The unmitigated FVGs within the analysis window will extend their mitigation level to the current bar. We can see the number of bars since the formation is represented to the right of the live mitigation level.
Utilizing the current distance readout helps to better judge the likelihood of a level being mitigated.
Additionally, when considering these mitigation levels as targets, an additional indicator or analysis can be used to identify specific entries, which would further aid in a system's reliability.
🔶 SETTINGS
Trend Length: Sets the (DC) Trend length to use for Identifying Breakaway FVGs.
Show Mitigation Levels: Optionally hide mitigation levels if you would prefer only to see the Breakaway FVGs.
Maximum Duration: Sets the analysis duration for FVGs, Past this length in bars, the FVG is counted as "Un-Mitigated".
Show Dashboard: Optionally hide the dashboard.
Use Median Duration: Display the Median of the Bar Length data set rather than the Average.

[OKX Signal Bot] Indicator Script Set Up TemplateDiscover the power of the Turtle Trade Channels Indicator (TUTCI), an innovative tool that integrates the time-tested principles of the legendary Turtle Trade system. This groundbreaking system shattered the belief that successful traders are born, not made, by transforming ordinary individuals into profitable traders.
The Turtle Trade Experiment, which achieved a remarkable 80% annual return over four years and amassed a staggering $150 million, showcased the immense potential of this trend-following strategy. Unlike the conventional "buy low and sell high" approach, the Turtle Trade system embraces a different philosophy—one of capturing substantial profits by following prevailing trends.
At the heart of the Turtle Trade Channels Indicator lies the concept of Donchian Channels, a powerful technical indicator developed by Richard Donchian. Building upon this foundation, the main rule of TUTCI is to identify 20-day breakouts and capitalize on them, while simultaneously utilizing a profit-taking strategy based on breaching 10-day highs or lows.
For long trades, the indicator signals a buying opportunity when the price breaks above the 20-day high. Conversely, for short trades, a selling opportunity arises when the price falls below the 20-day low. This systematic approach allows traders to align themselves with the prevailing momentum, capturing significant price movements.
To further enhance trading precision, TUTCI incorporates two key lines. The red line represents the trading line, indicating the direction of the trend. Price bars above the trend line suggest an uptrend, while those below indicate a downtrend. The dotted blue line serves as the exit line, guiding traders to close their positions when price action breaches the 10-day high or low. This rule safeguards profits and helps traders avoid potential trend reversals.
The Turtle Trade Channels Indicator (TUTCI) is a versatile tool applicable to various financial markets, including stocks, commodities, and forex. By harnessing the power of breakouts and integrating profit-taking rules, this indicator empowers traders to capitalize on favorable trading opportunities while managing risk effectively.
As with any trading strategy, it is crucial to conduct thorough backtesting and evaluation of the TUTCI system before implementing it in live trading. Traders can customize the indicator's parameters to align with their trading preferences and adapt to changing market conditions. Employing sound risk management techniques, such as position sizing and stop-loss orders, is paramount to protect capital and minimize potential losses.
Experience the transformational potential of the Turtle Trade Channels Indicator (TUTCI) and embark on a journey of trend following, capturing significant profits, and achieving trading success.
These scripts are only functioning as sample script templates to support okx alert standards. It is not intended to provide any investment, tax, or legal advice, nor should it be considered an offer to purchase, sell, hold or offer any services relating to digital assets. Digital assets, including stablecoins, involve a high degree of risk, can fluctuate greatly, and can even become worthless. You should carefully consider whether trading or holding digital assets is suitable for you in light of your financial condition and risk tolerance. OKX does not provide investment or asset recommendations. You are solely responsible for your investment decisions, and OKX is not responsible for any potential losses. Past performance is not indicative of future results. Please consult your legal/tax/investment professional for questions about your specific circumstances.

Jurik Filtered, Composite Fractal Behavior (CFB) Channels [Loxx]Double Jurik-Filtered Composite Fractal Behavior (CFB) Channels is a channel indicator that acts as both a baseline, similar to Donchian, and as support and resistance levels. This indicator is price time adaptive meaning it flexes to price volatility waves. The indicators adaptive nature is calculated using the Composite Fractal Behavior (CFB) algorithm. The result of this adaptive calculation is then smoothed using Jurik Filtering, and then it's normalized to conform to a range of values. This helps better identify trends.
What is Composite Fractal Behavior (CFB)?
All around you mechanisms adjust themselves to their environment. From simple thermostats that react to air temperature to computer chips in modern cars that respond to changes in engine temperature, r.p.m.'s, torque, and throttle position. It was only a matter of time before fast desktop computers applied the mathematics of self-adjustment to systems that trade the financial markets.
Unlike basic systems with fixed formulas, an adaptive system adjusts its own equations. For example, start with a basic channel breakout system that uses the highest closing price of the last N bars as a threshold for detecting breakouts on the up side. An adaptive and improved version of this system would adjust N according to market conditions, such as momentum, price volatility or acceleration.
Since many systems are based directly or indirectly on cycles, another useful measure of market condition is the periodic length of a price chart's dominant cycle, (DC), that cycle with the greatest influence on price action.
The utility of this new DC measure was noted by author Murray Ruggiero in the January '96 issue of Futures Magazine. In it. Mr. Ruggiero used it to adaptive adjust the value of N in a channel breakout system. He then simulated trading 15 years of D-Mark futures in order to compare its performance to a similar system that had a fixed optimal value of N. The adaptive version produced 20% more profit!
This DC index utilized the popular MESA algorithm (a formulation by John Ehlers adapted from Burg's maximum entropy algorithm, MEM). Unfortunately, the DC approach is problematic when the market has no real dominant cycle momentum, because the mathematics will produce a value whether or not one actually exists! Therefore, we developed a proprietary indicator that does not presuppose the presence of market cycles. It's called CFB (Composite Fractal Behavior) and it works well whether or not the market is cyclic.
CFB examines price action for a particular fractal pattern, categorizes them by size, and then outputs a composite fractal size index. This index is smooth, timely and accurate
Essentially, CFB reveals the length of the market's trending action time frame. Long trending activity produces a large CFB index and short choppy action produces a small index value. Investors have found many applications for CFB which involve scaling other existing technical indicators adaptively, on a bar-to-bar basis.
What is Jurik Volty used in the Juirk Filter?
One of the lesser known qualities of Juirk smoothing is that the Jurik smoothing process is adaptive. "Jurik Volty" (a sort of market volatility ) is what makes Jurik smoothing adaptive. The Jurik Volty calculation can be used as both a standalone indicator and to smooth other indicators that you wish to make adaptive.
What is the Jurik Moving Average?
Have you noticed how moving averages add some lag (delay) to your signals? ... especially when price gaps up or down in a big move, and you are waiting for your moving average to catch up? Wait no more! JMA eliminates this problem forever and gives you the best of both worlds: low lag and smooth lines.
Ideally, you would like a filtered signal to be both smooth and lag-free. Lag causes delays in your trades, and increasing lag in your indicators typically result in lower profits. In other words, late comers get what's left on the table after the feast has already begun.
Ultimate IndicatorThis is a combination of all the price chart indicators I frequently switch between. It contains my day time highlighter (for day trading), multi-timeframe long-term trend indicator for current commodity in the bottom right, customizable trend EMA which also has multi-timeframe drawing capabilities, VWAP, customizable indicators with separate settings from the trend indicator including: EMA, HL2 over time, Donchian Channels, Keltner Channels, Bollinger Bands, and Super Trend. The settings for these are right below the trend settings and can have their length and multiplier adjusted. All of those also have multi-timeframe capabilities separate from the trend multi-time settings.
The Day Trade Highlight option will draw faint yellow between 9:15-9:25, red between 9:25-9:45, yellow between 9:45-10:05. There will be one white background at 9:30am to show the opening of the market. while the market is open there will be a very faint blue background. For the end of the day there will be yellow between 15:45-15:50, red between 15:50-16:00, and yellow between 16:00-16:05. During the night hours, there is no coloring. The purpose of this highlight is to show the opening / closing times of the market and the hot times for large moves.
The indicators can also be colored in the following ways:
1. Simple = Makes all colors for the indicator Gray
2. Trend = Will use the Donchian Channels to get the short-trend direction and by default will color the short-term direction as Blue or Red. Unless using Super Trend, the Donchian Channel is used to find short-term trend direction.
3. Trend Adv = Will use the Donchian Channels to get the short-trend direction and by default will color the short-term direction as Blue or Red. Unless using Super Trend, the Donchian Channel is used to find short-term trend direction. If there is a short-term up-trend during a long-term down-trend, the Blue will become Navy. If short-term down-trend during long-term up-trend, the Red will be Brown.
4. Squeeze = Compares the Bollinger Bands width to the Keltner Channels width and will color based on relative squeeze of the market: Teal = no squeeze. Yellow = little squeeze. Red = decent squeeze. White = huge squeeze. if you do not understand this one, try drawing the Bollinger Bands while using the Squeeze color option and it should become more apparent how this works. I also recommend leaving the length and multiplier to the default 20 and 2 if using this setting and only changing the timeframe to get longer/shorter lengths as I've seen that changing the length or multiplier can more or less make it not work at all.
Along with the indicator settings are options to draw lines/labels/fills for the indicator. I enjoy having only fills for a cleaner look.
The Labels option will show Buy/Sell signals when the short-term trend flips to agree with the long-term trend.
The Trend Bars option will do the same as the Labels option but instead will color the bars white when a Buy/Sell option is given.
The Range Bars option shows will color a bar white when the Close of a candle is outside of a respective ranging indicator option (Bollinger or Keltner).
The Trend Bars will draw white candles no matter which indicator selection you make (even "Off"). However, Range Bars will only draw white when either Bollinger or Keltner are selected.
The Donchian Channels and Super Trend are trending indicators and should be used during trending markets. I like to use the MACD in conjunction with these indicators for possibly earlier entries.
The Bollinger Bands and Keltner Channel are ranging indicators and should be used during ranging markets. I like to use the RSI in conjunction with these indicators and will use 60/40 for overbought and oversold areas rather than 70/30. During a range, I wait for an overbought or oversold indication and will buy/sell when it crosses back into the middle area and close my position when it touches the opposite band.
I have a MACD/RSI combination indicator if you'd like that as well :D
As always, trade at your own risk. This is not some secret indicator that will 100% win. As always, the trades you see in the picture use a 1:1.5 or 1:2 risk to reward ratio, for today (August 8, 2022) it won 5/6 times with one trade still open at the end of the day. Manage your account correctly and you'll win in the long term. Hit me up with any questions or suggestions. Happy Trading!

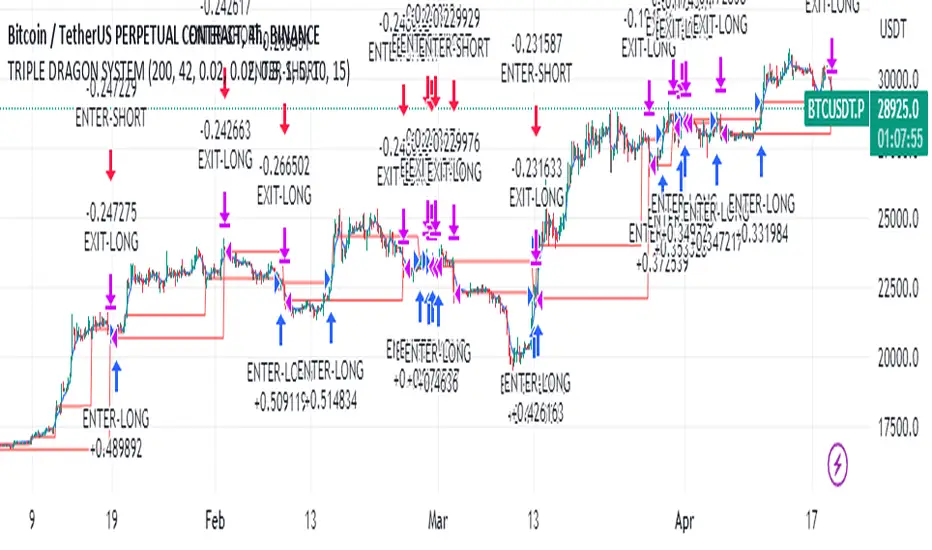
Educational Strategy : TRIPLE DRAG-ON SYSTEM V.1The Triple Dragon System is a technical trading strategy that uses a combination of three different indicators to identify potential buy and sell signals in the market. The three indicators used in this strategy are the Extended Price Volume Trend (EPVT), the Donchian Channels, and the Parabolic SAR. Each of these indicators provides different types of information about the market, and by combining them, we can create a more comprehensive trading system.
The EPVT is used to identify potential trend changes and measure the strength of a trend. The Donchian Channels are used to identify the direction of the trend, while the Parabolic SAR is used to provide additional confirmation of trend changes and help determine potential entry and exit points.
In this strategy, we first use the EPVT and Donchian Channels to identify the direction of the trend. When the EPVT is above its baseline and the price is above the upper Donchian Channel, it suggests an uptrend. Conversely, when the EPVT is below its baseline and the price is below the lower Donchian Channel, it suggests a downtrend.
Once we have identified the trend direction, we use the Parabolic SAR to help determine potential entry and exit points. When the Parabolic SAR is below the price and flips to above the price, it suggests a potential buy signal. Conversely, when the Parabolic SAR is above the price and flips to below the price, it suggests a potential sell signal.
To further refine our trading signals, we use multiple timeframes to confirm the trend direction and ensure that we are not entering the market during a period of high volatility. We also use multiple take-profit levels to lock in profits and manage risk.
Overall, the Triple Dragon System is a comprehensive technical trading strategy that combines multiple indicators to provide clear entry and exit signals. By using a combination of trend-following and momentum indicators, we can identify potential trading opportunities while minimizing risk. Please note that this strategy is for educational purposes only and should not be taken as financial advice.
TrendZonesTrendZones
This is an indicator which I use, have tested, tweaked and added features to for use in my trend following investing system. I got the idea for it when for some reason I was looking for a dynamic reference to measure the height of a channel or something. In search of this I made MA’s of the high and low borders of a Donchian channel which turned out to be two near parallel and stunningly smooth curves. This visual was so appealing that I immediately tried to turn it into a replacement for the KeltCOG which I previously used in my system. First I created a curve in the middle of the upper and lower curves, which I called COG (Center Of Gravity). Then I decided to enter only one lookback and let the script create a Donchian channel with half the lookback and use this to create the curves with an MA of whole lookback. For this reason the minimum lookback is set to 14, enough room for the Donchian Channel of 7 periods. This Donchian ChanneI has a special way of calculating the borders, involving a 5 period Median value. Thanks to this these borders are really a resistance and support level, which won’t change at a whim, e.g. when a ‘dead cat bounce’ occurs. I prevented the Donchian channel to show itself between the curves and only pop out from behind these. These pop outs now function as “strong trend zones”. I gave it colors (blue:-strong up, green: moderate up, orange: moderate down, red: strong down, near COG: gray, curves horizontal: gray) and it looked very appealing. I tested it in different time frames. In some weekend, when I was bored, I observed for a few hours the minute chart of bitcoin. It turned out that you can reliably tell that an uptrend ends when the candles go under the COG beginning a downtrend. Uptrend starts again once the candles go above COG. As Trends on minute charts only last around half an hour, this entertainment made the potential of this indicator very clear to me in just one afternoon.
Risk Management, Safe Level and Logical Stops.
In the inputs are settings for “Risk Tolerance”, and to activate “Show Logical Stop Level” (activated in example chart) and “Show Safe Level”. As a rule of thump a trade should not expose the invested capital to a risk of losing more than 2 percent. I divided my investment capital in ten equal parts which are allocated to ten different stocks or other instruments or kept liquid. This means that when a position is closed by triggering a Stop with a loss of 20 percent, the invested capital suffers only 2 percent (20% x 10% = 2%). This is why the value for “Risk Tolerance” has a default of 20. Because I put my Stops on the lower curve, a “Safe Level” can be calculated such that when you buy for a price below or at this level, the stop will protect the position sufficiently. Because I only buy when the instrument is in uptrend, the buying price should be between COG and Safe Level. Although I never do that, putting the stop at other curves is feasible and when you want to widen the stop (I never lower my stops btw) in a downtrend situation, even 1 ATR below the “Low Border”. I call these “Logical Stop Levels”, marked with dark green circles on the lower curve when safe buying by placing the Stoploss on this curve is possible, gray circles on the other curves, on the Upper Curve navy when price enters very profitable level. In a downtrend situation maroon circles appear.
Target lines
When I open a position I always set a Stoploss and a Target, for this purpose two types of Target values can be set and corresponding Target lines activated. These lines are drawn above the “High Border” at the set distance. If one expects some price to be used, differences will occur.
Other Features
Support Zone, this is 1 ATR below the “Low Border”, the maroon circles of the “Logal Stops” are placed on this “Support level”.
Stop distance and Channel Width. (activated in example chart) These are reported in a two cell table in the right lower corner of the main panel. I created this because I want to be able to check the volatility, whether the channel shows a situation in which safe buying in most levels of the channel is possible or what risk you take when you buy now and set the Stop at the nearest logical level (which is not always the “Lower curve”). This feature comes in handy for creating a setup I propose in the “Day Trading Fantasy” below.
Some General and User Settings. I never activate this, perhaps you will.
Use Of TrendZones In My System.
Create a list of stocks in uptrend. I define ‘stock in uptrend’ as in uptrend zone in all three monthly, weekly and daily charts, all three should at the same time be in uptrend. The advantage of TrendZones is that you can immediately see in which zone the candle moves.
Opening a position in a stock from the above list. I do this only when in both the daily and weekly the green dot on the lower curve indicates a buying opportunity. This is usually not the case in most of the items of the list, this feature thus provides a good timing for opening a position. Sometimes you need to wait a few weeks for this to happen.
Setting a target over a position. For this I use the Target percent line of the weekly chart with the default value of 10.
Updating the Stoploss and Target values. Every week or two weeks I set these to the new values of the “Lower Curve” and the Target line of the weekly. Attention: never shift down Stops, only up or let them stay the same when the curve moves down. I never use Stop levels on other curves.
I Check the charts whenever I like to do this. Close the position when the uptrend obviously shifts down. Otherwise I let the profits run until the Target triggers which closes the position with some profit.
For selecting stocks an checking charts for volume events, I also use a subpanel indicator called “TZanalyser”, which borrows the visual of my “Fibonacci Zone Oscillator”, is based on TrendZones and includes code from my REVE indicators. I intend to publish that as well.
Day Trading Fantasy.
Day trading is an attempt to earn a dime by opening a position in the morning and close it during the day again with a profit (or a loss). Before the market closes, you close all day trading positions.
In my fantasy the “Logical Stop Level” is repurposed for use as entry point and the ATR-based Target line is used to provide a target setting in an intraday chart, like e.g. 15 minute. To do this the “Safe Level” should be limited to between Channel width and COG. This can be done by showing “Safe Level” and “Channel Width” and then set “Risk Tolerance” to around the shown Channel Width. In this setting you can then wait for the green circle to show up for entering your trade and protect it with the stop.
I don’t know if this works fine or if it’s better than other day trade systems, because I don’t do day trading.
Take care and have fun.

Optimal Length BackTester [YinYangAlgorithms]This Indicator allows for a ‘Optimal Length’ to be inputted within the Settings as a Source. Unlike most Indicators and/or Strategies that rely on either Static Lengths or Internal calculations for the length, this Indicator relies on the Length being derived from an external Indicator in the form of a Source Input.
This may not sound like much, but this application may allows limitless implementations of such an idea. By allowing the input of a Length within a Source Setting you may have an ‘Optimal Length’ that adjusts automatically without the need for manual intervention. This may allow for Traditional and Non-Traditional Indicators and/or Strategies to allow modifications within their settings as well to accommodate the idea of this ‘Optimal Length’ model to create an Indicator and/or Strategy that adjusts its length based on the top performing Length within the current Market Conditions.
This specific Indicator aims to allow backtesting with an ‘Optimal Length’ inputted as a ‘Source’ within the Settings.
This ‘Optimal Length’ may be used to display and potentially optimize multiple different Traditional Indicators within this BackTester. The following Traditional Indicators are included and available to be backtested with an ‘Optimal Length’ inputted as a Source in the Settings:
Moving Average; expressed as either a: Simple Moving Average, Exponential Moving Average or Volume Weighted Moving Average
Bollinger Bands; expressed based on the Moving Average Type
Donchian Channels; expressed based on the Moving Average Type
Envelopes; expressed based on the Moving Average Type
Envelopes Adjusted; expressed based on the Moving Average Type
All of these Traditional Indicators likewise may be displayed with multiple ‘Optimal Lengths’. They have the ability for multiple different ‘Optimal Lengths’ to be inputted and displayed, such as:
Fast Optimal Length
Slow Optimal Length
Neutral Optimal Length
By allowing for the input of multiple different ‘Optimal Lengths’ we may express the ‘Optimal Movement’ of such an expressed Indicator based on different Time Frames and potentially also movement based on Fast, Slow and Neutral (Inclusive) Lengths.
This in general is a simple Indicator that simply allows for the input of multiple different varieties of ‘Optimal Lengths’ to be displayed in different ways using Tradition Indicators. However, the idea and model of accepting a Length as a Source is unique and may be adopted in many different forms and endless ideas.
Tutorial:
You may add an ‘Optimal Length’ within the Settings as a ‘Source’ as followed in the example above. This Indicator allows for the input of a:
Neutral ‘Optimal Length’
Fast ‘Optimal Length’
Slow ‘Optimal Length’
It is important to account for all three as they generally encompass different min/max length values and therefore result in varying ‘Optimal Length’s’.
For instance, say you’re calculating the ‘Optimal Length’ and you use:
Min: 1
Max: 400
This would therefore be scanning for 400 (inclusive) lengths.
As a general way of calculating you may assume the following for which lengths are being used within an ‘Optimal Length’ calculation:
Fast: 1 - 199
Slow: 200 - 400
Neutral: 1 - 400
This allows for the calculation of a Fast and Slow length within the predetermined lengths allotted. However, it likewise allows for a Neutral length which is inclusive to all lengths alloted and may be deemed the ‘Most Accurate’ for these reasons. However, just because the Neutral is inclusive to all lengths, doesn’t mean the Fast and Slow lengths are irrelevant. The Fast and Slow length inputs may be useful for seeing how specifically zoned lengths may fair, and likewise when they cross over and/or under the Neutral ‘Optimal Length’.
This Indicator features the ability to display multiple different types of Traditional Indicators within the ‘Display Type’.
We will go over all of the different ‘Display Types’ with examples on how using a Fast, Slow and Neutral length would impact it:
Simple Moving Average:
In this example above have the Fast, Slow and Neutral Optimal Length formatted as a Slow Moving Average. The first example is on the 15 minute Time Frame and the second is on the 1 Day Time Frame, demonstrating how the length changes based on the Time Frame and the effects it may have.
Here we can see that by inputting ‘Optimal Lengths’ as a Simple Moving Average we may see moving averages that change over time with their ‘Optimal Lengths’. These lengths may help identify Support and/or Resistance locations. By using an 'Optimal Length' rather than a static length, we may create a Moving Average which may be more accurate as it attempts to be adaptive to current Market Conditions.
Bollinger Bands:
Bollinger Bands are a way to see a Simple Moving Average (SMA) that then uses Standard Deviation to identify how much deviation has occurred. This Deviation is then Added and Subtracted from the SMA to create the Bollinger Bands which help Identify possible movement zones that are ‘within range’. This may mean that the price may face Support / Resistance when it reaches the Outer / Inner bounds of the Bollinger Bands. Likewise, it may mean the Price is ‘Overbought’ when outside and above or ‘Underbought’ when outside and below the Bollinger Bands.
By applying All 3 different types of Optimal Lengths towards a Traditional Bollinger Band calculation we may hope to see different ranges of Bollinger Bands and how different lookback lengths may imply possible movement ranges on both a Short Term, Long Term and Neutral perspective. By seeing these possible ranges you may have the ability to identify more levels of Support and Resistance over different lengths and Trading Styles.
Donchian Channels:
Above you’ll see two examples of Machine Learning: Optimal Length applied to Donchian Channels. These are displayed with both the 15 Minute Time Frame and the 1 Day Time Frame.
Donchian Channels are a way of seeing potential Support and Resistance within a given lookback length. They are a way of withholding the High’s and Low’s of a specific lookback length and looking for deviation within this length. By applying a Fast, Slow and Neutral Machine Learning: Optimal Length to these Donchian Channels way may hope to achieve a viable range of High’s and Low’s that one may use to Identify Support and Resistance locations for different ranges of Optimal Lengths and likewise potentially different Trading Strategies.
Envelopes / Envelopes Adjusted:
Envelopes are an interesting one in the sense that they both may be perceived as useful; however we deem that with the use of an ‘Optimal Length’ that the ‘Envelopes Adjusted’ may work best. We will start with examples of the Traditional Envelope then showcase the Adjusted version.
Envelopes:
As you may see, a Traditional form of Envelopes even produced with a Machine Learning: Optimal Length may not produce optimal results. Unfortunately this may occur with some Traditional Indicators and they may need some adjustments as you’ll notice with the ‘Envelopes Adjusted’ version. However, even without the adjustments, these Envelopes may be useful for seeing ‘Overbought’ and ‘Oversold’ locations within a Machine Learning: Optimal Length standpoint.
Envelopes Adjusted:
By adding an adjustment to these Envelopes, we may hope to better reflect our Optimal Length within it. This is caused by adding a ratio reflection towards the current length of the Optimal Length and the max Length used. This allows for the Fast and Neutral (and potentially Slow if Neutral is greater) to achieve a potentially more accurate result.
Envelopes, much like Bollinger Bands are a way of seeing potential movement zones along with potential Support and Resistance. However, unlike Bollinger Bands which are based on Standard Deviation, Envelopes are based on percentages +/- from the Simple Moving Average.
We will conclude our Tutorial here. Hopefully this has given you some insight into how useful adding a ‘Optimal Length’ within an external (secondary) Indicator as a Source within the Settings may be. Likewise, how useful it may be for automation sake in the sense that when the ‘Optimal Length’ changes, it doesn’t rely on an alert where you need to manually update it yourself; instead it will update Automatically and you may reap the benefits of such with little manual input needed (aside from the initial setup).
If you have any questions, comments, ideas or concerns please don't hesitate to contact us.
HAPPY TRADING!

OBV-MACDThe OBV-MACD indicator is a momentum-based technical analysis tool that helps traders identify trend reversals and trend strength. This Pine script is an implementation of the OBV-MACD indicator that uses the On-Balance Volume (OBV) and Moving Average Convergence Divergence (MACD) indicators to provide a momentum data of OBV.
The OBV-MACD indicator uses the OBV to calculate the cumulative volume, which is then smoothed using two moving averages - fast and slow. The difference between these moving averages is plotted as a histogram, with a signal line plotted over it. A buy signal is generated when the histogram crosses above the signal line, indicating a bullish trend, while a sell signal is generated when the histogram crosses below the signal line, indicating a bearish trend.
This Pine script also includes an OBV-MACD-Donchian version that incorporates Donchian channels for the OBV-MACD. The Donchian channel is a technical analysis indicator that helps traders identify the highs and lows of an asset's price over a certain period. The OBV-MACD-Donchian version uses the OBV-MACD indicator along with the Donchian channels to provide signals that the momentum of OBV is making new high/low during that period of time.
Traders can customize the input parameters of the OBV-MACD indicator, such as the timeframe, method of calculation for the moving averages, and the lengths of the moving averages and breakout lengths. The colors of the plot can also be customized to suit the trader's preferences.

Strategy Template - V2This is an educational script created to demonstrate few basic building blocks of a trend based strategy and how to achieve different entry and exit types. My initial intention was to create a comprehensive strategy template which covers all the aspects of strategy. But, ended up creating fully fledged strategy based on trend following.
This is an enhancement on Strategy-Template But this script is comparitively more complex. Hence I decided to create new version instead of updating the existing one.
Lets dive deep.
SIMPLE COMPONENTS OF TREND FOLLOWING STRATEGY
TREND BIAS - This defines the direction of trend. Idea is not to trade against the trend direction. If the bias is bullish, look for long opportunities and if bias is bearish, look for short opportunities. Stay out of the market when the bias is neutral.
Often, trend bias is determined based on longer timeframe conditions. Example - 200 Moving Average, Higher timeframe moving averages, Higher timeframe high-lows etc. can be used for determining the trend bias.
In this script, I am using Weekly donchian channels combined with daily donchian channels to define trend bias.
Long Bias - 40 Day donchian channel sits completely in upper portion of 40 Week dochnial channel.
Short Bias - 40 Day donchian channel sits completely in lower portion of 40 Week donchian channel.
ENTRY CONDITION - Entry signals are generated only in the direction of bias. Hence, when in LongBias, we only get Long signals and when in short bias, we only get short signals.
In our case, when in Long Bias - if price hits 40 day high for the first time, this creates our long entry signal. Similarly when in Short Bias , price hitting 40 day low will create signal for going short. Since we do not take trades opposite to trend, no entry conditions are formed when price hits 40 day high in Short Bias or 40 day low in Long Bias.
EXIT CONDITION - Exit conditions are formed when we get signals of trend failure.
In our case, when in long trade, price hitting 40 day low creates exit signal. Similarly when in short trade price hitting 40 day high creates exit signal for short trade.
DIFFERENT TYPES OF ENTRY AND EXIT
In this script, I have tried to demonstrate different entry and exit types.
Entry types
Market - Enter immediately when entry signal is received. That is, in this case when price crossover over high in long bias and crosses under low in short bias
Stop - This method includes estimating at what level new highs are made and creating a stop buy order at that level. This way, we do not miss if the break out is stronger. But, susciptible to fail during fakeouts.
Limit - This method includes executing a limit order to buy at lower price or sell at higher price. In trend following methods, downside of limit order is when there is genuine breakout, these limit orders may not hit and during trend failures the limit orders are likely to hit and go straight to stop.
Stop-Limit - this is same as stop order but will also place a limit condition to avoid buying on overextended breakout or with lots of slippage.
Exit types
Market - whether to keep the existing trade running or whether to close it is determined after close of each bar and exit orders are executed manually upon receiving exit signal.
Stop - We place stop loss orders beforehand when there is a trade in place. This can help in avoiding big movements against trade within bar. But, this may also stop on false signals or fakeouts.
Take profit
Stop - No take profits are configured.
Target - 30% of the positions are closed when take profit levels are hit. Take profit levels are defined by risk reward.
USING THE CODE AS TEMPLATE
As mentioned earlier, I intended to create a fully fledged strategy template. But, ended up creating a fully fledged stratgy. However, you can take some part of this code and use it to start your own strategy. Will explain what all things can be adopted without worrying about the strategy implementation within
Strategy definition : This can be copied as is and just change the title of strategy. This defines some of the commonly used parameters of strategy which can help with close to realistic backtesting results for your coded strategy and comparison with buy and hold.
Generic Strategy Parameters : The parameter which defines controlling alllowed trade direction and trading window are present here. This again can be copied as is and variable inDateRange can be directly used in entry conditions.
Generic Methods : f_getMovingAverage and f_secureSecurity are handy and can be used as is. atr method provideded by pine gives you ATR based on RMA. If you want SMA or any other moving average based ATR, you can use the method f_getCustomAtr
Trade Statements : This section has all types of trading instructions which includes market/stop/limit/stop-limit type of entries and exits and take profit statements. You can adopt the type of entry you are interested in and change when condition to suit your strategy.
Trade conditions and levels : This section is required. But, cannot be copied. All the trade logic goes here which also sets parameters which are used in when of Trade Statements.
Hope this helps.

Custom FIBOThis script shows 3 Donchian Channel 78.6% and 21.4% intermediary level lines to perform trade analysis. Besides those 6 lines it also optionally shows Fibonacci's retracements with 100%, 127%, 162%, 200% and 262% for one of the Donchian channels.
The 3 Donchian Channels used have default lengths 72, 305 and 1292, calculated after the first length default value of 72. For each of the 3 Donchian Channels only an upper line, set by default at 78.6%, is plotted in green and its complement, set to 21.4%, is plotted in red. When the closing price is above 3 green lines, we say it is Forbidden to Sell ( PV ), and when the closing price is below 3 red lines, we say it is Forbidden to Buy ( PC ). Those conditions are flagged on the chart. These PV-PC conditions were, up to my knowledge, first proposed by Bo Williams.
Fibonacci's retracements are show for the Donchian Channel with length 72 by default, but it can be changed to any length. They are colored as fuchsia (100%), blue (127%), orange (162%), yellow (200%) and navy (262%).

POC-Candle-EMA-ATR-LongShadow-50percCandleThis is a script for those who trade based on volume and smart money strategies.
Some of the features of this script:
- Display "Time Price Opportunity Chart". These points help traders to identify price opportunities over time and have a better analysis of the market.
- Mark candles that have traded more volume than previous candles.
- Mark candles whose body is at least and not more than 50% of the total candle size, these candles can be found more easily in smart money strategies.
- Mark spike candles to find FVG faster
- Mark candles that have a shadow of at least more than 380 points and can be good reversal points.
- EMA indicator to check the market trend
- DonchianChannel indicator to check the price trend on the chart
Regards

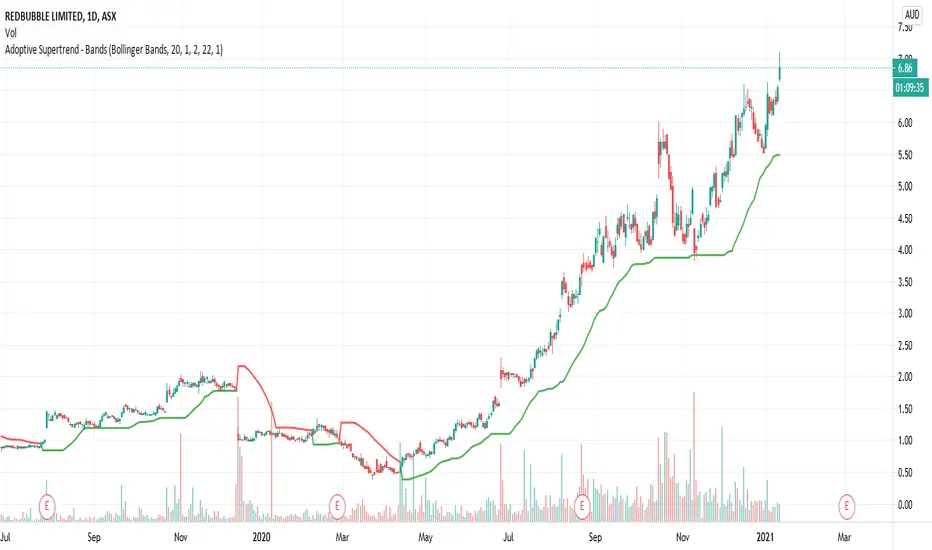
Adoptive Supertrend - BandsAnother adoption of supertrend. This time based on different channels - Bollinger Band, Keltner Channel, Donchian Channel and Pivot point based Donchian channel.
When price hits top of bands, it is considered as start or continuation of uptrend. When price hits bottom of the band it is considered as start or continuation of downtrend. Hence, supertrend is drawn based on these calculations. Use ATR Periods and ATR Multiplier to create stops certain ATR away from band's top and bottom.
Other supertrend adoptions published are here:
Pivot point based donchian channel is published here:
HiLo EMA Custom bandsHILo Ema custom bands
This advanced technical indicator is a powerful variation of "HiLo Ema squeeze bands" that combines the best elements of Donchian channels and EMAs. It's specially designed to identify price squeezes before significant market moves while providing dynamic support/resistance levels and predictive price targets.
Indicator Concept:
The indicator initializes EMAs at each new high or low - the upper EMA tracks highs while the lower EMA tracks lows. It draws maximum of 6 custom bands based on percentage, fixed value or Atr
Upper EM bands are drawn below uper ema, Lower EMA bands are drawn above lower ema
Customizable Options:
Ema length: 200 default
Calculation type: Ema (Default), HILO
Calculation type: Percent,Fixed Value, ATR
Band Value: Percent/Value/ATR multiple This is value to use for calculation type
Band Selection: Both,Upper,Lower
Key Features:
You can choose to draw either of one or both, the latter can be overwhelming initially but as you get used to it, it becomes a powerful tool.
When both bands are selected, upper and lower bands provide provides dual references and intersections
This creates a more trend-responsive alternative to traditional Donchian channels with clearly defined zones for trade planning.
If you select percaentage, note that the calulation is based FROM the respective EMA bands. So bands from lower EMA band will appear narrower compared to the those drawn from upper EMA band
Price targets or reversals:
Look of alignment of lines and price. The current level of one order could align with that of previous level of a different order because often markets move in steps
Settings Guide:
Recommended Settings:
Ema length: 200
Use one of the bands (not both) if using large length of say 1000
Calculation type: EMA
HILO will draw donchian like bands, this is useful if you only want flat price levels. In a rising market use upper and vise versa
Calculation type:
percentage for indices : 5, for symbols 10 or higher based on symbol volatility
Fixed value: about 10% of symbol value converted to value
Atr: 2 ideally
Perfect for swing traders and position traders looking for a more sophisticated volatility-based overlay that adapts to changing market conditions and provides predictive reversal levels.
Note: This indicator works well across multiple timeframes but is especially effective on H4, Daily and Weekly charts for trend trading.

Turtle System 2 (55/20) + N-Stop + MTF Table V7.2🐢 Description: Turtle System 2 (55/20) IndicatorThis indicator implements the trading signals of the Turtle Trading System 2 based on the classic Donchian Channels, supplemented by a historically correct, volatility-based Trailing Stop (N-Stop) and a Multi-Timeframe (MTF) status overview. The script was developed in Pine Script v6 and is optimized for performance and robustness.📊 Core Logic and ParametersThe indicator is based on the rule-based trend-following system developed by Richard Dennis and William Eckhardt, utilizing the more aggressive Entry/Exit parameters of System 2:FunctionParameterValueDescriptionEntry$\text{Donchian Breakout}$$\mathbf{55}$Buy/Sell upon breaking the 55-day High/Low.Exit (Turtle)$\text{Donchian Breakout}$$\mathbf{20}$Close the position upon breaking the 20-day Low/High.Volatility$\mathbf{N}$ (ATR Period)$\mathbf{20}$Calculation of market volatility using the Average True Range (ATR).Stop-LossMultiplier$\mathbf{2.0} BER:SETS the initial and Trailing Stop at $\mathbf{2N}$.🛠️ Technical Implementation1. Correct Trailing Stop (Section 4)In contrast to many flawed implementations, the Trailing Stop is implemented here according to the Original Turtle Logic. The stop price (current_stop_price) is not aggressively tied to the current low or high. Instead, at the close of each bar, it is only trailed in the direction of the trade (math.max for long positions) based on the formula:$$\text{New Trailing Stop} = \text{max}(\text{Previous Stop}, \text{Close} \pm (2 \times N))$$This ensures the stop is only adjusted upon sustained positive movement and is not prematurely triggered by short-term, deep price shadows.2. Reliable Multi-Timeframe (MTF) Logic (Section 6)The MTF section utilizes global var int variables (mtf_status_1h, mtf_status_D, etc.) in conjunction with the request.security() function.Purpose: Calculates and persistently stores the current Turtle System 2 status (LONG=1, SHORT=-1, FLAT=0) for the timeframes 1H, 4H, 8H, 1D, and 1W.Advantage: By persistently storing the status using the var variables, the critical error of single-update status is eliminated. The states shown in the table are reliable and accurately reflect the Turtle System's position status on the respective timeframes.3. Visual ComponentsDonchian Channels: The entry (55-period) and exit (20-period) channels are drawn with color highlighting.N-Stop Line: The dynamically calculated Trailing Stop ($\mathbf{2N}$) is displayed as a magenta line.Visual Signals: plotshape markers indicate Entry and Exit points.MTF Table: A compact status summary with color coding (Green/Red/Gray) for the higher timeframes is displayed in the upper right corner.
