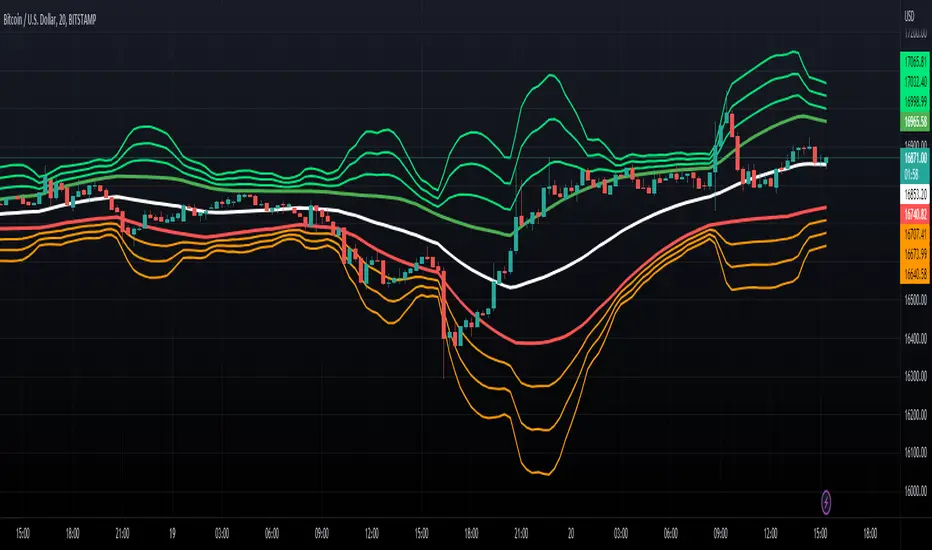
TSP Donchian EMADonchian with EMA
This show EMA of Donchain Channel (Highs and Lows)
It is nice to identify Support and Resistance, in range period
Should work well for scalp
This is a complement to Bollinger Bands
Pesquisar nos scripts por "donchian"
Donchian Channels Modified This indicator gives a Donchain Channel with different upper and lower limits, Use wisely.


Donchian Channel TestingConditions:
1. Centre line above close long entry, exit centre line below close.
2. Centre line below close short entry, exit centre line below close.
3. But For now I coded like Long Exit becomes entry for Short and vice versa
Have to further Update
[KVA]Donchian Channel Percentage" The 'Donchian Channel Percentage ' (DC%) indicator, developed for TradingView’s Pine Script Version 5, is a unique tool designed to measure the current price’s position within the Donchian Channel. The Donchian Channel, a popular indicator in technical analysis, is defined by the highest high and the lowest low over a user-specified period.
Key Features :
User-Defined Period: Users can customize the lookback period (default 20 periods), allowing flexibility in different trading styles and timeframes.
Channel Calculation: The upper and lower bounds of the Donchian Channel are calculated based on the highest high and lowest low over the chosen period.
Percentage Calculation: DC% quantifies where the current price lies within the channel, presented as a percentage. A value of 0% indicates the price at the channel's low, and 100% signifies the price at the high.
Visualization: The DC% is plotted as a line graph, providing a clear visual representation of the price’s relative position. The indicator includes horizontal lines at 0% and 100%, marked in red and green, respectively, to depict the channel's boundaries.
Market Analysis Tool: DC% offers insights into market trends and potential overbought or oversold conditions, making it a valuable addition for traders who focus on channel-based strategies.
Applications :
The DC% is particularly useful for identifying breakout scenarios and potential reversals.
Traders can use this tool in conjunction with other indicators to enhance their market analysis, especially in strategies that capitalize on price extremes within a defined range.
In summary, the Donchian Channel Percentage offers traders a simple yet powerful tool to gauge the current price’s position within a historical high-low range. Its adaptability across various assets and timeframes makes it a versatile addition to any technical trader’s toolkit."

Advanced Donchian Channels
Advanced Donchian Channels displays future donchian channel values based on the current information on the chart.
It displays a normal donchian channel at the specified user length with the future values extending from the current bar.
Depending on the direction of price movement, these values do not repaint. It is known when it does and does not repaint, and the actions are normal. See below for more information.
In a down trend, when the price is making new lows, the future "channel low" value will update every time the low is broken. The mean will also update, since the mean is the average of the channel high and channel low.
In a downtrend, the "channel high" value is concrete . It will not update until the high is broken.
Reverse these examples for uptrends.
Q;
How does it know the future values?
A:
Consider This: If we are below the current highest high, going down (aka: not setting new highs), the donchian channel "high" value will create a flat top, the flat top will start to decrease after we go further than our specified length. This is because the highest high within our specified length is no longer what it was previously. This action of time decay is a consistent movement of donchian channels . Because of this I am able to calculate these values before the current bar actually reaches them.
The indicator calculates the current length donchian channel at the current bar and then for every future bar up to your length specified it subtracts 1 from your length, calculates and displays the values accordingly.
The farthest future value is 1 length and the current bar is your specified length.
VALUES WILL ONLY BE UPDATED WHEN THE CHANNEL HIGH OR LOW IS BROKEN.
If price stays within the channel, all the future channel values will become solidified when the time reaches them.
This is not a gimmick, This data is accurate and can be used to help see future price trends
This chart should assist in visualizing what data you are seeing in this indicator.
Enjoy!

RSI-EMA-Crossing with Donchian-Stop-LossThe Donchian RSI Indicator is a visual tool that combines momentum and trend analysis to identify high-quality long opportunities based on RSI crossovers, price action, and Donchian channel dynamics.
How It Works
Momentum Signal: A bullish RSI crossover is detected when the RSI crosses above its moving average.
Trend Filter: A signal is only valid if the crossover occurs while the price is above its moving average – filtering out entries against the prevailing trend.
Signal Candle: The high of the crossover candle is stored.
Entry Trigger: A valid signal occurs when a later candle closes above that signal high.
Stop-Loss (Visual Only)
The lower band of the Donchian Channel acts as a visual reference for a dynamic stop-loss level.
Features
Customizable RSI, Donchian Channel, and moving average lengths
Selectable MA types: SMA, EMA, WMA, VWMA, HMA
Signal candle highlighted (yellow background)
Entry points labeled on the chart
Price MA and Donchian Channel plotted
Trend filter improves signal quality by confirming upward bias
Use Case
Designed for swing and position traders
Optimized for use on daily or 4H charts

ATR-limited Donchian ChannelThe ATR-limited Donchian Channel is a modified version of the classic Donchian Channel that adapts more quickly to changing market conditions.
While a traditional Donchian Channel is based only on the highest high and lowest low over a given lookback period, this version introduces an ATR-based constraint that prevents the channel lines from extending too far away from price. This makes the channel more responsive and reduces lag compared to the standard Donchian Channel.
How it works
The upper band is based on the highest high of the last N candles, but it cannot exceed a maximum distance of ATR × Factor above the current median price (midpoint of high and low).
The lower band is based on the lowest low of the last N candles, but it cannot drop more than ATR × Factor below the median price.
If the Donchian Channel would normally extend further than this ATR-limited boundary, the line is capped and marked in blue .
Otherwise, the upper band is drawn in red and the lower band in green .
A middle line is also plotted as the average of the modified upper and lower bands.
An optional offset allows you to shift the channel backward or forward in time for easier visual alignment.
Why use this version?
Faster reaction: By constraining the channel with ATR, the indicator adapts quicker to volatility changes and avoids long periods of overextended levels.
Noise control: ATR filtering prevents extreme spikes or outlier highs/lows from stretching the channel unnecessarily.
Visual clarity: Color-coding highlights when ATR filtering is active, making it easy to distinguish capped vs. natural Donchian levels.
Typical use cases
Trend-following breakout systems, but with volatility-aware limits.
Identifying dynamic support and resistance zones that adjust to market conditions.
Filtering false breakouts by monitoring when the Donchian channel is capped by ATR.
✅ This indicator is designed for traders who want the structure of a Donchian Channel but with an adaptive, volatility-sensitive adjustment that makes it react faster and more reliably than the classic version.

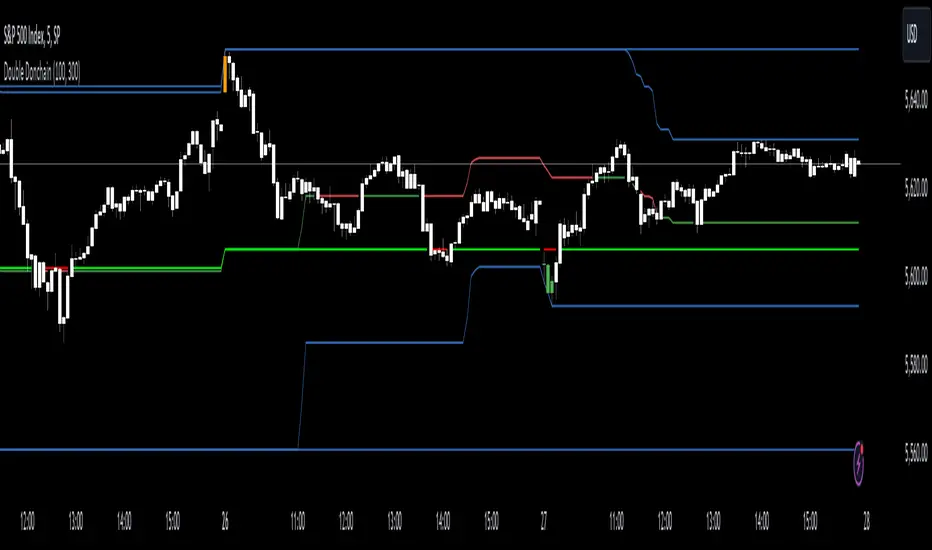
Double Donchian Channels [CrossTrade]Dual Channel System
The indicator incorporates two Donchian Channels - the Inner Channel and the Outer Channel. These channels are adjustable, allowing users to define their lengths according to their trading strategy.
Inner Channel: With a default length of 100 periods, the Inner Channel provides a closer view of market trends and potential support and resistance areas. It includes an upper, lower, and middle line (average of the upper and lower), offering detailed insights into shorter-term price movements.
Outer Channel: Set with a default length of 300 periods, the Outer Channel offers a broader perspective, ideal for identifying long-term trends and stronger levels of support and resistance.
Dynamic Color Coding: The middle lines of both channels change color based on the relationship between the previous close and the channel's basis. This feature provides an immediate visual cue regarding market sentiment.
Touching Bars Highlighting: The indicator highlights bars that touch the upper or lower bands of either channel. This is particularly useful for identifying potential reversals or continuation patterns.
Pullback Identification: By differentiating between bars that touch the Inner Channel only and those that touch the Outer Channel, the indicator helps in identifying pullbacks within a broader trend.
Customizable Alert System: Users can set up alerts for specific conditions - a bar touching the bottom band of the Inner Channel (green), the bottom band of the Outer Channel (blue), the upper band of the Inner Channel (red), and the upper band of the Outer Channel (orange). These alerts assist in timely decision-making and can be tailored to individual trading styles.
The indicator is a versatile tool designed to adapt to various trading styles and timeframes. Its features make it suitable for trend analysis, identifying potential reversal points, and understanding market volatility.
Lagged Donchian Channel + EMAThis strategy is based on a lagged 24 periods Donchian Channel and a 200 periods EMA .
The enter positions are calculated this way :
Bull entry
1. we wait for the close of a candle below the channel and it must be below the 200 EMA
2. the following candle must be a green one and close in the lagged channel
3. we put a long order at the close of the second candle, a stop loss at the low of last 3 candles and a x3 take profit
Bear entry
1. we wait for the close of a candle above the channel and it must be above the 200 EMA
2. the following candle must be a red one and close in the lagged channel
3. we put a short order at the close of the second candle, a stop loss at the high of last 3 candles and a x3 take profit
For both long or short positions :
If the order is not filled, it's cancelled if the price reach 50% of the TP or if the price reach the stop loss level
The position is closed if a new bear/bull condition appears in the other side of the position (if a bear appears when you're long and inversement)
Features :
Position calculator's included with leverage option
Labels of position can be plotted or not
Bull/Bear channels can be plotted with red and green filled
All parameters can be changed for backtesting
Better results have been got with defaults parameters on LTCUSDTPERP in H1 timeframe => profit factor of 2.84 with almost 100 positions.
Hope this strategy will be useful and it would be cool if I could get feedback, comments or better combinations of parameters !!
Don't hesitate to like and leave a comment ;)
@Mysteriown

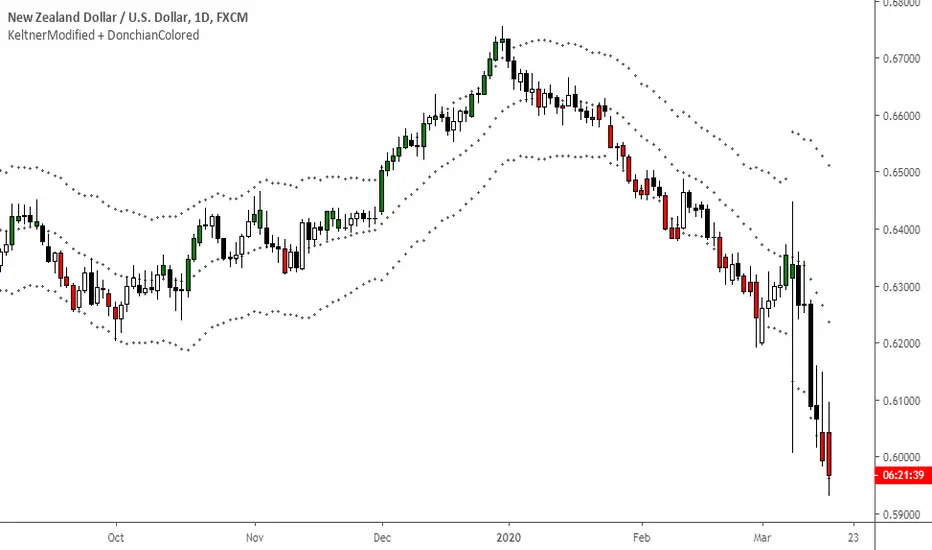
KeltnerModified + DonchianColoredKeltner Channel + color coded candles when making new Donchian highs/lows
RSI Donchian Channel [DCAUT]█ RSI Donchian Channel
📊 ORIGINALITY & INNOVATION
The RSI Donchian Channel represents an important synthesis of two complementary analytical frameworks: momentum oscillators and breakout detection systems. This indicator addresses a common limitation in traditional RSI analysis by replacing fixed overbought/oversold thresholds with adaptive zones derived from historical RSI extremes.
Key Enhancement:
Traditional RSI analysis relies on static threshold levels (typically 30/70), which may not adequately reflect changing market volatility regimes. This indicator adapts the reference zones dynamically based on the actual RSI behavior over the lookback period, helping traders identify meaningful momentum extremes relative to recent price action rather than arbitrary fixed levels.
The implementation combines the proven momentum measurement capabilities of RSI with Donchian Channel's breakout detection methodology, creating a framework that identifies both momentum exhaustion points and potential continuation signals through the same analytical lens.
📐 MATHEMATICAL FOUNDATION
Core Calculation Process:
Step 1: RSI Calculation
The Relative Strength Index measures momentum by comparing the magnitude of recent gains to recent losses:
Calculate price changes between consecutive periods
Separate positive changes (gains) from negative changes (losses)
Apply selected smoothing method (RMA standard, also supports SMA, EMA, WMA) to both gain and loss series
Compute Relative Strength (RS) as the ratio of smoothed gains to smoothed losses
Transform RS into bounded 0-100 scale using the formula: RSI = 100 - (100 / (1 + RS))
Step 2: Donchian Channel Application
The Donchian Channel identifies the highest and lowest RSI values within the specified lookback period:
Upper Channel: Highest RSI value over the lookback period, represents the recent momentum peak
Lower Channel: Lowest RSI value over the lookback period, represents the recent momentum trough
Middle Channel (Basis): Average of upper and lower channels, serves as equilibrium reference
Channel Width Dynamics:
The distance between upper and lower channels reflects RSI volatility. Wide channels indicate high momentum variability, while narrow channels suggest momentum consolidation and potential breakout preparation. The indicator monitors channel width over a 100-period window to identify squeeze conditions that often precede significant momentum shifts.
📊 COMPREHENSIVE SIGNAL ANALYSIS
Primary Signal Categories:
Breakout Signals:
Upper Breakout: RSI crosses above the upper channel, indicates momentum reaching new relative highs and potential trend continuation, particularly significant when accompanied by price confirmation
Lower Breakout: RSI crosses below the lower channel, suggests momentum reaching new relative lows and potential trend exhaustion or reversal setup
Breakout strength is enhanced when the channel is narrow prior to the breakout, indicating a transition from consolidation to directional movement
Mean Reversion Signals:
Upper Touch Without Breakout: RSI reaches the upper channel but fails to break through, may indicate momentum exhaustion and potential reversal opportunity
Lower Touch Without Breakout: RSI reaches the lower channel without breakdown, suggests potential bounce as momentum reaches oversold extremes
Return to Basis: RSI moving back toward the middle channel after touching extremes signals momentum normalization
Trend Strength Assessment:
Sustained Upper Channel Riding: RSI consistently remains near or above the upper channel during strong uptrends, indicates persistent bullish momentum
Sustained Lower Channel Riding: RSI stays near or below the lower channel during strong downtrends, reflects persistent bearish pressure
Basis Line Position: RSI position relative to the middle channel helps identify the prevailing momentum bias
Channel Compression Patterns:
Squeeze Detection: Channel width narrowing to 100-period lows indicates momentum consolidation, often precedes significant directional moves
Expansion Phase: Channel widening after a squeeze confirms the initiation of a new momentum regime
Persistent Narrow Channels: Extended periods of tight channels suggest market indecision and accumulation/distribution phases
🎯 STRATEGIC APPLICATIONS
Trend Continuation Strategy:
This approach focuses on identifying and trading momentum breakouts that confirm established trends:
Identify the prevailing price trend using higher timeframe analysis or trend-following indicators
Wait for RSI to break above the upper channel in uptrends (or below the lower channel in downtrends)
Enter positions in the direction of the breakout when price action confirms the momentum shift
Place protective stops below the recent swing low (long positions) or above swing high (short positions)
Target profit levels based on prior swing extremes or use trailing stops to capture extended moves
Exit when RSI crosses back through the basis line in the opposite direction
Mean Reversion Strategy:
This method capitalizes on momentum extremes and subsequent corrections toward equilibrium:
Monitor for RSI reaching the upper or lower channel boundaries
Look for rejection signals (price reversal patterns, volume divergence) when RSI touches the channels
Enter counter-trend positions when RSI begins moving back toward the basis line
Use the basis line as the initial profit target for mean reversion trades
Implement tight stops beyond the channel extremes to limit risk on failed reversals
Scale out of positions as RSI approaches the basis line and closes the position when RSI crosses the basis
Breakout Preparation Strategy:
This approach positions traders ahead of potential volatility expansion from consolidation phases:
Identify squeeze conditions when channel width reaches 100-period lows
Monitor price action for consolidation patterns (triangles, rectangles, flags) during the squeeze
Prepare conditional orders for breakouts in both directions from the consolidation
Enter positions when RSI breaks out of the narrow channel with expanding width
Use the channel width expansion as a confirmation signal for the breakout's validity
Manage risk with stops just inside the opposite channel boundary
Multi-Timeframe Confluence Strategy:
Combining RSI Donchian Channel analysis across multiple timeframes can improve signal reliability:
Identify the primary trend direction using a higher timeframe RSI Donchian Channel (e.g., daily or weekly)
Use a lower timeframe (e.g., 4-hour or hourly) to time precise entry points
Enter long positions when both timeframes show RSI above their respective basis lines
Enter short positions when both timeframes show RSI below their respective basis lines
Avoid trades when timeframes provide conflicting signals (e.g., higher timeframe below basis, lower timeframe above)
Exit when the higher timeframe RSI crosses its basis line in the opposite direction
Risk Management Guidelines:
Effective risk management is essential for all RSI Donchian Channel strategies:
Position Sizing: Calculate position sizes based on the distance between entry point and stop loss, limiting risk to 1-2% of capital per trade
Stop Loss Placement: For breakout trades, place stops just inside the opposite channel boundary; for mean reversion trades, use stops beyond the channel extremes
Profit Targets: Use the basis line as a minimum target for mean reversion trades; for trend trades, target prior swing extremes or use trailing stops
Channel Width Context: Increase position sizes during narrow channels (lower volatility) and reduce sizes during wide channels (higher volatility)
Correlation Awareness: Monitor correlations between traded instruments to avoid over-concentration in similar setups
📋 DETAILED PARAMETER CONFIGURATION
RSI Source:
Defines the price data series used for RSI calculation:
Close (Default): Standard choice providing end-of-period momentum assessment, suitable for most trading styles and timeframes
High-Low Average (HL2): Reduces the impact of closing auction dynamics, useful for markets with significant end-of-day volatility
High-Low-Close Average (HLC3): Provides a more balanced view incorporating the entire period's range
Open-High-Low-Close Average (OHLC4): Offers the most comprehensive price representation, helpful for identifying overall period sentiment
Strategy Consideration: Use Close for end-of-period signals, HL2 or HLC3 for intraday volatility reduction, OHLC4 for capturing full period dynamics
RSI Length:
Controls the number of periods used for RSI calculation:
Short Periods (5-9): Highly responsive to recent price changes, produces more frequent signals with increased false signal risk, suitable for short-term trading and volatile markets
Standard Period (14): Widely accepted default balancing responsiveness with stability, appropriate for swing trading and intermediate-term analysis
Long Periods (21-28): Produces smoother RSI with fewer signals but more reliable trend identification, better for position trading and reducing noise in choppy markets
Optimization Approach: Test different lengths against historical data for your specific market and timeframe, consider using longer periods in ranging markets and shorter periods in trending markets
RSI MA Type:
Determines the smoothing method applied to price changes in RSI calculation:
RMA (Relative Moving Average - Default): Wilder's original smoothing method providing stable momentum measurement with gradual response to changes, maintains consistency with classical RSI interpretation
SMA (Simple Moving Average): Treats all periods equally, responds more quickly to changes than RMA but may produce more whipsaws in volatile conditions
EMA (Exponential Moving Average): Weights recent periods more heavily, increases responsiveness at the cost of potential noise, suitable for traders prioritizing early signal generation
WMA (Weighted Moving Average): Applies linear weighting favoring recent data, offers a middle ground between SMA and EMA responsiveness
Selection Guidance: Maintain RMA for consistency with traditional RSI analysis, use EMA or WMA for more responsive signals in fast-moving markets, apply SMA for maximum simplicity and transparency
DC Length:
Specifies the lookback period for Donchian Channel calculation on RSI values:
Short Periods (10-14): Creates tight channels that adapt quickly to changing momentum conditions, generates more frequent trading signals but increases sensitivity to short-term RSI fluctuations
Standard Period (20): Balances channel responsiveness with stability, aligns with traditional Bollinger Bands and moving average periods, suitable for most trading styles
Long Periods (30-50): Produces wider, more stable channels that better represent sustained momentum extremes, reduces signal frequency while improving reliability, appropriate for position traders and higher timeframes
Calibration Strategy: Match DC length to your trading timeframe (shorter for day trading, longer for swing trading), test channel width behavior during different market regimes, consider using adaptive periods that adjust to volatility conditions
Market Adaptation: Use shorter DC lengths in trending markets to capture momentum shifts earlier, apply longer periods in ranging markets to filter noise and focus on significant extremes
Parameter Combination Recommendations:
Scalping/Day Trading: RSI Length 5-9, DC Length 10-14, EMA or WMA smoothing for maximum responsiveness
Swing Trading: RSI Length 14, DC Length 20, RMA smoothing for balanced analysis (default configuration)
Position Trading: RSI Length 21-28, DC Length 30-50, RMA or SMA smoothing for stable signals
High Volatility Markets: Longer RSI periods (21+) with standard DC length (20) to reduce noise
Low Volatility Markets: Standard RSI length (14) with shorter DC length (10-14) to capture subtle momentum shifts
📈 PERFORMANCE ANALYSIS & COMPETITIVE ADVANTAGES
Adaptive Threshold Mechanism:
Unlike traditional RSI analysis with fixed 30/70 thresholds, this indicator's Donchian Channel approach provides several improvements:
Context-Aware Extremes: Overbought/oversold levels adjust automatically based on recent momentum behavior rather than arbitrary fixed values
Volatility Adaptation: In low volatility periods, channels narrow to reflect tighter momentum ranges; in high volatility, channels widen appropriately
Market Regime Recognition: The indicator implicitly adapts to different market conditions without manual threshold adjustments
False Signal Reduction: Adaptive channels help reduce premature reversal signals that often occur with fixed thresholds during strong trends
Signal Quality Characteristics:
The indicator's dual-purpose design provides distinct advantages for different trading objectives:
Breakout Trading: Channel boundaries offer clear, objective breakout levels that update dynamically, eliminating the ambiguity of when momentum becomes "too high" or "too low"
Mean Reversion: The basis line provides a natural profit target for reversion trades, representing the midpoint of recent momentum extremes
Trend Strength: Persistent channel boundary riding offers an objective measure of trend strength without additional indicators
Consolidation Detection: Channel width analysis provides early warning of potential volatility expansion from compression phases
Comparative Analysis:
When compared to traditional RSI implementations and other momentum frameworks:
vs. Fixed Threshold RSI: Provides market-adaptive reference levels rather than static values, helping to reduce false signals during trending markets where RSI can remain "overbought" or "oversold" for extended periods
vs. RSI Bollinger Bands: Offers clearer breakout signals and more intuitive extreme identification through actual high/low boundaries rather than statistical standard deviations
vs. Stochastic Oscillator: Maintains RSI's momentum measurement advantages (unbounded calculation avoiding scale compression) while adding the breakout detection capabilities of Donchian Channels
vs. Standard Donchian Channels: Applies breakout methodology to momentum space rather than price, providing earlier signals of potential trend changes before price breakouts occur
Performance Characteristics:
The indicator exhibits specific behavioral patterns across different market conditions:
Trending Markets: Excels at identifying momentum continuation through channel breakouts, RSI tends to ride one channel boundary during strong trends, providing trend confirmation
Ranging Markets: Channel width narrows during consolidation, offering early preparation signals for potential breakout trading opportunities
High Volatility: Channels widen to reflect increased momentum variability, automatically adjusting signal sensitivity to match market conditions
Low Volatility: Channels contract, making the indicator more sensitive to subtle momentum shifts that may be significant in calm market environments
Transition Periods: Channel squeezes often precede major trend changes, offering advance warning of potential regime shifts
Limitations and Considerations:
Users should be aware of certain operational characteristics:
Lookback Dependency: Channel boundaries depend entirely on the lookback period, meaning the indicator has no predictive element beyond identifying current momentum relative to recent history
Lag Characteristics: As with all moving average-based indicators, RSI calculation introduces lag, and channel boundaries update only as new extremes occur within the lookback window
Range-Bound Sensitivity: In extremely tight ranges, channels may become very narrow, potentially generating excessive signals from minor momentum fluctuations
Trending Persistence: During very strong trends, RSI may remain at channel extremes for extended periods, requiring patience for mean reversion setups or commitment to trend-following approaches
No Absolute Levels: Unlike traditional RSI, this indicator provides no fixed reference points (like 50), making it less suitable for strategies that depend on absolute momentum readings
USAGE NOTES
This indicator is designed for technical analysis and educational purposes to help traders understand momentum dynamics and identify potential trading opportunities. The RSI Donchian Channel has limitations and should not be used as the sole basis for trading decisions.
Important considerations:
Performance varies significantly across different market conditions, timeframes, and instruments
Historical signal patterns do not guarantee future results, as market behavior continuously evolves
Effective use requires understanding of both RSI momentum principles and Donchian Channel breakout concepts
Risk management practices (stop losses, position sizing, diversification) are essential for any trading application
Consider combining with additional analytical tools such as volume analysis, price action patterns, or trend indicators for confirmation
Backtest thoroughly on your specific instruments and timeframes before live trading implementation
Be aware that optimization on historical data may lead to curve-fitting and poor forward performance
The indicator performs best when used as part of a comprehensive trading methodology that incorporates multiple forms of market analysis, sound risk management, and realistic expectations about win rates and drawdowns.

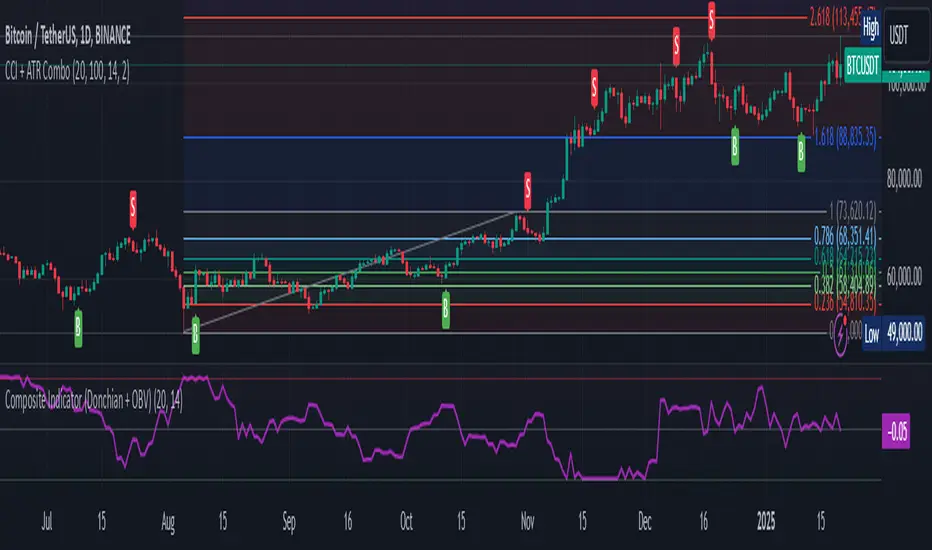
Composite Indicator (Donchian + OBV)Composite Indicator (Donchian + OBV)
The Composite Indicator (Donchian + OBV) is a powerful tool designed to evaluate the strength of market breakouts and momentum trends , offering traders a comprehensive perspective on price action. This indicator combines the Donchian Channel with On-Balance Volume (OBV) to create a dynamic and easy-to-interpret metric scaled between -1 and 1 .
Key Features
Breakout Strength Analysis:
- The indicator assesses the strength of price breakouts relative to the upper and lower bounds of the Donchian Channel.
- Positive values close to 1 indicate a strong bullish breakout.
- Negative values close to -1 indicate a strong bearish breakout.
Momentum Detection with OBV:
- On-Balance Volume (OBV) tracks the cumulative buying and selling volume to gauge market momentum.
- The smoothed OBV trend ensures the momentum component aligns with price action, reducing noise.
Integrated Composite Value:
- Combines breakout strength and OBV momentum into a single metric for enhanced clarity.
- The final composite value highlights whether the market is bullish, bearish, or neutral.
Divergence Detection:
- Spot bullish divergences when the indicator rises while price falls, suggesting a potential upward reversal.
- Identify bearish divergences when the indicator falls while price rises, hinting at a potential downward reversal.
How It Works
Donchian Channel Analysis:
- Calculates the highest high and lowest low over a user-defined period to establish the upper and lower channels .
- Breakouts beyond these channels contribute to the breakout strength component.
OBV Momentum:
- Measures cumulative volume trends to validate price movements.
- Momentum is derived from the rate of change in smoothed OBV values.
Composite Calculation:
- Combines breakout strength and OBV momentum, normalized and scaled to -1 to 1 for clarity.
How to Use
Bullish Breakout:
- When the indicator value approaches 1 , it signals a strong upward breakout supported by positive OBV momentum.
- Example Action: Consider a Buy if price breaks the upper Donchian Channel with increasing OBV.
Bearish Breakout:
- When the indicator value approaches -1 , it indicates a strong downward breakout supported by negative OBV momentum.
- Example Action: Consider a Sell if price breaks the lower Donchian Channel with decreasing OBV.
Neutral Market:
- When the value is near 0 , the market is likely balanced with no significant breakout or momentum detected.
Divergence Opportunities:
- Bullish Divergence: Price makes lower lows, but the indicator trends upward → Potential upward reversal.
- Bearish Divergence: Price makes higher highs, but the indicator trends downward → Potential downward reversal.
Customization Options
Donchian Channel Length: Adjust the period for the upper and lower bounds.
OBV Smoothing Length: Modify the smoothing period for OBV to fine-tune momentum detection.
Scaling Adjustments: The composite value is automatically normalized for consistency across timeframes.
Ideal Use Cases
Breakout Trading: Identify and confirm strong breakouts in volatile markets.
Momentum Confirmation: Validate price movements with volume-based momentum.
Reversal Detection: Leverage divergences to spot potential market reversals.
Example Applications
Strong Bullish Signal:
- Price breaks the upper channel , and OBV shows increasing volume → Composite value near 1 .
- Action: Enter a Buy position and set a Stop Loss below the upper channel.
Strong Bearish Signal:
- Price breaks the lower channel , and OBV shows decreasing volume → Composite value near -1 .
- Action: Enter a Sell position and set a Stop Loss above the lower channel.
Neutral Market:
- Composite value near 0 suggests indecision or consolidation. Wait for a breakout.
Limitations
Best used alongside additional tools like RSI or MACD for filtering noise and improving decision-making.
Requires careful parameter tuning based on the asset and timeframe.
Final Thoughts
The Composite Indicator (Donchian + OBV) offers traders a versatile tool to navigate complex markets. By blending breakout analysis with volume-based momentum, this indicator provides an actionable edge for identifying high-probability opportunities and potential reversals.
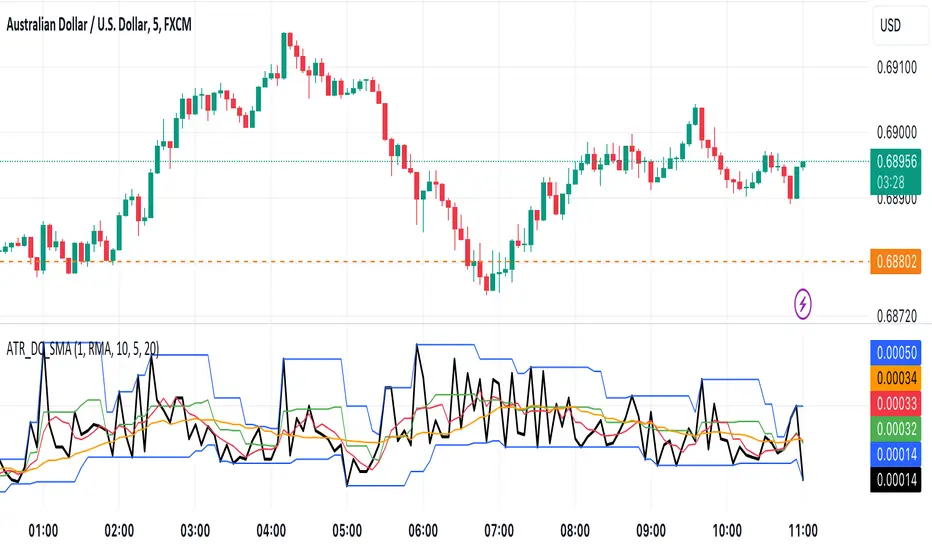
ATR with Donchian Channels and SMAsThis script combines the Average True Range (ATR), Donchian Channels, and Simple Moving Averages (SMAs) to provide a comprehensive tool for volatility and trend analysis.
Key Components:
ATR Calculation: The ATR is used to measure market volatility. It is calculated as a moving average of the true range over a specified length, which you can customize using different smoothing methods: RMA, SMA, EMA, or WMA. ATR helps identify periods of high and low volatility, giving insights into potential breakout or consolidation phases in the market.
Donchian Channels on ATR: The Donchian Channels are calculated based on the highest and lowest values of the ATR over a user-defined period. The upper and lower bands provide a volatility range, and the middle line represents the average of the two. This can help visualize the range of market volatility and detect possible trend reversals or continuations.
SMAs on ATR: Two Simple Moving Averages (SMA) are applied to the ATR values. These SMAs act as a smoothed version of the ATR, providing additional insight into volatility trends. By adjusting the length of these SMAs, you can track short-term and long-term volatility movements, helping in decision-making for potential entries and exits.
Inputs:
ATR Length: Set the length for calculating the ATR.
Smoothing Method: Choose from RMA, SMA, EMA, or WMA for smoothing the ATR calculation.
Donchian Channel Length: Set the length for calculating the highest and lowest ATR values for Donchian Channels.
SMA Lengths: Two adjustable lengths for applying SMAs to the ATR.
Visualization:
ATR Plot: The ATR is plotted in red, allowing you to see the market's volatility at a glance.
Donchian Channels: Blue lines represent the upper and lower bands, while the green line represents the middle line of the Donchian Channels, helping you visualize the volatility range.
SMAs: Two SMAs (green and orange) are plotted to smooth out the ATR and identify trends in volatility.
Use Cases:
Breakout Detection: High ATR values breaking out of the Donchian Channels may signal increased volatility and a potential breakout.
Trend Analysis: SMAs on ATR help smooth volatility trends, aiding in determining if the market is entering a more volatile or stable period.
Stop-Loss Placement: ATR and Donchian Channels can be used to set dynamic stop-loss levels based on market volatility.
This script is versatile and can be used across different asset classes, such as stocks, forex, crypto, and commodities. It is especially useful for traders who want to incorporate volatility into their trading strategies for better risk management and trend detection.
Bars Above/Below Donchian Channel [ScalpTradr]"Bars Above/Below Donchian Channel" provides a visualization of the Donchian Channel and measures the number of bars above and below the middle line of the channel.
The Donchian Channel is a trading indicator that outlines the highest high and the lowest low over a defined number of periods, in this case set by the variable "length". This indicator script specifically also calculates the 'basis', which is the average of the upper and lower channels of the Donchian Channel.
When the closing price of a bar is above the 'basis', the script increases a counter for "aboveCount" and adds a label on the chart to show how many bars have closed above the 'basis'. This label is green and it's always placed at the high price of the bar. Conversely, when the closing price is below the 'basis', it increases a counter for "belowCount" and adds a red label on the chart to show how many bars have closed below the 'basis'. This label is placed at the lower_channel level.
This script can be useful for traders who use the Donchian Channel as a part of their trading strategy. The number of bars closing above or below the 'basis' can provide insights into the ongoing trend. A higher count of bars closing above the 'basis' can be interpreted as a bullish signal, suggesting an upward trend. Similarly, a higher count of bars closing below the 'basis' can be interpreted as a bearish signal, suggesting a downward trend
I hope you find this indicator useful.
Enjoy.

Turtle 20-Day Breakout (Donchian)Yes, the most important indicator used in the Turtle Rules (Turtle Trading Strategy) for finding breakouts above previous highs is the Donchian Channel. 🐢📈
Donchian Channel
The Donchian Channel is a trend-following indicator composed of three lines plotted on the chart:
Shutterstock
Upper Band: The highest high over the defined number of periods.
Lower Band: The lowest low over the defined number of periods.
Middle Line: The average of the Upper and Lower bands (not always used, but sometimes added for orientation).
The Turtle Rules use the following periods for the entry signals (breakouts) you mentioned in your query:
Short-Term (System 1): Crossing the 20-day high (this corresponds to the upper band of a Donchian Channel with a 20-period setting).
Mid-Term/Long-Term (System 2): Crossing the 55-day high (this corresponds to the upper band of a Donchian Channel with a 55-period setting).
Crossing the upper band signals a breakout and serves as the buy signal for a long position (for short positions, crossing below the lower band is used).
Is there anything else I can translate for you, or would you like me to elaborate on the Average True Range (ATR), the other key indicator used by the Turtles?

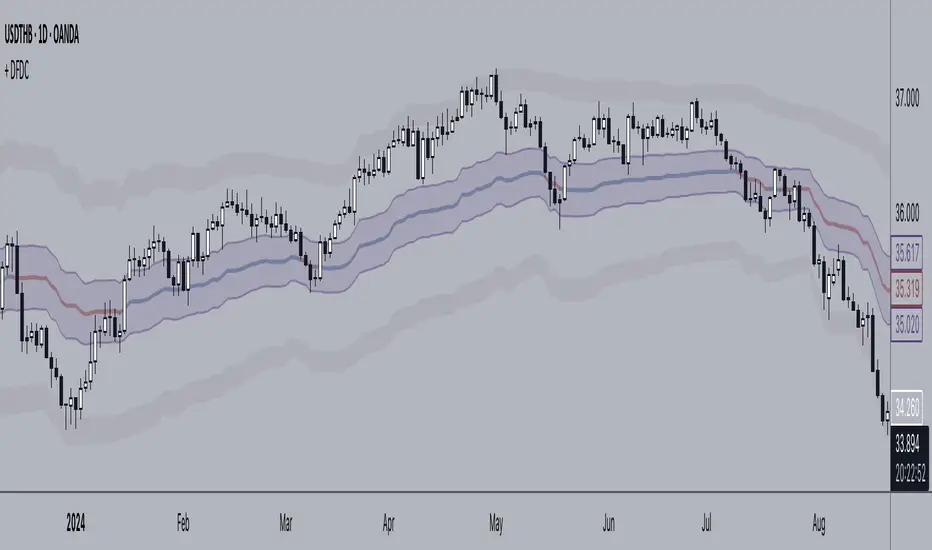
+ Dynamic Fibo-Donchian ChannelsThis is my second Donchian Channels indicator (and will probably be my last because how many does one really need). This version is different from my other one in that, well, it's 'dynamic' which simply means that it self adjusts based on the same formula that my Ultimate Moving Average does. What does that mean? It just means that the script takes an average of 8 different length, in this case, highest highs and lowest lows. The user doesn't need to pick a lookback/length/period/what-have-you. The indicator does it all itself. This, I think, makes for a very nice baseline or bias indicator to fit within a system that utilizes something like that. I also think it makes for a more accurate gauge of higher highs and lower lows within a timeframe, because honestly what does it mean to make a lower low over 20 periods or 8 periods or 50 periods? I don't know. What I do know is that traditional Donchian Channels never made much sense to me, but this does.
Additionally, I've kept (I guess that's not 'additionally') the fibonacci retracement levels from my other Donchian Channels indicator. These are calculated off the high and the low of the Donchian Channels themselves. You will see that there are only three retracement levels (.786, .705, .382), one of which is not a fib level, but what some people call the 'OTE,' or 'optimal trade entry.'' If you want more info on the OTE just web search it. So, why no .618 or .236? Reason being that the .618 overlaps the .382, and the .236 is extremely close to the .786. This sounds confusing, but the retracement levels I'm using are derived from the high and low, so it was unnecessary to have all five levels from each. I could have just calculated from the high, or just from the low, and used all the levels, but I chose to just calculate three levels from the high and three from the low because that gives a sort of mirror image balance, and that appeals to me, and the utility of the indicator is the same.
The plot lines are all colored, and I've filled certain zones between them. There is a center zone filled between both .382 levels, an upper and lower zon filled between the .786 and either the high or the low, and a zone between the .705 and .785
If you like the colored zones, but don't like the plots because they cause screen compression, turn off the plots under the "style" tab, or much more simply right click on the price scale and click 'scale price chart only.' Voila! No more screen compression due to a moving average or some other annoyance.
Besides that basis being a nice baseline indicator the various fib bands (or just the high and low bands) make for excellent mean reversion extremes in ranging environments.
There are alerts for candle closes across every line.
Below is an image of the indicator at default settings.
Below is an image of the indicator with the center .382 channel turned off.
Below is an image of the indicator with just the .786/.705 channel showing .
Combo Backtest 123 Reversal & Donchian Channel Width This is combo strategies for get a cumulative signal.
First strategy
This System was created from the Book "How I Tripled My Money In The
Futures Market" by Ulf Jensen, Page 183. This is reverse type of strategies.
The strategy buys at market, if close price is higher than the previous close
during 2 days and the meaning of 9-days Stochastic Slow Oscillator is lower than 50.
The strategy sells at market, if close price is lower than the previous close price
during 2 days and the meaning of 9-days Stochastic Fast Oscillator is higher than 50.
Second strategy
The Donchian Channel was developed by Richard Donchian and it could be compared
to the Bollinger Bands. When it comes to volatility analysis, the Donchian Channel
Width was created in the same way as the Bollinger Bandwidth technical indicator was.
As was mentioned above the Donchian Channel Width is used in technical analysis to measure
volatility. Volatility is one of the most important parameters in technical analysis.
A price trend is not just about a price change. It is also about volume traded during this
price change and volatility of a this price change. When a technical analyst focuses his/her
attention solely on price analysis by ignoring volume and volatility, he/she only sees a part
of a complete picture only. This could lead to a situation when a trader may miss something and
lose money. Lets take a look at a simple example how volatility may help a trader:
Most of the price based technical indicators are lagging indicators.
When price moves on low volatility, it takes time for a price trend to change its direction and
it could be ok to have some lag in an indicator.
When price moves on high volatility, a price trend changes its direction faster and stronger.
An indicator's lag acceptable under low volatility could be financially suicidal now - Buy/Sell signals could be generated when it is already too late.
Another use of volatility - very popular one - it is to adapt a stop loss strategy to it:
Smaller stop-loss recommended in low volatility periods. If it is not done, a stop-loss could
be generated when it is too late.
Bigger stop-loss recommended in high volatility periods. If it is not done, a stop-loss could
be triggered too often and you may miss good trades.
WARNING:
- For purpose educate only
- This script to change bars colors.

Rumpy's Donchian Anchored VWAPUses donchian points to anchor VWAPs (start a new VWAP interval). The defaults are set up for a 1H chart, with lookback periods of 1 day, 2 days, 1 week, 2 weeks and 4 weeks for the anchor points.
Green : upper donchian AVWAPs, Red : lower donchian AVWAPS, thin/1day to thickest/4 week.
Option to test whether a new point should be formed from a high or low exceeding the historical high/low over a lookback length or using a closes that exceed the historical high/low.
--------------------------------------
If you find it useful please consider a tip/donation :
BTC - 3BMEXEDyWJ58eXUEALYPadbn1wwWKmf6sA

SALEH MACD Donchian + EMA & MACD + ADXI gathered all the signals coming from the MACD & Donchian channels indicators and filtered them with EMA 200 or ADX > 25 indicators (which both of them show the trend),
and put them on the chart to show me the buy and sell signals;
the signals rules are as following:
BUY:
when we have an uptrend ( the price is above the EMA 200 or ADX > 25 ) & the macd line cross up the signal line while they are both under the 0 level of histogram it generates buy signals.
SELL:
when we have a downtrend ( the price is below the EMA 200 or ADX > 25) & the macd line cross below the signal line while they are both above the 0 level of histogram it generates sell signals.
Donchian channel works as a confirmation for the macd signal.
this signals work best at London session, you can also filter them by chandelier exit indicator.

Adaptive Donchian ChannelThis indicator adds a level of adaptivity to the simple Donchian Channel by adjusting the sensitivity (lookback periods) of the channel's upper and lower bounds based on the amount of time that has elapsed since the price has hit/expanded the channel boundaries. Comparing the results of this indicator to the standard Donchian Channel, the readier level of responsiveness may prove self-evident.
METHODOLOGY:
Specifically, the more recently the channel was expanded in one direction, the longer the lookback period grows in that direction. Conversely, if the channel has not been expanded in a given direction, the lookback period will contract so as to allow for a tighter channel.
For example, let the initial lookback period be 20 bars and let the factor argument be 0.1 (or 2 bars to start, as 20*0.1 = 2). Now say the current bar sets a new 20-period high. Then the lookback period for the upper bound is expanded by 2 bars to 22, and the lookback period for the lower bound is contracted by 2 bars to 18, thereby making it simultaneously harder to set new highs and easier to set new lows (and vice versa for hitting new lows). If neither a new high nor a new low is formed, both periods contract by the given factor.

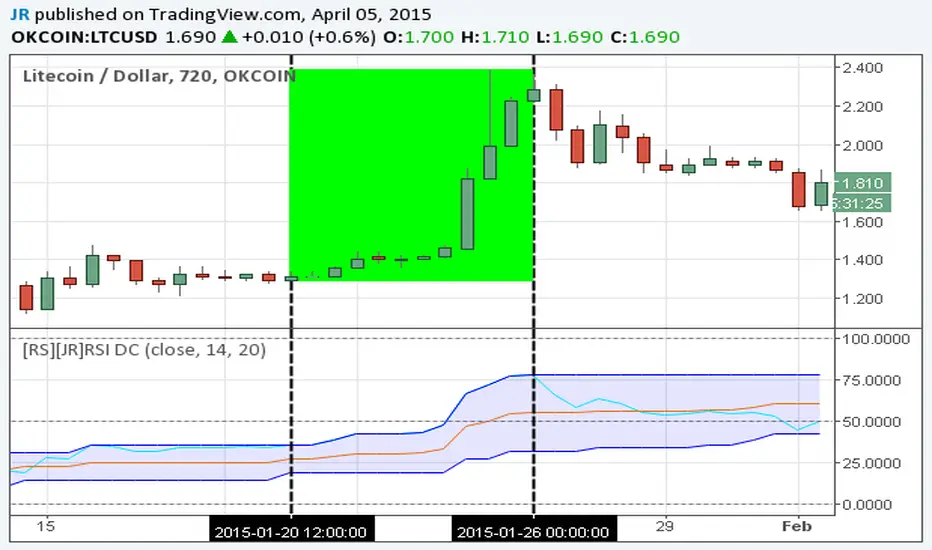
[RS][JR]RSI Donchian ChannelsRSI Donchian Channels
Built by Ricardo and JR
Here is a great indicator to use for strong trends. Donchian Channels react immediately to changes in the highest high and lowest low. For strong trends you want to trade when RSI is set along the upper or lower DC-RSI envelope. When the RSI releases from the DC-RSI envelope, you can take the trade off.
McGinley Dynamic x Donchian ChannelsThis indicator combines the McGinley Dynamic and Donchian Channels by taking the lowest and highest values over a set length (defaulted to 14) then applying the McGinley Dynamic math to these values. The upper range is denoted by a green line while the lower range is denoted by a red line. Additionally, standard deviations of 1, 2, and 3 have been put in place using the upper and lower values as the basis for the deviations as opposed to the baseline average of the upper and lower bands. These deviations are plotted as lime and orange colors. These channels can be used to determine when the price is gaining or losing momentum based on the distance between the channels. Otherwise, the channels can be used to determine potential overbought and oversold levels.