Timeframe LiquidityTimeframe Liquidity – Multi-Timeframe Highs & Lows by
Timeframe Liquidity automatically plots previous day, week, month, and year highs and lows, key liquidity zones used by smart money and price-action traders. These levels extend into the future and can automatically stop once price wicks through, showing clear liquidity sweeps and tested zones.
Perfect for traders using ICT / SMC concepts, liquidity theory, or market structure analysis. Instantly see where liquidity rests, where it’s been taken, and how price reacts at major support and resistance.
Features:
Auto-plots PDH/PDL, PWH/PWL, PMH/PML, PYH/PYL
Custom line styles, colors, and label sizes
Option to stop line on wick (liquidity sweep)
Smart timeframe visibility (hides same-TF levels)
Accurate UTC offset handling
Identify liquidity pools fast, trade cleaner charts, and track where smart money hunts liquidity.
Built for precision, clarity, and confluence.
Pesquisar nos scripts por "daily"

RD-DynamicTSMADescription of the RD-DynamicTSMA Pine Script Indicator:
This single indicator dynamically adjusts the three SMAs to key periods used by professional traders across timeframes:
Daily: 10, 21, 50 periods (standard for swing trading trends).
Weekly+: 10, 21, 30 periods (optimized for positional & longer-term views).
Lengths auto-update on timeframe switches.

Triple-EMA Cloud (3× configurable EMAs + timeframe + fill)About This Script
Name: Triple-EMA Cloud (3× configurable EMAs + timeframe + fill)
What it does:
The script plots three Exponential Moving Averages (EMAs) on your chart.
You can set each EMA’s length (how many bars or days it averages over), source (for example, closing price, opening price, or the midpoint of high + low), and timeframe (you can have one EMA use daily data, another hourly data, etc.).
The indicator draws a “cloud” or channel by shading the area between the outermost two EMAs of the three. This lets you see a band or zone that the price is moving in, defined by those EMAs.
You also get full control over how each of the three EMA‐lines looks: color, thickness, transparency, and plot style (solid line, steps, circles, etc.).
How to Use It (for Beginners)
Here’s how a trader who’s new to charts can use this tool, especially when looking for pullbacks or undercut price action.
Key Concepts
Trend: Imagine the market price is generally going up or down. EMAs are a way to smooth out price movements so you can see the trend more clearly.
Pullback: When a price has been going up (an uptrend), sometimes it dips down a little before going up again. That dip is the pullback. It’s a chance to enter or add to a position at a “better price.”
Undercut: This is when price drops below an important level (for example an EMA) and then comes back up. It looks like it broke below, but then it recovers. That may show reverse pressure or strength building.
How the Script Helps With Pullbacks & Undercuts
Marking Trend Zones with the Cloud
The cloud between the outer EMA lines gives you a zone of expected support/resistance. If the price is above the cloud, that zone can act like a “floor” in uptrends; if it is below, the cloud might act like a “ceiling” in downtrends.
Watching Price vs the EMAs
If the price pulls back toward the cloud (or toward one of the EMAs) and then bounces back up, that’s a signal that the uptrend might continue.
If the price undercuts (goes a bit below) one of the EMAs or the cloud and then returns above it, that can also be a signal. It suggests that even though there was a temporary drop, buyers stepped in.
Using the Three EMAs for Confirmation
Because the script uses three EMAs, you can see how tightly or loosely they are spaced.
If all three EMAs are broadly aligned (for example, in an uptrend: shorter length above longer length, each pulling from reliable price source), that gives more confidence in trend strength.
If the middle EMA (or different source/timeframe) is holding up as support while others are above, it strengthens signal.
Entry & Exit Points
Entry: For example, after a pullback toward the cloud or “mid‐EMA”, wait for price to show a bounce up. That could be a better entry than buying at the top.
Stop Loss / Risk: You might place a stop loss just below the cloud or the lowest of your selected EMAs so that if price breaks through, the idea is invalidated.
Profit Target: Could be a recent high, resistance level, or a fixed reward-risk multiple (for example aiming to make twice what you risked).
Practical Steps for New Traders
Set up the EMAs
Choose simple lengths like 10, 21, 50.
For example, EMA #1 = length 10, source Close, timeframe “current chart”; EMA #2 = length 21, source (H+L)/2; EMA #3 = length 50, maybe timeframe daily.
Observe the Price Action
When price moves up, then dips, see if it comes back near the shaded cloud or one of the EMAs.
See if the dip touches the EMAs lightly (not a big drop) and then price starts climbing again.
Look for undercuts
If price briefly goes below a line (or below cloud) and then closes back above, that’s undercut + recovery. That bounce back is often meaningful.
Manage risk
Only put in money you can afford to lose.
Use small position size until you get comfortable.
Use stop-loss (as mentioned) in case the price doesn’t bounce as expected.
Practice
Put this indicator on charts (stocks you follow) in past time periods. See how price behaved with pullbacks / undercuts relative to the EMAs & cloud. This helps you learn to see signals.
What It Doesn’t Do (and What to Be Careful Of)
It doesn’t predict the future — it simply shows zones and trends. Price can still break down through the cloud.
In a “choppy” market (i.e. when price is going up and down without a clear trend), signals from EMAs / clouds are less reliable. You’ll get more “false bounces.”
Under / overshoots & big news events can break through clean levels, so always watch for confirmation (volume, price behavior) before putting big money in.

Aftershock Playbook: Stock Earnings Drift EngineStrategy type
Event-driven post-earnings momentum engine (long/short) built for single-stock charts or ADRs that publish quarterly results.
What it does
Detects the exact earnings bar (request.earnings, lookahead_off).
Scores the surprise and launches a position on that candle’s close.
Tracks PnL: if the first leg closes green, the engine automatically re-enters on the very next bar, milking residual drift.
Blocks mid-cycle trades after a loss until the next earnings release—keeping the risk contained to one cycle.
Think of it as a sniper that fires on the earnings pop, reloads once if the shot lands, then goes silent until the next report.
Core signal inputs
Component Default Purpose
EPS Surprise % +0 % / –5 % Minimum positive / negative shock to trigger longs/shorts.
Reverse signals? Off Quick flip for mean-reversion experiments.
Time Risk Mgt. Off Optional hard exit after 45 calendar days (auto-scaled to any TF).
Risk engine
ATR-based stop (ATR × 2 by default, editable).
Bar time stop (15-min → Daily: Have to select the bar value ).
No pyramiding beyond the built-in “double-tap”.
All positions sized as % of equity via Strategy Properties.
Visual aids
Yellow triangle marks the earnings bar.
Diagnostics table (top-right) shows last Actual, Estimate, and Surprise %.
Status-line tool-tips on every input.
Default inputs
Setting Value
Positive surprise ≥ 0 %
Negative surprise ≤ –5 %
ATR stop × 2
ATR length 50
Hold horizon 350 ( 1h timeframe chart bars)
Back-test properties
Initial capital 10 000
Order size 5 % of equity
Pyramiding 1 (internal re-entry only)
Commission 0.03 %
Slippage 5 ticks
Fills Bar magnifier ✔ · On bar close ✔ · Standard OHLC ✔
How to use
Add the script to any earnings-driven stock (AAPL, MSFT, TSLA…).
Turn on Time Risk Management if you want stricter risk management
Back-test different ATR multipliers to fit the stock’s volatility.
Sync commission & slippage with your broker before forward-testing.
Important notes
Works on every timeframe from 15 min to 1 D. Sweet spot around 30min/1h
All request.earnings() & request.security() calls use lookahead_off—zero repaint.
The “double-tap” re-entry occurs once per winning cycle to avoid drift-chasing loops.
Historical stats ≠ future performance. Size positions responsibly.

Hybrid Swing/Day Alert System - PLATINUM EditionThis indicator is a complete trading assistant designed for crypto swing and day traders, built to identify high-probability long and short setups based on a multi-confirmation system.
Strategy Logic
The system scans and confirms entries only when 6 major confluences align:
1. EMA Trend: Price is above or below the EMA 9, 21, and 200 (bullish or bearish trend).
2. RSI Zone: RSI(14) is between 40-60 (ideal reversal zone).
3. Volume Confirmation: Volume is declining on pullback and then spikes.
4. Accumulation/Distribution: A/D line rising (for longs) or falling (for shorts).
5. Fibonacci Pullback Zone: Automatic detection of swing high/low and checks if price is inside the golden zone (0.5-0.618).
Built-In Alerts
- Long Setup Confirmed - Short Setup Confirmed - Setup Forming: Monitor
Conclusion
This script is ideal for disciplined traders who value confluence-based entries, risk/reward logic, and trend-aligned trades. Perfect for semi-automated trading via alerts or manual execution.6. Candle Pattern: Bullish (hammer, doji, engulfing) or Bearish (rejection wick, engulfing, doji).
Visual Features
- Long Entry: Green square
- Short Entry: Red triangle
- Pre-Signal Alert: Blue circle (confluence forming)
- Dynamic Table: Displays all 6 confirmations in real time
- Fibonacci Zones: Auto-plotted long/short retracement zones
- Customizable: Turn on/off alerts, overlays, and direction filters
Best Use Cases
- 4H/Daily: Trend confirmation
- 1H: Entry execution
- 15min: Scalping (use cautiously)
- Works great with BTC, ETH, SOL, XAU, and meme coins

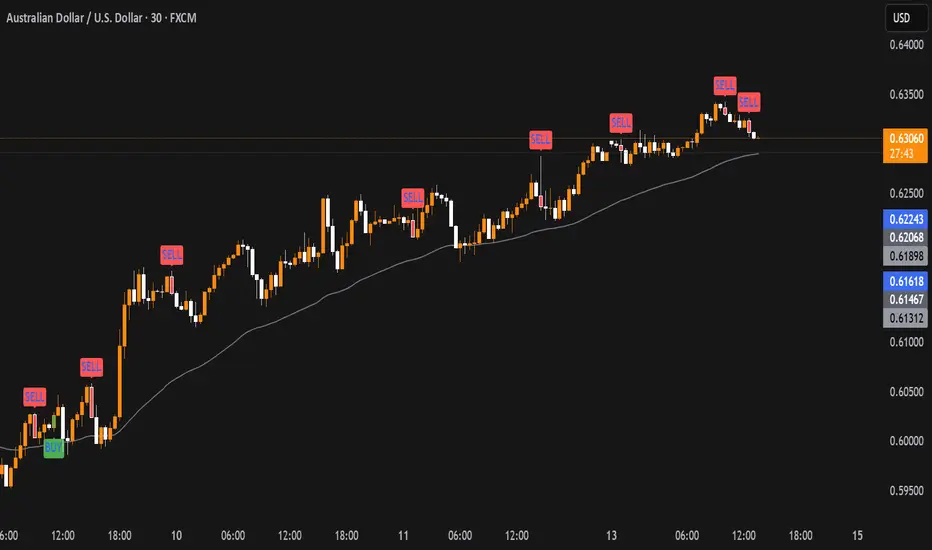
Liquidity Sweep with EMAThis Pine Script indicator helps traders identify potential market reversals based on liquidity sweeps, where the price moves through the previous candle's low or high and then closes above or below the previous candle's wick. These are often seen as significant market moves or liquidity grabs before a potential reversal or continuation.
The indicator is also equipped with an EMA (Exponential Moving Average) as an optional visual aid to give traders a sense of the prevailing trend, though it is not used as part of the signal generation logic.
Key Features:
Liquidity Sweep Detection:
Bullish Sweep: Triggered when the current candle sweeps below the low of the previous candle and then closes above the high of the previous candle. This indicates a potential market reversal to the upside after the liquidity sweep.
Bearish Sweep: Triggered when the current candle sweeps above the high of the previous candle and then closes below the low of the previous candle. This indicates a potential market reversal to the downside after the liquidity sweep.
EMA:
The EMA (50) is plotted on the chart for visual trend guidance. While it is not used to confirm the signals, it can help traders see if the market is in a general uptrend or downtrend.
Signal Presentation:
Buy Signal: The indicator will plot a green upward arrow below the candle when a bullish liquidity sweep is detected.
Sell Signal: The indicator will plot a red downward arrow above the candle when a bearish liquidity sweep is detected.
Timeframe Filter:
The indicator only generates signals on the following timeframes: 30-minute, 1-hour, 4-hour, and Daily. This helps to ensure the sweeps are significant and likely to result in meaningful price moves.
Alerts:
Alerts can be set up for both bullish and bearish sweep signals, so traders can be notified when these events occur.
Customizable:
EMA Length: The length of the Exponential Moving Average (EMA) can be adjusted. By default, it is set to 50, but you can modify this to fit your trading strategy.
Show EMA Option: You can toggle whether or not to display the EMA line on the chart.
How It Works:
The indicator looks for price action patterns where the current candle sweeps through the high or low of the previous candle and closes beyond the previous wick.
These patterns are often seen as potential traps, where the price initially moves in one direction (sweeping the liquidity) and then quickly reverses, making them important for traders who want to catch reversals or breakouts after a liquidity sweep.
The EMA (50) gives a general trend direction but doesn't directly affect the trade signals. It serves as a visual reference for trend analysis.
Potential Use Cases:
Reversal Trading: Traders can use this indicator to catch reversals after a liquidity sweep. The green upward arrows may indicate a bullish reversal, while the red downward arrows may indicate a bearish reversal.
Trend Trading: The EMA can help traders gauge the overall market trend. If the price is above the EMA, the market may be in an uptrend, and traders may focus on bullish sweeps. Conversely, if the price is below the EMA, the market may be in a downtrend, and traders may focus on bearish sweeps.
Confirmation with Other Indicators: Although the EMA is not used to confirm signals in this script, it can be combined with other indicators (like RSI, Volume, or MACD) to enhance the accuracy of your trades.
Final Thoughts:
This script is designed to identify liquidity sweeps and price reversals based on price action alone, without relying on complex indicators. The optional EMA serves as a helpful tool for understanding the overall market trend. It’s ideal for traders looking to spot potential reversal points after significant price sweeps and is suitable for multiple timeframes (30m, 1h, 4h, Daily).
You can use this description to help potential users understand the functionality of your indicator when publishing it on TradingView or selling it as an invite-only script. Let me know if you need any adjustments or further details!
Mswing HommaThe Mswing is a momentum oscillator that calculates the rate of price change over 20 and 50 periods (days/weeks). Apart from quantifying momentum, it can be used for assessing relative strength, sectoral rotation & entry/exit signals.
Quantifying Momentum Strength
The Mswing's relationship with its EMA (e.g., 5-period or 9-period) is used for momentum analysis:
• M Swing >0 and Above EMA: Momentum is positive and accelerating (ideal for entries).
• M Swing >0 and Below EMA: Momentum is positive but decelerating (caution).
• M Swing <0 and Above EMA: Momentum is negative but improving (watch for reversals).
• M Swing <0 and Below EMA: Momentum is negative and worsening (exit or avoid).
Relative Strength Scanning (M Score)
Sort stocks by their M Swing using TradingView’s Pine scanner.
Compare the Mswing scores of indices/sectors to allocate capital to stronger groups (e.g., renewables vs. traditional energy).
Stocks with strong Mswing scores tend to outperform during bullish phases, while weak ones collapse faster in downtrends.
Entry and Exit Signals
Entry: Buy when Mswing crosses above 0 + price breaks key moving averages (50-day SMA). Use Mswing >0 to confirm valid breakouts. Buy dips when Mswing holds above EMA during retracements.
Exit: Mswing can be used for exiting a stock in 2 ways:
• Sell in Strength: Mswing >4 (overbought).
• Sell in Weakness: Mswing <0 + price below 50-day SMA.
Multi-Timeframe Analysis
• Daily: For swing trades.
• Weekly: For trend confirmation.
• Monthly: For long-term portfolio adjustments.

Relative Volume at TimeThe Relative Volume at Time indicator (RVOL) is a simple modification of the original Relative Volume at Time script available in TradingView’s public library. It doesn’t change how the indicator works but includes two small adjustments:
Added Color Options – The ability to customize the colors of the volume bars, which was important to me as I use this indicator all the time and wanted more visually suitable colors.
Renamed Short Title – The abbreviation "RVOL" replaces "RelVol", as it's a more commonly used term in trading.
Aside from these small tweaks, the indicator retains all of its original functionality, including the ability to set an anchor timeframe, choose between Regular and Cumulative volume calculation modes, and adjust unconfirmed volume for incomplete bars.
This version exists simply because I needed a more personalized display for an indicator that I rely on daily.
How It Works
The Relative Volume at Time indicator compares the current volume to the average volume at the same time in previous sessions. This helps determine if today’s activity is higher or lower than usual.
Examples
On a daily chart (1D timeframe, length = 10), each volume bar compares today's volume to the average volume at the same time over the last 10 days. If today’s volume is higher than usual at this moment, the bar will reflect that.
On an hourly chart (1H timeframe, length = 5), each hourly volume bar compares the current hour’s volume to the same hour in the past 5 days. If the 10 AM bar is high, it means today's 10 AM volume is greater than the average of the past 5 sessions at 10 AM.
On a weekly chart (1W timeframe, length = 8), the indicator compares this week’s volume to the average of the last 8 weeks. A higher bar means this week is seeing significantly more volume than usual.
This logic applies to any timeframe. It always compares the current volume to past volumes at the same point in time.
@Julien_Eche

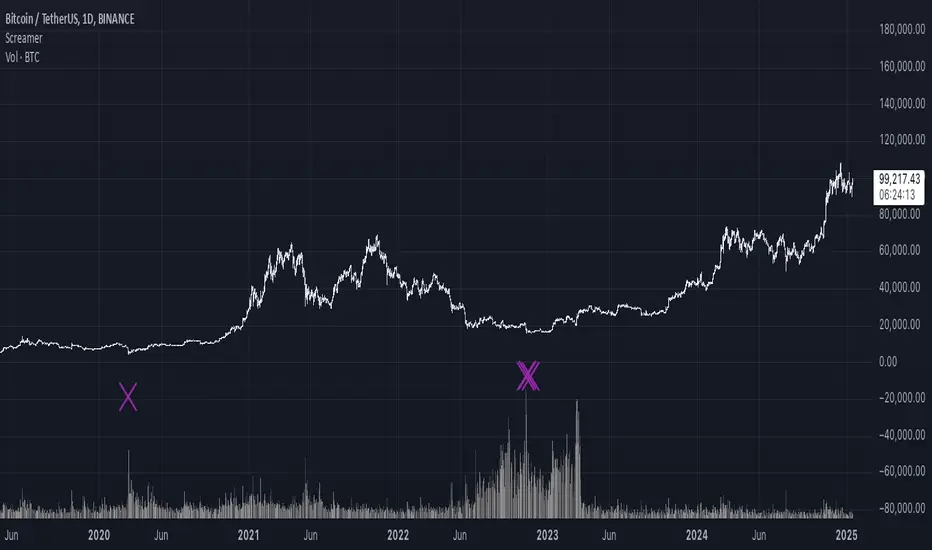
It Screams When Crypto BottomsGet ready to ride the crypto rollercoaster with your new favourite tool for catching Bitcoin at its juiciest, most oversold moments.
This isn’t just another boring indicator — it screams when it’s time to load your bags and get ready for the ride back up!
Expect it to scream just once or twice per cycle at the very bottom, so you know exactly when the party starts!
Why You'll Love It:
Crypto-Exclusive Magic: It does not really matter what chart you are on; this indicator only bothers about the original and realised market cap of BTC. We all know the rest will follow.
Big Picture Focus: Designed for daily. No noisy intraday drama — just pure, clear signals.
Screaming Alerts: When the signal hits, it’s like a neon sign screaming, “Crypto Bottomed!"
Think of this indicator as your backstage pass to the crypto world’s most dramatic moments. It’s not subtle — it’s bold, loud, and ready to help you time the market like a pro.
P.S.: Use it only on a daily chart. Don’t even try it on shorter timeframes — it won’t scream, and you’ll miss the show! 🙀
Volume Rate of Change (VROC)Volume Rate of Change (VROC) is an indicator that calculates the percentage change in trading volume over a specific period, helping analyze market momentum and activity. It is calculated as:
VROC = ((Current Volume - Past Volume) ÷ Past Volume) × 100
This indicator shows changes in market interest. Positive values indicate increasing volume, while negative values signal a decrease. High VROC values often suggest potential trend reversals or breakouts.
Applications:
Breakout Validation: VROC > 200% confirms strong breakouts; below this may signal false moves.
Market Stagnation: VROC < 0% suggests shrinking volume and range-bound markets.
Trend End Alert: A drop below 0% during trends may indicate weakening momentum.
Adjusting for Timeframes: Tailor VROC to timeframes.
Examples:
Daily: VROC(5) compares with last week's same day; VROC(20) with 1 month ago.
Monthly: VROC(12) compares with the same month last year; VROC(1) with last month.
Intraday: VROC(24) (hourly) and VROC(288) (5 minutes) for the same time yesterday.

Checklist By TradeINskiChecklist By TradeINski
First Things First
This indicator is a supporting tool for trading momentum burst that is 2 Lynch setup by stock bee aka Pradeep Bonde.
Disclaimer: This indicator will not give any buy or sell signal. This is just a supporting tool to improve efficiency in my trading.
Apply Indicators and then open indicator settings and read the following simultaneously to understand better.
Default color settings are best suited for light themes. Which is also my personal preference.
Users can change most of the default options in settings according to their personal preference in settings.
When we open settings we can see 3 tabs that are {Inputs tab} {Style tab} {Visibility tab} each tab have its own options, Understand and use it accordingly.
Indicator will be only visible in the Daily time frame as its primary TF is daily. In the lower time frame nothing is plotted.
An indicator is plotted on an existing plane and overlaid on the existing plane.
Contents
My Checklist Lynch
Table Header Settings
Position
Size
Text Color
Background Color
“ON/OFF” Header “Text Box” “Info”
Table Content
Text Color
Background Color
“ON/OFF” R (1 - 10) “Text Box” T (1 - 10) “Text Box”
My Checklist - 2Lynch
This is the checklist I use while placing the trade just to make use of not missing anything based on predefined rules of the setup I trade.
2 - The stock should not be Up more than 2 days in a row, Minor movement can be acceptable.
L - The stock price movement should be linear, validation of established momentum
Y - Young trend in preference 1 - 3rd breakout from base
N - Narrow Range or -ve day before breakout
C - Consolidation should be narrow, linear and low volume. No more than one 4% breakdown.
H - The candle should close near high or at least 20% within when entered.
Table Headers Settings
Position - “Drop Down” with 9 different options which are self explanatory. Users can change the position of the table as per their preference.
Size - “Drop Down” with 6 different options which are self explanatory. Users can change the size of all the text printed in the table as per their preference.
Text Color - “Default Color is White” This setting is specifically only for header text. And users can change the text color of the header as per their preference.
Background Color - “Default Color is Blue” This setting is specifically only for header
background color. Users can change the background color of the header as per their preference.
“ON/OFF” Header “Text Box” “Info”
“Check Mark” - To show or hide the header that is “ON/OFF”.
“Header” - Heading of the table.
“Text Box” - Users can input as per their preference.
“Info” - Info symbol that shows short form and important note that is (Max 50 characteristics for all text boxes) .
Table Content
Text Color - “Default Color is White” This setting is specifically for table texts. And users can change the text color of the all content table texts as per their preference.
Background Color - “Default Color is black” This setting is specifically for content table texts background color. Users can change the background color of the header as per their preference.
“ON/OFF” R (1 - 10) “Text Box” T (1 - 10) “Text Box”
“Check Mark” - To show or hide the complete Row. Users have options and can change as per their preferences.
R (1-10) - “R” stands for Row and (1-10) is Number of rows available for users to enter text. Users have 10 different options.
“Text Box” - Place to enter text that users want to print on column 1 of the table.
T (1-10) - “T” stands for table and (1-10) is Number of text boxes available for users to enter text. Users have 10 different options.
“Text Box” - Place to enter text that users want to print on column 2 of the table.

(mab) Dynamic Bitcoin NVT SignalBitcoin`s NVT is calculated by dividing the Network Value (market cap) by the USD volume transmitted through the blockchain daily. Note this equivalent of the bitcoin token supply divided by the daily BTC value transmitted through the blockchain, NVT is technically inverse monetary velocity.
Credits go to Willy Woo for creating the Network Value Transaction Ratio (NVT). Credits go also to Dimitry Kalichkin improving NVT and creating the NVT Signal (NVTS).
According to its creator, the NVT Ratio is somewhat similar to the PE Ratio used in equity markets. When Bitcoin`s NVT is high, it indicates that its network valuation is outstripping the value being transmitted on its payment network, this can happen when the network is in high growth and investors are valuing it as a high return investment, or alternatively when the price is in an unsustainable bubble.
I created this indicator because the NVT indicator I was using suddenly stopped working. I tried a number of other NVT indicators, but all of them seem to have the same problem and stopped updating after a certain date. The cause is that the data feed from 'Quandl' that is used by most NVT indicators is no longer updated through the previous API.
Instead TradingView created a special API to access 'Quandl" data. This indicator not only uses the new API for 'Quandl', it can also access data from other providers like 'Glassnode', 'CoinMetrics' and 'IntoTheBlock'. However, the 'Quandl' data feed seems to produce the best results with this indicator.
The indicator provides dynamically adjusting overbought and oversold thresholds based on a two year moving average and standard devition with adjustable multipliers. It also implements alerts for NVT going into overbought, oversold or crossing the moving average.
Version 1.0
--
Version history
0.1 Beta
- Initial version
1.0
- First release

Cycles: 4x dual inputs: Swing / Time Cycles projected forward//Purpose/Premise:
To project forward vertical 'cycle' lines based on user-input anchor points, and to search for confluence.
The idea being that if several well-anchored cycles agree (i.e. we see multiple bunched vertical line confluence in the future), then this may add support to an already existing trade idea, or may indicate an increased likelihood of a shift in direction.
//Usage & notes:
~In the above chart I've anchored to obvious swing lows and swing highs in Btc/Usd from 2020-2022. You could also use fixed time-based cycles from a favored start anchor point. Bars per cycle are printed at the top of each cycle box if your're interested in time cycles. I.e. for 1, 2, 3 month cycles: for BTC you could use 30, 60, 90 bars on daily; for S&P you could use 20, 40, 60 bars on daily.
~On first loading the indicator you will be asked select 'start date', and 'end date' for each of 4 sessions (8x clicks on chart). After this you can easily reset points by clicking the indicator display line three dots>> reset points. Or you can simply drag the vertical box edges (purple lines) to change your cycle anchor points.
~Be sure the start anchor point is before the end anchor point or box/lines won't appear.
~When you drop down to low timeframes you might get bar_index error due to history available: you need then to click the three dots on indicator display line >> reset points >> 8x clicks on the chart.
~Vertical projected lines will match the color of the cycle box they origninate from.
~Lines will project into the future as far as is allowed by tradingview (500 bars max)
//Inputs:
~Time start and end dates for each cycle (change these as described above, or input manually)
~Show/hide each cycle (default is show all 4)
~Formatting options: color of forward projected lines, line width, line style, line / box / text color.
~Box transparancy: Set to 100 to make boxes invisible & declutter the chart. Set to 0 for maximum opacity. Default is 80.
thanks to @Sathyamurthie for his ideas on cycle confluence which caused me to write this.

Baseline Indicator [SS]Hello,
This is the Baseline Indicator. I modelled it after one of my favourite Tradingview chart types, the baseline type (shown in image below):
I really love this chart, but I wanted a way for it to:
a) Be static and not move with the chart; and
b) Auto calculate the baseline average for a specified period of time.
So I created this indicator which does essentially that.
What it does:
The indicator will calculate the average between the high and low of a user defined timeframe. The timeframe is customizable, but it defaults to daily. It will then plot the average (or baseline) of the high and low over that specified timeframe. The default plot is a candle plot. It will change the colours of the candles to green (for above the baseline) and red (for below the baseline). The chart below shows an example of the indicator with candles on SPY. The Baseline timeframe is set to 1 hour:
You can choose whether you want to plot the current baseline average or the previous.
The advantage to plotting the previous is that this provide a static reference point and can be helpful on the 30 and 60 minute timeframe. Here is an example:
In this example on SPY, the indicator is plotting the previous average. You can see SPY is using this as support and creating a "staircase" pattern. This is indicative of a trend.
The example above is using the previous day average on the daily timeframe during a sideways day. You can see that the price action accumulates and is consistently drawn to this point.
Inversely, you can manually select your own baseline price if you want a static, self-calculated baseline reference point.
Options and Settings:
Below is an outline of the menu as well as a brief explanation of the options and settings:
To view your chart as a baseline chart, make sure you select the "Line" input and then hide the candles on your chart using your chart settings (see image below):
The purple arrow shows how to hide the candles. You select the "Eye" Icon which should then become greyed out and you will be left with the baseline chart from the indicator.
Why use baseline average?
The average between the high and low of a designated timeframe is a very helpful value. In choppy markets, this acts as a key point of frequent return. In trendy markets, this acts as a reference point of trend direction and strength. I encourage you to play around with the indicator and review some historical charts using it, and you will see some patterns emerge!
Final thoughts:
I have also done a quick tutorial video on the indicator for your reference, you can check that out below:
Thanks for checking out the indicator and I hope you like it!

Supply and DemandThis is a "Supply and Demand" script designed to help traders spot potential levels of supply (resistance) and demand (support) in the market by identifying pivot points from past price action.
Differences from Other Scripts:
Unlike many pivot point scripts, this one offers a greater degree of customization and flexibility, allowing users to determine how many ranges of pivot points they wish to plot (up to 10), as well as the number of the most recent ranges to display.
Furthermore, it allows users to restrict the plotting of pivot points to specific timeframes (15 minutes, 30 minutes, 1 hour, 4 hours, and daily) using a toggle input. This is useful for traders who wish to focus on these popular trading timeframes.
This script also uses the color.new function for a more transparent plotting, which is not commonly used in many scripts.
How to Use:
The script provides two user inputs:
"Number of Ranges to Plot (1-10)": This determines how many 10-bar ranges of pivot points the script will calculate and potentially plot.
"Number of Last Ranges to Show (1-?)": This determines how many of the most recent ranges will be displayed on the chart.
"Limit to specific timeframes?": This is a toggle switch. When turned on, the script only plots pivot points if the current timeframe is one of the following: 15 minutes, 30 minutes, 1 hour, 4 hours, or daily.
The pivot points are plotted as circles on the chart, with pivot highs in red and pivot lows in green. The transparency level of these plots can be adjusted in the script.
Market and Conditions:
This script is versatile and can be used in any market, including Forex, commodities, indices, or cryptocurrencies. It's best used in trending markets where supply and demand levels are more likely to be respected. However, like all technical analysis tools, it's not foolproof and should be used in conjunction with other indicators and analysis techniques to confirm signals and manage risk.
A technical analyst, or technician, uses chart patterns and indicators to predict future price movements. The "Supply and Demand" script in question can be an invaluable tool for a technical analyst for the following reasons:
Identifying Support and Resistance Levels : The pivot points plotted by this script can act as potential levels of support and resistance. When the price of an asset approaches these pivot points, it might bounce back (in case of support) or retreat (in case of resistance). These levels can be used to set stop-loss and take-profit points.
Timeframe Analysis : The ability to limit the plotting of pivot points to specific timeframes is useful for multiple timeframe analysis. For instance, a trader might use a longer timeframe to determine the overall trend and a shorter one to decide the optimal entry and exit points.
Customization : The user inputs provided by the script allow a technician to customize the ranges of pivot points according to their unique trading strategy. They can choose the number of ranges to plot and the number of the most recent ranges to display on the chart.
Confirmation of Other Indicators : If a pivot point coincides with a signal from another indicator (for instance, a moving average crossover or a relative strength index (RSI) divergence), it could provide further confirmation of that signal, increasing the chances of a successful trade.
Transparency in Plots : The use of the color.new function allows for more transparent plotting. This feature can prevent the chart from becoming too cluttered when multiple ranges of pivot points are plotted, making it easier for the analyst to interpret the data.
In summary, this script can be used by a technical analyst to pinpoint potential trading opportunities, validate signals from other indicators, and customize the display of pivot points to suit their individual trading style and strategy. Always remember, however, that no single indicator should be used in isolation, and effective risk management strategies should always be employed.

Multi-Timeframe High Low (@JP7FX)Multi-Timeframe High Low Levels (@JP7FX)
This Price Action indicator displays high and low levels from a selected timeframe on your current chart.
These levels COULD represent areas of potential liquidity, providing key price points where traders can target entries, reversals, or continuation trades.
Key Features:
Display high and low levels from a selected timeframe.
Customize line width, colors for high and low levels, and label text color.
Enable or disable the display of high levels, low levels, and labels.
Receive alerts when the price takes out high or low levels.
How to use:
It is important to note that using this indicator on it's own is not advisable. Instead, it should be combined with other tools and analysis for a more comprehensive trading strategy.
Possibly look to use my MTF Supply and Demand Indicator to look for zones to trade from at these levels?
If the price breaks above a high level, you might consider entering a long position, with the expectation that the price will continue to rise. Conversely, if the price breaks below a low level, you may think about entering a short position, anticipating further downward movement.
On the other hand, you can also use high or low levels to look for reversal trades, as these areas can represent attractive liquidity zones.
By identifying these key price points, you could take advantage of potential market reversals and capitalise on new trading opportunities.
Always remember to use this indicator in conjunction with other technical analysis tools for the best results.
Additionally, you can enable alerts to notify you when the price takes out high or low levels, helping you stay informed about significant price movements.
This indicator could be a valuable tool for traders looking to identify key price points for potential trading opportunities.
As always with the markets, Trade Safe :)

BTC Performance Table / BTC Seasonality Visualization
This script visualizes Bitcoins "seasonality", in form of a colored table (based on the idea from "BigBangTheory")
The history table shows you which months do statistically perform better/worse in comparison to other months.
How to use this script:
Choose ticker "BLX" ("BraveNewCoin Liquid Index for Bitcoin").
Set the charts time frame to weekly or daily. Tables position on the screen and its colors are configurable.
Table explanation:
Cells show whether a gain or a loss occured from month to month, since BTC came out in 2010.
The price difference, between monthly open and monthly close, determines the cell color (negative -> red, positive -> green).
The year column shows total gain (green) or loss (red) for that particular year.
Each value is presented as a rounded percentage number.
How this script works:
The script calculates the price difference between each monthly and yearly open and close, storing those numbers inside arrays.
Then it populates the table, by using those numbers and doing the cell coloring (there will be a yellow cell, in case no change should occur).
German Short-Description
Prozentuale Übersicht in Tabellenform, der monatlichen, sowie jährlichen, Performance des Bitcoin (basierend auf der Idee von "BigBangTheory").
Hierdurch wird die "Saisonalität" des Bitcoin sichtbar. D.h. welche Monate des Jahres, im Vergleich zu anderen Monaten, statistisch gesehen öfter positiv/negativ schließen.
Zwecks vollständiger Darstellung muss der Ticker "BLX" ("BraveNewCoin Liquid Index for Bitcoin") im weekly oder daily time frame aktiv sein.

MA20 Hi-Lo-Close Magic BandThis is an improvement over my previous MA20 High Low Magic Band, as it keeps a central 20 MA reference point. So it can help find the up from MA20 lows and down from MA20 highs resisted or supported by MA20 average before final entry. Usable in any time frame of choice - 15m, 30m, Hourly or Daily. In the Hourly / Daily time frame, the signal used with the volume data may work in 6/10 events or more ... Happy trading!

Reverse Ehler Instantaneous Trendline - TraderHalaiThis script uses a reverse function of the famous Ehler Instantaneous Trendline to calculate the source price required in order to change from Bullish to bearish
From my analysis, the reverse price does appear to be rather choppy, though it is 100% accurate. This is because Ehler's Instantaneous Trendline tends to remain trending for longer periods of time with above average hold periods.
The main suitability for this would be higher level timeframes, such as Weekly, 5 daily, 3 daily. From my findings Smoothed Heikin Ashi Trend, tends to provide better risk-adjusted returns across most timeframes (Higher return to drawdown ratio)
As I have spent a bit of time getting the reverse function mathematics to work, I decided to publish this as open source for the benefit, scrutiny and for further development by the TradingView community anyways.
Enjoy!

Inflation Adjusted Performance: Ticker/M2 money supplyPlots current ticker / M2 money supply, to give an idea of 'inflation adjusted performance'.
~In the above, see the last decade of bullish equities is not nearly as impressive as it seems when adjusted to account for the FED's money printing.
~Works on all timeframes/ assets; though M2 money supply is daily data release, so not meaningful to plot this on timeframe lower than daily.
~To display on same pane; comment-out line 6 and un-comment line 7; then save, remove and re-add indicator.
~Scale on the right is meaningless; this indicator is just to show/compare the shape of the charts.

Session High Low
This indicator shows Session High Low line and prices.
1: Session range is adjustable based on your timeframe. Nomore confusing timezone settings.
You can choose your timezone then set your Session start and end time.
Script will show you the following session high and low lines which is extendable until next session.
2: All historical lines and price levels are can be partially or fully hidden.
And line colors are adjustable so you can use suitable color on your chart.
Based on session you choose this script can be used as a session break strategy AKA (Asian session break, London session break strategy).
You can create your own trading Session and high lows.
Personally I monitor how price reacts on London session high lows during the NewYork trading session.
In this chart Session starts at 8am (London open) and closes at 12:30 (NewYork open). Script is showing high lows only in this session range.
Always double confirm with your trading style. It's not a Financial advice.
Inputs:
1: Hide history - Hides all historical lines and prices that means you can see only todays session.
2: Show price - Shows price level of session high lows. You can hide price level if you want to see only lines.
3: Session time - You can set your time range of session.
4: Start time - Session start time. You can see vertical line on your chart or you can hide line.
5: End time - Session end time. You can see vertical line on your chart or you can hide line.
6: Line extend time - End of the high low lines. You can draw line until the end of the session or you can draw short line.
7: All line and price colors are optional.
Thank you.

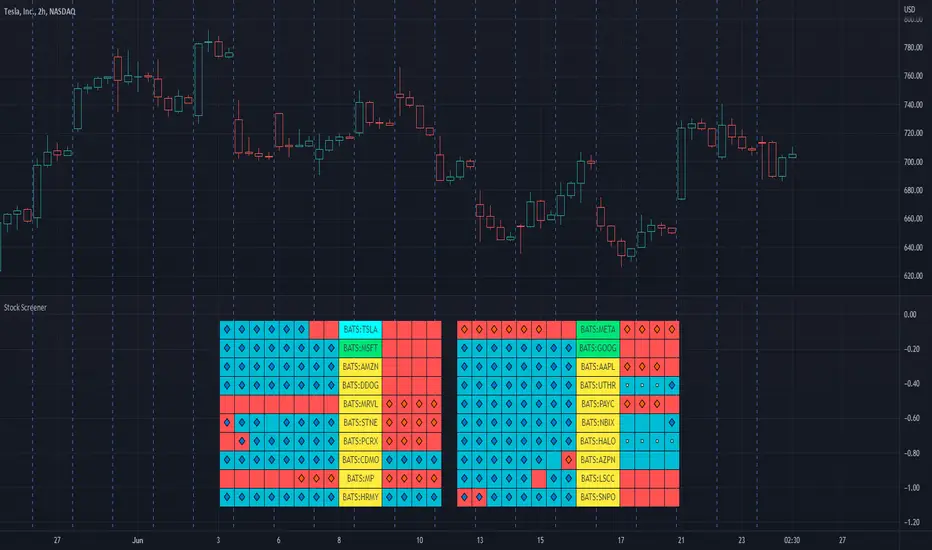
Stock ScreenerThis indicator helps monitoring QQE Mod and RMO of 20 tickers simultaneously.
This indicator shows last 4/8 indicator results of particular ticker.
Left side: 8 last colors of both indicator on current timeframe. Most left is older.
Right side: 4 last colors of both indicator on selected higher timeframe. Most right is newer.
Icon color is QQE Mod.
Background color is RMO color.
This indicator is suitable for daily or swing trade.
Recommended timeframe is 2 Hours, and recommended higher timeframe is Daily.
ATRvsDTR + ADR Zone + SSS50%This Script is to be used for intra day as far as the adr zones. The adr zones are used as support and resistance but also can be used to determine whether the stock is breaking out or not. Also being that the adr zones are calculated using a 5 or 10 day period unless you change the settings, and are set when price opens. It does really help you know whether a stock is moving more than it does on average to me it just signifies its directional. So I added the atr vs dtr so you can see what a stock moves on average versus what it has moved today.
The atr period is calculated based on the daily period unless you change the settings. I added to the original script 3 more percentages the atr vs dtr will change as it goes higher so that you can be aware when the stock is getting closer to moving 100% of its atr. Even though a stock breaks above or below the adr that doesn't mean it has moved more than it normally moves.
I also have the weekly open on the script as I trade the strat and I want to know, at what price the the week will change from bearish to bullish and vice versa. So that I can understand the trend when I am trading intraday.
The 50% lines were added for Sara strat snipers 50% rule and you can change the timeframes on them. This is used to know whether a candle will go 3. This also can help with retracements vs reversals, because in traditional technical analysis 50% is around where people start think its a reversal more so than a retracement.
I believe the script will be very help as it can show you price being directional but can also let you know when the stock is getting close to moving more than it normally has or if it has moved more than it normally has. As well as being able to see if something is a retracement vs a reversal. I trade TheStrat strategy so this can be very helpful in that regard
The 50% retracement levels are default 1h and daily. You can change them and whether or not they show
In the example chart you can see we are below weekly open which is bearish and you can also see where price reverses out of the upper adr zone. As well as how much of the atr we have moved on this day in time.
