Pesquisar nos scripts por "daily"

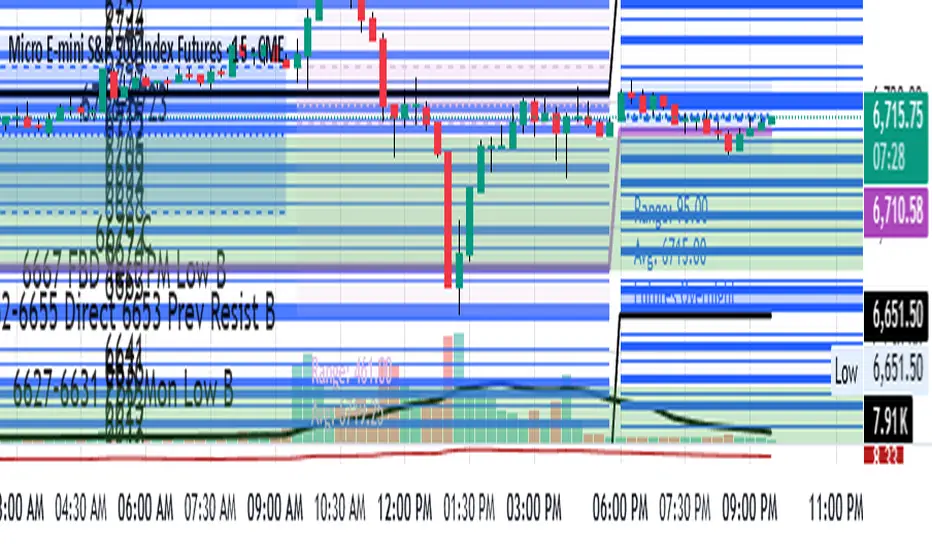
Daily LevelsThis indicator allows one to paste price levels from an outside source and draws lines at those levels. A level can be a line (1 price level) or a price range. It can also be identifies as a Major Level or a minor level. Individual notes can be entered at each level by placing the text in brackets (this type "{ }"). Text cannot include parentheses and dashes. Separate each day's levels with a date in brackets. Date format and bracket type bust be like this: . The lines for each level is drawn from 6pm on the prior date to 4:45pm of the date.
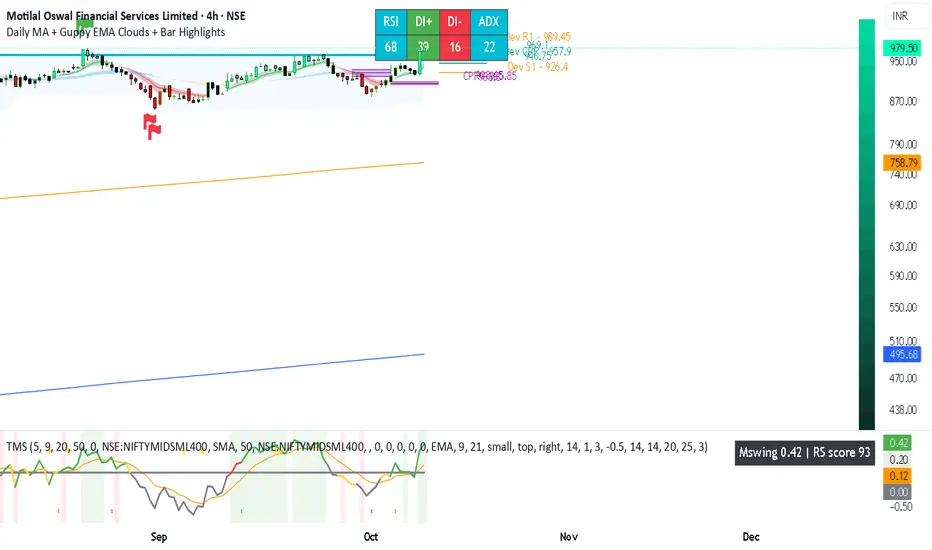
Daily MA + Guppy EMA Clouds + Bar HighlightsThis script is a modular strength dashboard combining:
- Multi-timeframe MAs
- Guppy clouds
- CPR pivots
- Momentum gauges
- Breakout flags
It’s ideal for traders who want layered confirmation across trend, volatility, and support/resistance zones.
Vol - Traded Value (₹ Cr)Daily Traded Volume in Crores.
To know how much of a Stock is trades in Value Terms

Daily Pivot Points - Fixed Until Next Day(GeorgeFutures)We have a pivot point s1,s2,s3 and r1,r2,r3 base on calcul matematics


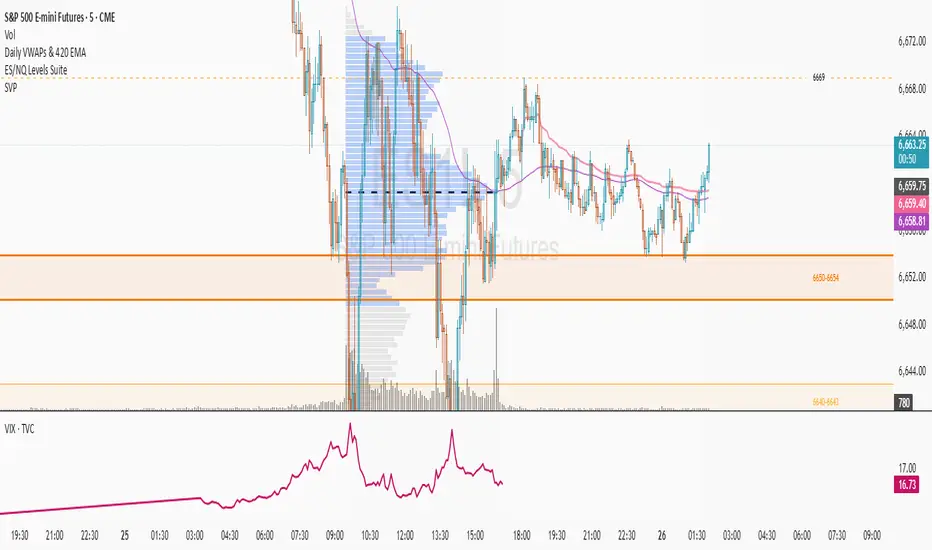
Daily VWAPs & 420 EMAAuto-plots AVWAPS at ETH & RTH of US indice futures open. Additional option for EMA of user's choice.
Daily OpenDraws line with opening price of day at 0:00 (GMT+1), changes colour when line is tested before 14:00, stop drawing when line is tested after 14:00.
Use on Timeframe 1H or lower

Daily Sessions (AMDX) AMDX Cycle for Forex Pairs.
Focusing on the London & New York Session Cycles.
- Accumulation (90 minutes)
- Manipulation (90 minutes)
- Distribution (90 minutes)
- Exit/Execution (90 minutes)
This indicator gives you a visual indicator of how the AMDX cycle works and how timing in the market is everything.

Gamma levels Free TrialDaily Gamma Levels
Sponsored by MONETA MARKETS CO.
Pinpoint key entry and exit points using levels derived directly from the options market.
The shared link provides a free trial for investors ready to upgrade their trading with premium, actionable data.

DAILY WYCKOFF ATMWyckoff Confidence Dashboard
A clean, mobile-optimized Wyckoff phase and alignment dashboard built for serious traders.
This tool dynamically detects Accumulation, Distribution, Markup, and Markdown across multiple timeframes (1H/15M) and scores confidence based on:
• HTF trend direction
• Liquidity sweeps
• Fair Value Gap (FVG) presence
• Volume/OBV confirmation
• Multi-timeframe phase/action alignment
Includes smart alerts and a lightweight dashboard interface — no clutter, just actionable structure-based insight.
Great for SMC, Wyckoff, or price-action traders seeking high-confluence entries.

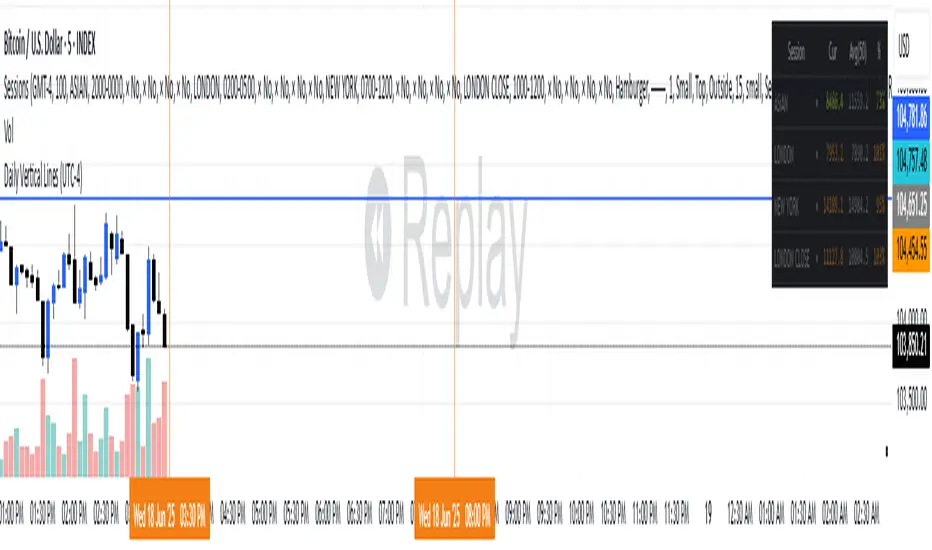
Daily Vertical Lines (UTC-4)puts verical line for setup asian
🔎 How this works:
The script uses timestamp() with America/New_York (which corresponds to UTC-4 in summer and UTC-5 in winter — TradingView auto-adjusts with DST).
When the bar’s opening time equals 3:30 PM or 8:00 PM, it draws a vertical dotted line across the chart.
One line will be red (3:30 PM), the other blue (8:00 PM).
Daily High/Low (15m) + EMA Pre-Market H/L + ORBStraightforward:
I built a swing-trading indicator with ChatGPT that plots 15-minute highs and lows, draws pre-market high/low lines, and adds a 15-minute opening-range breakout feature.
Technical:
Using ChatGPT, I developed a swing-trade indicator that calculates 15-minute highs/lows, overlays pre-market high and low levels, and includes a 15-minute Opening Range Breakout (ORB) module.
Promotional:
I created a ChatGPT-powered swing-trading indicator that maps 15-minute highs/lows, marks pre-market levels, and features a 15-minute Opening Range Breakout for clearer entries.

Daily 6 AM & 8 AM CST Linesit help so you can figure out 6am and 8am on cst time in americas very fast.


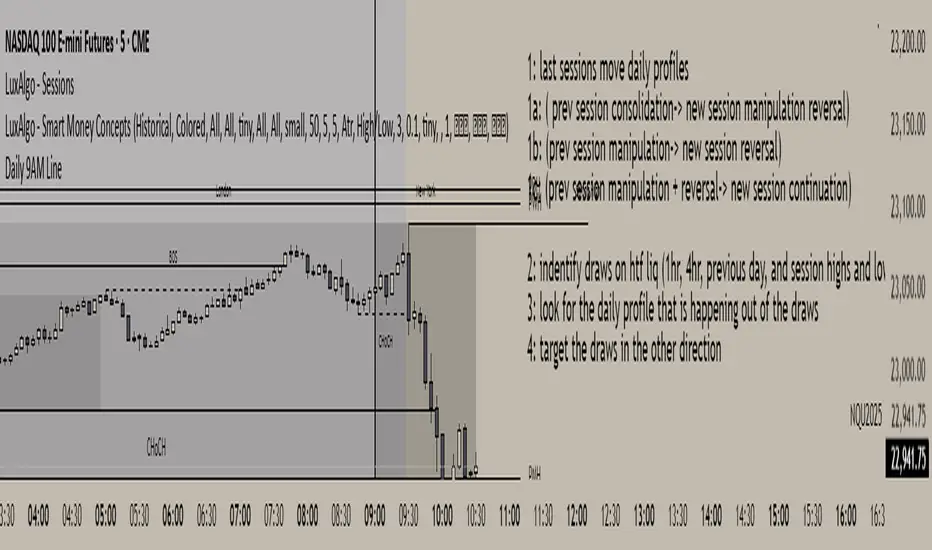
Daily 9AM Line
Draws a line at 9AM every day at market pre-open
Draws a line at 9AM every day at market pre-open
Draws a line at 9AM every day at market pre-open
Draws a line at 9AM every day at market pre-open
Daily Engulfing Zones Visually see engulfing candlestick pattern and capture explosive moves both up and down

Daily Moving Average to Intraday ChartPlaces 200D, 100D, 50D SMAs as well as the 20D EMA onto intraday charts. (Script v6)

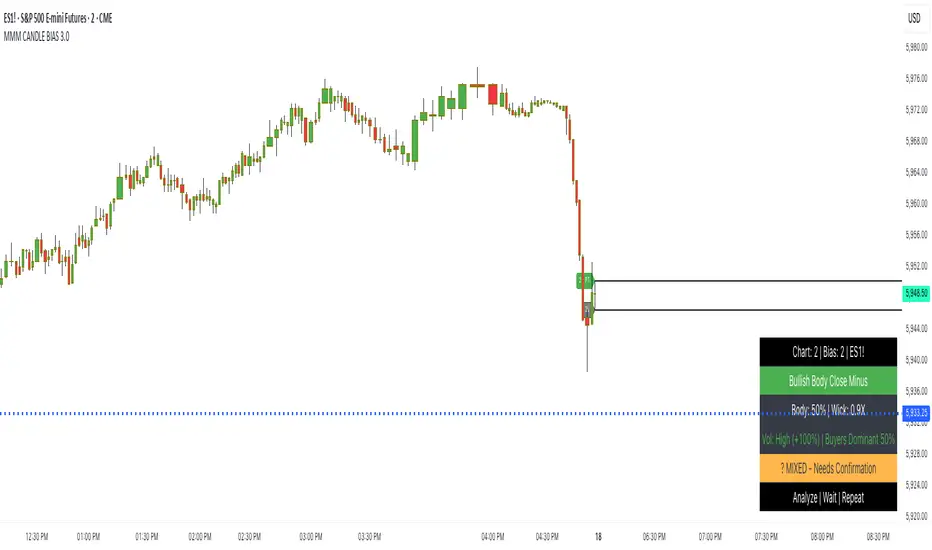
DAILY CANDLE PROFIT TARGET BIAS @MaxMaserati
Max Maserati Method for Candle Bias and effective price action Analysis
The MMM CANDLE BIAS 2.0 indicator, built on the proprietary Max Maserati Method, classifies candles to deliver clear, real-time market bias insights. It decodes price action, revealing institutional trading patterns often missed by retail traders.
The Six Core Candle Classifications: The Foundation of MMM Analysis
Master these six closing patterns, and you'll unlock the true language of price action. These are the building blocks of institutional trading behavior:
Bullish Body Close
Identification: Candle closes above the previous candle’s high.
Psychology: Strong buying pressure overcomes prior resistance.
Implication: Signals bullish trend continuation or reversal.
Bearish Body Close
Identification: Candle closes below the previous candle’s low.
Psychology: Intense selling pressure breaks past support.
Implication: Indicates bearish trend continuation or reversal.
Bullish Affinity
Identification: High tests or breaches previous low, but close stays within previous candle’s range.
Psychology: Buyers defend lower levels, rejecting downside.
Implication: Hidden bullish strength in consolidation.
Bearish Affinity
Identification: Low tests or breaches previous high, but close remains within previous candle’s range.
Psychology: Sellers cap upside attempts, gaining control.
Implication: Subtle bearish pressure despite failed breakout.
Seek & Destroy
Identification: Candle breaks both previous high and low, closing inside previous range.
Psychology: Institutions test liquidity on both sides before committing.
Implication: Direction depends on close—upper half (bullish affinity) or lower half (bearish affinity).
Close Inside
Identification: High and low stay within previous candle’s range.
Psychology: Consolidation with underlying directional bias.
Implication: Bias determined by close position relative to range.
Plus/Minus Strength System
Bullish Strength: Measures distance from low to close (buying pressure).
Bearish Strength: Measures distance from high to close (selling pressure).
Plus (+): Dominant strength significantly outweighs the other, indicating strong directional conviction.
Minus (-): Balanced strengths suggest a contested market, requiring caution.
Key Features
Automated Pattern Recognition: Instantly detects candle formations.
Color-Coded Bars: Green for bullish, red for bearish bias.
Dynamic Profit Targets: Projects targets based on higher timeframe high/low.
Real-Time Metrics: Displays bullish/bearish strength percentages and volume delta.
Customizable Table: Shows timeframe, symbol, bias, volume, and special note (“Analyze | Wait | Repeat”).
Bias Lines: Plots high/low lines on higher timeframe, with optional extension.
Labels: Customizable bias and profit target labels (Tiny, Small, Normal sizes).
Trading Advantages
Reveals institutional moves before retail traders react.
Detects reversals ahead of conventional indicators.
Enables precise entry timing with smart money.
Enhances risk management with clear strength signals.
Simplifies complex price action into actionable insights.
Profit Target Framework
Bullish Patterns: Target higher timeframe high.
Bearish Patterns: Target higher timeframe low.
Plus Strength: Expects direct move to target.
Minus Strength: Anticipates measured advance with potential pullbacks and/or violations.
Visual Implementation
Lines and Labels: High/low bias lines and profit target markers adapt to timeframe.
Table Display: Configurable position (top/middle/bottom, left/center/right) with key metrics.
Bar Coloring: Optional coloring based on bias or plus/minus strength.
Trader’s Mantra
"Analyze | Wait | Repeat" - Discipline turns market reading into consistent profits.
Elevate your trading with MMM CANDLE BIAS 2.0, where professional-grade analysis meets intuitive design.
Note: Based on the proprietary Max Maserati Method for educational and analytical use.
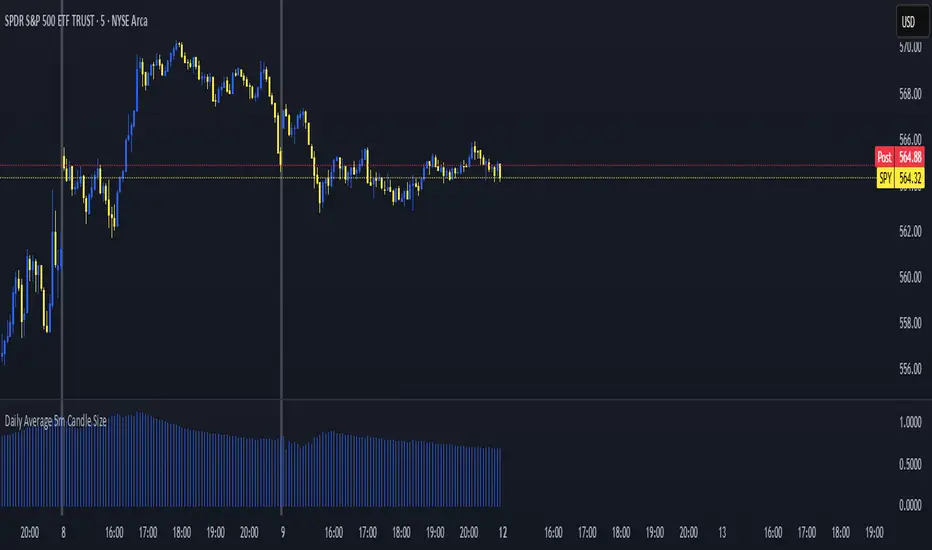
Daily Average 5m Candle SizeThis indicator measures the average size of each 5 min candle then works out the end of day average for you. Very important for profit targets and stops
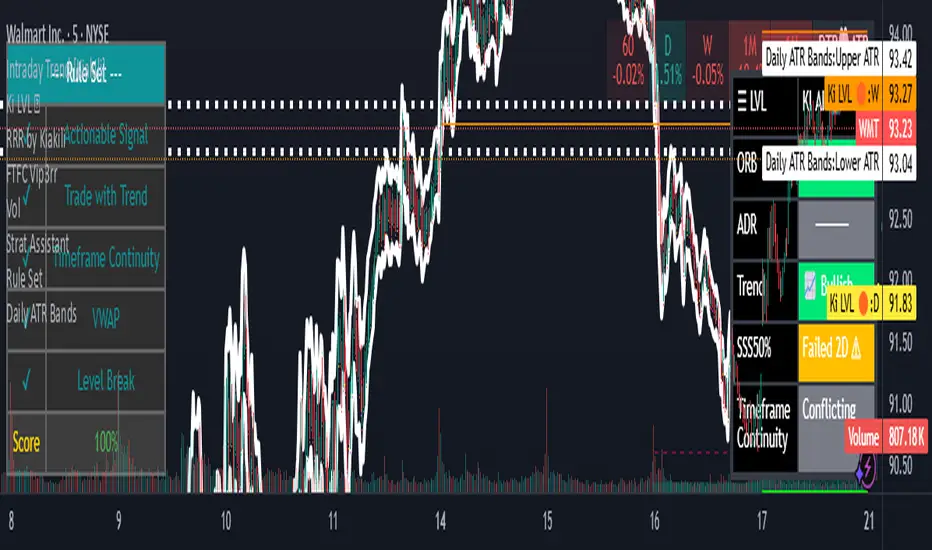
Daily ATR BandsATR Finder – Volatility Scanner for Smarter Trade Setups
The ATR Finder is a precision tool designed to help traders quickly identify high-volatility assets using the Average True Range (ATR) – a key metric in assessing market momentum and potential breakout zones. By automatically scanning and highlighting tickers or candles with elevated ATR values relative to their recent historical range, this indicator helps you filter for setups that are more likely to experience significant price moves.
Whether you're a day trader seeking intraday momentum or a swing trader looking for setups with strong follow-through potential, the ATR Finder cuts through the noise and visually signals which assets are "on the move." It can be paired with other indicators or price action tools to create a high-conviction trading strategy focused on volatility expansion.
Key Features:
Dynamic ATR Calculation over a user-defined period
Visual Alerts or Color-Coding for above-threshold volatility spikes
Supports Multiple Timeframes for both short- and long-term volatility analysis
Great for spotting breakout opportunities, gap continuations, or trend reversals
Use the ATR Finder to stay ahead of price action and build a watchlist that moves with purpose. Perfect for scalpers, breakout traders, and anyone who respects the power of volatility.
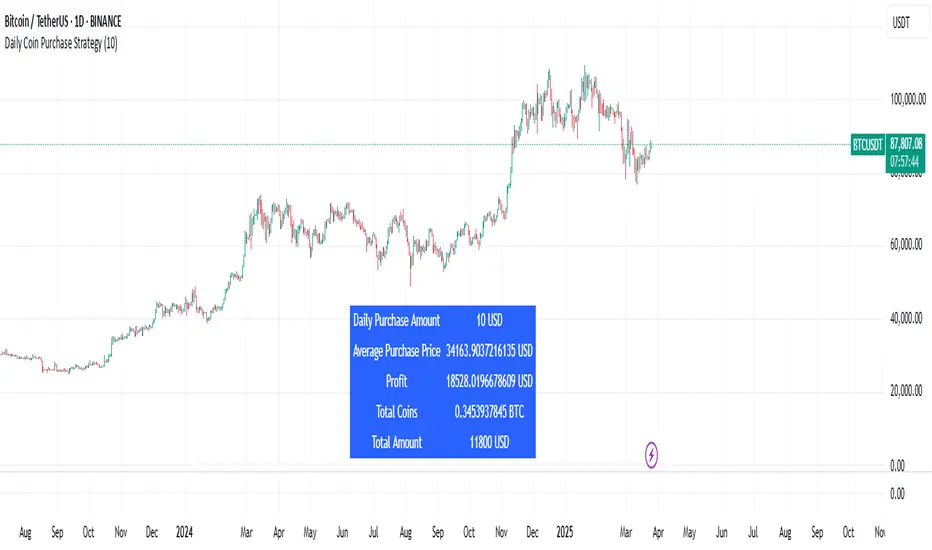
Daily Coin Purchase StrategyThis indicator helps investors track the profitability of their Dollar-Cost Averaging (DCA) strategy when buying crypto assets periodically over time. Users can customize the start date, purchase amount per cycle, and the frequency of purchases based on different timeframes (e.g., 15m, 1H, 4H, 1D).
Features:
✅ Flexible Configuration: Allows users to set the start date, purchase amount per cycle, and select the desired timeframe (15m, 1H, 4H, 1D, etc.).
✅ Automated Profit Calculation: Displays total investment, total coins accumulated, average cost per coin, and profit based on the current market price.
✅ Supports Multiple Timeframes: Users can choose to buy at intervals based on 15m, 1H, 4H, or 1D candlesticks.
✅ Helps Plan Investment Capital: Calculates the total capital needed to follow a DCA strategy over a given period, allowing for better financial planning.
✅ Visualizes Investment Profitability: Provides clear insights into the accumulation process and the overall performance of the strategy.
✅ Intuitive Charts: Displays the accumulation process and investment performance over time.
How to Use:
Set the start date for purchases.
Enter the desired amount to invest per cycle.
Select the timeframe for purchases (15m, 1H, 4H, 1D, etc.).
The indicator will automatically calculate the number of coins accumulated, the average cost per coin, and the overall profit.
🔹 Use Cases:
Monitor the effectiveness of the DCA strategy over time.
Compare profitability across different purchase intervals.
Optimize long-term asset accumulation strategies.
Plan financial resources effectively for long-term investment strategies.
This version keeps all the key details while ensuring clarity and accuracy. Let me know if you need any modifications! 🚀
Daily Open Rangethis indicator draw the open of the day with a box of high and low ( +1 and -1 ) automatically , you have the ability to select which hour you want to to draw from the inputs and you have the ability to change the style of the range as well
OANDA:XAUUSD
