Pesquisar nos scripts por "daily"

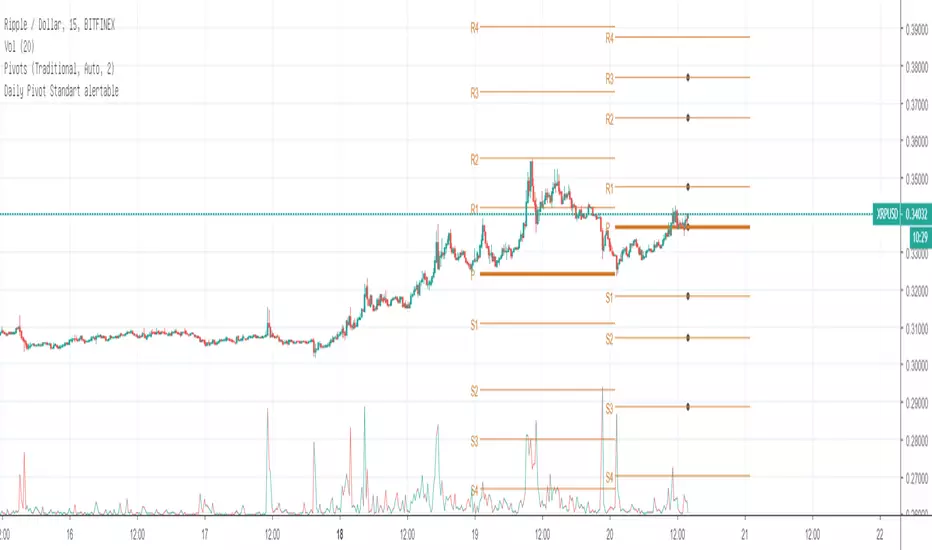
Daily Pivot Standart alertableWith this Indicator u can set allert between the Pivot points s15.directupload.net
So it is useful for scalping
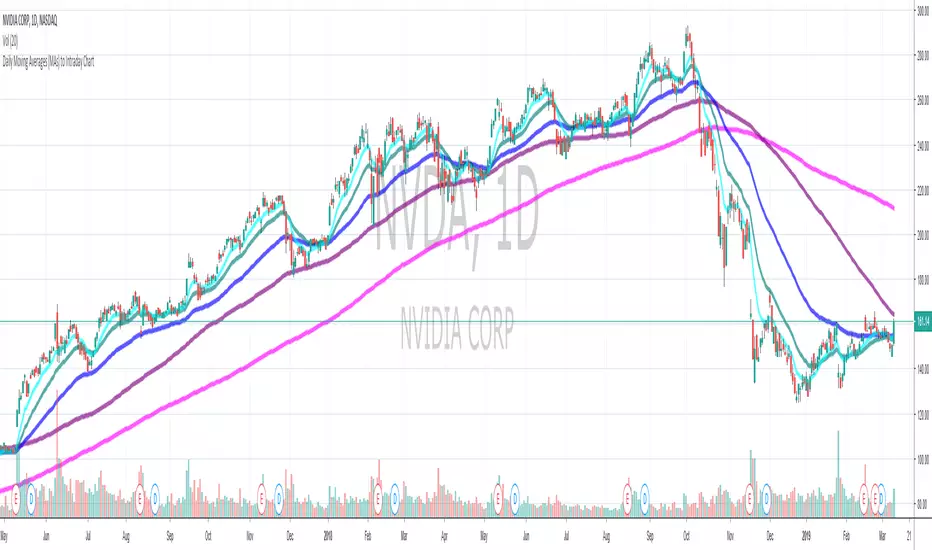
Daily Moving Average to Intraday Chart BradleyRUses Robertob's Script with Mike's colors for Warrior Pro Students.


BTC Swinger v1Daily interval swing trading algorithm based on momentum techniques using ATR Stops. Made by Kory Hoang from Stably.
Shout out to the Advanced Crypto Asset Trading crew! ;)

MY_CME eod OI vs CFTC eow OIDaily e-o-d Open Interest as published by CME.
As CFTC COT Open Interest relates to last Tuesday, here you can have an idea how things evolved day-by-day since then.
As CME total OI is not accessibl as data, here I sum OI of the next 9 outstanding contracts, which gives a fair idea of the trend in OI


MTF EMA Combo with Background ColorDaily/Weekly EMA combo for longer term trend direction, with combo background color for varying trend direction.


Daily Average True Range OverlayPlots the upper and lower average true range away from the previous days close on all time frames.

Daily Deviations (Lazy Edition)
Plots the standard deviation resistance/support lines.
Uses Previous days close and the VIX as the volatility factor.
credit to u/UberBotMan and u/Living_Granger for the idea and formulas

Daily Deviations (Self Input Version)
Plots the standard deviation resistance/support levels.
Input the previous settlement price and the implied volatility.
credit to u/UberBotMan and u/Living_Granger for the idea and formulas
(preview example is using settlement of 2420 and IV of 11)


Daily Returns & STDWhat happened last time when xx increased by xx%? - Start collecting some stats!
You can choose the ticker and the timeframe you're interested in

RSI Oversold/UndersoldThe study script will place GREEN BUY arrows BELOW oversold conditions and RED SHORT arrows ABOVE overbought conditions. You can configure the period
Most RSI(14) indicators use a 14-period, I prefer a 5-period. The period, overbought and oversold periods are settings that can easily be changed by adding this study to your chart and clicking the "gear" icon next to the study inside your chart.


Daily SMAThis pine script on intraday chart is exactly the same SMA as built-in MovingAverage on a 1Day chart (with the same lengths)


RLP V4.3 -Long Term Support/Resistance Levels (Refuges-Shelters)// Introduction //
We have utilized the Zigzag library technology from ©Trendoscope Pty Ltd for Zigzag generation, allowing users the freedom to choose which of the different Zigzags calculated by Trendoscope as "Levels and Sub-Levels" is most suitable for generating ideal phases for evaluation and selection as "most preponderant phases" over long-term periods of any asset, according to its particular behavior based on its age, volatility, and price trend.
// Theoretical Foundation of the Indicator //
Many traditional institutional investors use the latest higher-degree market phase that stands out from others (longest duration and greatest price change on daily timeframe) to base a Fibonacci retracement on whose levels they open long-term positions. These positions can remain open to be activated in the future even years in advance. The phase is considered valid until a new, more preponderant phase develops over time, at which point the same strategy is repeated.
// Indicator Objectives //
1) Automatically find the latest most preponderant long-term phase of an asset, analyzing it on daily timeframe while considering whether the long-term market trend is bullish or bearish.
2) Draw a Fibonacci Retracement over the preponderant phase (reversed if the phase is bullish).
3) The indicator automatically numbers and locates the 3 most preponderant phases, selecting Top-1 for initial Fibo drawing.
4) If the user disagrees with the indicator's automatic selection, they have the freedom to choose any of the other 2 Top phases for the Fibo drawing and its levels.
5) If the user disagrees with the amplitude or frequency of the initially drawn Zigzag phases, they can modify the Zigzag calculation algorithm parameters until one of the Top-3 matches the phase they had in mind.
6) As an experimental bonus, the indicator runs a popularity contest (CP) of "bullseye" daily price (OHLC) matches, subject to user-defined tolerance ranges, against all Fibo levels of the Top 3 selected phases, to verify which phase the market prices are validating as the most popular for placing trades. Contest results are displayed in the POP. CONTEST column of the Top-3 phases table. If the contest detects a change in the winning phase, a switch can be enabled to activate an alert that the user can utilize with TradingView's alert creator to display an alarm, send an email, etc.
7) This indicator was designed for users to find the preponderant long-term phase of their assets and manually record the date-price coordinates of the i0-i1 anchors of the preponderant phase. The Top-1 phase coordinates are shown in the Top-3 phases table where they can be captured. The date-price coordinates of all HH and LL pivots, from all Zigzag phases, can be displayed via a switch. With the pivots, the user can select a different phase than those automatically found by the indicator, according to the conclusions of their own research. Subsequently, the user can forget about this RLP indicator for a while and move on to apply in their normal trading our RLPS indicator (Simplified Long-Term Shelters), in which they can draw and simultaneously track the long-term shelters of up to 5 different assets, simply by entering their corresponding date-price coordinates, previously located with this RLP indicator or through their own observation.
// Additional Notes //
1) As of the this V4.3 publication date (01/2026), the Zigzag generation parameters were adjusted by default to find the long-term preponderant phases for the following assets: Bitcoin, Ethereum, Bitcoin futures BTC1! (all generated due to the 2020-2021 pandemic). It also provides by default the confirmed preponderant phases for the following assets: Apple, Google, Amazon, Microsoft, PayPal, NQ1!, ES1! and SP500 Cash.
2) Prices, phases, and levels shown on the graphic chart correspond to results obtained using daily Bitcoin data from the Bitstamp exchange, BTCUSD:BITSTAMP (popular here in Europe).
3) Any error corrections or improvements that can be made to the phase selection algorithms or the CP phase popularity contest algorithm will be highly appreciated (statistics and mathematics, among many other sciences, are not particularly our strong suit).
4) We sincerely regret to inform you that we have not included the Spanish translation previously provided, due to our significant concern regarding the ambiguous rules on publication bans related to indicators.
4) Sharing motivates. Happy hunting in this great jungle!
