Tomorrow Floor Pivots with CPR By Nifty ZThe colors for resistance and support levels have been updated to gradient reds and greens for clearer distinction.
The CPR band uses light blue and purple to stand out more effectively.
Here's a detailed explanation of the user inputs and the typical use of **Floor Pivots for Tomorrow’s Market Range** in a trading context, focusing on support, resistance, and breakout scenarios:
The script allows traders to customize key parameters for their analysis:
1. Pivot Timeframe:
- Users can select different timeframes for calculating floor pivots, such as 1 hour, 4 hours, daily, weekly, monthly, etc.
- This is crucial because the timeframe selection influences the granularity of the support and resistance levels for the next trading day.
- For instance, selecting a **Daily** timeframe will calculate floor pivots for the next trading day, while selecting **Weekly** will give levels for the upcoming week.
2. Show Floor Pivots:
- Users can toggle the visibility of the calculated **Floor Pivots**, which include resistance levels (R1, R2, R3, R4) and support levels (S1, S2, S3, S4).
3. Show CPR (Central Pivot Range):
- CPR (Central Pivot Range) is a key area where the price tends to consolidate.
- The script allows users to enable or disable the visibility of CPR, which consists of the BC (Bottom Central Pivot) and TC (Top Central Pivot).
4. Show Labels:
- Users can choose whether or not to display labels indicating the **Pivot**, **Support**, and Resistance levels on the chart. This can be helpful for visual analysis when day trading.
Understanding Floor Pivots
The Floor Pivots (Pivot, Resistance, and Support levels) for tomorrow's market range are calculated based on today’s high, low, and close. These levels help traders anticipate how the market may behave in the upcoming session.
1. Pivot:
- The Pivot Point is a central level, calculated as the average of the high, low, and close. It’s considered a reference point that determines the market’s overall bias.
- If the price is trading **above the pivot**, it generally suggests a **bullish** sentiment for the day.
- If the price is trading **below the pivot**, it suggests a **bearish** sentiment.
2. Resistance Levels (R1, R2, R3, R4):
- R1 is often the first area where price may stall in an uptrend. It represents the first major resistance level.
- **R2**, **R3**, and **R4** mark additional levels of resistance, progressively further away from the current price. These are used to project potential upward targets.
- These resistance levels are areas where the price might encounter selling pressure, especially during day trading.
3. **Support Levels (S1, S2, S3, S4):**
- Similarly, **S1** is the first area where the price might find support in a downtrend.
- **S2**, **S3**, and **S4** provide deeper support levels where the price may bounce from.
- These support zones are used by day traders to anticipate where the price might reverse upward.
### **Role of Resistance and Support in Day Trading**
- **Resistance Levels (R1, R2, R3, R4)** indicate potential areas where price could **stall** during an uptrend. These levels are useful for **short-term traders** looking to set exit points or identify reversal zones.
- **Support Levels (S1, S2, S3, S4)** highlight areas where the price could **find support** and potentially **bounce** higher. These levels are particularly helpful for identifying buy zones in a downtrend.
- If a price **breaks out** above the resistance levels or **breaks down** below the support levels, it often signals a strong trend continuation.
### **Understanding the Central Pivot Range (CPR)**
The **CPR** is formed by two key levels:
- **BC (Bottom Central Pivot):** The midpoint of the day’s high and low.
- **TC (Top Central Pivot):** The difference between the pivot and BC.
The CPR acts as a region of **consolidation** or **indecision** where the market is likely to stay within a narrow range. The width of the CPR gives traders a sense of volatility:
- A **narrow CPR** often signals that a **breakout** is imminent.
- A **wider CPR** suggests that the market could remain range-bound.
### **Market Sentiment Based on Floor Pivots**
The relationship between **today’s** and **tomorrow’s pivots** is crucial in determining the market sentiment for the next day.
1. **Bullish Case (Higher Highs):**
- If **tomorrow's pivot** is higher than **today's pivot**, it indicates a **bullish sentiment**. This suggests that the market is likely to trend upward in the next session.
- In a **bullish overlapping pivot range**, if **Day 1 (today)** is higher than **Day 2 (tomorrow)**, traders expect continued upward momentum.
2. **Bearish Case (Lower Lows):**
- Conversely, if **tomorrow's pivot** is lower than **today's pivot**, it suggests a **bearish sentiment** and that the market could trend downward in the next session.
- In a **bearish overlapping pivot range**, if **Day 1 (today)** is lower than **Day 2 (tomorrow)**, traders expect continued downward pressure.
### **Breakout Scenarios**
A breakout occurs when the price **violates either the support or resistance levels** significantly, indicating that the price is moving in the direction of the breakout.
1. **Bullish Breakout:**
- If the price consistently stays **above the CPR** and **resistance levels (R1, R2)**, it indicates a strong **bullish breakout**.
- This is especially true when the **CPR is narrow** for both days, signaling a buildup in price action and a potential breakout to the upside.
2. **Bearish Breakout:**
- If the price breaks **below the CPR** and **support levels (S1, S2)**, it indicates a **bearish breakout**.
- A narrow CPR on **both days** suggests that a breakout to the downside could be imminent.
3. **Neutral or Ranging Days:**
- Sometimes, the CPR stays **unchanged** for 4-5 days, indicating a period of **consolidation** where the price is moving within a tight range. This often leads to a significant breakout once the consolidation ends.
Strategic Application of Floor Pivots for Tomorrow
Traders use floor pivots to plan their next-day trades by:
- **Aligning with Market Sentiment:** Based on whether tomorrow’s pivot is higher or lower than today’s, traders can align their trades in the direction of the market’s overall bias.
- **Identifying Entry and Exit Points:** Resistance and support levels provide well-defined areas to enter or exit trades, making pivots essential for day trading strategies.
- **Anticipating Breakouts:** Monitoring the width of the CPR and the relation between pivots helps traders anticipate potential breakouts, allowing them to react quickly to sudden price movements.
By effectively using these pivots and understanding their significance, traders can improve their decision-making for short-term trades in the stock or futures markets.
Pesquisar nos scripts por "cpr"
[CP]Pivot Boss Multi Timeframe CPR Inception with MACD and EMAINTRODUCTION:
This indicator combines multi-timeframe CPR bands with MACD Momentum and EMA trend, all projected on the candlestick chart through a novel visualization.
If you have seen my other indicators on TradingView, you would know that I use floor pivots a lot and “Secrets of a Pivot Boss” is my favorite book. While using floor pivots, time and again I have noticed an interesting price behavior,
Trending moves in price typically start from around the Central Pivot Range (CPR). The CPR could be from ANY timeframe. These moves can easily be caught using simple momentum and trend indicators like MACD and EMA crossovers.
Yes, it is that simple. Follow along to understand how to use this indicator.
INDICATOR SETTINGS:
RANGEBOUND MACD AND EMA MARKINGS:
TradingView limits the max number of labels that can be shown on a chart to 500. Therefore, if you go far back enough, you won't see any markings for the MACD or EMA setups. If you are looking to test the efficacy of this indicator in the past, change the start and end dates to your desired timeframe and then select the ‘Mark MACD and EMA Setups in Range?’ option.
MULTI TIMEFRAME CENTRAL PIVOT RANGE:
Here you can select CPRs and their bands from which timeframes are shown on the chart. I will share my favorite settings later in this description.
CPR CONFIGURATION:
Show CPR Labels: CPRs markings can carry labels, so that you don’t confuse between which line is what. Use this setting to toggle them On/Off.
Show Next Time Period Pivots: Check this option if you want to see the CPR of the next time period. This is typically done to figure out the ’Two Day CPR Relationship’ . Read the book, “Secrets of a Pivot Boss”, to understand more.
EMA TREND:
Show EMA on the Chart: EMAs will be plotted on the chart. Standard stuff.
Mark EMA Crossovers on Chart: EMA crossovers will be marked on the chart in diamond shapes. If you are using EMA crossovers, I recommend setting this option to True.
Rest of the EMA settings are fairly obvious.
MACD MOMENTUM:
Projecting MACD parameters directly on the candlesticks is surely going to give you a new perspective about price action and MACD.
Also, in order to better understand the MACD projections on the chart, you can add a standard MACD indicator on the chart with default settings to figure out what my indicator is actually showing you.
Marking MACD Crossovers on Chart: Marks the MACD signal crossovers on the chart. This visualization was a game changer for me.
Show MACD Histogram on Chart: Projects the complete MACD Histogram in a novel fashion (Try it!). You will be able to visually see the ebbs and flow of momentum in the charts.
Mark MACD Histogram Peaks on Chart: Marks only the MACD peaks instead of the complete histogram. Peaks are a great way to enter an ongoing trend and to play an intraday rangebound market.
Rest of the settings are just the standard settings that you will find in a typical MACD indicator.
ALERTS:
Not shown in the settings panel, but I have added alerts for EMA and MACD Crossovers so that you don’t have to sit in front of the charts or constantly check the price all day long.
If you don’t know how to set alerts in TradingView, then please Google it.
INDICATOR USAGE EXAMPLES:
This indicator can be used in intraday as well as in higher timeframes.
There are quite a few variations possible, I personally prefer to use the EMA crossovers in intraday (5m) and MACD on Daily timeframes.
This is just a matter of personal preference, some people might prefer using EMAs only or MACD only in all timeframes.
Here are my personal settings for the intraday 5-minute timeframe:
Turn on all the CPR pivots starting from Yearly all the way to Daily. You can turn on 6 hourly and 4 hourly as well if you want.
Hourly CPR is mostly used when the price is in a strong trend and you missed the entry and don’t know when to enter. Price will typically experience pullbacks towards the Hourly CPR, before resuming in the direction of the trend. That is your chance to hop onto the bandwagon.
For Intraday, I keep the Bands off. Just a personal preference here.
You can turn ON the Show CPR Labels , if you want.
Turn ON both the options in the EMA TREND section. You would want to see the EMA crossovers marked on the chart as well as the EMAs themselves, as the distance between the two EMAs will give you an idea about the strength of the trend.
Keep rest of the settings in the EMA section as default (you can change the colors if you wish). I keep the same EMAs as the ones kept in the MACD indicator. I like to keep things simple.
In the MACD MOMENTUM section, turn ON Mark MACD Histogram Peaks on Chart and all the other options turned OFF. Leave the other settings as default. By the way, these are the default settings of the standard MACD Indicator.
You can set up EMA Bullcross and Bearcross alarms if you like.
Before checking out the examples, remember one super simple rule:
SOME OF THE BEST TRENDING MOVES IN THE MARKET, BE IT INTRADAY OR OTHERWISE, ORIGINATE IN THE VICINITY OF A LARGER TIMEFRAME PIVOT/CPR.
Look for price settling above/below a pivot, and then a move away from the pivot in any direction is typically a trending move.
You can use hourly pivots or MACD Histogram peaks marked on the chart to enter an existing trend, or add to your positions.
Let’s have a look at a few recent intraday examples from the Crypto, Indian, and US equity markets.
I have added my comments in the charts to make you easily understand what is going on.
Understand that both, moving average crossover and MACD, will give out a lot of signals (chop) every day. But almost 70% of them are going to be fake signals. It is the signals that you get when the price is near a Pivot, that tend to convert into gorgeous trending moves that last.
BTC 5m Charts
NIFTY Futures 5m Charts (good intraday trends are hard to find here, as the market is very efficient)
TSLA 5m Charts
Some important points for using this indicator in higher timeframes:
For higher timeframes, my personal preference is to go with the MACD indicator. I personally find MACD to be lethal on daily and weekly timeframes, if you know how to use it well.
The default settings of the indicator are the settings I use for both, Daily and Weekly, timeframes. Additionally, I turn off the CPR labels.
In theory large trending moves still have a big probability to start near an important pivot level, however, in larger timeframes, trending moves can start from anywhere. They need not start in the vicinity of any important pivot (but they often do!).
Weekly pivots can act as great pullback levels when the price is in strong momentum, when trading on the daily timeframe.
Quarterly Pivots act as great pullback levels when the price is in strong momentum, when trading on the weekly timeframe.
BTC Weekly Chart
BTC Daily Chart
Nifty Weekly Chart
Nifty Daily Chart
NASDAQ Weekly Chart
NASDAQ Daily Chart
FINAL WORDS:
Please understand that I have Cherry Picked the examples to showcase the capability of the indicator and its usage.
DO NOT conflate the accuracy of examples with the accuracy of this indicator.
Biggest catch is the fact that this indicator, like every other indicator out there, will have whipsaws. Some I have also marked in the example charts.
You need to come up with your own technique to avoid whipsaws, one technique I have shared here…… big moves typically start near pivots.
Work on avoiding whipsaws and finding you own edge in the markets.
If you really want to learn how to use Pivots, read the book ’Secrets of a Pivot Boss’ . This book can change your life.

jitfxjitfx
This indicator plots Central Pivot Range (CPR) along with daily Support & Resistance levels up to 5 levels directly on the price chart. It is designed for intraday and positional traders who want a clean, rule-based structure for market bias, entries, and targets.
Features
Today’s CPR (Pivot, BC, TC)
Next Day CPR calculated from the completed daily candle (useful after market close)
Support & Resistance levels: S1–S5 and R1–R5
On/Off toggles for CPR, Next Day CPR, and S/R levels
Plots neatly on the price chart (overlay)
How to Use
Price above CPR → bullish bias
Price below CPR → bearish bias
Narrow CPR → potential breakout day
Wide CPR → range-bound / mean reversion
Use R levels as potential resistance/targets and S levels as demand/bounce zones
Best For
Index & stock intraday trading
Pre-market planning using Next Day CPR
Identifying structure, bias, and objective targets

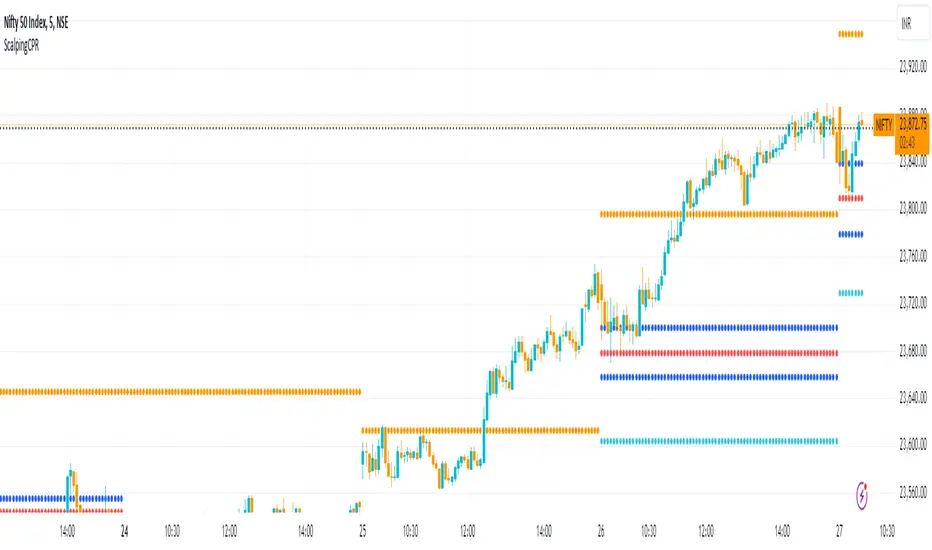
Central Pivot Range (CPR)Central Pivot Range (CPR) Indicator
The Central Pivot Range (CPR) indicator is designed to help traders identify key levels of support and resistance based on pivot points calculated from the previous day's price action. The CPR levels act as critical areas of price convergence and potential reversal, which can help in anticipating future price movements. This version of the CPR indicator includes customizable features to enhance your trading strategy.
Key Features:
Custom Timeframe Support: The indicator allows you to select a custom timeframe for calculating the CPR levels. By default, it uses the daily timeframe ('D'), but you can adjust it to any other timeframe of your choosing. The indicator calculates the CPR and support/resistance levels based on the data from the selected timeframe.
Central Pivot (CP), Below Central Pivot (BC), and Top Central Pivot (TC):
Pivot (CP): The central pivot point is calculated as the average of the high, low, and close prices of the selected timeframe.
Below Central Pivot (BC): This is the midpoint between the high and low prices of the selected timeframe.
Top Central Pivot (TC): This is calculated based on the central pivot and below central pivot, providing a range between support and resistance levels.
Support and Resistance Levels (S1, S2, S3, R1, R2, R3):
Support Levels (S1, S2, S3): These are calculated based on the central pivot, providing potential areas where price may find support and reverse.
Resistance Levels (R1, R2, R3): These are calculated similarly but indicate potential resistance zones where price may face challenges to move higher.
Dynamic Plotting Based on User Input:
The indicator allows you to choose which levels to display on the chart, including the Central Pivot (CP), Support Levels (S1, S2, S3), and Resistance Levels (R1, R2, R3), all of which can be toggled on or off via checkboxes.
CP is displayed in white, BC and TC in blue, Support levels (S1, S2, S3) in green, and Resistance levels (R1, R2, R3) in red.
Daywise Calculations:
The CPR and levels are based on the previous day’s price action, providing historical support and resistance levels that can be useful for intraday analysis.
The request.security function is used to fetch the pivot data from the custom timeframe, ensuring the levels are calculated based on the last completed period (previous day) without repainting.
Customization Options:
CPR Plot: Toggle the visibility of the central pivot range (CPR) lines.
Support Levels (S1, S2, S3): Choose to show or hide the support levels.
Resistance Levels (R1, R2, R3): Choose to show or hide the resistance levels.
Custom Timeframe: Set a custom timeframe for calculating the CPR, allowing for more flexible and tailored analysis.

Vector CPR Bands## Overview
The Vector CPR Bands indicator enhances the classic Central Pivot Range (CPR) by incorporating "vector" detection—identifying periods with above-average or climactic volume. It projects CPR ranges from these high-volume periods forward as visual bands, which act as persistent support/resistance zones until invalidated by price action. Ideal for spotting key levels in trending or ranging markets, especially on higher timeframes like weekly or monthly.
## Key Features
- **CPR Calculation**: Plots previous, developing (non-repainting), and repainting CPR with mid-pivot, TC (top central), and BC (bottom central) lines, plus fills.
- **Vector Detection**: Scans for high-volume bars in the anchor timeframe (default weekly). Flags "above-average" (≥1.5x avg) or "large" (≥2x avg or max climax).
- **Band Projection**: Creates bands from vector-qualified CPR periods. Extends them rightward until touched/revisited (configurable: invalidate on wick/close, delete or freeze/gray out).
- **Customization**:
- Timeframe: Set CPR anchor (e.g., 'W' for weekly, 'M' for monthly).
- Display: Toggle CPR types, pivot guides.
- Volume Thresholds: Adjust lookback and ratios.
- De-clutter: Limit max bands, pin to period start, always extend.
- **Alerts & Signals**: Built-in alerts for developing pivot crossing previous pivot (bullish/bearish).
## How to Use
1. Add to chart and set anchor timeframe (e.g., 'M' for monthly vCPR on BTC, as shown in example charts).
2. Watch bands as S/R: Virgin (untested) bands often provide strong bounces; mitigated ones fade.
3. Combine with volume/price action: Bullish bands suggest upside bias, especially if price holds above.
4. Example: On BTC weekly, vector bands from high-volume weeks highlight multi-month zones—breaks signal shifts.

Nifty CPR by Foresight Trading📌 Indicator Name:
Nifty CPR by Foresight Trading
📖 Description:
This indicator plots the Central Pivot Range (CPR) along with the first resistance (R1) and first support (S1) levels, calculated from the previous day’s OHLC values.
Pivot (P) = (High + Low + Close) ÷ 3
BC (Bottom Central Pivot) = (High + Low) ÷ 2
TC (Top Central Pivot) = P + (P – BC)
R1 = (2 × Pivot) – Low
S1 = (2 × Pivot) – High
✅ The CPR and pivot levels are locked for the entire trading day, so they do not repaint intraday.
✅ Plotted as colored circles (dots) across the day for clear visibility.
✅ New levels are generated only at the start of a new session.
🎯 Usage:
Traders use CPR as a trend bias tool:
Narrow CPR → higher probability of trending day.
Wide CPR → higher probability of sideways/consolidation day.
R1 and S1 act as key intraday support & resistance zones.
⚡ Best For:
Intraday traders & scalpers
Index traders (Nifty, BankNifty, Stocks etc.)
Anyone who uses Pivot Point + CPR trading strategies

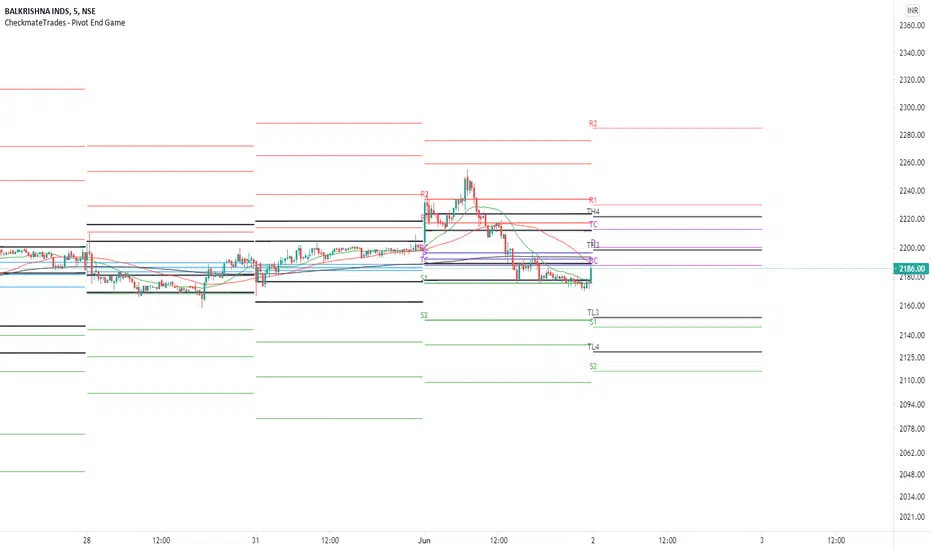
CheckmateTrades - Pivots End GameThis indicator is based on the Pivot study. Traders will be able to plot CPR, Standard floor pivots as well as Camarilla Pivots on multiple timeframes.
Why pivots from multiple timeframes are relevant and included in this one indicator?
We can analyse pivots on multiple timeframes for different trading setups. As in, Daily floor pivots are best suited for analysing the market trend for Day trading. Similarly, Weekly and Monthly floor pivots can be analysed for Swing and positional trading entries. Whereas yearly pivot is best suited for trend analysis for investment purpose.
What is the relevance of plotting tomorrow's pivot level in advance?
Pivot are calculated based on the price happened on a previous day. And hence trader can plot tomorrow pivots in advance to shortlist stocks for tomorrow's trading session.
TimeFrames Available to traders are –
1. Daily
2. Weekly
3. Monthly
A) Daily Pivots
Present Day –
1. Trader can plot Daily CPR
2. Trader can plot Daily R1, R2, R3 and R4 pivot resistance levels
3. Trader can plot Daily S1, S2, S3 and S4 pivot support levels
4. Trader can plot Daily Camarilla levels
Future Day –
1. Trader can plot Tomorrow CPR
2. Trader can plot Tomorrow R1, R2, R3 and R4 pivot resistance levels
3. Trader can plot Tomorrow S1, S2, S3 and S4 pivot support levels
4. Trader can plot Tomorrow Camarilla levels
5. Previous Day High and Low
B) Weekly Pivots
Present Week –
1. Trader can plot Present week CPR
2. Trader can plot Present week R1, R2, R3 and R4 pivot resistance levels
3. Trader can plot Present week S1, S2, S3 and S4 pivot support levels
4. Trader can plot Present week Camarilla levels
Next Week –
1. Trader can plot Next week CPR
2. Trader can plot Next week R1, R2, R3 and R4 pivot resistance levels
3. Trader can plot Next week S1, S2, S3 and S4 pivot support levels
4. Trader can plot Next week Camarilla levels
5. Previous Week High and Low
C) Monthly Pivots
Present Month –
1. Trader can plot Present Month CPR
2. Trader can plot Present Month R1, R2, R3 and R4 pivot resistance levels
3. Trader can plot Present Month S1, S2, S3 and S4 pivot support levels
4. Trader can plot Present Month Camarilla levels
Next Month –
1. Trader can plot Next Month CPR
2. Trader can plot Next Month R1, R2, R3 and R4 pivot resistance levels
3. Trader can plot Next Month S1, S2, S3 and S4 pivot support levels
4. Trader can plot Next Month Camarilla levels
5. Previous Month High and Low
Moreover, I have also included SMA (Simple moving averages) study in this indicator. Trader can add 20,50 & 200 SMA on there charts.
Why is it relevant? Trader can get a visual confirmation of an up-trending or an down-trending move by looking at rising or falling 20 & 50 SMA respectively
Usually in an uptrending stocks. 20 & 50 SMA will move in parallel to each other and will rise upwards. Price will tend to trade above the 20 SMA and 20 SMA will continue to act as a support.
The Multi-day Central Pivot RangeThe indicator is a Multi-day CPR.
It shows CPR range as per yesterday's HLC and also CPR range for last n number of trading sessions.
For example: If you mention the value as two in Multi-day CPR (blue color) then it calculates the CPR using HLC of the last two trading sessions.
Also, the daily CPR is designed in such a way to highlight Virgin CPR (purple color) separately from the normal CPR(fuchsia color) .

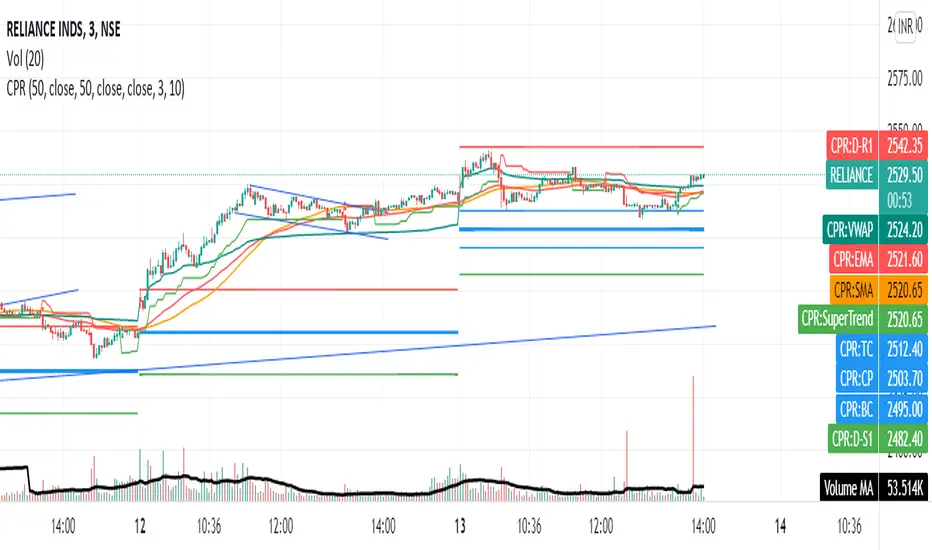
Share market aasan hai CPR with MA & VWAP This script will allow to add CPR with Standard Pivots and 4 Indicators.
Standard Pivot has 9 levels of support and 9 levels of resistance lines. It has CPR , 3 levels of Day-wise pivots , 3 levels of Weekly pivots and 3 Levels of Monthly Pivots .
In Addition to the CPR and Pivot , this script will allow user to Add 4 more Indicators - SMA , EMA , VWAP and SuperTrend as well.
All the Support and resistance levels can be enabled / disabled from settings. It will allow to select multiple combinations of support and resistance levels across 3 levels at any of the 3 time-frames individually and combined.
All 4 Indicators can be can be enabled / disabled from settings. This will allow the indicators to be plotted individually and combined along with any combination of CPR & Pivots .
These number of combinations will allow user to visualize the charts with desired indicators, pivot support & resistance levels on all or any of the 3 time frames.
For Ease of access, listed few points on how the script works..
- CPR and day-wise level 1 & 2 (S1 & R1) enabled by default and can be changed from settings
- Day-wise Level 2 & 3 (S2, R2, S3 & L3) can be enabled from settings
- Weekly 3 levels and Monthly 3 levels can be enabled from settings
- CPR & pivot levels colored in blue lines
- All support levels colored in Green
- All resistance levels Colored in Red
- Day-wise pivot , support & resistance are straight lines
- Weekly pivot , support & resistance are cross (+) lines
- Weekly pivot , support & resistance are circle (o) lines
- SMA , EMA , VWAP and SuperTrend Enabled by Default
- SMA
- EMA
- SuperTrend
15m RVOL + CPR Screener [AA37Amna5633]relvol and cpr table 4h 15mint relvol and cpr table relvol and cpr table relvol and cpr table relvol and cpr table

EP CPR Future CPR + 4 MA
1. CPR Trend Direction(Bias):
Bullish: If the current day's price is trading above the TC, it suggests a strong bullish trend where the CPR acts as a support zone.
Bearish: If the current day's price is trading below the BC, it suggests a strong bearish trend where the CPR acts as a resistance zone.
Range-Bound/Consolidation: If the price is trading within the CPR lines, it indicates a lack of clear directional bias and suggests a likely sideways or accumulation phase.
2. Moving average Trend Identification
Uptrend: If the price is above a moving average (and the MA line is sloping up), it confirms a bullish trend.
Downtrend: If the price is below a moving average (and the MA line is sloping down), it confirms a bearish trend.
Crossovers (Trading Signals)
A popular strategy involves using two moving averages—a short-term MA (e.g., 50-period) and a long-term MA (e.g., 200-period).
Golden Cross (Bullish Signal): Occurs when the shorter-term MA crosses above the longer-term MA.
Death Cross (Bearish Signal): Occurs when the shorter-term MA crosses below the longer-term MA.

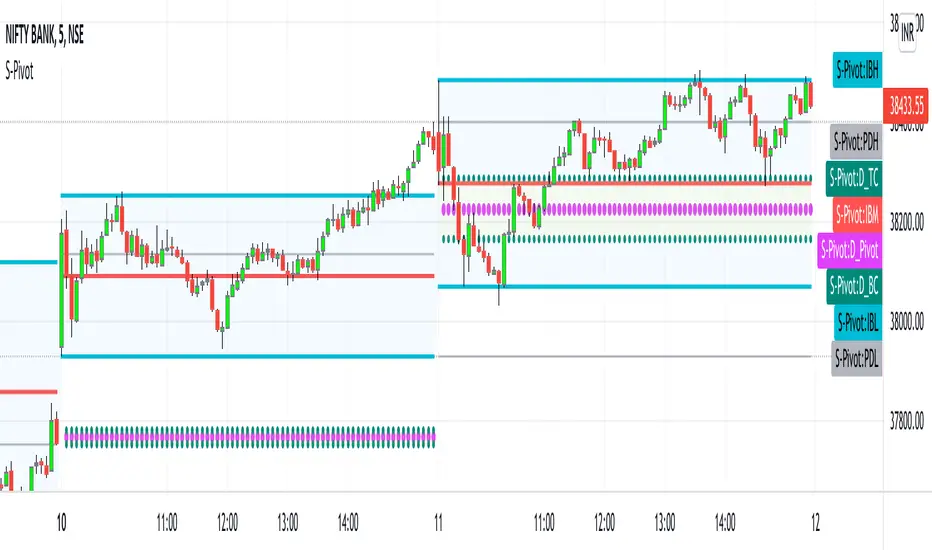
CPR_Previous Day Ranges_Initial BalanceHello Traders,
This script best works on Indian Index (Tested on BANKNIFTY & NIFTY)
This indicator can be used only for day trading (intraday: ex: 5min, 15min Timeframes) on indices.
This script helps to plot
1. Central Pivot Range(CPR)
2. Previous Day Ranges (PDH & PDL)
3. Initial Balance(IB)
brief description of indicators:
1. CPR: Central Pivot Range --> This indicator helps to identify key price points to set up trades. CPR is beneficial for intraday trading.
2.Previous Day Ranges: These ranges will help to understand the current day market.
PDH: Previous Day High value on current day
PDL: Previous Day Low value on current day
3.Initial Balance(IB):This indicator will help in day trading. IB will plot current day first 1hr high, low & mid values.
Disclaimer: This indicator can be used as refrence only. This has been tested on Banknifty and Nifty indices on day trading 5 minutes and 15 minutes timeframe. Understand yourself to knowledge of different trading methods.
Developing Pivot Range [Swastik]This is the developing cpr indicator made by Swastik.
It shows how the cpr is developing as the day is progressing.
The colour of the range is red when tc is below bc and green when tc is above bc .
While calculating the value of cpr , the high is the high from starting of the session and low is the low from starting of the session till that specific candle.
This also shows that the trend is developing.
If the colour is red and the range starts widening, it means downtrend has started to develop and
when the colour is green and range starts widening, it means uptrend is developing.

Camarilla + CPR + PDH/PDL (Visual Optimized)Camarilla + CPR + PDH/PDL (Visual Optimized)
This indicator is visually optimized and used same open-source camarilla pivot formulae.
// Camarilla
H3 = pc + rng * 1.1 / 4
H4 = pc + rng * 1.1 / 2
H5 = H4 + (H4 - H3)
H6 = H5 + (H5 - H4)
L3 = pc - rng * 1.1 / 4
L4 = pc - rng * 1.1 / 2
L5 = L4 - (L3 - L4)
L6 = L5 - (L4 - L5)
// CPR
pivot = (ph + pl + pc) / 3
bc = (ph + pl) / 2
tc = pivot * 2 - bc

MTF-CPR TableTable gives you CPR values based on Camarilla calculation with S&R 3 & 4 Levels...
Highlights the cell green when Price is in range and marks the Pivot Red when we have a Narrow CPR range...
Enjoy!!

Scalping CPRFetch Previous Day's Data:
Uses request.security to get the previous day's high, low, and close prices.
lookahead=barmerge.lookahead_on ensures the data fetched is fixed for the current session.
Calculate CPR Levels:
Pivot: Average of the previous day's high, low, and close.
Bottom Central Pivot (BC): Average of the previous day's high and low.
Top Central Pivot (TC): Derived from the pivot and BC.
R1 and S1: First resistance and support levels calculated from the pivot and previous day's prices.
Plotting:
Plots the CPR levels (pivot, BC, TC, R1, S1) on the chart with different colors.
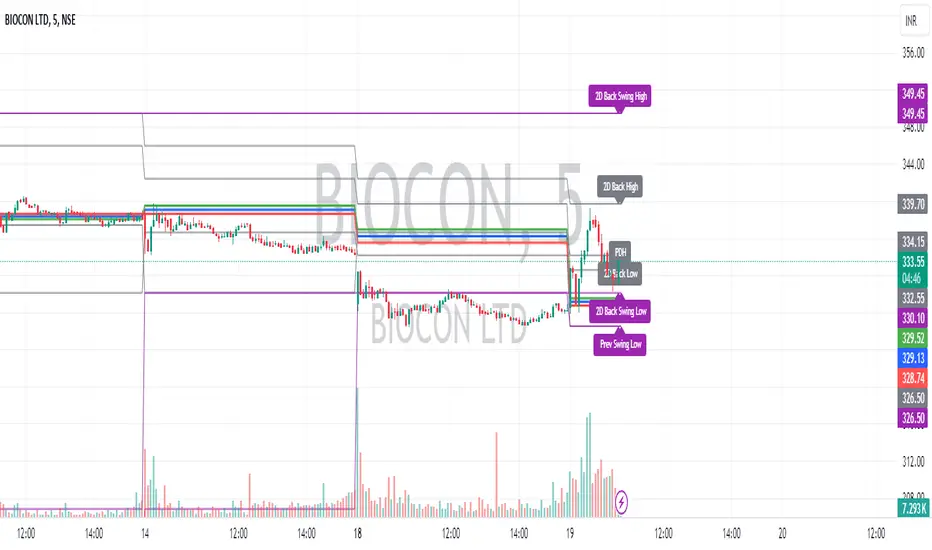
Intraday CPR with Previous Highs and Lows and Swing Highs/LowsThis Pine Script indicator plots the Central Pivot Range (CPR) for the current trading day along with previous day's high (PDH), low (PDL), and swing high/low (Swing H/L) values. It also includes the high, low, and swing high/low values from two days back for reference.
Key Features:
Central Pivot Range (CPR):
Pivot Point (PP): The central pivot point.
Bottom Central Pivot (BC): The lower boundary of the CPR.
Top Central Pivot (TC): The upper boundary of the CPR.
The area between the BC and TC is shaded for better visualization.
Previous Day and Two Days Back Values:
Previous Day High (PDH) and Low (PDL): Plots the high and low of the previous trading day.
Two Days Back High and Low: Plots the high and low from two trading days ago.
Previous Day Swing High/Low: The highest high and lowest low from a specified period (swing period) of the previous trading day.
Two Days Back Swing High/Low: The highest high and lowest low from a specified period (swing period) of two trading days ago.
Dk- Fibo and pivot levels with CPRThis script has the levels like
Fibonacci major and minor levels such as 1.618/2.618/3.618 and 1.382/1.00/2.00 respectively.
Pivot levels from R1 to R4.
CPR levels
Provided the percentage difference between CPR and TPR . Lower the difference higher the explosion of stocks.
Provided a No trade zone where the levels are colored. This zone is actually a area between R1 & S1 and Previous day high & low. Stocks tend to move larger once the area is breached.
Also added Moving average, vwap and mvwap with periods.
Historical days can be seen by changing the number of days.
Tomorrow's range can be seen by changing the type as 0.

VF-ST-EMA-CPRVolatility and Fibonacci table helps to identify support and resistance for the day/week. Similarly, the CPR (Central Pivot Range) table helps to identify the support and resistance for the day/week. Additionally use SUpertrend and EMA to identify trends.
Disclaimer:
This indicator is for educational or study purposes. There is no recommendation to buy or sell any scrip here. Take your own risks and rewards and you are only
responsible for any outcome after using this indicator.


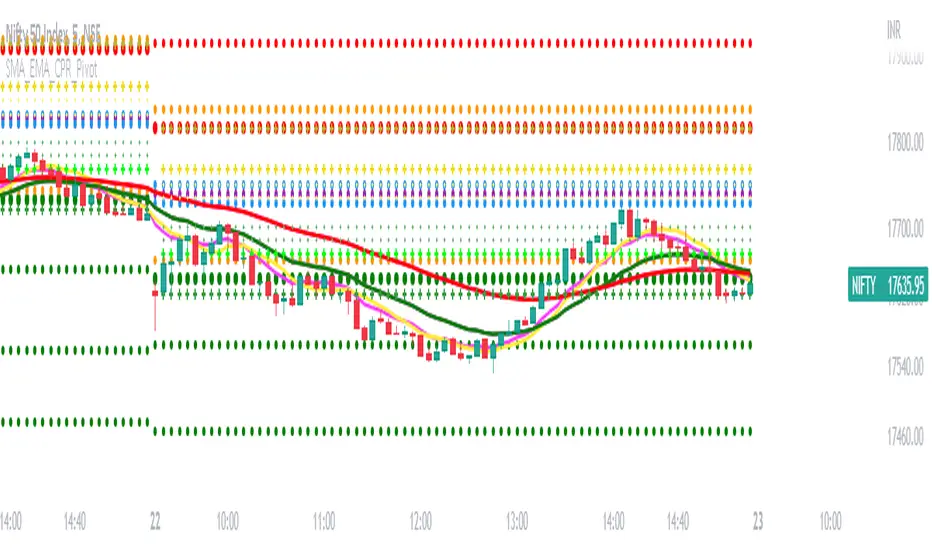
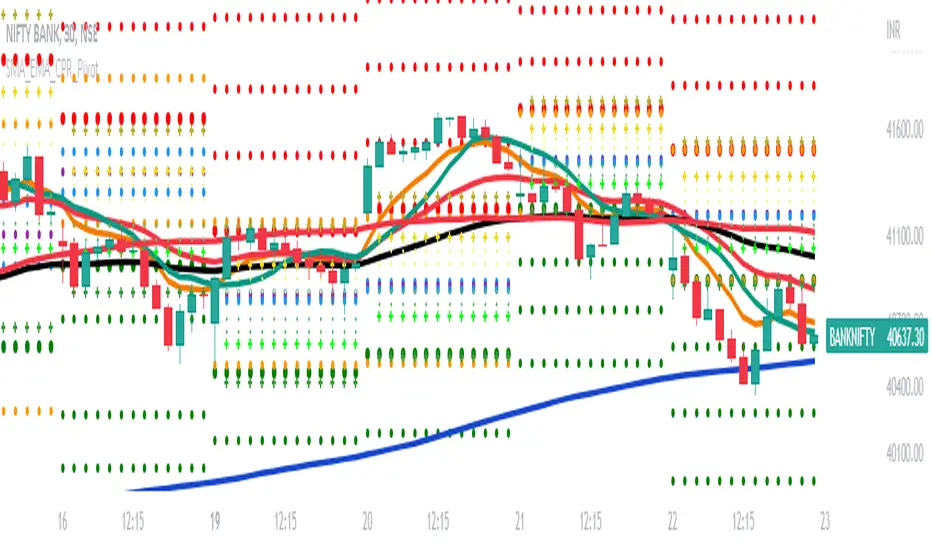
SMA_EMA_CPR_PivotThis Script can do multiple jobs in single indicator.
Like -:
Plot 3 SMA as per your inputs.
Plot 3 EMA as per your inputs.
Plot CPR Levels.
Plot Pivot Levels.
Plot Previous Day High Low.
Indicator can used in Intraday stock trading, Positional Trading and options trading.
Please Enjoy.