Aggregated Open Interest Multi-Exchange (USD)This indicator aggregates Open Interest (OI) data from multiple major cryptocurrency exchanges into a single unified view in USD, using data available on TradingView. It automatically adapts to the asset you're viewing on the chart.
Features:
Aggregates OI from 7 major exchanges: Binance, Bybit, OKX, Bitget, Deribit, HTX, and Coinbase
All values converted to USD - unlike native OI which shows contracts/coins
Uses only data available on TradingView platform
Automatically detects the asset from your chart (BTC, ETH, SOL, etc.)
True apples-to-apples comparison across exchanges
Displays as candlesticks showing OI open, high, low, and close
Toggle exchanges on/off individually
Handles different contract types per exchange automatically
Why USD conversion matters:
Traditional OI indicators show values in contracts or crypto units, making it difficult to compare across exchanges. This indicator converts everything to USD, giving you the real dollar value of open positions across all exchanges.
How it works:
Simply add the indicator to any crypto perpetual futures chart. It will automatically fetch and aggregate OI data from all supported exchanges for that asset using TradingView's built-in data feeds, converting everything to USD.
Supported Exchanges:
Binance, Bybit, Bitget, HTX: USDT perpetuals
Deribit: BTC/ETH use USD contracts, others use USDC
OKX: Contract-based (automatically converted)
Coinbase: USDC perpetuals
Perfect for traders who want a comprehensive view of total market Open Interest in USD across exchanges using reliable TradingView data.
Pesquisar nos scripts por "btc股市下跌"

Hurdle rateStocks beating BTC 50 > 200 Week EMA. The indicator is scanning the available stocks for equities that are beating BTC over mid term time frames.
50% Fib Trend Cloud + ATR BandsThis indicator plots two structural 50% fibonacci midpoints from recent confirmed 'left/right' swings that form a *cloud* of equilibrium, then adds a rolling 50% fibonacci range midpoint based on a lookback window that's wrapped in ATR bands. Importantly, it solves a specific trading problem:
Structural midpoints (macro context) are powerful but can lag when price escapes prior ranges. Enter rolling 50% fib + ATR ➡️ which restores real-time balance & tolerance (micro context). Together they show where price is balanced structurally, where it’s balanced right now, and how much volatility to tolerate before acting.
➖➖➖
🔑 Why this is different
Most tools either draw a single midpoint (ex., daily 50%) or ATR bands around a moving average. This script fuses dual swing-based 50% midpoints (structure) + a rolling 50% with ATR (flow), so you don’t lose context when price escapes prior ranges. The cloud tells you who’s in control (fast vs. slow structure). The rolling 50% + ATR tells you how far is “too far” now.
➖➖➖
🧠 What it does (at a glance)
🔸Structural Equilibrium × 2 (Fib1/Fib2)
Two independent 50% midpoints formed from swing pivots (configurable Left/Right bars + optional smoothing). Their gap is the Midpoint Cloud = structural “fair value” zone.
🔸Rolling 50% + ATR Bands
A rolling highest/lowest window computes an always-current 50% rolling midpoint plot; ±ATR × length envelopes define a soft value area and over-stretch boundaries.
🔸Actionable Visuals
Optional fill between Fib1/Fib2, labels, and candle-overlay modes to instantly read regime (above both / below both / between).
🔸Smart Defaults
Timeframe-aware presets for L/R pivots & smoothing; full manual overrides available.
➖➖➖
⚙️ Calculations (plain-English)
🔸Pivot midpoints (Fib1 & Fib2):
1) Detect a swing using `Left/Right` bars
2) Take the swing’s high/low → compute 50%
3) (Optional) Smooth the line (SMA) to stabilize on noisy TFs
4) Repeat with a different sensitivity to get two distinct midpoints
🔸Rolling midpoint:
Highest High / Lowest Low over the last *N* bars → (HH + LL) / 2
🔸ATR levels:
`Upper = Rolling50 + ATR × Mult`, `Lower = Rolling50 − ATR × Mult`
(Typical: ATR length 14–21; Multipliers 2.236 for L1, 5.382 for L2)
➖➖➖
🤖 Auto-Configured Presets (with Manual Override)
💡Goal: make the midpoints “just work” on common timeframes while still letting you dial them in.
💡How Auto Presets work
When Auto Presets = ON, the script picks sensible L/R/S (Left bars / Right bars / Smoothing) for Fib Trend 1 and Fib Trend 2 based on chart timeframe.
🔸Fib 1 (fast) emphasizes *micro-structure* for quicker bias shifts.
🔸Fib 2 (slow) emphasizes *macro-structure* for anchor/bias context.
These defaults keep Fib 1 responsive without jitter and Fib 2 stable without lag.
➡️ Turn Auto Presets = OFF to take full control with the manual inputs described below.
➖➖➖
🛠 Manual Fib Midpoint Settings (when Auto = OFF)
💡Each midpoint uses three knobs:
🔸Pivot Left (L): bars to the left that must be lower/higher to qualify a swing
🔸Pivot Right (R): bars to the right that must be lower/higher to confirm the swing
🔸Smoothing (S): SMA period applied to the raw 50% midpoint (stabilizes noise)
5-Minute optimized defaults
🔸Fib Trend 1: `L21 / R5 / S55` → responsive local structure (entries/exits, re-balancing zones)
🔸Fib Trend 2: `L55 / R13 / S89` → broader structure (trend context, anchors/stops)
Timeframe guidance
🔸1m–3m: may feel a touch laggy → consider ~`L13 / R3 / S34`
🔸15m–1h: defaults remain strong → optionally ~`L34 / R8 / S89`
🔸4h+ : increase span for stability → `L89–144 / R13–21 / S144–233`
➡️ Rule of thumb: shorter L/R = faster detection, longer S = smoother line. Tune until Fib 1 captures the “active swing” and Fib 2 captures the “dominant swing” without whipsaw.
➖➖➖
🎛 Inputs (quick reference)
🔸Fib Trend 1/2: Source (High/Low/Close), Left/Right bars, Smoothing length, Show/Hide, Cloud fill toggle
🔸Rolling 50%: Lookback length, Price basis (Wicks/Close/HLC3/OHLC4), Plot scope (Full / Last N / None)
🔸ATR Bands: ATR length, Multipliers (L1/L2), Plot scope, Line width/colors
🔸Overlay & Labels: Candle overlay mode, Label padding/size, 50% centerline toggle, Plot widths
➖➖➖
🖍️ Candle Coloring & Overlay Modes
💡Purpose: make trend instantly visible on the candles and ATR levels.
1) Color Logic (dropdown)
🔸 Fib Midpoints — Colors by position of price vs. Fib 1 & Fib 2
🔸ATR Zones — Colors by which ATR zone price is in relative to the Rolling 50%
➡️ Price Reference: Choose the input used for the decision (Close, HL2, OHLC3, OHLC4).
➡️Tip: Close is crisp; HL2/OHLC variants are smoother.
2) Overlay Style (dropdown)
🔸 None — No visual change to candles
🔸 Bar Color — Uses `barcolor()` to tint built-in candles (this takes into account your Trading View settings, for instance if you have wicks set to white, they will show up as white with this setting)
🔸 PlotCandles — Draws unified custom candles (body, wick, border) with the same color for maximum clarity
💡Practical use
🔸 Pick Fib Midpoints to read structural bias at a glance (above/below/between the cloud).
🔸 Pick ATR Zones to read value vs. stretch around the Rolling 50% (mean-reversion vs. trend extension).
➖➖➖
📘 How to use
A) Trend confirmation
- Strong bullish bias when price holds above both structural mids; strong bearish when below both.
- Use the Rolling 50% + ATR as a dynamic re-entry zone: pullbacks that respect ATR(L1) often continue the prevailing trend.
B) Transition / mean reversion
- Inside the Cloud (between Fib1 & Fib2) treat behavior as neutralization/re-balancing; range tactics tend to outperform momentum plays.
- In ranges, fades near ±ATR around the rolling 50% can mark short-term edges.
C) Breakout context
- When price leaves the Cloud, the Rolling 50% keeps you anchored so price never feels “floating.” A clean hold outside ATR(L1/L2) suggests regime strength; quick re-entries hint at traps.
➖➖➖
🖼 Chart examples
➡️ Each snapshot shows how the Cloud (structure) and the Rolling 50% + ATR (flow) work together.
1) 1-Minute Downtrend – Cloud as Dynamic Ceiling
- The Cloud slopes down; pullbacks repeatedly fail under the Cloud’s underside.
- Rolling 50% (dashed mid) + ATR(L1) act as a reversion band: rallies stall near upper ATR and rotate lower.
2) 15-Minute Persistent Drift – Structure Guides, Flow Times Entries
- Long drift lower with Cloud overhead.
- Consolidations near the rolling mid resolve in the trend direction; ATR bands frame risk on each attempt.
3) 15-Minute Uptrend (BTC) – From Cloud Escape to Value Stair-Step
- After escaping the prior Cloud, rolling 50% + ATR establish a new higher value area.
- Pullbacks into ATR(L1) produce orderly stair-steps; Cloud remains supportive on deeper dips
4) 5-Minute BTC – Pullback to Value then Rotate
- Strong leg up; retrace tags lower ATR band and rotates back toward the rolling mid.
- Labels (Fib1/Fib2) make the structural context explicit for decision-making.
➖➖➖
🧪 Starter presets
- Intraday (5–15m): Fib1 ~ L21/R5 (smooth 5), Fib2 ~ L55/R13 (smooth 9) • Rolling = 55 • ATR = 14 • L1 = 2.5x, L2 = 5.0x
- Scalping: Shorten lookbacks & smoothing; keep ATR multipliers similar, or tighten L1.
- Swing: Lengthen all lookbacks; consider ATR length 21–28.
➖➖➖
🏁Final Word
This script is not just a visual tool, it’s a complete trend and structure framework. Whether you're looking for clean trend alignment, dynamic support/resistance, or early warning signs of a reversal, this system is tuned to help you react with confidence — not hindsight.
Rembember, no single indicator should be used in isolation. For best results, combine it with price action analysis, higher-timeframe context, and complementary tools like trendlines, moving averages etc Use it as part of a well-rounded trading approach to confirm setups — not to define them alone.
---
💡Turn logic into clarity. Structure into trades. And uncertainty into confidence.

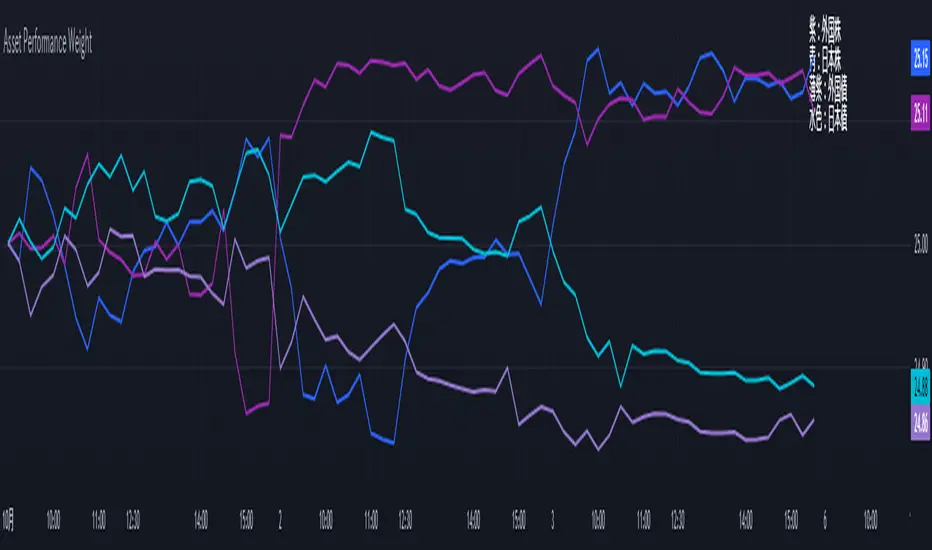
Performance-based Asset Weighting(MTF)**Performance-Based Asset Weighting (MTF/Symbol Free Setting)**
#### Overview
This indicator is a tool that visualizes the relative strength of performance (price change rate) as “weight (allocation ratio)” for **four user-defined stocks**.
By setting any specified past point in time as the baseline (where all symbols are equally weighted at 25%), it aims to provide an intuitive understanding of which symbols outperformed others and attracted capital, or underperformed and saw capital outflows.
**【Default Settings and Application Scenario: Pension Fund Rebalancing Analysis】**
The default settings reference the basic portfolio of Japan's Government Pension Investment Fund (GPIF), configuring four major asset classes: domestic equities, foreign equities, domestic bonds, and foreign bonds. It is known that when market fluctuations cause deviations from this equal-weighted ratio, rebalancing occurs to restore the original ratio (selling assets whose weight has increased and buying assets whose weight has decreased).
Analyzing using this default setting can serve as a reference point for considering **“whether rebalancing sales (or purchases) by pension funds and similar entities are likely to occur in the future.”**
**【Important: Usage Notes】**
The weights shown by this indicator are **theoretical reference values** calculated solely based on performance from the specified start date. Even if large investors conduct significant rebalancing (asset buying/selling) during the period, those transactions themselves are not reflected in this chart's calculations.
Therefore, please understand that the actual portfolio ratios may differ. **Use this solely as a rough guideline. **
#### Key Features
* **Freely configure the 4 assets for analysis:** You can freely set any 4 assets (stocks, indices, currencies, cryptocurrencies, etc.) you wish to compare via the settings screen.
* **Performance-based weight calculation:** Rather than simple price composition ratios, it calculates each asset's price change since the specified start date as a “performance index” and displays each asset's proportion of the total sum.
* **Freely set analysis start date:** You can set any desired starting point for analysis, such as “after the XX shock” or “after earnings announcements,” using the calendar.
* **Multi-Timeframe (MTF) Support:** Independently of the timeframe displayed on the chart, you can freely select the timeframe (e.g., 1-hour, 4-hour, daily) used by the indicator for calculations.
#### Calculation Principle
This indicator calculates weights in the following three steps:
1. **Obtaining the Base Price**
Obtain the closing price for each of the four stocks on the user-set “Start Date for Weight Calculation.” This becomes the **base price** for analysis.
2. **Calculating the Performance Index**
Divide the current price of each stock by the **base price** obtained in Step 1 to calculate the “Performance Index”.
`Performance Index = Current Price ÷ Base Date Price`
This quantifies how many times the current performance has increased compared to the base date performance, which is set to “1”.
3. **Calculating Weights**
Sum the “Performance Indexes” of the four stocks. Then, calculate the percentage contribution of each stock's Performance Index to this total sum and plot it on the chart.
`Weight (%) = (Individual Performance Index ÷ Total Performance Index of 4 Stocks) × 100`
Using this logic, on the analysis start date, all stocks' performance indices are set to “1”, so the weights start equally at 25%.
#### Usage
* **Application Example 1: Market Sentiment Analysis (Using Default Settings)**
Analyze using the default asset classes. By observing the relative strength between “Equities” and “Bonds”, you can assess whether the market is risk-on or risk-off.
* **Application Example 2: Sector/Theme Strength Analysis**
Configure settings for groups like “Top 4 semiconductor stocks” or “4 GAFAM stocks.” Setting the start date to the beginning of the year or earnings season allows you to instantly compare which stocks within the same sector are performing best.
* **Application Example 3: Cryptocurrency Power Map Analysis**
By setting major cryptocurrencies like “BTC, ETH, SOL, ADA,” you can analyze which currencies are attracting market capital.
**【About Legend Display】**
Due to Pine Script specification constraints, the legend on the chart will display fixed names: **“Stock 1” to “Stock 4”. **
Please note that the symbol you entered for “Symbol 1” in the settings corresponds to the “Symbol 1” line on the chart.
#### Settings
* **Symbol 1 to Symbol 4:** Set the four symbols you wish to analyze.
* **Timeframe for Calculation:** Select the timeframe the indicator references when calculating weights.
* **Start Date for Weight Calculation:** This serves as the base date for comparing performance.
#### Disclaimer
This script is solely a tool to assist with market analysis and does not recommend buying or selling any specific financial instruments. Please make all final investment decisions at your own discretion.
-------------------------------------------------------------------------------------------------------------------
**Performance-based Asset Weighting(MTF・シンボル自由設定)**
#### 概要
このインジケーターは、**ユーザーが自由に設定した4つの銘柄**について、パフォーマンス(騰落率)の相対的な強さを「ウェイト(構成比率)」として可視化するツールです。
指定した過去の任意の時点を基準(全銘柄が均等な25%)として、そこからどの銘柄のパフォーマンスが他の銘柄を上回り、資金が向かっているのか、あるいは下回っているのかを直感的に把握することを目的としています。
**【デフォルト設定と活用シナリオ:年金基金のリバランス考察】**
デフォルト設定では、日本の年金積立金管理運用独立行政法人(GPIF)の基本ポートフォリオを参考に、主要4資産クラス(国内株式, 外国株式, 国内債券, 外国債券)が設定されています。市場の変動によってこの均等な比率に乖離が生じると、元の比率に戻すためのリバランス(比率が増えた資産を売り、減った資産を買う)が行われることが知られています。
このデフォルト設定で分析することで、**「今後、年金基金などによるリバランスの売り(買い)が発生する可能性があるか」を考察するための、一つの目安として利用できます。**
**【重要:利用上の注意点】**
このインジケーターが示すウェイトは、あくまで指定した開始日からのパフォーマンスのみを基に算出した**理論上の参考値**です。実際に大口投資家などが途中で大規模なリバランス(資産の売買)を行ったとしても、その取引自体はこのチャートの計算には反映されません。
そのため、実際のポートフォリオ比率とは異なる可能性があることをご理解の上、**あくまで大まかな目安としてご活用ください。**
#### 主な特徴
* **分析対象の4銘柄を自由に設定可能:** 設定画面から、比較したい4つの銘柄(株式、指数、為替、仮想通貨など)を自由に設定できます。
* **パフォーマンス基準のウェイト計算:** 単純な価格の構成比ではなく、指定した開始日からの各銘柄の騰落を「パフォーマンス指数」として算出し、その合計に占める各銘柄の割合を表示します。
* **分析開始日の自由な設定:** 「〇〇ショック後」「決算発表後」など、分析したい任意の時点をカレンダーから設定できます。
* **マルチタイムフレーム(MTF)対応:** チャートに表示している時間足とは別に、インジケーターが計算に使う時間足(1時間足、4時間足、日足など)を自由に選択できます。
#### 計算の原理
このインジケーターは、以下の3ステップでウェイトを算出しています。
1. **基準価格の取得**
ユーザーが設定した「ウェイト計算の開始日」における、4つの各銘柄の終値を取得し、これを分析の**基準価格**とします。
2. **パフォーマンス指数の算出**
現在の各銘柄の価格を、ステップ1で取得した**基準価格**で割ることで、「パフォーマンス指数」を算出します。
`パフォーマンス指数 = 現在の価格 ÷ 基準日の価格`
これにより、基準日のパフォーマンスを「1」とした場合、現在のパフォーマンスが何倍になっているかが数値化されます。
3. **ウェイトの算出**
4つの銘柄の「パフォーマンス指数」の合計値を算出します。そして、合計値に占める各銘柄のパフォーマンス指数の割合(%)を計算し、チャートに描画します。
`ウェイト (%) = (個別のパフォーマンス指数 ÷ 4銘柄のパフォーマンス指数の合計) × 100`
このロジックにより、分析開始日には全銘柄のパフォーマンス指数が「1」となるため、ウェイトは均等に25%からスタートします。
#### 使用方法
* **応用例1:市場のセンチメント分析(デフォルト設定利用)**
デフォルト設定の資産クラスで分析し、「株式」と「債券」の力関係を見ることで、市場がリスクオンなのかリスクオフなのかを判断する材料になります。
* **応用例2:セクター・テーマ別の強弱分析**
設定画面で、例えば「半導体関連の主要4銘柄」や「GAFAMの4銘柄」などを設定します。開始日を年初や決算時期に設定することで、同セクター内でどの銘柄が最もパフォーマンスが良いかを一目で比較できます。
* **応用例3:仮想通貨の勢力図分析**
「BTC, ETH, SOL, ADA」など、主要な仮想通貨を設定することで、市場の資金がどの通貨に向かっているのかを分析できます。
**【凡例の表示について】**
Pine Scriptの仕様上の制約により、チャート上の凡例は**「銘柄1」〜「銘柄4」という固定名で表示されます。**
お手数ですが、設定画面でご自身が「銘柄1」に入力したシンボルが、チャート上の「銘柄1」のラインに対応する、という形でご覧ください。
#### 設定項目
* **銘柄1〜銘柄4:** 分析したい4つのシンボルをそれぞれ設定します。
* **計算に使う時間足:** インジケーターがウェイトを計算する際に参照する時間足を選択します。
* **ウェイト計算の開始日:** パフォーマンスを比較する上での基準日となります。
#### 免責事項
このスクリプトはあくまで市場分析を補助するためのツールであり、特定の金融商品の売買を推奨するものではありません。投資の最終的な判断は、ご自身の責任において行ってください。
Pairs Trading Scanner [BackQuant]Pairs Trading Scanner
What it is
This scanner analyzes the relationship between your chart symbol and a chosen pair symbol in real time. It builds a normalized “spread” between them, tracks how tightly they move together (correlation), converts the spread into a Z-Score (how far from typical it is), and then prints clear LONG / SHORT / EXIT prompts plus an at-a-glance dashboard with the numbers that matter.
Why pairs at all?
Markets co-move. When two assets are statistically related, their relationship (the spread) tends to oscillate around a mean.
Pairs trading doesn’t require calling overall market direction you trade the relative mispricing between two instruments.
This scanner gives you a robust, visual way to find those dislocations, size their significance, and structure the trade.
How it works (plain English)
Step 1 Pick a partner: Select the Pair Symbol to compare against your chart symbol. The tool fetches synchronized prices for both.
Step 2 Build a spread: Choose a Spread Method that defines “relative value” (e.g., Log Spread, Price Ratio, Return Difference, Price Difference). Each lens highlights a different flavor of divergence.
Step 3 Validate relationship: A rolling Correlation checks if the pair is moving together enough to be tradable. If correlation is weak, the scanner stands down.
Step 4 Standardize & score: The spread is normalized (mean & variability over a lookback) to form a Z-Score . Large absolute Z means “stretched,” small means “near fair.”
Step 5 Signals: When the Z-Score crosses user-defined thresholds with sufficient correlation , entries print:
LONG = long chart symbol / short pair symbol,
SHORT = short chart symbol / long pair symbol,
EXIT = mean reversion into the exit zone or correlation failure.
Core concepts (the three pillars)
Spread Method Your definition of “distance” between the two series.
Guidance:
Log Spread: Focuses on proportional differences; robust when prices live on different scales.
Price Ratio: Classic relative value; good when you care about “X per Y.”
Return Difference: Emphasizes recent performance gaps; nimble for momentum-to-mean plays.
Price Difference: Straight subtraction; intuitive for similar-scale assets (e.g., two ETFs).
Correlation A rolling score of co-movement. The scanner requires it to be above your Min Correlation before acting, so you’re not trading random divergence.
Z-Score “How abnormal is today’s spread?” Positive = chart richer than pair; negative = cheaper. Thresholds define entries/exits with transparent, statistical context.
What you’ll see on the chart
Correlation plot (blue line) with a dashed Min Correlation guide. Above the line = green zone for signals; below = hands off.
Z-Score plot (white line) with colored, dashed Entry bands and dotted Exit bands. Zero line for mean.
Normalized spread (yellow) for a quick “shape read” of recent divergence swings.
Signal markers :
LONG (green label) when Z < –Entry and corr OK,
SHORT (red label) when Z > +Entry and corr OK,
EXIT (gray label) when Z returns inside the Exit band or correlation drops below the floor.
Background tint for active state (faint green for long-spread stance, faint red for short-spread stance).
The two built-in dashboards
Statistics Table (top-right)
Pair Symbol Your chosen partner.
Correlation Live value vs. your minimum.
Z-Score How stretched the spread is now.
Current / Pair Prices Real-time anchors.
Signal State NEUTRAL / LONG / SHORT.
Price Ratio Context for ratio-style setups.
Analysis Table (bottom-right)
Avg Correlation Typical co-movement level over your window.
Max |Z| The recent extremes of dislocation.
Spread Volatility How “lively” the spread has been.
Trade Signal A human-readable prompt (e.g., “LONG A / SHORT B” or “NO TRADE” / “LOW CORRELATION”).
Risk Level LOW / MEDIUM / HIGH based on current stretch (absolute Z).
Signals logic (plain English)
Entry (LONG): The spread is unusually negative (chart cheaper vs pair) and correlation is healthy. Expect mean reversion upward in the spread: long chart, short pair.
Entry (SHORT): The spread is unusually positive (chart richer vs pair) and correlation is healthy. Expect mean reversion downward in the spread: short chart, long pair.
Exit: The spread relaxes back toward normal (inside your exit band), or correlation deteriorates (relationship no longer trusted).
A quick, repeatable workflow
1) Choose your pair in context (same sector/theme or known macro link). Think: “Do these two plausibly co-move?”
2) Pick a spread lens that matches your narrative (ratio for relative value, returns for short-term performance gaps, etc.).
3) Confirm correlation is above your floor no corr, no trade.
4) Wait for a stretch (Z beyond Entry band) and a printed LONG / SHORT .
5) Manage to the mean (EXIT band) or correlation failure; let the scanners’ state/labels keep you honest.
Settings that matter (and why)
Spread Method Defines the “mispricing” you care about.
Correlation Period Longer = steadier regime read, shorter = snappier to regime change.
Z-Score Period The window that defines “normal” for the spread; it sets the yardstick.
Use Percentage Returns Normalizes series when using return-based logic; keep on for mixed-scale assets.
Entry / Exit Thresholds Set your stretch and your target reversion zone. Wider entries = rarer but stronger signals.
Minimum Correlation The gatekeeper. Raising it favors quality over quantity.
Choosing pairs (practical cheat sheet)
Same family: two index ETFs, two oil-linked names, two gold miners, two L1 tokens.
Hedge & proxy: stock vs. sector ETF, BTC vs. BTC index, WTI vs. energy ETF.
Cross-venue or cross-listing: instruments that are functionally the same exposure but price differently intraday.
Reading the cues like a pro
Divergence shape: The yellow normalized spread helps you see rhythm fast spike and snap-back versus slow grind.
Corr-first discipline: Don’t fight the “Min Correlation” line. Good pairs trading starts with a relationship you can trust.
Exit humility: When Z re-centers, let the EXIT do its job. The edge is the journey to the mean, not overstaying it.
Frequently asked (quick answers)
“Long/Short means what exactly?”
LONG = long the chart symbol and short the pair symbol.
SHORT = short the chart symbol and long the pair symbol.
“Do I need same price scales?” No. The spread methods normalize in different ways; choose the one that fits your use case (log/ratio are great for mixed scales).
“What if correlation falls mid-trade?” The scanner will neutralize the state and print EXIT . Relationship first; trade second.
Field notes & patterns
Snap-back days: After a one-sided session, return-difference spreads often flag cleaner intraday mean reversions.
Macro rotations: Ratio spreads shine during sector re-weights (e.g., value vs. growth ETFs); look for steady corr + elevated |Z|.
Event bleed-through: If one symbol reacts to news and its partner lags, Z often flags a high-quality, short-horizon re-centering.
Display controls at a glance
Show Statistics Table Live state & key numbers, top-right.
Show Analysis Table Context/risk read, bottom-right.
Show Correlation / Spread / Z-Score Toggle the sub-charts you want visible.
Show Entry/Exit Signals Turn markers on/off as needed.
Coloring Adjust Long/Short/Neutral and correlation line colors to match your theme.
Alerts (ready to route to your workflow)
Pairs Long Entry Z falls through the long threshold with correlation above minimum.
Pairs Short Entry Z rises through the short threshold with correlation above minimum.
Pairs Trade Exit Z returns to neutral or the relationship fails your correlation floor.
Correlation Breakdown Rolling correlation crosses your minimum; relationship caution.
Final notes
The scanner is designed to keep you systematic: require relationship (correlation), quantify dislocation (Z-Score), act when stretched, stand down when it normalizes or the relationship degrades. It’s a full, visual loop for relative-value trading that stays out of your way when it should and gets loud only when the numbers line up.

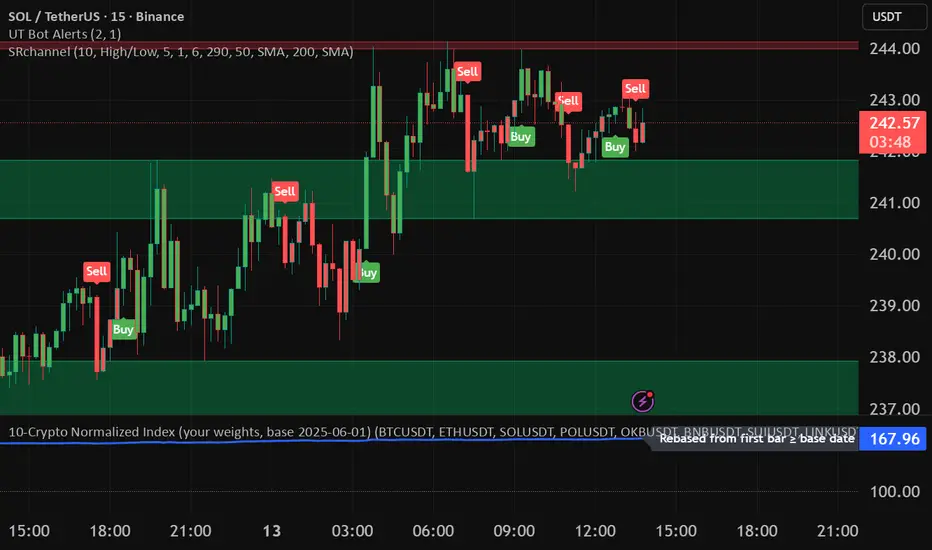
10-Crypto Normalized IndexOverview
This indicator builds a custom index for up to 10 cryptocurrencies and plots their combined trend as a single line. Each coin is normalized to 100 at a user-selected base date (or at its first available bar), then averaged (equally or by your custom weights). The result lets you see the market direction of your basket at a glance.
How it works
For each symbol, the script finds a base price (first bar ≥ the chosen base date; or the first bar in history if base-date normalization is off).
It converts the current price to a normalized value: price / base × 100.
It then computes a weighted average of those normalized values to form the index.
A dotted baseline at 100 marks the starting point; values above/below 100 represent % performance vs. the base.
Key inputs
Symbols (10 max): Default set: BTC, ETH, SOL, POL, OKB, BNB, SUI, LINK, 1INCH, TRX (USDT pairs). You can change exchange/quote (keep all the same quote, e.g., all USDT).
Weights: Toggle equal weights or enter custom weights. Custom weights are auto-normalized internally, so they don’t need to sum to 1.
Base date: Year/Month/Day (default: 2025-06-01). Turning normalization off uses each symbol’s first available bar as its base.
Smoothing: Optional SMA to reduce noise.
Show baseline: Toggle the horizontal line at 100.
Interpretation
Index > 100 and rising → your basket is up since the base date.
Index < 100 and falling → down since the base date.
Use shorter timeframes for intraday sentiment, higher timeframes for swing/trend context.
Default basket & weights (editable)
Order: BTC, ETH, SOL, POL, OKB, BNB, SUI, LINK, 1INCH, TRX.
Default custom weight factors: 30, 30, 20, 10, 10, 5, 5, 5, 5, 5 (auto-normalized).
Base date: 2025-06-01.
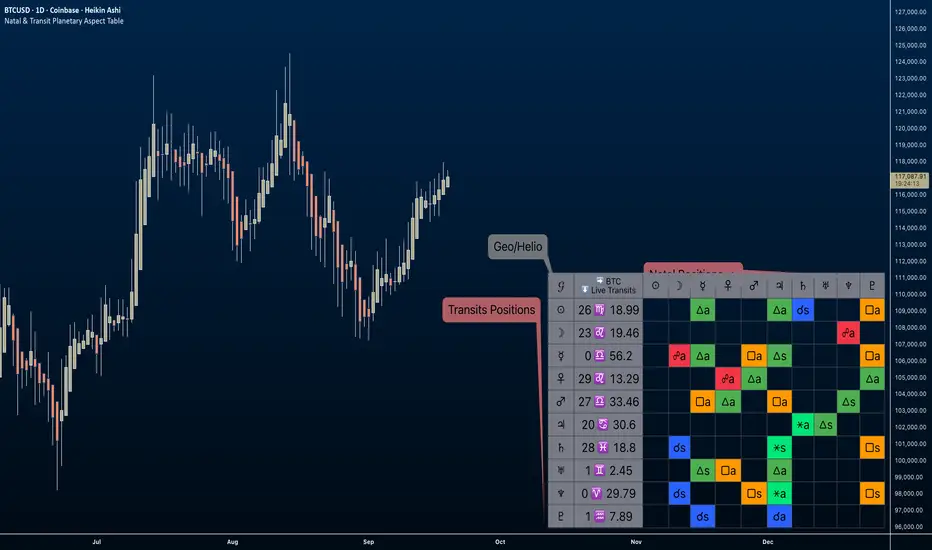
Natal & Transit Planetary Aspect Table📐 Natal & Transit Planetary Aspect Table
This open-source TradingView indicator displays a customizable table of astrological aspects between natal (first trade or custom date) planetary positions and current/live transits. Built in Pine Script v6, it leverages the AstroLib library for accurate geocentric or heliocentric longitude calculations, supporting a range of financial assets and historical events. Ideal for astro-finance enthusiasts, it highlights major and minor aspects with orbs, applying/separating status, and color-coded visuals. Supports 10 planetary bodies in geocentric mode (Sun, Moon, Mercury, Venus, Mars, Jupiter, Saturn, Uranus, Neptune, Pluto) or 11 in heliocentric mode (adds Earth).
Why Use This Indicator?
Astrology offers a unique lens for market analysis by examining planetary alignments relative to an asset's "birth" date (e.g., first trade), potentially revealing cycles, trends, and timing insights that complement technical and fundamental strategies. This tool empowers traders to integrate astro-finance principles, visualizing cosmic influences that may correlate with price movements, reversals, or volatility—backed by historical presets and customizable options for personalized research.
Key Features:
- 23 preset natal dates for assets like BTC, ETH, NYSE, and more (e.g., BTC genesis block on 2009-01-03), with credits to Susan Abbott Gidel for most of the first trade dates from her book " Trading In Sync With Commodities: Introducing Astrology To Your Technical Toolbox ."
- Manual natal and transit timestamp inputs for flexibility.
- Supports geocentric (default) or heliocentric views (displayed as 𝒢 or ℋ in the table), with adjustable observer location (latitude, longitude, timezone).
- Configurable aspects: Conjunction (☌), Opposition (☍), Trine (△), Square (□), Sextile (⚹), and minors like Semi-Sextile (⚺), Quincunx (⚻), etc., with user-defined orbs and colors.
- Applying (a) or separating (s) status is determined by comparing the orb on the current bar to the previous one—if decreasing, applying; if increasing, separating. This simplified approach may differ from traditional astrological methods that consider planetary speeds, directions (direct/retrograde), and which body is faster/slower.
- Table displays planet symbols or names, degrees/signs with tooltips showing exact longitude (e.g., hovering over a planet symbol reveals its precise degree), and aspect symbols/tags (e.g., ⚹a for applying sextile).
- Tooltip on the dates cell to view the exact transit and natal dates for easy tracking.
- Live mode updates with chart timeframe; test mode allows the user to move the transit date historically or to the future via a custom timestamp.
- Customizable table position, text size, colors, and visibility.
How to Use:
1. Add the indicator to your TradingView chart.
2. Select a preset or manual natal date in settings.
3. Choose live transits or test mode with a custom timestamp.
4. Enable/disable aspects and adjust orbs/colors as needed.
5. Hover over cells for detailed tooltips (e.g., exact orb and applying/separating status).
Powered by @BarefootJoey AstroLib for ephemeris data. For best accuracy, verify positions against external sources.
Dynamic S/R System - Pivot + ChannelDynamic S/R System - Pivot + Channel
A comprehensive Support & Resistance indicator combining dual methodologies for institutional-grade price level analysis
📊 CORE FEATURES
Dual Detection System
• Pivot-Based Levels - Historical turning points with intelligent touch counting
• Dynamic Channel S/R - Trend-aware linear regression boundaries
• Smart Level Management - Auto-merges similar levels, removes weak/outdated ones
Volume Integration
• Multi-timeframe volume analysis using EMA oscillator and spike detection
• Volume confirmation for all breakout signals to filter false moves
• Real-time volume status (Normal/High/Spike) in live information panel
Intelligent Touch Counting
• Automatic level validation through touch frequency analysis
• Strength classification with visual differentiation (colors/thickness)
• Level labels showing exact touch count (S3, R5, etc.)
━━━━━━━━━━━━━━━━━━━━━━━━━━━━━━━━━━━━━━━━━━━━━━━━━━━━━━━━━━━━━━━━━━━━━━━━━━━━━━━
🎨 VISUAL ELEMENTS
Line System
Solid Lines: Pivot-based S/R levels
Dashed Lines: Dynamic channel boundaries
Color Coding:
• 🔵 Blue/🔴 Red: Standard support/resistance
• 🟠 Orange: Strong levels (multiple touches)
• 🟣 Purple: Channel S/R levels
Signal Labels
• "B" - Pivot S/R breakout with volume confirmation
• "CB" - Channel boundary breakout
• "Bull/Bear Wick" - False breakout detection (wick rejections)
Information Panel
Real-time analysis displays:
• Total resistance/support levels detected
• Closest S/R levels to current price
• Volume status and position relative to levels
• Current market position assessment
━━━━━━━━━━━━━━━━━━━━━━━━━━━━━━━━━━━━━━━━━━━━━━━━━━━━━━━━━━━━━━━━━━━━━━━━━━━━━━━
✅ KEY ADVANTAGES
Multi-Method Validation
Combines historical pivot analysis with dynamic trend channels for comprehensive market view
False Breakout Protection
• Volume confirmation requirements
• Wick analysis to identify failed attempts
• Multiple validation criteria before signal generation
Adaptive Level Management
• Automatically updates as new pivots form
• Removes outdated/weak levels
• Maintains clean, relevant level display
Institutional-Grade Analysis
• Touch counting reveals institutional respect levels
• Volume integration shows smart money activity
• Strength classification identifies high-probability zones
━━━━━━━━━━━━━━━━━━━━━━━━━━━━━━━━━━━━━━━━━━━━━━━━━━━━━━━━━━━━━━━━━━━━━━━━━━━━━━━
⏰ OPTIMAL USE CASES
Best Timeframes
• Daily - Primary recommendation for swing trading
• 4-Hour - Intraday analysis and entries
• Weekly - Long-term position planning
Ideal Markets
• Crypto pairs (especially ETH/BTC, BTC/USD)
• Forex majors with good volume data
• Large-cap stocks with institutional participation
Trading Applications
• Entry/exit planning around key S/R levels
• Breakout confirmation with volume validation
• Risk management using nearest S/R for stops
• Trend analysis through channel dynamics
━━━━━━━━━━━━━━━━━━━━━━━━━━━━━━━━━━━━━━━━━━━━━━━━━━━━━━━━━━━━━━━━━━━━━━━━━━━━━━━
⚙️ CONFIGURATION GUIDELINES
Conservative Setup (Higher Confidence)
Min Pivot Strength: 3-4
Volume Threshold: 25-30%
Max Levels: 6-8
Aggressive Setup (More Signals)
Min Pivot Strength: 2
Volume Threshold: 15-20%
Max Levels: 10-12
🔔 ALERT SYSTEM
Breakout Alerts
• Resistance/Support breaks with volume confirmation
• Channel boundary violations
• Approaching strong S/R levels
Advanced Notifications
• Strong level approaches (within 0.5% of price)
• False breakout detection
• Volume spike confirmations
📈 TRADING STRATEGY GUIDE
Entry Strategy
1. Wait for price to approach identified S/R level
2. Confirm with volume analysis (spike/high volume preferred)
3. Watch for wick formations indicating rejection
4. Enter on confirmed breakout with volume or bounce with rejection
Risk Management
• Use nearest S/R level for stop placement
• Scale position size based on level strength (touch count)
• Monitor volume confirmation for exit signals
Market Context
• Combine with higher timeframe trend analysis
• Consider overall market sentiment and volatility
• Use channel direction for bias confirmation
Transform complex S/R analysis into actionable trading intelligence with institutional-level insights for professional trading decisions.

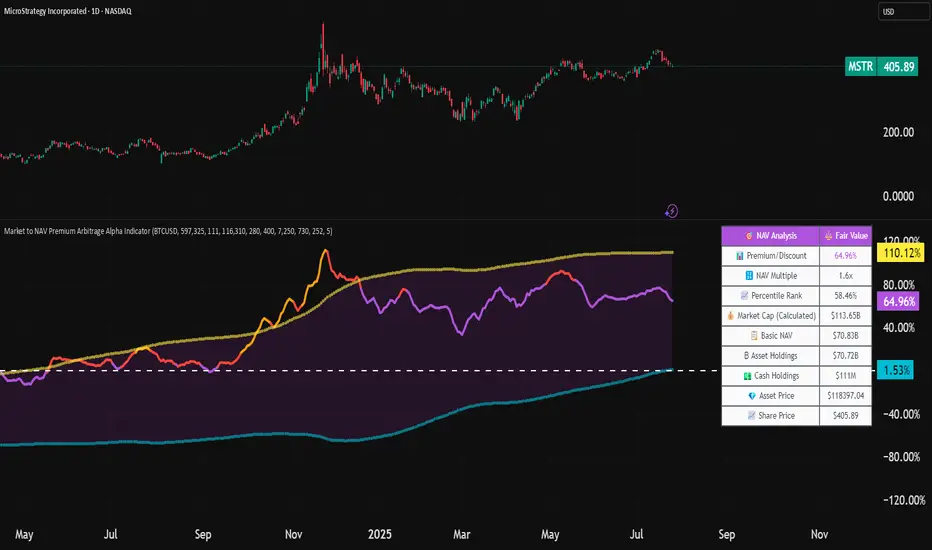
Market to NAV Premium Arbitrage Alpha IndicatorBitcoin treasury companies such as Microstrategy are known for trading at significant premiums. but how big exactly is the premium? And how can we measure it in real time?
I developed this quantitative tool to identify statistical mispricings between market capitalization and net asset value (NAV), specifically designed for arbitrage strategies and alpha generation in Bitcoin-holding companies, such as MicroStrategy or Sharplink Gaming, or SPACs used primarily to hold cryptocurrencies, Bitcoin ETFs, and other NAV-based instruments. It can probably also be used in certain spin-offs.
KEY FEATURES:
✅ Real-time Premium/Discount Calculation
• Automatically retrieves market cap data from TradingView
• Calculates precise NAV based on underlying asset holdings (for example Bitcoin)
• Formula: (Market Cap - NAV) / NAV × 100
✅ Statistical Analysis
• Historical percentile rankings (customizable lookback period)
• Standard deviation bands (2σ) for extreme value detection (close to these values might be seen as interesting points to short or go long)
• Smoothing period to reduce noise
✅ Multi-Source Market Cap Detection
• You can add the ticker of the NAV asset, but if necessary, you can also put it manually. Priority system: TradingView data → Calculated → Manual override
✅ Advanced NAV Modeling
• Basic NAV: Asset holdings + cash.
• Adjusted NAV: Includes software business value, debt, preferred shares. If the company has a lot of this kind of intrinsic value, put it in the "cash" field
• Support for any underlying asset (BTC, ETH, etc.)
TRADING APPLICATIONS:
🎯 Pairs Trading Signals
• Long/Short opportunities when premium reaches statistical extremes
• Mean reversion strategies based on historical ranges
• Risk-adjusted position sizing using percentile ranks
🎯 Arbitrage Detection
• Identifies when market pricing significantly deviates from fair value
• Quantifies the magnitude of mispricing for profit potential
• Historical context for timing entry/exit points
CONFIGURATION OPTIONS:
• Underlying Asset: Any symbol (default: COINBASE:BTCUSD) NEEDS MANUAL INPUT
• Asset Quantity: Precise holdings amount (for example, how much BTC does the company currently hold). NEEDS MANUAL INPUT
• Cash Holdings: Additional liquid assets. NEEDS MANUAL INPUT
• Market Cap Mode: Auto-detect, calculated, or manual
• Advanced Adjustments: Business value, debt, preferred shares
• Display Settings: Lookback period, smoothing, custom colors
IT CAN BE USED BY:
• Quantitative traders focused on statistical arbitrage
• Institutional investors monitoring NAV-based instruments
• Bitcoin ETF and MSTR traders seeking alpha generation
• Risk managers tracking premium/discount exposures
• Academic researchers studying market efficiency (as you can see, markets are not efficient 😉)
Crowding model ║ BullVision🔬 Overview
The Crypto Crowding Model Pro is a sophisticated analytical tool designed to visualize and quantify market conditions across multiple cryptocurrencies. By leveraging Relative Strength Index (RSI) and Z-score calculations, this indicator provides traders with an intuitive and detailed snapshot of current crypto market dynamics, highlighting areas of extreme momentum, crowded trades, and potential reversal points.
⚙️ Key Concepts
📊 RSI and Z-Score Analysis
RSI (Relative Strength Index) evaluates the momentum and strength of each cryptocurrency, identifying overbought or oversold conditions.
Z-Score Normalization measures each asset's current price deviation relative to its historical average, identifying statistically significant extremes.
🎯 Crowding Analytics
An integrated analytics panel provides real-time crowding metrics, quantifying market sentiment into four distinct categories:
🔥 FOMO (Fear of Missing Out): High momentum, potential exhaustion.
❄️ Fear: Low momentum, potential reversal or consolidation.
📈 Recovery: Moderate upward momentum after a downward trend.
💪 Strength: Stable bullish conditions with sustained momentum.
🖥️ Visual Scatter Plot
Assets are plotted on a dynamic scatter plot, positioning each cryptocurrency according to its RSI and Z-score.
Color coding, symbol shapes, and sizes help quickly identify main market segments (BTC, ETH, TOTAL, OTHERS) and individual asset conditions.
🧩 Quadrant Classification
Assets are categorized into four quadrants based on their momentum and deviation:
Overbought Extended: High RSI and positive Z-score.
Recovery Phase: Low RSI but positive Z-score.
Oversold Compressed: Low RSI and negative Z-score.
Strong Consolidation: High RSI but negative Z-score.
🔧 User Customization
🎨 Visual Settings
Bar Scale: Adjust the scatter plot visual scale.
Asset Visibility: Optionally display key market benchmarks (TOTAL, BTC, ETH, OTHERS).
Gradient Background: Enhances visual interpretation of asset clusters.
Crowding Analytics Panel: Toggle the analytics panel on/off.
📊 Indicator Parameters
RSI Length: Defines the calculation period for RSI.
Z-score Lookback: Historical lookback period for normalization.
Crowding Alert Threshold: Sets alert sensitivity for crowded market conditions.
🎯 Zone Settings
Quadrant Labels: Displays descriptive labels for each quadrant.
Danger Zones: Highlights extreme RSI levels indicative of heightened market risk.
📈 Visual Output
Dynamic Scatter Plot: Visualizes asset positioning clearly and intuitively.
Gradient and Grid: Professional gridlines and subtle gradient backgrounds assist visual assessment.
Danger Zone Highlights: Visually indicates RSI extremes to warn of potential market turning points.
Crowding Analytics Panel: Real-time summary of market sentiment and asset distribution.
🔍 Use Cases
This indicator is particularly beneficial for traders and analysts looking to:
Identify crowded trades and potential reversal points.
Quickly assess overall market sentiment and individual asset strength.
Integrate a robust momentum analysis into broader technical or fundamental strategies.
Enhance market timing and improve risk management decisions.
⚠️ Important Notes
This indicator does not provide explicit buy or sell signals.
It is intended solely for informational, analytical, and educational purposes.
Past performance and signals are not indicative of future market results.
Always combine with additional tools and analysis as part of comprehensive decision-making.

RSI-Adaptive T3 + Squeeze Momentum Strategy✅ Strategy Guide: RSI-Adaptive T3 + Squeeze Momentum Strategy
📌 Overview
The RSI-Adaptive T3 + Squeeze Momentum Strategy is a dynamic trend-following strategy based on an RSI-responsive T3 moving average and Squeeze Momentum detection .
It adapts in real-time to market volatility to enhance entry precision and optimize risk.
⚠️ This strategy is provided for educational and research purposes only.
Past performance does not guarantee future results.
🎯 Strategy Objectives
The main objective of this strategy is to catch the early phase of a trend and generate consistent entry signals.
Designed to be intuitive and accessible for traders from beginner to advanced levels.
✨ Key Features
RSI-Responsive T3: T3 length dynamically adjusts according to RSI values for adaptive trend detection
Squeeze Momentum: Combines Bollinger Bands and Keltner Channels to identify trend buildup phases
Visual Triggers: Entry signals are generated from T3 crossovers and momentum strength after squeeze release
📊 Trading Rules
Long Entry:
When T3 crosses upward, momentum is positive, and the squeeze has just been released.
Short Entry:
When T3 crosses downward, momentum is negative, and the squeeze has just been released.
Exit (Reversal):
When the opposite condition to the entry is triggered, the position is reversed.
💰 Risk Management Parameters
Pair & Timeframe: BTC/USD (30-minute chart)
Capital (simulated): $30,00
Order size: `$100` per trade (realistic, low-risk sizing)
Commission: 0.02%
Slippage: 2 pips
Risk per Trade: 5%
Number of Trades (backtest period): 181
📊 Performance Overview
Symbol: BTC/USD
Timeframe: 30-minute chart
Date Range: January 1, 2024 – July 3, 2025
Win Rate: 47.8%
Profit Factor: 2.01
Net Profit: 173.16 (units not specified)
Max Drawdown: 5.77% or 24.91 (0.79%)
⚙️ Indicator Parameters
Indicator Name: RSI-Adaptive T3 + Squeeze Momentum
RSI Length: 14
T3 Min Length: 5
T3 Max Length: 50
T3 Volume Factor: 0.7
BB Length: 27 (Multiplier: 2.0)
KC Length: 20 (Multiplier: 1.5, TrueRange enabled)
🖼 Visual Support
T3 slope direction, squeeze status, and momentum bars are visually plotted on the chart,
providing high clarity for quick trend analysis and execution.
🔧 Strategy Improvements & Uniqueness
Inspired by the RSI Adaptive T3 by ChartPrime and Squeeze Momentum Indicator by LazyBear ,
this strategy fuses both into a hybrid trend-reversal and momentum breakout detection system .
Compared to traditional trend-following methods, it excels at capturing early trend signals with greater sensitivity .
✅ Summary
The RSI-Adaptive T3 + Squeeze Momentum Strategy combines momentum detection with volatility-responsive risk management.
With a strong balance between visual clarity and practicality, it serves as a powerful tool for traders seeking high repeatability.
⚠️ This strategy is based on historical data and does not guarantee future profits.
Always use appropriate risk management when applying it.

Cycle Composite 3.6 WeightedThe Cycle Composite is a multi-factor market cycle model designed to classify long-term market behavior into distinct phases using normalized and weighted data inputs.
It combines ten key on-chain, dominance, volatility, sentiment, and trend-following metrics into a single composite output. The goal is to provide a clearer understanding of where the market may stand in the broader cycle (e.g., accumulation, early bull, late bull, or euphoria).
This version (3.4) introduces flexible weighting, trend strength markers, and additional context-aware signals such as risk-on confirmations and altseason flags.
Phases Identified:
The model categorizes the market into one of five zones:
Euphoria (> 85)
Late Bull (70 – 85)
Mid Bull (50 – 70)
Early Bull (30 – 50)
Fear (< 30)
Each phase is determined by a smoothed EMA of the weighted composite score.
Data Sources and Metrics Used (10 total):
BTC Dominance (CRYPTOCAP:BTC.D)
Stablecoin Dominance (USDT + USDC average) (inverted for risk-on)
ETH Dominance (CRYPTOCAP:ETH.D)
BBWP (normalized Bollinger Band Width % over 1-year window)
WVF (Williams VIX Fix for volatility spike detection)
NUPL (Net Unrealized Profit/Loss, external source)
CMF (Chaikin Money Flow, smoothed volume accumulation)
CEX Open Interest (custom input from DAO / external source)
Whale Inflows (custom input from whale exchange transfer data)
Google Trends Average (BTC, Crypto, Altcoin terms)
All inputs are normalized over a 200-bar window and combined via weighted averaging, where each weight is user-configurable.
Additional Features:
Phase Labels: Labels are printed only when a new phase is entered.
Bull Continuation Marker: Triangle up when composite makes higher highs and NUPL increases.
Weakening Marker: Triangle down when composite rolls over in Late Bull and NUPL falls.
Risk-On Signal: Green circle appears when CMF and Google Trends are both rising.
Altseason Flag: Orange diamond appears when dominance of "others.d" exceeds BTC.D and ETH.D and composite is above 50.
Background Shading: Each phase is shaded with a semi-transparent background color.
Timeframe-Aware Display: All markers and signals are shown only on weekly timeframe for clarity.
Intended Use:
This script is intended for educational and macro-trend analysis purposes.
It can be used to:
Identify macro cycle position (accumulation, bull phases, euphoria, etc.)
Spot long-term trend continuation or weakening signals
Add context to price action with external on-chain and sentiment data
Time rotation events such as altseason risk
Disclaimer:
This script does not constitute financial advice.
It is intended for informational and research purposes only.
Users should conduct their own due diligence and analysis before making investment decisions.

Data Monitoring TableThis is a visual data dashboard specifically designed for users engaged in quantitative trading and technical analysis. It is equipped with two data tables that can dynamically display key market technical indicators and cryptocurrency price fluctuation data, supporting customizable column configurations and trading mode filtering.
✅ Core Features:
Intuitive display of critical technical indicators, including the Relative Strength Index (RSI), K-line entity gain, upper/lower shadow ratio, trading volume level, and change rate.
Multi-timeframe tracking of price fluctuations for BTC/ETH/SOL/XRP/DOGE (1-day, 6-hour, 3-hour).
Selectable trading modes: "long-only", "short-only", or "both".
Customizable number of columns to adapt to analysis needs across different timeframes.
All data is visualized in tables with color-coded prompts for market conditions (overbought, oversold, high volatility, low volatility, etc.).
📈 Target Audience:
Investors seeking systematic access to technical data.
Quantitative strategy developers aiming to capture market structural changes.
Intermediate and beginner traders looking to enhance market intuition and decision-making.
New Feature:
We have added a trading volume monitoring grade setting feature. Users can set the monitoring grade by themselves. When the market trading volume reaches this grade, the system will trigger an alarm. The default setting is level 5. This setting is designed to filter out trades with small fluctuations, helping users to capture key trading signals more accurately and improve the efficiency of trading decisions.
中文介绍
这是一款专为量化交易和技术分析用户设计的可视化数据仪表盘。它配备两个数据表格,可动态展示关键市场技术指标与加密货币价格波动数据,支持自定义列配置和交易模式筛选。
✅ 核心功能:
直观展示相对强弱指标(RSI)、K 线实体涨幅、上下影线比例、成交量水平及变化率等关键技术指标。
多时间框架追踪 BTC/ETH/SOL/XRP/DOGE 价格波动(1 日、6 小时、3 小时)。
可选交易模式:“仅做多”“仅做空” 或 “多空双向”。
可自定义列数,适配不同时间框架的分析需求。
所有数据以表格可视化呈现,通过颜色标注提示市场状况(超买、超卖、高波动、低波动等)。
📈 目标用户:
寻求系统获取技术数据的投资者。
旨在捕捉市场结构变化的量化策略开发者。
希望提升市场洞察力和决策能力的初、中级交易者。
新增功能:
我们新增了成交量监控等级设置功能。用户可自行设定监控等级,当市场成交量达到该等级时,系统将触发警报。默认设置为 5 级,此设置旨在过滤掉小幅波动的交易,帮助用户更精准地捕捉关键交易信号,提升交易决策效率。

EMA 200 Monitor - Bybit CoinsEMA 200 Monitor - Bybit Coins
📊 OVERVIEW
The EMA 200 Monitor - Bybit Coins is an advanced indicator that automatically monitors 30 of the top cryptocurrencies traded on Bybit, alerting you when they are close to the 200-period Exponential Moving Average on the 4-hour timeframe.
This indicator was developed especially for traders who use the EMA 200 as a key support/resistance level in their swing trading and position trading strategies.
🎯 WHAT IT'S FOR
Multi-Asset Monitoring: Simultaneous monitoring of 30 cryptocurrencies without having to switch between charts
Opportunity Identification: Detects when coins are approaching the 200 EMA, a crucial technical level
Automated Alerts: Real-time notifications when a coin reaches the configured proximity
Time Efficiency: Eliminates the need to manually check chart collections
⚙️ HOW IT WORKS
Main Functionality
The indicator uses the request.security() function to fetch price data and calculate the 200 EMA of each monitored asset. With each new bar, the script:
Calculates the distance between the current price and the 200 EMA for each coin
Identifies proximity based on the configured percentage (default: 2%)
Displays results in a table organized on the chart
Generates automatic alerts when proximity is detected
Monitored Coins
Major : BTC, ETH, BNB, ADA, XRP, SOL, DOT, DOGE, AVAX
DeFi : UNI, LINK, ATOM, ICP, NEAR, OP, ARB, INJ
Memecoins : SHIB, PEPE, WIF, BONK, FLOKI
Emerging : SUI, TON, APT, POL (ex-MATIC)
📋 AVAILABLE SETTINGS
Adjustable Parameters
EMA Length (Default: 200): Exponential Moving Average Period
Proximity Percentage (Default: 2%): Distance in percentage to consider "close"
Show Table (Default: Active): Show/hide results table
Table Position: Position of the table on the chart (9 options available)
Color System
🔴 Red: Distance ≤ 1% (very close)
🟠 Orange: Distance ≤ 1.5% (close)
🟡 Yellow: Distance ≤ 2% (approaching)
🚀 HOW TO USE
Initial Configuration
Add the indicator to the 4-hour timeframe chart
Set the parameters according to your strategy
Position the table where there is no graphic preference
Setting Alerts
Click "Create Alert" in TradingView
Select the "EMA 200 Monitor" indicator
Set the notification frequency and method
Activate the alert to receive automatic notifications
Results Interpretation
The table shows:
Coin: Asset name (e.g. BTC, ETH)
Price: Current currency quote
EMA 200: Current value of the moving average
Distance: Percentage of proximity to the core code
💡 STRATEGIES TO USE
Reversal Trading
Entry: When price touches or approaches the EMA 200
Stop: Below/above the EMA with a safety margin
Target: Previous resistance/support levels
Breakout Trading
Monitoring: Watch for currencies consolidating near the EMA 200
Entry: When the media is finally broken
Confirmation: Volume and close above/below the EMA
Swing Trading
Identification: Use the monitor to detect setups in formation
Timing: Wait for the EMA 200 to approach for detailed analysis
Management: Use the EMA as a reference for stops dynamics
⚠️ IMPORTANT CONSIDERATIONS
Technical Limitations
Request Bybit data: Access to exchange symbols required
Specific timeframe: Optimized for 4-hour analysis
Minimum delay: Data updated with each new bar
Usage Recommendations
Combine with technical analysis: Use together with other indicators
Confirm the configuration: Check the graphic patterns before trading
Manage risk: Always use stop loss and adequate position sizing
Backtesting: Test your strategy before applying with real capital
Disclaimer
This indicator is a technical analysis tool and does not constitute investment advice. Always do your own analysis and manage detailed information about the risks of your operations.
🔧 TECHNICAL INFORMATION
Pine Script version: v6
Type: Indicator (overlay=true)
Compatibility: All TradingView plans
Resources used: request.security(), arrays, tables
Performance: Optimized for multiple simultaneous queries
📈 COMPETITIVE ADVANTAGES
✅ Simultaneous monitoring of 30 major assets ✅ Clear visual interface with intuitive core system ✅ Customizable alerts for different details ✅ Optimized code for maximum performance ✅ Flexible configuration adaptable to different strategies ✅ Real-time update without the need for manual refresh
Developed for traders who value efficiency and accuracy in identifying market opportunities based on the EMA 20

SD Median NUPL-Z🧠 Overview
SD Median NUPL-Z is a trend-following indicator that leverages a normalized version of Bitcoin’s Net Unrealized Profit/Loss (NUPL) metric, filtered through a median-based volatility band. Unlike traditional NUPL which is often used to spot extremes, this indicator is designed to identify sustained directional trends — entering only when both on-chain momentum and price structure align.
🧩 Key Features
Z-Scored NUPL Trend Engine: Normalizes NUPL using rolling mean and standard deviation to create a smoothed trend signal.
Price Structure Filter: Implements a median-based price band to avoid false entries during short-term volatility.
Custom Thresholds: User-defined thresholds determine when the trend signal is strong enough to justify a long or short directional bias.
Directional Candle Coloring: Reinforces current trend regime visually with aqua (bullish) and red (bearish) plots and candles.
Optimized for BTC: Uses Bitcoin’s Market Cap and Realized Cap to construct the NUPL input.
🔍 How It Works
On-Chain Core: NUPL is calculated as the percentage of unrealized profit in the market: (Market Cap - Realized Cap) / Market Cap * 100.
Z-Score Transformation: The raw NUPL value is normalized using a rolling average and standard deviation over a set window (default 134 days), producing the NUPL-Z series.
Median-Based Price Filter: A rolling 50th percentile (median) of price is used alongside its own standard deviation to create upper and lower bounds.
These bounds define a "volatility corridor" around price; the trend signal is only acted upon if price confirms by staying outside these bands.
Signal Logic:
A Long signal is triggered when NUPL-Z rises above the long threshold and price is not below the lower band.
A Short signal is triggered when NUPL-Z falls below the short threshold.
State Variable (CD): Tracks the current market regime, used to control plotting and color changes.
🔁 Use Cases & Applications
Momentum-Based Trend Following: Helps traders align with directional moves backed by both on-chain sentiment and supportive price structure.
Filtered Entry Timing: Reduces premature or noise-based entries by requiring price confirmation before committing to NUPL-based signals.
Best Suited for BTC: This tool is designed specifically around Bitcoin’s on-chain metrics and is not intended for altcoins or low-volume assets.
✅ Conclusion
SD Median NUPL-Z repurposes a traditionally cyclical valuation tool into a modern trend-following signal by combining statistical normalization with dynamic price structure filtering. It offers a more robust way to participate in high-conviction directional trends, reducing the likelihood of entering during short-lived counter moves.
⚠️ Disclaimer
The content provided by this indicator is for educational and informational purposes only. Nothing herein constitutes financial or investment advice. Trading and investing involve risk, including the potential loss of capital. Always backtest and apply risk management suited to your strategy.

MVRV-Z For Loop🧠 Overview
MVRV-Z For Loop is a trend-following indicator that applies a custom directional for-loop logic to the MVRV Z-score. By evaluating the number of consecutive Z-score improvements or deteriorations over time, it identifies sustained directional pressure in Bitcoin’s on-chain trend — helping traders align with prevailing market strength rather than reacting to single-point extremes.
🧩 Key Features
Loop-Based Trend Filter: Applies a running comparison loop to assess whether MVRV-Z has been consistently strengthening or weakening.
Directional Scoring System: Each upward movement contributes positively, and each downward movement negatively, producing a cumulative trend score.
Z-Scored MVRV: Leverages on-chain valuation via the Market Cap to Realized Cap ratio, normalized using a long-term rolling average and standard deviation.
Custom Thresholds: User-defined thresholds for long and short signals based on trend score magnitude.
Dynamic Candle Coloring: Visually reinforces trend state with aqua for bullish and red for bearish environments.
🔍 How It Works
Z-score Transformation: The MVRV ratio is normalized over a long lookback (default 1050 days), creating a standardized valuation signal.
For-Loop Engine: A directional loop compares the current MVRV-Z value to previous values within a defined range (start to end).
If today’s value is higher than ma , it adds +1 to the score; otherwise, it subtracts -1.
This loop effectively measures momentum consistency rather than magnitude alone.
Signal Logic:
A Long signal is triggered when the cumulative trend score exceeds the long_threshold.
A Short signal is triggered when the score drops below the short_threshold.
State Variable (CD): Tracks the market regime (1 = long, -1 = short), updating only when a valid condition is met.
🔁 Use Cases & Applications
Trend Confirmation Tool: Helps traders assess whether a directional move has been sustained over time before committing.
Momentum Alignment: Filters out short-term noise by scoring consistency in MVRV-Z movement rather than relying on single-bar reversals.
Best Suited for BTC: This indicator is specifically built using Bitcoin’s Market Cap and Realized Cap metrics, making it ideal for BTC trend tracking.
✅ Conclusion
MVRV-Z For Loop transforms the traditional MVRV Z-score into a trend-following signal using a cumulative scoring approach. It excels in highlighting sustained directional strength and avoids premature entries during valuation whipsaws. This makes it a strong tool for traders looking to stay on the right side of the trend without overreacting to short-term fluctuations.
⚠️ Disclaimer
The content provided by this indicator is for educational and informational purposes only. Nothing herein constitutes financial or investment advice. Trading and investing involve risk, including the potential loss of capital. Always backtest and apply risk management suited to your strategy.

SD Median MVRV-Z🧠 Overview
SD Median MVRV-Z is a trend-following indicator that uses on-chain valuation signals as a supportive filter. It blends the momentum of the MVRV Z-score with a dynamic median-based price structure to provide cleaner, more reliable directional signals. This tool is designed to identify when price and trend align with favorable broader context — not to pinpoint overbought or oversold extremes.
🧩 Key Features
Trend-Following Core: Signals are built around directional strength, not reversion.
MVRV Z-Score Momentum: Utilizes the statistical momentum of Market Cap vs Realized Cap as a macro trend driver.
Rolling Median Filter: Applies a price-based condition to ensure trend signals are not triggered during short-term counter-moves or noise.
Threshold Customization: Input controls allow traders to define the strength required to trigger long or short signals.
Dynamic Visualization: Candle coloring and filled zones provide instant feedback on current market regime.
🔍 How It Works
Trend Signal: The MVRV ratio is normalized via Z-scoring to produce a momentum-like signal based on how far current valuation deviates from its rolling average.
Price Filter: A rolling median and standard deviation of price define an upper and lower band. These serve to filter out MVRV-Z signals that occur when price is moving against the perceived direction.
Signal Logic:
Long signal = MVRV-Z above threshold and price is not in the lower volatility band.
Short signal = MVRV-Z below threshold, regardless of price band (more aggressive condition).
Directional Engine (CD): Encodes the market regime state (1 for long, -1 for short, 0 for neutral), and drives all visual outputs.
🔁 Use Cases & Applications
Momentum Confirmation: Identify when on-chain momentum and price structure both confirm a trend direction.
Reduced Whipsawing: Filter out weak or conflicting trend signals that would otherwise lead to false entries.
Best Suited for BTC: This indicator is specifically tailored for Bitcoin, using BTC’s Market Cap and Realized Cap data from on-chain sources.
✅ Conclusion
SD Median MVRV-Z is a trend-centric tool that ensures directional conviction by requiring agreement between price structure and underlying market momentum. It is not meant to detect tops or bottoms, but instead to help traders participate in sustainable moves with greater confidence.
⚠️ Disclaimer
The content provided by this indicator is for educational and informational purposes only. Nothing herein constitutes financial or investment advice. Trading and investing involve risk, including the potential loss of capital. Always backtest and apply risk management suited to your strategy.

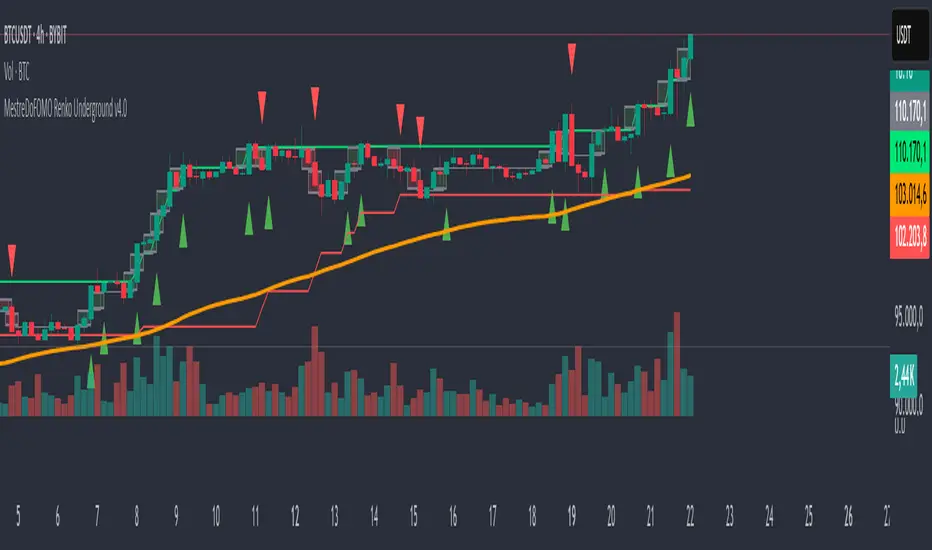
MestreDoFOMO Renko Underground v4.0Description:
The "MestreDoFOMO Renko Underground v4.0" is a custom indicator for TradingView that creates a dynamic Renko chart to help identify trends and reversal points in the market. Unlike traditional candlestick charts, Renko focuses solely on significant price movements, ignoring time and market noise. This script includes advanced features like support and resistance channels, moving averages, and alerts to assist with your trading decisions.
How It Works:
Dynamic Renko Bricks:
The brick size (price units to form each "box" on the chart) is calculated automatically using the ATR (Average True Range) with an adjustable multiplier. This means the size adapts to the asset's volatility (e.g., BTC/USDT). When the price moves up or down by the brick size, a new brick is created (green for up, red for down).
Reversal Signals:
Green triangles (🔼) appear below bars when the trend shifts to bullish, and red triangles (🔽) appear above when it shifts to bearish. These signals only appear on direction changes, reducing false signals.
Renko Channel:
The script draws two lines (green for resistance and red for support) based on the highs and lows of the last 10 bricks (or the value you set). This helps identify key price zones.
Moving Average on Bricks:
An orange line shows the moving average (EMA or SMA, your choice) of the last 20 bricks, helping confirm the overall trend.
Alerts:
You can set up alerts in TradingView to be notified when the trend shifts to bullish or bearish, perfect for active trading.
Visualization:
A gray dashed line shows the level of the last brick, providing a clear reference for the next expected move.
How to Use:
Add the indicator to your chart (e.g., BTC/USDT 1D).
Adjust parameters like the ATR multiplier, channel length, and moving average type in the settings menu.
Watch the bricks and signals to identify trends, and use the channels and moving average to plan entries and exits.
Enable alerts to receive real-time notifications.
Tip:
Test on different timeframes (1H, 4H, 1D) and adjust the ATR multiplier to match the volatility of the asset you're trading. Combine with other indicators (like RSI) for better results!
Real-Time Open Levels with Labels + Info TableReal-Time Multi-Timeframe Open Levels with Labels & Info Panel
Overview
This indicator displays real-time opening price levels across multiple timeframes (Monthly, Weekly, Daily, 4H) directly on your chart. It features:
• Dynamic horizontal lines extending through each timeframe period
• Customizable labels with text/colors
• Special 4H line treatment for the last hour (5-min charts only)
• Integrated information panel showing symbol, timeframe, and price changes
! (www.tradingview.com)
*Example showing multiple timeframe levels with labels and info panel*
---
Features & Configuration
1. Monthly Settings
! (www.tradingview.com)
Show Monthly: Toggle visibility of monthly opening price
Color: Semi-transparent blue (#2196F3 at 70% opacity)
Width: 2px line thickness
Style: Solid/Dotted/Dashed
Label: Display "M-Open" text with white text on blue background
2. Weekly Settings
! (www.tradingview.com)
Show Weekly: Toggle weekly opening price visibility
Color: Semi-transparent red (#FF5252 at 70% opacity)
Width: 1px thickness
Style: Dotted by default
Label: "W-Open" text in white on red background
3. Daily Settings
! (www.tradingview.com)
Show Daily: Toggle daily opening price
Color: Amber (#FFA000 at 70% opacity)
Width: 2px thickness
Style: Solid
Label: "D-Open" in white on orange background
---
4. 4-Hour Settings (5-Minute Charts Only)
Special Features for 5-Min Timeframe:
1. Standard 4H Line
• First 3 hours: Green (#4CAF50) dashed line
• Last hour: Bright red solid line (configurable)
• Vertical divider between 3rd/4th hours
2. Configuration Options
• Main 4H Line:
◦ Color/Width/Style for initial 3 hours
◦ Toggle label ("H4-Open") visibility and styling
• Final Hour Enhancement:
*Last Hour Line*
◦ Unique red color and line style
◦ Separate width (1px) and style (Solid)
*Divider Line*
◦ Vertical red dotted line marking last hour
◦ Adjustable position/width/transparency
! (www.tradingview.com)
*4H levels showing 3-hour segment and final hour treatment*
---
5. Info Panel Settings
Positioning:
• Anchor to any chart corner (Top/Bottom + Left/Right combinations)
• Three text sizes: Title (Huge), Change % (Large), Signature (Small)
Display Elements:
• Symbol: Show exchange prefix (e.g., "NASDAQ:")
• Timeframe: Current chart period (e.g., "5m")
• Change %: 24-hour price movement ▲/▼ percentage
• Custom Signature: Add text/username in footer
Styling:
• Semi-transparent white text (#ffffff77)
• Currency pair formatting (e.g., BTC/USD vs BTC-USD)
! (www.tradingview.com)
*Sample info panel with all elements enabled*
---
Usage Tips
1. Multi-Timeframe Context: Use levels to identify key daily/weekly support/resistance
2. 4H Trading: On 5-min charts, watch for price reactions near final hour transition
3. Customization:
• Match line colors to your chart theme
• Use different labels for clarity (e.g., "Weekly Open")
• Disable unused elements to reduce clutter
4. Divider Lines: Helps identify institutional trading periods (hour closes)
---
*Created using Pine Script v6. For optimal performance, use on charts <1H timeframe. ()*
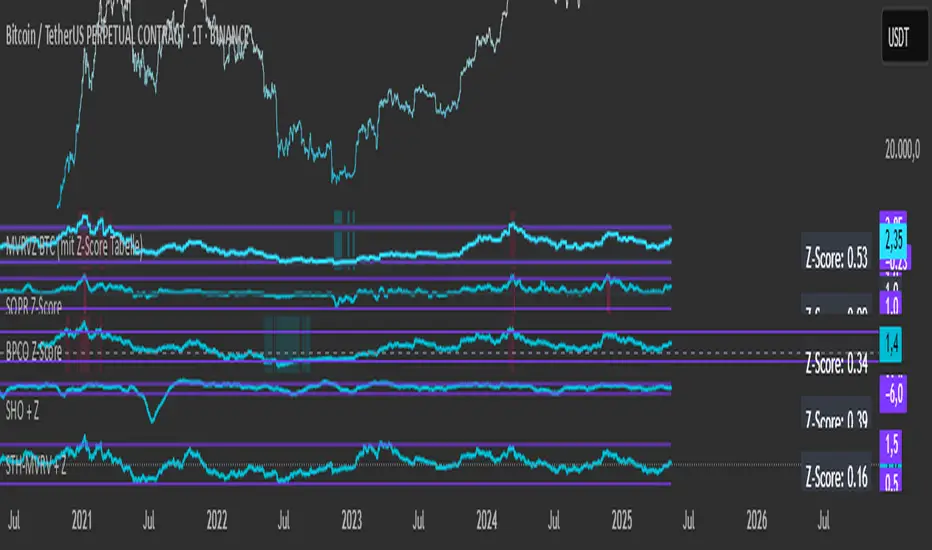
Simplified STH-MVRV + Z-ScoreSimplified Short Term Holder MVRV (STH-MVRV) + Z-Score Indicator
Description:
This indicator visualizes the Short Term Holder Market Value to Realized Value ratio (STH-MVRV) and its normalized Z-Score, providing insight into Bitcoin’s market cycle phases and potential overbought or oversold conditions.
How it works:
The STH-MVRV ratio compares the market value of coins held by short-term holders to their realized value, helping to identify periods of profit-taking or accumulation by these holders.
The indicator calculates three versions:
STH-MVRV (MVRV): Ratio of current MVRV to its 155-day SMA.
STH-MVRV (Price): Ratio of BTC price to its 155-day SMA.
STH-MVRV (AVG): Average of the above two ratios.
You can select which ratio to display via the input dropdown.
Threshold Lines:
Adjustable upper and lower threshold lines mark significant levels where market sentiment might shift.
The indicator also plots a baseline at 1.0 as a reference.
Z-Score Explanation:
The Z-Score is a normalized value scaled between -3 and +3, calculated relative to the chosen threshold levels.
When the ratio hits the upper threshold, the Z-Score approaches +2, indicating potential overbought conditions.
Conversely, reaching the lower threshold corresponds to a Z-Score near -2, signaling potential oversold conditions.
This Z-Score is shown in a clear table in the top right corner of the chart for easy monitoring.
Data Sources:
MVRV data is fetched from the BTC_MVRV dataset.
Price data is sourced from the BTC/USD index.
Usage:
Use this indicator to assess short-term holder market behavior and to help identify buying or selling opportunities based on extremes indicated by the Z-Score.
Combining this tool with other analysis can improve timing decisions in Bitcoin trading.
Dynamic Portfolio TrackerDynamic Portfolio Tracker
The Dynamic Portfolio Tracker is a visual tool for actively managing and monitoring a multi-asset portfolio directly on TradingView. It allows users to input up to 15 custom assets (with a default setup for 5), define how much of each asset they hold, and assign a target allocation percentage to each. The script then calculates live market prices, total portfolio value, current vs. target weightings, and provides clear, color-coded instructions on whether to buy, sell, or hold each asset. It displays all this data in an on-chart table, showing both the dollar amount and the quantity to adjust for each asset, helping users keep their portfolio aligned with their strategy in real time.
How to Use the Inputs (What Each Field Means)
1. Portfolio Assets (Tickers)
Fields: Asset 1 Ticker, Asset 2 Ticker, …, Asset 15 Ticker
What it does: Lets you select which assets (crypto, stocks, etc.) you want to track. These are live symbols pulled from TradingView.
2. Asset Quantities
Fields: Asset 1 Amount, Asset 2 Amount, …, Asset 15 Amount
What it means: How much of each asset you currently hold. For example:
• 0.03 BTC
• 2.1 ETH
Why it’s needed: The script multiplies this by the live price to calculate the current dollar value of each asset in your portfolio.
3. Target %
Fields: Asset 1 Implied %, Asset 2 Implied %, …, Asset 15 Implied %
What it means: Your desired allocation for each asset. For example:
• 40% BTC
• 20% ETH
• 10% SOL, etc.
Important: These must total 100% or less across all assets. The script checks this and shows an error if the total exceeds 100%.
The Dynamic Portfolio Tracker displays two powerful on-chart tables:
1. Main Table — Per Asset Breakdown
This table shows detailed, real-time information for each asset in your portfolio. Each row represents a different asset, and each column has a specific meaning:
Column What It Means
Asset = The symbol of the asset (e.g., BTCUSD, ETHUSD), auto-stripped from the exchange name.
Price = The current market price of the asset, pulled live from TradingView.
Quantity = How much of that asset you currently hold, entered manually in the inputs.
Target % = The percentage of your total portfolio you want this asset to represent.
Actual % = What percentage of your portfolio it currently makes up (based on price × quantity).
Target Value = How much (in $) this asset should be worth in your portfolio.
Actual Value = How much (in $) this asset is currently worth.
Instruction = Whether to Buy, Sell, or Hold to match your target allocation.
Value Change = The dollar amount you’d need to buy/sell to rebalance this asset.
Units to Trade = The number of asset units to buy/sell to reach the target value.
2. Portfolio Summary Table — Portfolio Totals
This smaller table appears in the top-right corner and summarizes your entire portfolio at a glance:
Target % = Total of all your assigned target allocations (should equal 100%).
Actual % = Actual portfolio composition (always 100% unless your capital is zero).
Target Value = Total value your portfolio should be based on your target percentages.
Actual Value = Current live total value of your portfolio.
If there’s a discrepancy between Target Value and Actual Value, the difference is shown in each row of the main table, so you can adjust individual assets accordingly.
Privacy First: Hide Sensitive Financial Data
A unique feature of this tool is the ability to hide sensitive financial data, such as:
• Target Value
• Actual Value
• Total Portfolio Value
You can turn these off using toggle settings, and they’ll be replaced with a crossed-out eye icon (👁️🗨️) — just like on modern crypto exchanges. This feature makes the script safe for streaming, screenshots, or sharing publicly while protecting your privacy.
But more importantly:
Feelings are the enemy of good investing.
Seeing the value of your portfolio fluctuate can trigger fear or greed. By hiding your dollar values, you’re not just securing your data — you’re reducing the temptation to react emotionally.
It’s just numbers. Systems over Feelings.
Table Automatically Adapts to Your Asset Count
The Dynamic Portfolio Tracker is designed to scale with your portfolio. Simply choose how many assets you want to track (up to 15), and the table will automatically resize to fit exactly that number — no wasted space or empty rows.
• Select 1 to 15 assets using the “Number of Assets” input
• The table expands or contracts dynamically to show only those rows
• All calculations, summaries, and layout elements adjust accordingly in real time
This keeps the interface clean, focused, and perfectly tailored to your setup — whether you’re tracking 3 coins or managing a full portfolio of 12+ tokens.
Customize Your Table to Match Your Style
The Dynamic Portfolio Tracker offers a full suite of visual customization options, allowing you to tailor the table to your charting style or stream layout. You can:
• Choose text colors for labels, values, and headers
• Set background colors for the full table and header row — or turn them off completely for a clean, transparent look
• Control border and frame settings, including color, thickness, or disabling them entirely
• Pick custom colors for Buy and Sell signals in the rebalance column
• Adjust table font size from tiny to large to match your resolution or preferences
Special Thanks
This tool wouldn’t exist without the knowledge and inspiration gained through The Real World. A sincere thank you to the Investing Master, the Guides, and Professor Adam — your frameworks and lessons brought clarity, discipline, and structure to this build.
And of course, glory to L4 — where real men are made.
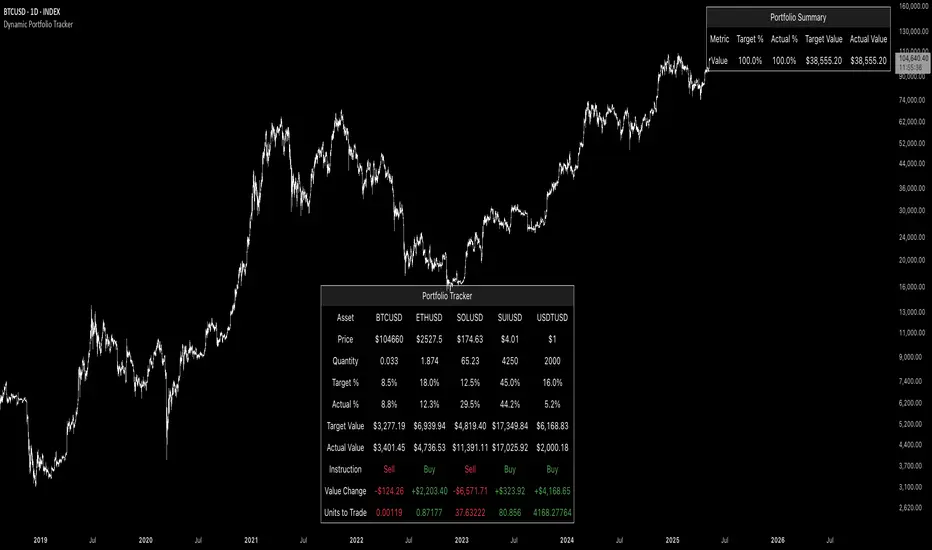
M2 Global Liquidity Index [Custom Offsets]M2 Global Liquidity Index
Plots the global M2 money supply alongside price, with two user-configurable forward shifts to help you anticipate macro-driven moves in BTC (or any asset).
Key Features
Current M2 Index (no offset)
Offset A — shift M2 forward by N days (default 78)
Offset B — shift M2 forward by M days (default 109)
Extended Currencies toggle adds 9 additional central banks (CHF, CAD, INR, RUB, BRL, KRW, MXN, ZAR)
All lines share the left-hand axis and scale to trillions
Inputs
Offset A (days): integer ≥ 0 (default 78)
Offset B (days): integer ≥ 0 (default 109)
Include extended currencies?: on/off
How to Use
Add the indicator to any chart (overlay mode).
In Settings → Inputs, enter your desired lead times for Offset A and Offset B.
Toggle extended currencies if you need a broader “global liquidity” view.
Watch how price action (e.g. BTC) tracks the shifted M2 lines to spot potential turning points.
Why It Matters
Changes in money supply often lead risk assets by several weeks to months. This tool makes it easy to visualize and test those correlations directly on your favorite timeframe.
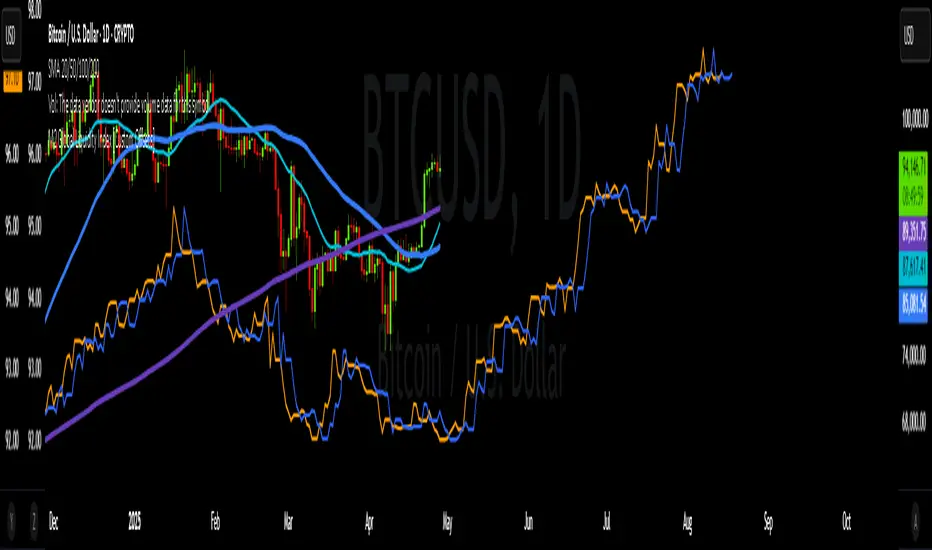
Altseason Index | AlchimistOfCrypto
🌈 Altseason Index | AlchimistOfCrypto – Revealing Bitcoin-Altcoin Dominance Cycles 🌈
"The Altseason Index, engineered through advanced mathematical methodology, visualizes the probabilistic distribution of capital flows between Bitcoin and altcoins within a multi-cycle paradigm. This indicator employs statistical normalization principles where ratio coefficients create mathematical boundaries that define dominance transitions between cryptographic asset classes. Our implementation features algorithmically enhanced rainbow visualization derived from extensive market cycle analysis, creating a dynamic representation of value flow with adaptive color gradients that highlight critical phase transitions in the cyclical evolution of the crypto market."
📊 Professional Trading Application
The Altseason Index transcends traditional sentiment models with a sophisticated multi-band illumination system that reveals the underlying structure of crypto sector rotation. Scientifically calibrated across different ratios (TOTAL2/BTC, OTHERS/BTC) and featuring seamless daily visualization, it enables investors to perceive capital transitions between Bitcoin and altcoins with unprecedented clarity.
- Visual Theming 🎨
Scientifically designed rainbow gradient optimized for market cycle recognition:
- Green-Blue: Altcoin accumulation zones with highest capital flow potential
- Neutral White: Market equilibrium zone representing balanced capital distribution
- Yellow-Red: Bitcoin dominance regions indicating defensive capital positioning
- Gradient Transitions: Mathematical inflection points for strategic reallocation
- Market Phase Detection 🔍
- Precise zone boundaries demarcating critical sentiment shifts in the crypto ecosystem
- Daily timeframe calculation ensuring consistent signal reliability
- Multiple ratio analysis revealing the probabilistic nature of market capital flows
🚀 How to Use
1. Identify Market Phase ⏰: Locate the current index relative to colored zones
2. Understand Capital Flow 🎚️: Monitor transitions between Bitcoin and altcoin dominance
3. Assess Mathematical Value 🌈: Determine optimal allocation based on zone location
4. Adjust Investment Strategy 🔎: Modulate position sizing based on dominance assessment
5. Prepare for Rotation ✅: Anticipate capital shifts when approaching extreme zones
6. Invest with Precision 🛡️: Accumulate altcoins in lower zones, reduce in upper zones
7. Manage Risk Dynamically 🔐: Scale portfolio allocations based on index positioning