ETH World Volume (Multi-Exchange) [v2019-07-20]This is a fork of but applied to Ethereum instead of BTC
Pesquisar nos scripts por "btc期权交割时间"

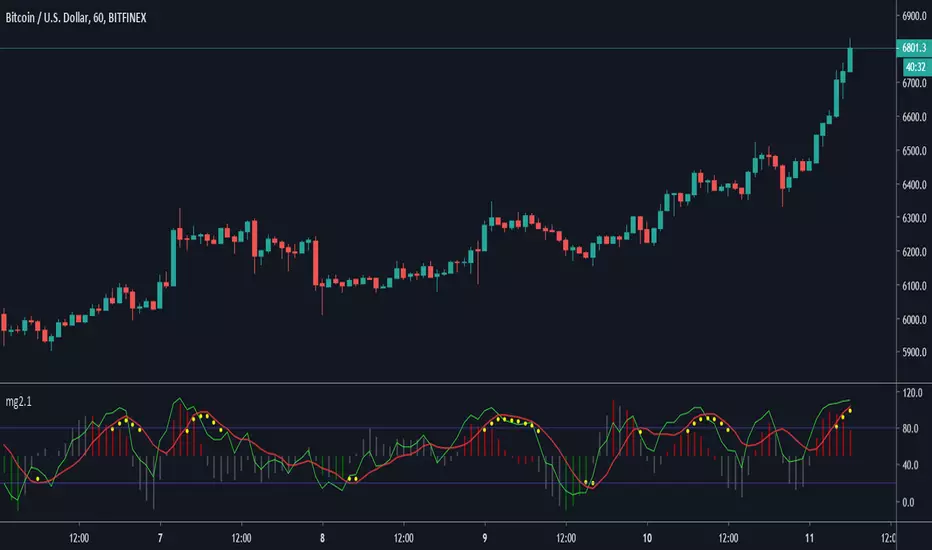
Minimal Godmode 2.1// Acknowledgments:
// Original Godmode Authors:
// @Legion, @LazyBear, @Ni6HTH4wK, @xSilas
// Drop a line if you use or modify this code.
// Godmode 3.1.4: @SNOW_CITY
// Godmode 3.2: @sco77m4r7in and @oh92
// Godmode3.2+LSMA: @scilentor
// Godmode 4.0.0-4.0.1: @chrysopoetics
// Jurik Moving Average: @everget
// Constance Brown Composite Index RSI: @LazyBear
// Wavetrend Oscillator: @fskrypt
// TTM Squeeze: @Greeny
// True TSI/RSI: @cI8DH and @chrysopoetics
// Laguerre RSI (Self-Adjusting Alpha with Fractals Energy): @everget
// RSI Shaded: @mortdiggiddy
// Minimal Godmode v2.0:
// 6 BTC pairs/exchanges (instead of 11) to reduce loading time from the pinescript security() function
// Volume Composite for engine calculation
// TTM Squeeze on Wavetrend Signal
// Constance Brown Composite Index RSI (CBCI)
// TrueTSI (Godmode 4.0.0 implementation)
// Laguerre RSI (LRSI)
// Minimal Godmode v2.1:
// Removed TTM Squeeze and Volume Composite
// EMA for Wavetrend Signal
// Multi-exchange for BTC no longer the default
// mg engine toggle for CBCI, Laguerre RSI, and TTSI
// Wavetrend Histogram component toggle
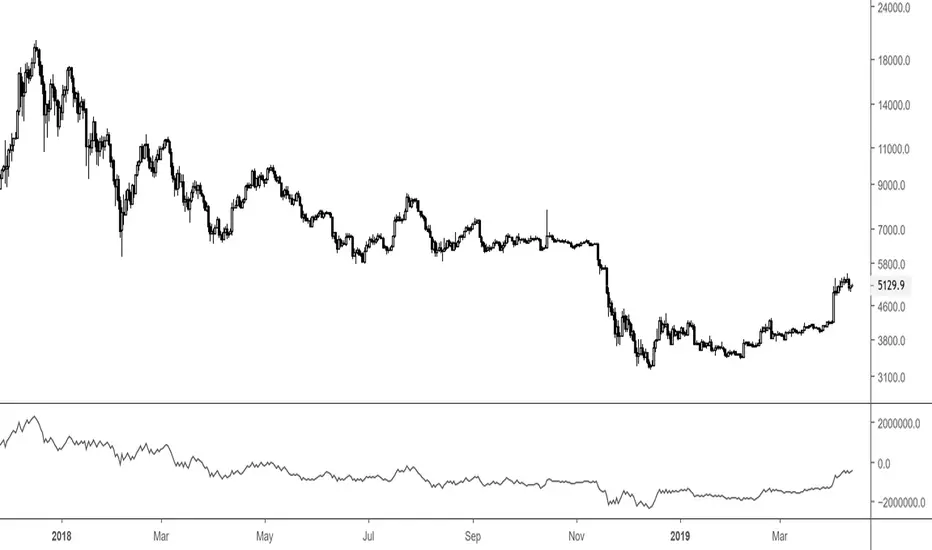
Big 9 Real volume exchanges - On Balance VolumeHere is an On Balance Volume indicator using only volume data from the 9 biggest exchanges trading BTC/USD or BTC/USDT. These 9 exchanges were chosen based on the report by Bitwise Invest stating that 95% of the volume on CoinMarketCap is fake. On these 9 exchanges, however, volume data appears to be reliable. Please note BitFlyer was not included because it does not trade in USD. Please note also that data on all 9 exchanges is only available from August 2017. A separate volume indicator indicator is available at
Anyone is welcome to share and modify.
- stargazer
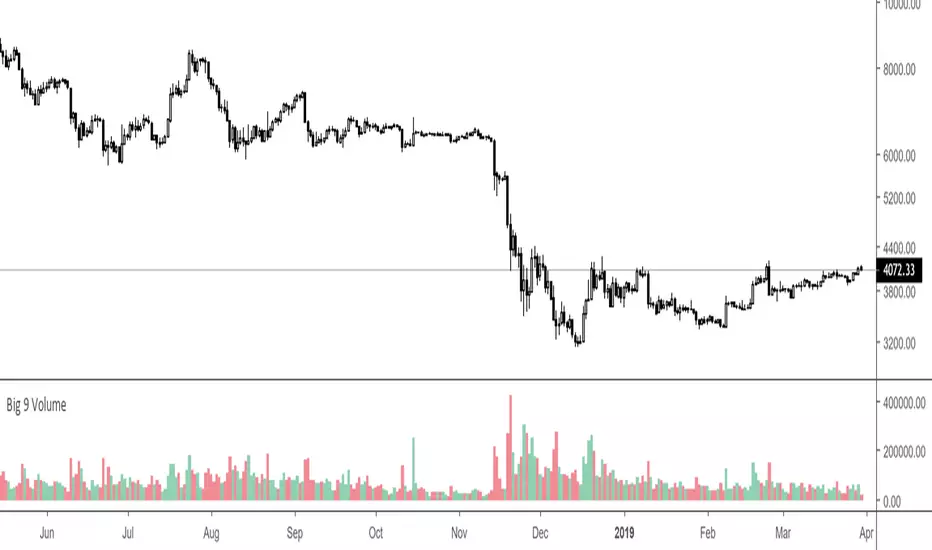
Big 9 Volume - Volume indicator from exchanges with real volumeHere is a very basic indicator combining the volumes of the 9 biggest exchanges trading BTC/USD or BTC/USDT. These 9 exchanges were chosen based on the report by Bitwise Invest stating that 95% of the volume on CoinMarketCap is fake. On these 9 exchanges, however, volume data appears to be reliable. Please note BitFlyer was not included because it does not trade in USD. Please note also that data on all 9 exchanges is only available from June 2018.
Anyone is welcome to modify this and make it more elegant, this was just a quick implementation.
Major Mayer MultipleAdjusted version of the BTC Mayer Multiple developed by Trace Mayer www.theinvestorspodcast.com
This version includes two novelties. The first one replaces BTC with Total Market Cap from 2016/2017 (depending on your moving averages) to present and the second is that we consider two Moving Averages to produce more detailed lows.

Volume RSI altsSo this allow you to put major alts against each other and compare the Volume RSI to each other and to the alts that you are currently looking In this example we see TRX breaking from the major pack of the other alts in 1D chart making the breakthrough up
Each alt has it own color
if you want to add more alts just copi paste and add the code for your alt to make this system better for you
here you see how XRP break from the pack show in arrow down
here on 4 h chart we see LTC is breaking before BTC (its a btc chart and LTC in orange)

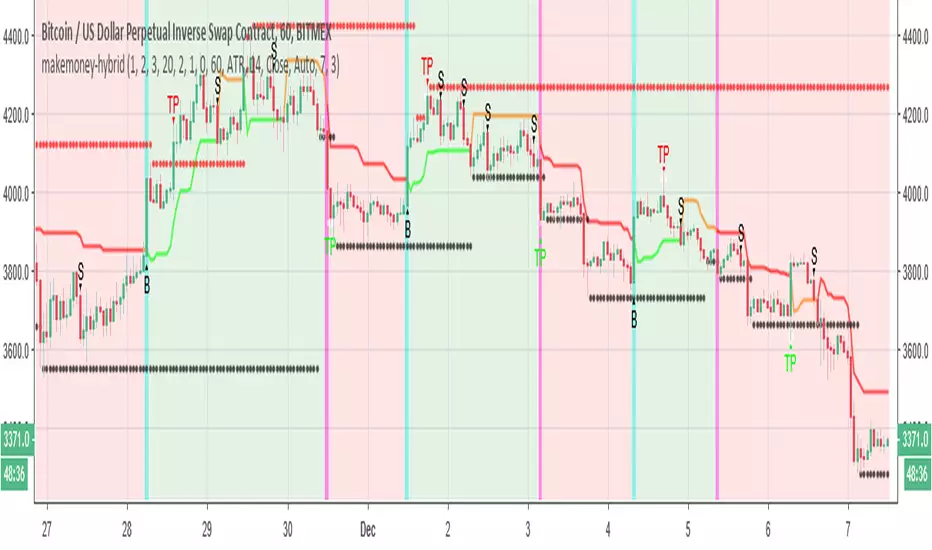
makemoney-hybridSo this model is little different from moneymaker model in the following :
The buy system based on super trend , the sell system =S is based on the volume model of money maker
in the example we set 7% take profit for both long or short . you can set it even higher since btc very volatile now
in cases where it did not reach the target its made min of 3% each direction
So the buy in this system will be in true uptrend . since now the btc is falling more then going up we can make more money on shorts and wait for the longs when they come :)
the bullish and bear zone based on super system
you need to set correctly your take profit in order to make it to work . the more volatile will be the coin the better will be the results (this is the theory )
HEAVI - HawkEye Aggregated Volume IndicatorThis is combined Aggregated BTC Exchange Volume by Neobutane with HawkEye volume clone indicator by LazyBear.
Indicator includes aggregated raw BTC volume from 9 user selectable fiat and tether exchanges + Exponential MA + hawkeye bar coloring where: green is bullish volume, red - bearish and white - volume neutral to the market:
Bitfinex
Coinbase
Bitstamp
Kraken
Binance
Poloniex
Bittrex
bitFlyer
Bithumb

RSI / Stoch / SRSI / MFI / Aroon Overlay [SigmaDraconis]Combines 4 popular indicators (RSI, Stoch, SRSI, MFI) and 1 peculiar one (Aroon) in 1 for those who want to save indicators but not only.
This is an evolution of my (simpler) "RSI / Stoch / Stoch RSI (SRSI) Overlay " that you can find on my scripts.
Added bands for oversold/overbought areas (70/30 common for RSI and 80/20 for SRSI and MFI), as well as a middle 50 horizontal line.
Neutral bands around 55-45 added as well that can be hidden for less clutter. I also recommend a more transparent coloring for these since Pine script doesn't allow default transparency for horizontal lines.
By default only RSI and Stoch are activated, you can activate Aroon, MFI and SRSI on the inputs window.
Some extra notes:
* RSI, Stoch and MFI can help to strengthen one's decision as well as Aroon to predict a possible trend reversal, SRSI can show when RSI has high probability of being topped or bottomed when oversold/overbought but don't forget to look at volume and how the trend progresses that can keep SRSI above 80 or below 20 while RSI and price continues to trend, divergences are most helpful here to find possible reversal areas.
* This chart depicts some interesting divergences, as well as Stoch tops and bottoms and confluences between RSI/MFI and Stoch on some over-extended tops and bottoms that shown being good reversal zones.
RSI resistances are shown as well, failing to break above 60 or the neutral zone (this is a bearish BTC trend chart after all) or failing to gain support to break up certain levels (RSI notes a more bullish trend when consistently above 60 and more bearish below 40).
If you like it and use it to profit, please tip me below :)
Tip jars:
BTC: 15nMBiEGVrdGcu9C1h6QRcTNRvugHkqrMQ
ETH: 0xC33845946c48B61fBCbEA0367ec2238CaF2b73bc
BTS: sigma-draconis


U&Dif price has moved up since 1 to 3 candles ago = buy
if price has moved down since 1 to 3 candles ago = sell
has internal SL & TP
tested on
BITFINEX:ETHUSD
BITFINEX:BTCUSD
BITFINEX:LTCUSD
BITFINEX:ETHBTC
4 hour charts

XRPBTC long : BTCUSD shortIt will be an index using the price delivered by Bitfinex exchanges. It is a very simple indicator, but it is a recommended index for those who want to see XRP while keeping the risk of price fluctuation of BTC down. The code is simple and you can use XRP in the same way by changing it to another alto. There is a big gap in the prices of BTC and XRP, so we adjust the values so that the indicators are easy to see.

Relative Estimated Price REP by KIVANÇ fr3762Relative Estimated Price (REP) Indicator shows the estimated price calculated if the tickerid made the same value changes (in %) during a certain period.
The default value of the lookback period is 50.
In the given XRPUSD chart you can see that XRPUSD has a value of 0.26480 and the RPC indicator shows the value of 0.38099.
This means that XRP would be 0.38099USD if it was fully made the same percentage moves with BTC , we can say that XRP is RELATIVELY cheap according to BTC price moves.
Conversely XRP would be RELATIVELY expensive if the last value of REP was lower then current XRP price.
users can choose the relative base price in calculation of REP between 1-5 which are:
1=BTCUSD, 2=ETHUSD, 3=EURTRY(Euro/Turkish Lira), 4=USDTRY (Dollar/Turkish Lira), 5=BIST100 (Istanbul Stock Exchange)
I personally advise you to use this indicator for daily charts in Tradingview to have more accurate estimated prices because of the website's calculation.
Developed by KIVANÇ

[NG] Indicator - Altcoin Alpha - v1(Created for Client)
Alpha (Unique price action of asset) indicator for ALTcoins implementation, taking `BINANCE:BTCUSDT` as the market reference. Can be improved by adding more BTC charts from more sources, so as to get a unified chart of BTC for market representation.
Set `alpha period` to a value, wherein you want to see the unique price action of the asset. For short term trend, a value of 24 is good for `1H` charts (1 day), and value of 168 is good for long term trends on `1H` charts (1 week trend).
Corresponding values of `beta period` should be `168` (1 week for 1 day alpha) and `720` (1 month for 1 week alpha period).
You can set `alpha` and `beta` period as per your requirements.
Regards,

TSP Volume Change Big Small// Better Display of Volume change
// green candle : Big volume change
// red Candle : Small volume change
// Default for BTC m5
// Big volume are limited up to $limup% 5%
// Pump : Volume over $limgreen% 2%
// Flat : Very Small Volume under $limdo% 0.2%
// Adjust based on volatility / TF
// BTC/USD 1h : 4,2,0.25

Quote asset VolumeVolume expressed in quote asset units. For pair DOGE/BTC the volume is shown in BTC, instead of DOGE.
Values are imprecise, because each candle's price is calculated as (O+H+L+C)/4, instead of a weighted average one, which I couldn't obtain.
Noro's Trend MAs Strategy v1.8Trade strategy which uses only 2 MA.
The slow MA (blue) is used for definition of a trend
The fast MA (red) is used for an entrance to the transaction
For:
- For H1
- For crypto/fiat or crypto/crypto
- Good for "BTC/USD", "ETH/USD", "ETH/BTC"
Recomended:
Long = true (if it is profitable as a result of backtests)
Short = true (if it is profitable as a result of backtests)
Stops = false
Stop, % = any
OHLC4 = any
Use Fast MA = true
Fast MA Period = 5
Slow MA Period = 21
Bars Q = (2 for "bitcoin/fiat" or 1 for "crypto/fiat" or 0 for "crypto/crypto")
In the new version 1.8
- The second PriceChannel is added
- Profit became more
- Losses became less
- The unnecessary types of MA are removed

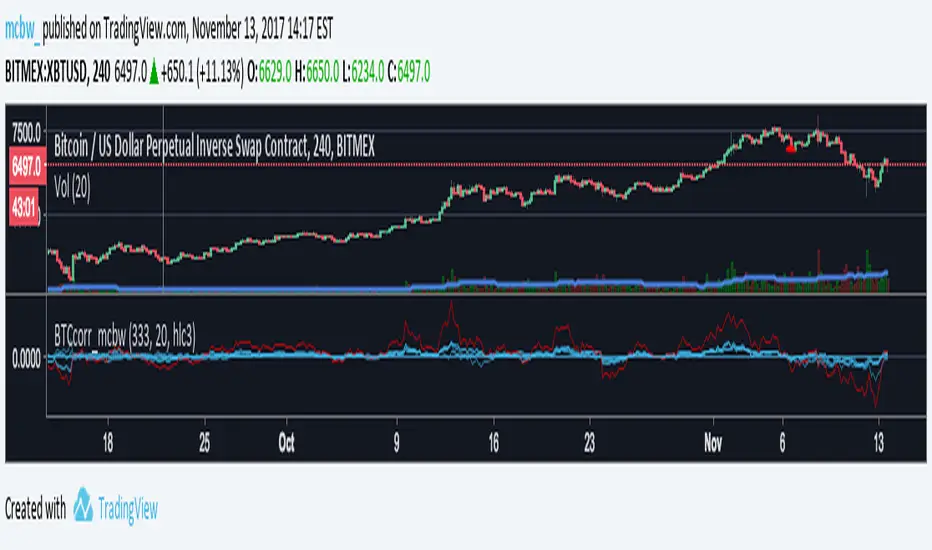
Bitcoin momentum correlation This is a pretty simple indicator, it measures the momentum of bitcoin as compared to usd,eur,eth,dash, and ltc, which you can see in all of the blue lines. If the red line is above zero then it means the overall value of btc is going up, opposite for down. The Ema_window controls how smooth the signal is. If you shorten the Ema_window parameter and open this on higher timeframe btc charts then the zero crossing gives pretty solid signals, despite being pretty choppy. A good way to interpret this is that if all the blue lines are moving in the same direction at once without disagreement, then the value of bitcoin has good momentum.
Mildly more technically:
Momentum is measured in the first derivative of an EMA for each ticker. To normalize the different values against each other they are all divided by their local maximums, which can be chosen in the parameter window, but shouldn't make a huge difference. All the checked values are then summed, as shown in the red line. To include a value into the red line simply keep it checked. Take a look at the script, it's kind of easy on the eyes.
It's pretty handy to look at, but doesn't seem too worthwhile to pursue much further. If someone wants much more out of the script then feel free to message me.
Remember rules #1 & #2
Don't lose money.
Happy trading
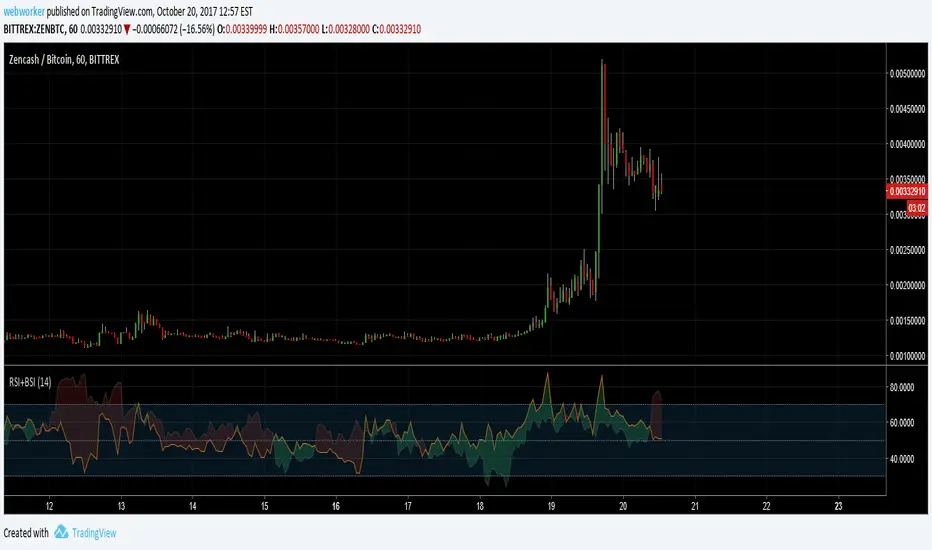
RSI+BSIThis script simply plots the current instruments RSI as well as Bitcoin's RSI from bitfinex. Helpful to identify when an alt is performing stronger than BTC or if BTC is dragging the alt down.
Volume Conversion IndicatorVolume Conversion Indicator
The volume conversion indicator is much like the in-built volume indicator. This particular volume indicator allows you to find out how much of something has been traded in a given timeframe.
This is done by multiplying volume by the average price at that point.
What does this mean?
Well, say, for example, you were watching DGB/BTC (DigiByte/Bitcoin). Instead of the volume being displayed in the amount of DGB traded, the amount of BTC traded is displayed instead.
Feel free to comment... Hope this helps :D

Indicator: Schaff Trend Cycle (STC)Another new indicator for TV community :)
STC detects up and down trends long before the MACD. It does this by using the same exponential moving averages (EMAs), but adds a cycle component to factor instrument cycle trends. STC gives more accuracy and reliability than the MACD.
More info: www.investopedia.com
Feel free to "Make mine" this chart and use the indicator in your charts. Appreciate any feedback on how effective this is for your instrument (I have tested this only with BTC).
For people trading BTC:
-------------------------------
Try 3/10 or 9/30 for MACD (fastLength/slowLength). They seem to catch the cycles better than the defaults. :)

OBV Base & Breakout Setup – ManuelOn Balance Volume, I am trying to use a tool that can show when the btc price reaches a bottom, and thus give me an alert when the balance volume crosses the 200 line.

deKoder | Ultra High Timeframe Moving Average & Log StDev BandsdeKoder | Ultra High Timeframe Moving Average & Log StDev Bands
Identify long-term statistical extremes and map the core trend with the deKoder | uHTF MA indicator. Designed for macro analysis, this tool uses ultra high timeframe moving averages and logarithmic standard deviation bands to frame price action, providing clear signals for when an asset is statistically cheap, fairly priced, or expensive.
KEY FEATURES
• Ultra High Timeframe (uHTF) Moving Average:
• Acts as a dynamic long term fair value equilibrium line. Choose from periods like 1-Year, 2-Year, or 'Long Time'.
• Select your MA type: SMA, EMA, Hull MA, or a Rolling VWAP .
• Automatically fetches optimal data (4H/D) for smoother plotting on lower timeframes.
• Probabilistic Logarithmic Bands:
• The bands are calculated using log-standard deviation , creating a framework that adapts to exponential growth. As such, your chart price scale should be set to log.
• ~68% of price action typically occurs between the ±1σ bands (fair value zone).
• Trading in the ±1σ to ±2σ channel is typical in a strongly trending market. Moves towards the ±3σ bands can indicate that the market is becoming overextended. Expect strong price moves here and pay attention for signs of reversal.
• Bitcoin Halving Timeline:
• Integrated vertical lines and labels for all Bitcoin halvings.
• Correlates technical extremes with fundamental scarcity events.
• 4-Year Cycle Visual Aid:
• The background color cycle highlights yearly changes.
• Red years have historically aligned with bear markets, while the subsequent green zone has marked accumulation phases.
• Note: The bands provide the primary information - the background color is a contextual guide based on historical patterns around the BTC 4 year halving cycle that may not persist in future. It's quite possible that the market will act differently going forward considering the new types participants such as ETFs and government reserve funds.
HOW TO USE & INTERPRET
• Fair Value & Extremes:
• Price between ±1σ Bands: The asset is trading within a statistically fair value range.
• Price at +2σ / +3σ Bands: The asset is statistically expensive. Statistically, the price is overextended in this region, although you do NOT want to fade it based only upon this information.
• Price at -2σ / -3σ Bands: The asset is statistically cheap. These zones have frequently coincided with the end of bear markets and profound long-term buying opportunities.
• Dynamic Support & Resistance:
• The uHTF MA and its bands tend to act as support and resistance areas of interest on daily, weekly and monthly charts.
INPUTS & CUSTOMIZATION
• Toggles : Master switch for the MA, Bands, and Halving markers.
• uHTF Moving Average Filter : Select instrument (default: BITSTAMP:BTCUSD), price source, MA length, and type.
• Colours : Fine-tune the appearance of all elements.
PRO TIPS
• While created for Bitcoin, this principle will work well on other high-growth assets and major indices.
• The most reliable signals occur on the Daily, Weekly and Monthly timeframes.
• This is a lagging, macro-filter indicator. It is not for timing short-term entries but for confirming the long-term trend and cycle phase.
"Be Fearful When Others Are Greedy and Greedy When Others Are Fearful." - The deKoder | uHTF MA is here to help you quantify that greed and fear on a macro scale.
