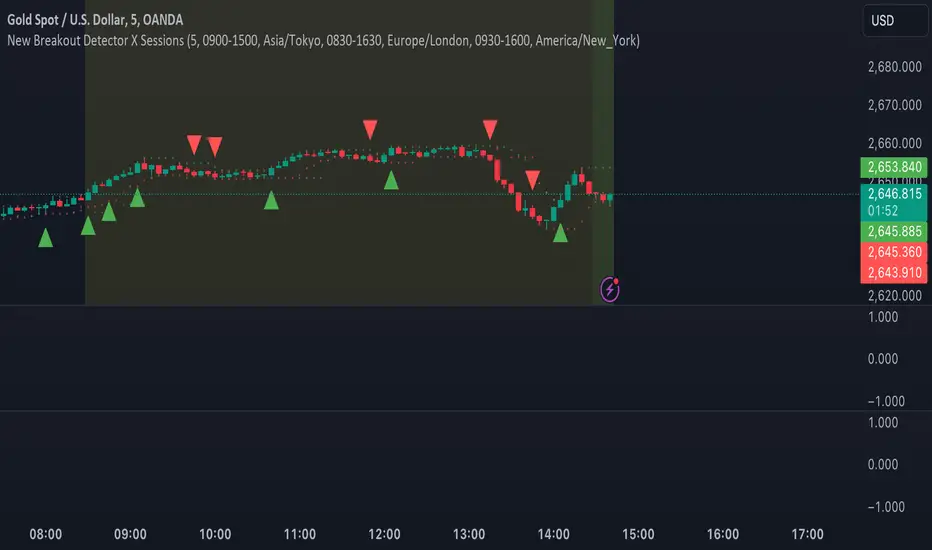
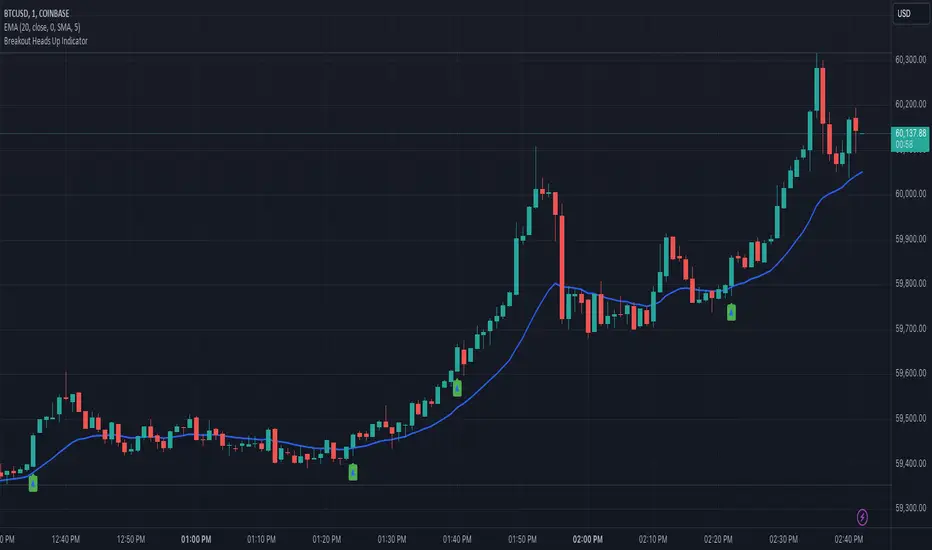
Heads UpAn indicator that gives you the "heads up" that that bullish/ bearish strength is increasing.
I wanted an indicator that could give me the "heads up" that bullish/ bearish strength is increasing. This would help me get into a breakout early or avoid entering a breakout that had a high probability of failure.
Here are my definitions for this indicator:
My bull bar definition:
- A green candle that closes above 75% of it's candle range.
- The candle's body does not overlap the previous candle's body. Tails/ wicks CAN overlap.
My bear bar definition:
- A red candle that closes below 75% of it's candle range.
- the candle's body does not overlap the previous candle's body. Tails/ ticks CAN overlap.
Bullish strength increasing (arrow up):
- Bull bars are increasing in size (the candle's range) compared to previous 5 bars.
- 2 consecutive bull bars.
Bearish strength increasing (arrow down):
- Bear bars are increasing in size (the candle's range) compared to previous 5 bars.
- 2 consecutive bear bars.
You will not see this indicator trigger very often but when it does - it's because there is a change in bullish bearish strength.
Things to be aware of:
Use the indicator in line with the context of the previous trend. You will get triggers that fail. These are usually because they appear counter trend. When in doubt zoom out.
It will not call every successful breakout. If you understand the definitions you'll understand why it appears.
This is my first indicator and used for my personal use. Feedback and other ideas are welcome.
Pesquisar nos scripts por "breakout"
Heiken Ashi Algo Premium KillZoneTraders face daily challenges in navigating the fast-paced market, from waiting for higher timeframe data to delayed confirmation signals. This innovative system changes everything, offering tools that have never before been available in the trading community. With groundbreaking features like
KillZones
High Timeframe RSI (HTF RSI) and
True Midline
this system is seeks to solve major problems that hurt traders every day.
KillZones give traders an edge by pinpointing critical price levels where momentum and liquidity shift.
The Custom High Timeframe RSI brings real-time higher timeframe trend confirmation directly to your chart, eliminating the need to wait for candles to close. A totally new way to calculate HTF RSI without waiting for higher time candles to close.
The True Midline adjusts dynamically, showing exactly when the market is in equilibrium or transitioning between bullish and bearish momentum.
Custom Heiken-Ashi Oscillator Candles:
It uses customized Heiken Ashi candle calculations that allow it present trends more accurately while the candles are limited to an oscillator as opposed to price values. Candle up or candle down doesnt always mean long or short. Ive included a setting called "Secret Sauce Colors" to alter the colors of the Heiken Ashi candles so they will be colored to the actual trend taking place instead of just bullish or bearish closing.
The Liquidity Ribbon:
This indicator contains a built in customized version of a Stochastic Oscillator called "The Liquidity Ribbon" which shows you when liquidity of either side is entering and existing the market. It uses calculations of market and volume pressure to give you a visual representation of who is trying to alter asset pricing. This is NOT the stochastic RSI but I've given you guys an visual approach of something that looks similar.
The ribbon has bullish and bearish sides that flip over eachother. As one grows, the other shrinks so yo u can see in real time the flow of money from either side and whos winning.
Bullish and Bearish Premium and Discount Zones
What Are They?
Bullish and Bearish Premium and Discount Zones are visualized on the indicator as distinct colored sections within the oscillator, providing a quick snapshot of market conditions:
Bearish Premium Zone: Indicates areas of overextension in bearish momentum, often associated with ranging markets.
Bearish Discount Zone: Highlights opportunities where bearish trends are gaining strength and momentum is trending.
Bullish Discount Zone: Marks areas in bullish conditions where the market is consolidating or ranging.
Bullish Premium Zone: Identifies zones where bullish momentum is strong and trends are more pronounced.
How to Use Them?
For long trades, consider the following:
Scalping Opportunities: When the market is trending higher and Heiken-Ashi candles are closing above the high-timeframe RSI, short-term long scalps can be executed in the Discount Bullish Zone, where consolidation occurs.
Trending Trades: Larger, more sustained long trades can be taken when price moves into the Premium Bullish Zone, signaling stronger upward momentum.
Breakout Trading: When price crosses into a trending zone and simultaneously breaks through previous price resistance or support, this confluence solidifies entries for breakout trades across previous highs or lows, providing a higher probability for successful trades.
This structured use of Premium and Discount Zones gives traders a clear edge, offering insights into both market range and trend strength.
True Midline
What Is It?
The True Midline represents the dynamic equilibrium between buyers and sellers, adapting to real-time market activity. Unlike fixed midlines in traditional oscillators, it adjusts based on where buyers and sellers enter and exit the market.
How Does It Work?
The midline accounts for four key activities: buyer entry, buyer exit, seller entry, and seller exit. This holistic approach highlights shifts in momentum and periods of reduced activity, such as when both buyers and sellers exit simultaneously, creating larger ranging zones.
How to Use It?
Consolidation Zones: Narrow midline ranges signal market indecision, often preceding breakouts.
Momentum Shifts: Crossing above or below the midline indicates transitions into bullish or bearish conditions.
Ranging Markets: Identifies reduced interest during simultaneous buyer and seller exits, helping avoid false signals.
The True Midline offers a clearer picture of market balance, helping traders navigate trends and consolidations with confidence.
Dynamic Trending Zones:
What Are They?
Dynamic Trending Zones represent areas of high volatility and breakout potential, reflecting shifts in market momentum and participation. These zones are self-adjusting and directly influence the midline's position.
There are two zones:
Bullish Trending Zone: Signals increased buyer momentum.
Bearish Trending Zone: Signals increased seller momentum.
How Are They Calculated?
The zones are derived using a combination of volume pressure and momentum changes, but these changes need to be sufficient to have moved price over time:
The indicator tracks sudden shifts in momentum relative to volume changes to identify critical thresholds for breakouts.
A "need-to-cross" point is established in each zone, acting as a breakout trigger.
If opposing or additional volume and momentum are insufficient, the zone remains unchanged until market conditions shift.
This ensures the zones dynamically adapt to real-time market activity while maintaining accuracy during periods of indecision or consolidation.
How to Use Them?
Bullish Breakouts: Crossing into the bullish zone and breaking a previous resistance signals strong buyer momentum. Check for contraction in the bearish zone to confirm dominance.
Bearish Breakouts: Similarly, crossing into the bearish zone while breaking a support level confirms seller strength.
Momentum Confirmation: Ensure current momentum is leading the high-timeframe RSI for more reliable trade setups.
Zone Analysis : Expansion of a zone signals increased participation (e.g., more buyers or sellers entering), while contraction indicates reduced activity or that buyers and or sellers are closing their positions.
These zones provide actionable insights into breakout potential and market momentum, helping traders make informed decisions in volatile conditions.
High Timeframe RSI (HTF RSI)
What Is It?
The High Timeframe RSI gives you real-time higher timeframe RSI values directly on your lower timeframe chart. This means you don’t have to wait for the higher timeframe candle to close before seeing the RSI updates—it’s always live.
Why Is It Needed?
Normally, to see the RSI on a higher timeframe, you have to wait for that timeframe to close. This can be slow and lead to missed opportunities. The HTF RSI solves this by showing you the higher timeframe RSI values as soon as each lower timeframe candle closes, giving you faster insights and no delays.
How It works?
Rather than just using the standard RSI, the HTF RSI compares the momentum on your current timeframe with what it would be on the higher timeframe. It takes into account how many candles on your current chart fit into each higher timeframe candle. This makes sure that the higher timeframe RSI is accurate and reflects the real momentum, even when switching between timeframes.
How to Use It?
Trend Confirmation:
When the HTF RSI is above the midline, it shows a bullish trend on the higher timeframe, and if your current momentum is also bullish, it strengthens your trade setup.
When the HTF RSI is below the midline, it shows a bearish trend, and if your current momentum is bearish, it supports short trade setups.
If bearish momentum is above the HTF RSI, it suggests a local downtrend within a larger bullish trend.
Major Benefits
Custom Timeframes: You can use any higher timeframe you choose, not just the typical ones.
Real-Time Updates: Get higher timeframe RSI values with each candle, without delays.
Better Trading Insights: Align your trades with both lower and higher timeframe trends to make more informed decisions.
With HTF RSI, you get a clear view of higher timeframe trends in real time, so you can act faster and smarter on your trades.
Main Market Opener Breakout [RH]Based on my observations while analyzing the crypto and forex charts, particularly BTCUSDT and EURUSD, I have noticed that the prices exhibit significant movements during most stock market sessions, particularly during New York main market session.
With the aim of capturing these moves, I embarked on extensive research. Through this research, I discovered that by considering the very first "15m" or "30m" candle of the main market trading session and marking that first candle's high and low points, we can create potential trigger points.
A break above the high point indicates a bullish signal, while a break below the low point suggests a bearish signal. To further refine our analysis and filter out some noise, we can incorporate the Average True Range (ATR) value of that candle.
Candle time is very important here. We will mark the candle when the actual trading begins in New York stock exchange. The trading hours for the New York Stock Exchange (NYSE) typically begin at 9:30 AM and end at 4:00 PM Eastern Time (ET), Monday through Friday. This is known as the "NYSE Regular Trading Session." However, it's important to note that there are also pre-market and after-hours trading sessions that occur outside of these core hours. We will not consider these pre and after-hours.
Example:
First break-above and break-below is marked automatically and alerts are also available for first breaks.
Example:
I have also added the option to add the, London Stock Exchange Main Market and Tokyo Stock Exchange Regular Trading Session. You can add those sessions also and test with different symbols.
Stocks symbols from different stock exchanges just mark the very first candle of the day(main market trading session).
Alerts are available.

Multi-Timeframe S/R & Breakout Projection1) What This Script Does
Collects S/R levels from the 15-minute and 1-hour timeframes, using each timeframe’s pivot detection.
Sorts those pivot-based levels by their distance from the current price, so you see the nearest levels first.
Draws up to a user-defined number of those levels as horizontal rays on the current chart.
Checks breakouts at the nearest S/R line (the one with the smallest distance from price):
Real Breakout: price breaks above a level and sustains above it for the specified number of bars.
False Breakout: price breaks above but quickly closes back below within the specified lookback.
On confirmation of a real or false breakout, that S/R line changes color to green if price is going higher, or red if price is going lower.
Displays a small table in the corner with:
Daily Trend: bullish or bearish, using an SMA on a 30-minute timeframe.
Sentiment: bullish or bearish, using RSI on the same 30-minute timeframe.
2) How It Works
Multi-Timeframe Pivot Detection
The script uses request.security() to fetch pivot highs/lows from two higher timeframes (15m and 60m).
It collects up to a user-specified number of these pivots (numRecent) from each TF.
Sorting & Plotting S/R Lines
Once pivot values are gathered, the script calculates their “distance” from current price.
It sorts them so that the S/R lines drawn on your chart are the nearest ones first.
Each line is drawn with a color and style you can customize:
srRayColor sets the overall color (e.g. yellow).
srRayStyleOptions can be Solid, Dashed, or Dotted.
Breakout Determination
After drawing the lines, the script looks at the nearest line and applies two specialized checks (f_isFalseBreakout & f_isRealBreakout):
A real breakout occurs if price closes above (or below) and remains on that side for breakLook bars.
A false breakout occurs if price closes above (or below) but quickly returns.
When a breakout is confirmed, that nearest line changes color to:
Green if price is ultimately going up,
Red if price is going down.
Daily Trend & Sentiment Table
A small table in the bottom-right corner shows:
Daily Trend: uses a 30-minute SMA to see if your price is above/below on that timeframe.
Sentiment: uses the RSI (also on 30m). A value over 50 suggests bullish sentiment; under 50 suggests bearish.
3) How to Use It
Timeframes & Pivots
Choose how many pivots (numRecent) from each TF to fetch (up to 10 total). A higher number means you’ll see more historical S/R lines.
Customize pivotLeft & pivotRight for how “wide” the pivot detection is.
Line Customization
In the script’s Inputs tab, you’ll find:
S/R Rays Color – sets the hue of the lines.
S/R Line Style – pick from Solid, Dashed, or Dotted.
Liquidity Lines Color – color for the smaller pivot lines from your chart timeframe’s pivot detection.
Breakout Lookback
breakLook determines how many bars must confirm or refute the breakout. Adjust it based on how conservative or aggressive you want the breakout detection.
Check the Table
In the bottom-right, watch the script’s “Daily Trend” & “Sentiment”. This can be a quick filter for trades:
“Bullish” daily trend with a bullish sentiment is often more favorable for long trades.
Conversely, “Bearish” daily trend & sentiment can confirm short ideas.
Scenarios
If you see a “Real Breakout” label near the line, the script recolors that line green or red, indicating a possible continuous move.
A “False Breakout” label suggests the price has quickly retraced.
4) Originality & Concepts
Multi-Timeframe Approach: Many S/R indicators fetch only local pivot lines; here, we explicitly gather pivot points from two separate TFs (15m & 60m) and project them onto your lower timeframe chart.
Distance-Based Sorting ensures you only see the nearest lines on the chart, preventing clutter from excessive lines.
Breakout Logic used is straightforward but effective: it checks if price truly holds beyond a level (real breakout) or fails to hold (false breakout).
Line Recoloring provides immediate visual feedback on the success or failure of the breakout.
5) Chart Usage
Plot this script on a relatively low timeframe chart (like the 1m, 5m, or 15m) to see the higher timeframe S/R lines.
Select how many S/R lines you want to show, choose the line style, set your pivot detection parameters, then watch for breakouts.
Tips:
Start with fewer lines (maxLevels=3 or 5) so the chart remains clear.
You can experiment with a small breakLook if you want more immediate breakout signals, or a higher breakLook if you need stronger confirmation.
Enjoy using the “Multi-Timeframe S/R & Breakout Projection” script! It simplifies the manual process of spotting higher timeframe pivot lines and helps you quickly assess potential breakouts or fakes on your intraday charts, all while giving you a snapshot of the higher timeframe’s trend and sentiment.

Luxy BIG beautiful Dynamic ORBThis is an advanced Opening Range Breakout (ORB) indicator that tracks price breakouts from the first 5, 15, 30, and 60 minutes of the trading session. It provides complete trade management including entry signals, stop-loss placement, take-profit targets, and position sizing calculations.
The ORB strategy is based on the concept that the opening range of a trading session often acts as support/resistance, and breakouts from this range tend to lead to significant moves.
What Makes This Different?
Most ORB indicators simply draw horizontal lines and leave you to figure out the rest. This indicator goes several steps further:
Multi-Stage Tracking
Instead of just one ORB timeframe, this tracks FOUR simultaneously (5min, 15min, 30min, 60min). Each stage builds on the previous one, giving you multiple trading opportunities throughout the session.
Active Trade Management
When a breakout occurs, the indicator automatically calculates and displays entry price, stop-loss, and multiple take-profit targets. These lines extend forward and update in real-time until the trade completes.
Cycle Detection
Unlike indicators that only show the first breakout, this tracks the complete cycle: Breakout → Retest → Re-breakout. You can see when price returns to test the ORB level after breaking out (potential re-entry).
Failed Breakout Warning
If price breaks out but quickly returns inside the range (within a few bars), the label changes to "FAILED BREAK" - warning you to exit or avoid the trade.
Position Sizing Calculator
Built-in risk management that tells you exactly how many shares to buy based on your account size and risk tolerance. No more guessing or manual calculations.
Advanced Filtering
Optional filters for volume confirmation, trend alignment, and Fair Value Gaps (FVG) to reduce false signals and improve win rate.
Core Features Explained
### 1. Multi-Stage ORB Levels
The indicator builds four separate Opening Range levels:
ORB 5 - First 5 minutes (fastest signals, most volatile)
ORB 15 - First 15 minutes (balanced, most popular)
ORB 30 - First 30 minutes (slower, more reliable)
ORB 60 - First 60 minutes (slowest, most confirmed)
Each level is drawn as a horizontal range on your chart. As time progresses, the ranges expand to include more price action. You can enable or disable any stage and assign custom colors to each.
How it works: During the opening minutes, the indicator tracks the highest high and lowest low. Once the time period completes, those levels become your ORB high and low for that stage.
### 2. Breakout Detection
When price closes outside the ORB range, a label appears:
BREAK UP (green label above price) - Price closed above ORB High
BREAK DOWN (red label below price) - Price closed below ORB Low
The label shows which ORB stage triggered (ORB5, ORB15, etc.) and the cycle number if tracking multiple breakouts.
Important: Signals appear on bar close only - no repainting. What you see is what you get.
### 3. Retest Detection
After price breaks out and moves away, if it returns to test the ORB level, a "RETEST" label appears (orange). This indicates:
The original breakout level is now acting as support/resistance
Potential re-entry opportunity if you missed the first breakout
Confirmation that the level is significant
The indicator requires price to move a minimum distance away before considering it a valid retest (configurable in settings).
### 4. Failed Breakout Detection
If price breaks out but returns inside the ORB range within a few bars (before the breakout is "committed"), the original label changes to "FAILED BREAK" in orange.
This warns you:
The breakout lacked conviction
Consider exiting if already in the trade
Wait for better setup
Committed Breakout: The indicator tracks how many bars price stays outside the range. Only after staying outside for the minimum number of bars does it become a committed breakout that can be retested.
### 5. TP/SL Lines (Trade Management)
When a breakout occurs, colored horizontal lines appear showing:
Entry Line (cyan for long, orange for short) - Your entry price (the ORB level)
Stop Loss Line (red) - Where to exit if trade goes against you
TP1, TP2, TP3 Lines (same color as entry) - Profit targets at 1R, 2R, 3R
These lines extend forward as new bars form, making it easy to track your trade. When a target is hit, the line turns green and the label shows a checkmark.
Lines freeze (stop updating) when:
Stop loss is hit
The final enabled take-profit is hit
End of trading session (optional setting)
### 6. Position Sizing Dashboard
The dashboard (bottom-left corner by default) shows real-time information:
Current ORB stage and range size
Breakout status (Inside Range / Break Up / Break Down)
Volume confirmation (if filter enabled)
Trend alignment (if filter enabled)
Entry and Stop Loss prices
All enabled Take Profit levels with percentages
Risk/Reward ratio
Position sizing: Max shares to buy and total risk amount
Position Sizing Example:
If your account is $25,000 and you risk 1% per trade ($250), and the distance from entry to stop loss is $0.50, the calculator shows you can buy 500 shares (250 / 0.50 = 500).
### 7. FVG Filter (Fair Value Gap)
Fair Value Gaps are price inefficiencies - gaps left by strong momentum where one candle's high doesn't overlap with a previous candle's low (or vice versa).
When enabled, this filter:
Detects bullish and bearish FVGs
Draws semi-transparent boxes around these gaps
Only allows breakout signals if there's an FVG near the breakout level
Why this helps: FVGs indicate institutional activity. Breakouts through FVGs tend to be stronger and more reliable.
Proximity setting: Controls how close the FVG must be to the ORB level. 2.0x means the breakout can be within 2 times the FVG size - a reasonable default.
### 8. Volume & Trend Filters
Volume Filter:
Requires current volume to be above average (customizable multiplier). High volume breakouts are more likely to sustain.
Set minimum multiplier (e.g., 1.5x = 50% above average)
Set "strong volume" multiplier (e.g., 2.5x) that bypasses other filters
Dashboard shows current volume ratio
Trend Filter:
Only shows breakouts aligned with a higher timeframe trend. Choose from:
VWAP - Price above/below volume-weighted average
EMA - Price above/below exponential moving average
SuperTrend - ATR-based trend indicator
Combined modes (VWAP+EMA, VWAP+SuperTrend) for stricter filtering
### 9. Pullback Filter (Advanced)
Purpose:
Waits for price to pull back slightly after initial breakout before confirming the signal.
This reduces false breakouts from immediate reversals.
How it works:
- After breakout is detected, indicator waits for a small pullback (default 2%)
- Once pullback occurs AND price breaks out again, signal is confirmed
- If no pullback within timeout period (5 bars), signal is issued anyway
Settings:
Enable Pullback Filter: Turn this filter on/off
Pullback %: How much price must pull back (2% is balanced)
Timeout (bars): Max bars to wait for pullback (5 is standard)
When to use:
- Choppy markets with many fake breakouts
- When you want higher quality signals
- Combine with Volume filter for maximum confirmation
Trade-off:
- Better signal quality
- May miss some valid fast moves
- Slight entry delay
How to Use This Indicator
### For Beginners - Simple Setup
Add the indicator to your chart (5-minute or 15-minute timeframe recommended)
Leave all default settings - they work well for most stocks
Watch for BREAK UP or BREAK DOWN labels to appear
Check the dashboard for entry, stop loss, and targets
Use the position sizing to determine how many shares to buy
Basic Trading Plan:
Wait for a clear breakout label
Enter at the ORB level (or next candle open if you're late)
Place stop loss where the red line indicates
Take profit at TP1 (50% of position) and TP2 (remaining 50%)
### For Advanced Traders - Customized Setup
Choose which ORB stages to track (you might only want ORB15 and ORB30)
Enable filters: Volume (stocks) or Trend (trending markets)
Enable FVG filter for institutional confirmation
Set "Track Cycles" mode to catch retests and re-breakouts
Customize stop loss method (ATR for volatile stocks, ORB% for stable ones)
Adjust risk per trade and account size for accurate position sizing
Advanced Strategy Example:
Enable ORB15 only (disable others for cleaner chart)
Turn on Volume filter at 1.5x with Strong at 2.5x
Enable Trend filter using VWAP
Set Signal Mode to "Track Cycles" with Max 3 cycles
Wait for aligned breakouts (Volume + Trend + Direction)
Enter on retest if you missed the initial break
### Timeframe Recommendations
5-minute chart: Scalping, very active trading, crypto
15-minute chart: Day trading, balanced approach (most popular)
30-minute chart: Swing entries, less screen time
60-minute chart: Position trading, longer holds
The indicator works on any intraday timeframe, but ORB is fundamentally a day trading strategy. Daily charts don't make sense for ORB.
DEFAULT CONFIGURATION
ON by Default:
• All 4 ORB stages (5/15/30/60)
• Breakout Detection
• Retest Labels
• All TP levels (1/1.5/2/3)
• TP/SL Lines (Detailed mode)
• Dashboard (Bottom Left, Dark theme)
• Position Size Calculator
OFF by Default (Optional Filters):
• FVG Filter
• Pullback Filter
• Volume Filter
• Trend Filter
• HTF Bias Check
• Alerts
Recommended for Beginners:
• Leave all defaults
• Session Mode: Auto-Detect
• Signal Mode: Track Cycles
• Stop Method: ATR
• Add Volume Filter if trading stocks
Recommended for Advanced:
• Enable ORB15 + ORB30 only (disable 5 & 60)
• Enable: Volume + Trend + FVG
• Signal Mode: Track Cycles, Max 3
• Stop Method: ATR or Safer
• Enable HTF Daily bias check
## Settings Guide
The settings are organized into logical groups. Here's what each section controls:
### ORB COLORS Section
Show Edge Labels: Display "ORB 5", "ORB 15" labels at the right edge of the levels
Background: Fill the area between ORB high/low with color
Transparency: How see-through the background is (95% is nearly invisible)
Enable ORB 5/15/30/60: Turn each stage on or off individually
Colors: Assign colors to each ORB stage for easy identification
### SESSION SETTINGS Section
Session Mode: Choose trading session (Auto-Detect works for most instruments)
Custom Session Hours: Define your own hours if needed (format: HHMM-HHMM)
Auto-Detect uses the instrument's natural hours (stocks use exchange hours, crypto uses 24/7).
### BREAKOUT DETECTION Section
Enable Breakout Detection: Master switch for signals
Show Retest Labels: Display retest signals
Label Size: Visual size for all labels (Small recommended)
Enable FVG Filter: Require Fair Value Gap confirmation
Show FVG Boxes: Display the gap boxes on chart
Signal Mode: "First Only" = one signal per direction per day, "Track Cycles" = multiple signals
Max Cycles: How many breakout-retest cycles to track (6 is balanced)
Breakout Buffer: Extra distance required beyond ORB level (0.1-0.2% recommended)
Min Distance for Retest: How far price must move away before retest is valid (2% recommended)
Min Bars Outside ORB: Bars price must stay outside for committed breakout (2 is balanced)
### TARGETS & RISK Section
Enable Targets & Stop-Loss: Calculate and show trade management
TP1/TP2/TP3 checkboxes: Select which profit targets to display
Stop Method: How to calculate stop loss placement
- ATR: Based on volatility (best for most cases)
- ORB %: Fixed % of ORB range
- Swing: Recent swing high/low
- Safer: Widest of all methods
ATR Length & Multiplier: Controls ATR stop distance (14 period, 1.5x is standard)
ORB Stop %: Percentage beyond ORB for stop (20% is balanced)
Swing Bars: Lookback period for swing high/low (3 is recent)
### TP/SL LINES Section
Show TP/SL Lines: Display horizontal lines on chart
Label Format: "Short" = minimal text, "Detailed" = shows prices
Freeze Lines at EOD: Stop extending lines at session close
### DASHBOARD Section
Show Info Panel: Display the metrics dashboard
Theme: Dark or Light colors
Position: Where to place dashboard on chart
Toggle rows: Show/hide specific information rows
Calculate Position Size: Enable the position sizing calculator
Risk Mode: Risk fixed $ amount or % of account
Account Size: Your total trading capital
Risk %: Percentage to risk per trade (0.5-1% recommended)
### VOLUME FILTER Section
Enable Volume Filter: Require volume confirmation
MA Length: Average period (20 is standard)
Min Volume: Required multiplier (1.5x = 50% above average)
Strong Volume: Multiplier that bypasses other filters (2.5x)
### TREND FILTER Section
Enable Trend Filter: Require trend alignment
Trend Mode: Method to determine trend (VWAP is simple and effective)
Custom EMA Length: If using EMA mode (50 for swing, 20 for day trading)
SuperTrend settings: Period and Multiplier if using SuperTrend mode
### HIGHER TIMEFRAME Section
Check Daily Trend: Display higher timeframe bias in dashboard
Timeframe: What TF to check (D = daily, recommended)
Method: Price vs MA (stable) or Candle Direction (reactive)
MA Period: EMA length for Price vs MA method (20 is balanced)
Min Strength %: Minimum strength threshold for HTF bias to be considered
- For "Price vs MA": Minimum distance (%) from moving average
- For "Candle Direction": Minimum candle body size (%)
- 0.5% is balanced - increase for stricter filtering
- Lower values = more signals, higher values = only strong trends
### ALERTS Section
Enable Alerts: Master switch (must be ON to use any alerts)
Breakout Alerts: Notify on ORB breakouts
Retest Alerts: Notify when price retests after breakout
Failed Break Alerts: Notify on failed breakouts
Stage Complete Alerts: Notify when each ORB stage finishes forming
After enabling desired alert types, click "Create Alert" button, select this indicator, choose "Any alert() function call".
## Tips & Best Practices
### General Trading Tips
ORB works best on liquid instruments (stocks with good volume, major crypto pairs)
First hour of the session is most important - that's when ORB is forming
Breakouts WITH the trend have higher success rates - use the trend filter
Failed breakouts are common - use the "Min Bars Outside" setting to filter weak moves
Not every day produces good ORB setups - be patient and selective
### Position Sizing Best Practices
Never risk more than 1-2% of your account on a single trade
Use the built-in calculator - don't guess your position size
Update your account size monthly as it grows
Smaller accounts: use $ Amount mode for simplicity
Larger accounts: use % of Account mode for scaling
### Take Profit Strategy
Most traders use: 50% at TP1, 50% at TP2
Aggressive: Hold through TP1 for TP2 or TP3
Conservative: Full exit at TP1 (1:1 risk/reward)
After TP1 hits, consider moving stop to breakeven
TP3 rarely hits - only on strong trending days
### Filter Combinations
Maximum Quality: Volume + Trend + FVG (fewest signals, highest quality)
Balanced: Volume + Trend (good quality, reasonable frequency)
Active Trading: No filters or Volume only (many signals, lower quality)
Trending Markets: Trend filter essential (indices, crypto)
Range-Bound: Volume + FVG (avoid trend filter)
### Common Mistakes to Avoid
Chasing breakouts - wait for the bar to close, don't FOMO into wicks
Ignoring the stop loss - always use it, move it manually if needed
Over-leveraging - the calculator shows MAX shares, you can buy less
Trading every signal - quality > quantity, use filters
Not tracking results - keep a journal to see what works for YOU
## Pros and Cons
### Advantages
Complete all-in-one solution - from signal to position sizing
Multiple timeframes tracked simultaneously
Visual clarity - easy to see what's happening
Cycle tracking catches opportunities others miss
Built-in risk management eliminates guesswork
Customizable filters for different trading styles
No repainting - what you see is locked in
Works across multiple markets (stocks, forex, crypto)
### Limitations
Intraday strategy only - doesn't work on daily charts
Requires active monitoring during first 1-2 hours of session
Not suitable for after-hours or extended sessions by default
Can produce many signals in choppy markets (use filters)
Dashboard can be overwhelming for complete beginners
Performance depends on market conditions (trends vs ranges)
Requires understanding of risk management concepts
### Best For
Day traders who can watch the first 1-2 hours of market open
Traders who want systematic entry/exit rules
Those learning proper position sizing and risk management
Active traders comfortable with multiple signals per day
Anyone trading liquid instruments with clear sessions
### Not Ideal For
Swing traders holding multi-day positions
Set-and-forget / passive investors
Traders who can't watch market open
Complete beginners unfamiliar with trading concepts
Low volume / illiquid instruments
## Frequently Asked Questions
Q: Why are no signals appearing?
A: Check that you're on an intraday timeframe (5min, 15min, etc.) and that the current time is within your session hours. Also verify that "Enable Breakout Detection" is ON and at least one ORB stage is enabled. If using filters, they might be blocking signals - try disabling them temporarily.
Q: What's the best ORB stage to use?
A: ORB15 (15 minutes) is most popular and balanced. ORB5 gives faster signals but more noise. ORB30 and ORB60 are slower but more reliable. Many traders use ORB15 + ORB30 together.
Q: Should I enable all the filters?
A: Start with no filters to see all signals. If too many false signals, add Volume filter first (stocks) or Trend filter (trending markets). FVG filter is most restrictive - use for maximum quality but fewer signals.
Q: How do I know which stop loss method to use?
A: ATR works for most cases - it adapts to volatility. Use ORB% if you want predictable stop placement. Swing is for respecting chart structure. Safer gives you the most room but largest risk.
Q: Can I use this for swing trading?
A: Not really - ORB is fundamentally an intraday strategy. The ranges reset each day. For swing trading, look at weekly support/resistance or moving averages instead.
Q: Why do TP/SL lines disappear sometimes?
A: Lines freeze (stop extending) when: stop loss is hit, the last enabled take-profit is hit, or end of session arrives (if "Freeze at EOD" is enabled). This is intentional - the trade is complete.
Q: What's the difference between "First Only" and "Track Cycles"?
A: "First Only" shows one breakout UP and one DOWN per day maximum - clean but might miss opportunities. "Track Cycles" shows breakout-retest-rebreak sequences - more signals but busier chart.
Q: Is position sizing accurate for options/forex?
A: The calculator is designed for shares (stocks). For options, ignore the share count and use the risk amount. For forex, you'll need to adapt the lot size calculation manually.
Q: How much capital do I need to use this?
A: The indicator works for any account size, but practical day trading typically requires $25,000 in the US due to Pattern Day Trader rules. Adjust the "Account Size" setting to match your capital.
Q: Can I backtest this strategy?
A: This is an indicator, not a strategy script, so it doesn't have built-in backtesting. You can visually review historical signals or code a strategy script using similar logic.
Q: Why does the dashboard show different entry price than the breakout label?
A: If you're looking at an old breakout, the ORB levels may have changed when the next stage completed. The dashboard always shows the CURRENT active range and trade setup.
Q: What's a good win rate to expect?
A: ORB strategies typically see 40-60% win rate depending on market conditions and filters used. The strategy relies on positive risk/reward ratios (2:1 or better) to be profitable even with moderate win rates.
Q: Does this work on crypto?
A: Yes, but crypto trades 24/7 so you need to define what "session start" means. Use Session Mode = Custom and set your preferred daily reset time (e.g., 0000-2359 UTC).
## Credits & Transparency
### Development
This indicator was developed with the assistance of AI technology to implement complex ORB trading logic.
The strategy concept, feature specifications, and trading logic were designed by the publisher. The implementation leverages modern development tools to ensure:
Clean, efficient, and maintainable code
Comprehensive error handling and input validation
Detailed documentation and user guidance
Performance optimization
### Trading Concepts
This indicator implements several public domain trading concepts:
Opening Range Breakout (ORB): Trading strategy popularized by Toby Crabel, Mark Fisher and many more talanted traders.
Fair Value Gap (FVG): Price imbalance concept from ICT methodology
SuperTrend: ATR-based trend indicator using public formula
Risk/Reward Ratio: Standard risk management principle
All mathematical formulas and technical concepts used are in the public domain.
### Pine Script
Uses standard TradingView built-in functions:
ta.ema(), ta.atr(), ta.vwap(), ta.highest(), ta.lowest(), request.security()
No external libraries or proprietary code from other authors.
## Disclaimer
This indicator is provided for educational and informational purposes only. It is not financial advice.
Trading involves substantial risk of loss and is not suitable for every investor. Past performance shown in examples is not indicative of future results.
The indicator provides signals and calculations, but trading decisions are solely your responsibility. Always:
Test strategies on paper before using real money
Never risk more than you can afford to lose
Understand that all trading involves risk
Consider seeking advice from a licensed financial advisor
The publisher makes no guarantees regarding accuracy, profitability, or performance. Use at your own risk.
---
Version: 3.0
Pine Script Version: v6
Last Updated: October 2024
For support, questions, or suggestions, please comment below or send a private message.
---
Happy trading, and remember: consistent risk management beats perfect entry timing every time.

Pivot Channel Breaks [BigBeluga]Pivot Channel Break
The Pivot Channel Break indicator identifies key pivot points and creates a dynamic channel based on these pivots. It detects breakouts from this channel, providing potential entry and exit signals for traders.
🔵 How to Use
Channel Identification:
- Upper and lower channel lines drawn based on pivot highs and lows
- Channel width dynamically adjusted using ATR-like calculation
Breakout Signals:
- Upward breakout: Price closes above upper channel line
- Downward breakout: Price closes below lower channel line
- Signals shown as X marks on the chart
Pivot Points:
- High pivots marked with "H" triangles
- Low pivots marked with "L" triangles
Support & Resistance:
- Optional signals when price touches but doesn't break channel lines
Trend Visualization:
- Optional bar coloring based on the most recent breakout direction
🔵 Customization
• Pivot Right: Lookback period for pivot detection (default: 10)
• Pivot Left: Forward period for pivot confirmation (default: 40)
• Channel Width: Multiplier for channel width calculation (default: 1.0)
• Support & Resistance Signals: Toggle additional touch signals
• Bar Color: Enable/disable trend-based bar coloring
Calculation:
Detect pivot highs and lows using specified lookback periods
Calculate channel basis using 10-period SMA of close prices
Determine channel width using ATR-like calculation: RMA(high - low, 10) * width multiplier
Set channel lines based on pivot points and calculated deviations
Identify breakouts when price crosses beyond channel lines
The Pivot Channel Break indicator offers a dynamic approach to identifying potential trend changes and breakout opportunities. It combines pivot point analysis with a flexible channel calculation, providing traders with a visual tool for market structure analysis. Use this indicator in conjunction with other technical analysis methods to confirm signals and manage risk effectively.

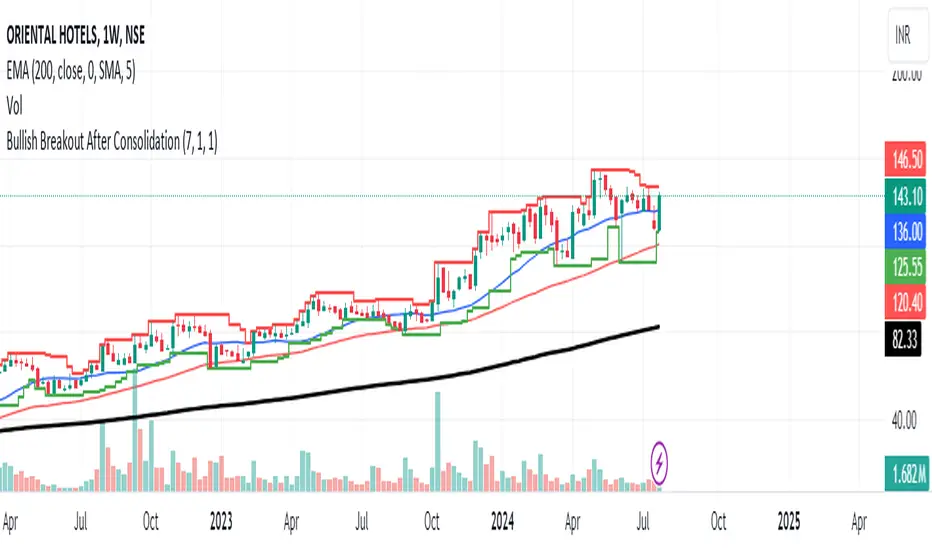
Bullish Breakout After ConsolidationDescription:
The Bullish Breakout After Consolidation Indicator is designed to help traders identify potential bullish breakout opportunities following a period of tight price consolidation. This indicator combines price action and volume analysis to signal when a stock may experience a significant upward movement.
Features:
Consolidation Range Tightness: The indicator identifies periods where the stock price consolidates within a narrow range, defined as a range less than 2% of the lowest low during the consolidation period. This tight consolidation is often a precursor to strong price movements.
Breakout Detection: Once the price breaks above the highest high of the consolidation range, and this breakout occurs after a specified number of days post-consolidation, the indicator marks it as a potential breakout opportunity.
Volume Confirmation: To avoid false breakouts, the indicator requires increased trading volume during the breakout. This ensures that the breakout is supported by substantial market activity.
Visual Cues:
Breakout Label: A "Breakout" label appears above the bar where a valid breakout occurs, making it easy to spot potential entry points.
Support and Resistance Lines: Horizontal lines plot the highest high (resistance) and lowest low (support) during the consolidation period, helping traders visualize the breakout levels.
Moving Averages: Optional 20-day and 50-day simple moving averages are plotted for additional trend confirmation.
How to Use:
Apply the Indicator: Add the indicator to your chart in TradingView to start analyzing potential breakouts.
Observe Consolidation: Look for tight consolidation periods where the price trades within a narrow range.
Identify Breakouts: Watch for breakouts where the price moves above the highest high of the consolidation range, supported by increased volume.
Confirm with Labels: The "Breakout" label will help you quickly identify valid breakout signals.
Parameters:
Consolidation Length: Number of days to consider for consolidation.
Range Percentage: Maximum percentage range for consolidation tightness.
Days After Consolidation: Number of days post-consolidation to check for the breakout.
Note: As with any trading tool, it is important to use this indicator as part of a broader trading strategy and in conjunction with other forms of analysis.
Disclaimer: This indicator is provided for educational purposes and should not be construed as financial advice. Trading involves risk and may not be suitable for all investors.
Swing Failure Pattern SFP [TradingFinder] SFP ICT Strategy🔵 Introduction
The Swing Failure Pattern (SFP), also referred to as a "Fake Breakout" or "False Breakout," is a vital concept in technical analysis. This pattern is derived from classic technical analysis, price action strategies, ICT concepts, and Smart Money Concepts.
It’s frequently utilized by traders to identify potential trend reversals in financial markets, especially in volatile markets like cryptocurrencies and forex. SFP helps traders recognize failed attempts to breach key support or resistance levels, providing strategic opportunities for trades.
The Swing Failure Pattern (SFP) is a popular strategy among traders used to identify false breakouts and potential trend reversals in the market. This strategy involves spotting moments where the price attempts to break above or below a previous high or low (breakout) but fails to sustain the move, leading to a sharp reversal.
Traders use this strategy to identify liquidity zones where stop orders (stop hunt) are typically placed and targeted by larger market participants or whales.
When the price penetrates these areas but fails to hold the levels, a liquidity sweep occurs, signaling exhaustion in the trend and a potential reversal. This strategy allows traders to enter the market at the right time and capitalize on opportunities created by false breakouts.
🟣 Types of SFP
When analyzing SFPs, two main variations are essential :
Real SFP : This occurs when the price breaks a critical level but fails to close above it, then quickly reverses. Due to its clarity and strong signal, this SFP type is highly reliable for traders.
Considerable SFP : In this scenario, the price closes slightly above a key level but quickly declines. Although significant, it is not as definitive or trustworthy as a Real SFP.
🟣 Understanding SFP
The Swing Failure Pattern, or False Breakout, is identified when the price momentarily breaks a crucial support or resistance level but cannot maintain the movement, leading to a rapid reversal.
The pattern can be categorized as follows :
Bullish SFP : This type occurs when the price dips below a support level but rebounds above it, signaling that sellers failed to push the price lower, indicating a potential upward trend.
Bearish SFP : This pattern forms when the price surpasses a resistance level but fails to hold, suggesting that buyers couldn’t maintain the higher price, leading to a potential decline.
🔵 How to Use
To effectively identify an SFP or Fake Breakout on a price chart, traders should follow these steps :
Identify Key Levels: Locate significant support or resistance levels on the chart.
Observe the Fake Breakout: The price should break the identified level but fail to close beyond it.
Monitor Price Reversal: After the breakout, the price should quickly reverse direction.
Execute the Trade: Traders typically enter the market after confirming the SFP.
🟣 Examples
Bullish Example : Bitcoin breaks below a $30,000 support level, drops to $29,000, but closes above $30,000 by the end of the day, signaling a Real Bullish SFP.
Bearish Example : Ethereum surpasses a $2,000 resistance level, rises to $2,100, but then falls back below $2,000, forming a Bearish SFP.
🟣 Pros and Cons of SFP
Pros :
Effective in identifying strong reversal points.
Offers a favorable risk-to-reward ratio.
Applicable across different timeframes.
Cons :
Requires experience and deep market understanding.
Risk of encountering false breakouts.
Should be combined with other technical tools for optimal effectiveness.
🔵 Settings
🟣 Logical settings
Swing period : You can set the swing detection period.
SFP Type : Choose between "All", "Real" and "Considerable" modes to identify the swing failure pattern.
Max Swing Back Method : It is in two modes "All" and "Custom". If it is in "All" mode, it will check all swings, and if it is in "Custom" mode, it will check the swings to the extent you determine.
Max Swing Back : You can set the number of swings that will go back for checking.
🟣 Display settings
Displaying or not displaying swings and setting the color of labels and lines.
🟣 Alert Settings
Alert SFP : Enables alerts for Swing Failure Pattern.
Message Frequency : Determines the frequency of alerts. Options include 'All' (every function call), 'Once Per Bar' (first call within the bar), and 'Once Per Bar Close' (final script execution of the real-time bar). Default is 'Once per Bar'.
Show Alert Time by Time Zone : Configures the time zone for alert messages. Default is 'UTC'.
🔵 Conclusion
The Swing Failure Pattern (SFP), or False Breakout, is an essential analytical tool that assists traders in identifying key market reversal points for successful trading.
By understanding the nuances between Real SFP and Considerable SFP, and integrating this pattern with other technical analysis tools, traders can make more informed decisions and better manage their trading risks.

Harmonic Patterns SuiteHello Traders!
This indicator takes the time-consuming search for harmonic patterns completely off your hands. TRN Harmonics utilizes a unique swing-based pattern recognition to pinpoint 14 different harmonic patterns in real-time with unparalleled precision.
Pattern List (each pattern has a bullish and a bearish version)
Gartley
Bat
Butterfly
Crab
Cypher
Shark
5-0
Feature List
Real-time harmonic pattern detection
7 different built-in breakout conditions
Visualization of entry, stop-loss and take-profit levels
Pattern performance statistics
Calculation of risk-rewards ratio
Risk Management
Breakout alerts
Customizable pattern size and accuracy
Customizable look and feel
The value of this indicator is to support traders to easily identify harmonic patterns in an automated way. The special swing-based pattern recognition and the numerous built-in premium features make this indicator unique. The trader saves a lot of time scanning the markets for harmonic patterns, since everything is done automatically for the trader: Finding the pattern, looking and alerting for a breakout, computing the entry, stop loss and take profit levels as well as handling the risk management and computing the optimal order quantity.
How to Trade with the Harmonic Patterns Suite
Identify the Pattern
Add the Harmonic Patterns Suite to your chart and look for patterns on the asset and timeframe of your choice. The patterns are detected in real-time. If a pattern develops further in the next bars, then the indicator updates the pattern accordingly until a breakout is confirmed or the pattern becomes invalid.
You can also use the built-in alerts to easily get notified when a pattern occurs. In the indicator settings in the "Alerts" section you can choose whether you want to get notified when a pattern is
1. in the making (Pattern active),
2. confirms an up breakout (B/O Up Confirmed)
3. confirms a down breakout (B/O Down Confirmed)
4. (Unconfirmed) in case a pattern breakout occurs, even if the pattern is not yet confirmed
This allows you to stay informed about potential breakout opportunities that are still awaiting confirmation.
Check Pattern Statistics
The pattern statistics make it easy for you to see how successful a pattern is on the asset and timeframe you are watching. You should always check the statistics before entering a trade. The chart displays the statistics in the upper right corner. These statistics are categorized into two sections: "long" for patterns with an upward breakout and "short" for patterns with a downward breakout.
In the initial columns, labeled as "short" and "long", the identified breakouts are further divided based on the different harmonic patterns. The following columns represent the count of the events:
1. Occ. (Occurrence) categorized according to the values of R from the first column
2. TP1, TP2 (Take Profit) - targets 1 und 2
3. SL (Stop Loss)
4. T/O (Time Out) - neither stop loss or targets where hit in a certain amount of time
Breakout – Entry, Stop Loss and Targets
The indicator automatically displays the entry price line (EP) in grey at the point where the breakout got detected. Once a breakout has been confirmed, place a buy order near the EP level for a long position, or a sell order for a short position. Set your stop-loss at the price level of the red stop-loss line (SL) and set your take-profits at the price level of the green take-profit-lines (TP1, TP2).
Risk Management
The Harmonic Patterns Suite comes with a built-in risk management feature. Just go to the settings and scroll down to the section "Risk Management". Here you can enter your Account Size and the percentage you want to Risk when you enter a position after a pattern breakout.
In the "Trade Management" section, you have the option to define the minimum accepted risk-reward ratio for confirmed harmonic patterns. This means that breakouts of patterns failing to meet the minimum risk-reward ratio will not be considered as confirmed signals. If a breakout gets confirmed, the indicator automatically calculates the position size (Quantity). You can read the quantity from the gray entry point line (EP), which is located to the right of the risk-reward ratio (R). Note that your risk-reward ratio (R) is calculated based on TP1.
Customization and settings
The indicator can scan for smaller and larger patterns at the same time. Adjust the harmonics size in the indicator settings to align them with your preferences. A larger size results in larger consolidations. Depending on the asset class, the market or the market phase, different sizes can be used for pattern detection.
To detect more patterns, increase the tolerance level, even though it may result in lower accuracy. However, be mindful that a higher tolerance level may result in more patterns hitting their stop-loss. Look for a tolerance level that leads to favorable statistics and focus on trading patterns with a proven performance history.
Finally, you have the flexibility to customize various visual elements, such as the color of the pattern and whether to display values like price, target, or risk-reward ratio on your chart. You can also choose where these values appear.
Breakout Conditions
Identifying breakout conditions is paramount for successfully recognizing and capitalizing on chart patterns. Trading tools equipped with diverse breakout conditions offer traders a comprehensive approach to deciphering market trends and making informed decisions.
This section delves into the set of breakout conditions built within TRN Harmonics, exploring their functionalities, applications, and the benefits they provide in the realm of chart pattern recognition.
TRN Bars Signal + Trend
The Harmonics Pattern Suite includes also the TRN Bars algorithm. It is designed to spot bullish and bearish trends and reversals. The trend analysis is based on a new algorithm that weights several different inputs:
1. classical and advanced bar patterns and their statistical frequency
2. probability distributions of price expansions after certain bar patterns
3. bar information such as wick length in %, overlapping of the previous bar in % and many more
4. historical trend and consolidation analysis
If you use this breakout condition, the breakout is determined by the next signal (reversal, continuation, breakout) or trend change of the TRN bars after one of the harmonic patterns has been completed. These Breakout conditions give you the accurate trend recognition of the TRN Bars to find the perfect entry.
TRN Bars Signal
If a harmonic pattern gets completed and you use this breakout condition, the breakout will be determined by the next confirmed signal (reversal, continuation, breakout) of the TRN Bars. These Breakout Condition delivers signals with reenforced reliability, but they occur not as often as other breakout conditions.
RSI Crossing
With this breakout condition, a breakout for a long position gets determined, when the RSI line crosses above the RSI moving average (MA) after one of the harmonic patterns has been completed. A bearish breakout after a completed harmonic pattern gets determined, when the RSI line crosses below the RSI MA.
You can choose your preferred RSI and MA length in the indicator settings under the “Trade Management” section.
MACD Crossing
If a harmonic pattern gets completed and you use this breakout condition, the breakout gets determined, when the MACD line crosses above the signal line (bullish MACD crossover) for a bullish breakout. Conversely, when the MACD line crosses below the signal line (bearish MACD crossover), a bearish breakout gets determined after a harmonic pattern was completed.
You can choose your preferred MACD length in the indicator settings under the “Trade Management” section.
Swing Flip
Use this breakout condition, if you want a breakout to get determined when the next swing after point D gets detected by the build in swing detection algorithm of TRN Harmonics.
Close Below/Above Last 2 Lows/Highs
With this breakout condition, a breakout for a short position gets determined, if a close below the lows of the last 2 bars gets detected. For a long position, the breakout gets determined if a close above the highs of the last 2 bars gets detected.
Close Below/Above Last 3 Lows/Highs
In this scenario, a short position breakout is confirmed if the price closes below the lows of the previous 3 bars. Conversely, a long position breakout is confirmed if the price closes above the highs of the last 3 bars.
How To Setup Breakout Conditions
Go to indicator settings and choose one of our built-in breakout conditions under the section "Trade Management" of the menu item "Inputs", like for example TRN Bars Signal + Trend. A selection of 7 distinct breakout conditions is at your disposal.
If you use the default settings of the Harmonic Patterns Suite, TRN Bars Signal + Trend will be the breakout condition for the detected harmonic patterns.
Computation Details
The real-time detection of the harmonic patterns utilizes a unique swing-based pattern recognition. The difference to other swing-based computations is that the pivot points are identified without a look-ahead value. The result is a faster and better real-time detection. Furthermore, the detection of the ratios between the single swings is based on a dynamic volatility measurement similar to the ATR. The tolerance level unites several internal parameters into one and results in a user-friendly setting.
Risk Disclaimer
The content, tools, scripts, articles, and educational resources offered by TRN Trading are intended solely for informational and educational purposes. Remember, past performance does not ensure future outcomes.

Boom Hunter XBoom Hunter X is built to target breakouts and explosive moves. The strength of this indicator is in slower timeframes like daily, weekly and monthly but it also works great on 4 hour timeframes. It is a modified version of Boom Hunter XL designed to be simple and easy to use. There are minimal settings available, aside from being able to choose the length of the oscillator there are 3 presets available. Preset 1 is the fastest and is great for targeting entries. Preset 3 is the slowest and is perfect for highlighting trends and setting up big moves. Preset 2 is somewhere in the middle and works great for entries and trend. To get a full picture of price action it is recommended to use all three indicators on your chart. The indicator will automatically adjust lengths when using weekly and monthly charts. If using faster timeframes try adjust the length to 6 or 9.
To get best results use Preset 3 to identify the trend of price action. When Preset 3 is in teal look for long entries on Presets 1 and 2. Likewise, when in red look for shorts. The best entries come from the first pullbacks. Below is an example of entering with the trend.
Using slow charts like weekly and monthly makes it easy to see what is happening with the markets. Below is an example of how easy it is to stay ahead of the curve and identify booms.
First pullbacks are signalled with outlined triangles: ▵▿
These signals are only available on preset 2 and 3. First pullbacks are picked up after price action breaks its median or dynamic median also known as OSC3 (OSC3 is hidden and works in the background), The strongest long pullbacks are when the oscillator is above the median and in the teal. Likewise the strongest short entries are when the oscillator is below the median and in the red. First pullback signals often signal the start of a new trend. Below is an example on a daily chart.
Breaks in support and resistance are signalled with white arrows: ˰˅
Preset 3 highlights the biggest breakouts while preset 1 will show the breaks within the breaks. Preset 2 provides a nice blend between the both and works great for targeting breakouts. It is not recommended to enter on the break as price action will come back to test. The first pullback after the break is typically the best and safest entry for breakouts. Below is an example of the break signal using preset 2 on weekly chart.
Breakout entries are signalled with teal and red triangles. Breakout signals filter price action for safe confirmed pullback entries. The slower the timeframe the bigger the breakout. Presets 2 and 3 are best for finding these entries.
Booms are signalled with this explosive icon: 💥
Simply put booms are polarity flips within the ticker signal. They are fast and explosive moves that can be detected using several different methods. Some of these boom signals are picked up using pure chart mechanics while others use filtering and signal processing to pinpoint the exact moment before an explosion. To make big moves the charts have to set it up first. Below is an example on a daily chart.
Boom Hunter X comes with the following alerts:
Overbought - Reversal attempt
Oversold - Reversal attempt
Long First Pullback - Only available on Preset 2 and 3
Short First Pullback - Only available on Preset 2 and 3
Pivot Up - Oscillator crosses over trigger
Pivot Down - Oscillator crosses under trigger
Long Breakout - Entry point for breakout
Short Breakout - Entry point for breakout
Break Support - Price action breaks its support
Break Resistance - Price action breaks its resistance
Boom! - Alerts for all the booms
Crossing Over Median - Price action enters top half of channel
Crossing Under Median - Price action enters bottom half of channel

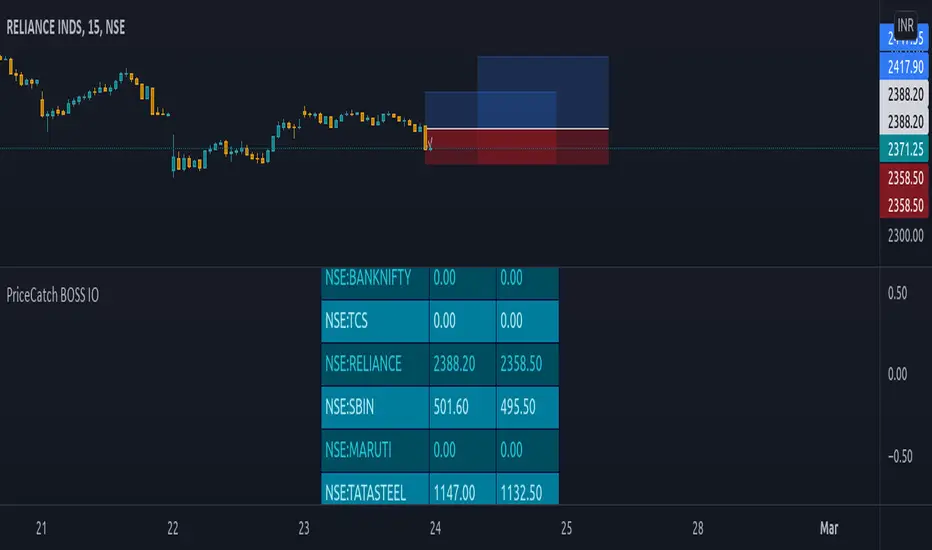
PriceCatch BOSS IOHi TradingView Community.
I am publishing a script that uses a proprietary logic based on Fibonacci retracement for identifying breakouts. This is a script that focuses on long side trades only.
PriceCatch BOSS IO: - PriceCatch Breakout Screener Script (Invite Only).
This script is not an indicator that plots anything on the chart but is a Screener.
SLIPPED OPPORTUNITIES
One of the problems faced by traders is that while they are watching or studying the chart of one stock or Forex pair, a super opportunity slips by them in another stock or another instrument and it is frustrating when that happens. With the PriceCatch BOSS IO script, you can now capture such moves made by other symbols whilst you are watching some other instrument.
USP:
The uniqueness of this script is that you can screen Nine of your favorite symbols for breakout opportunities simultaneously.
Users can pick Nine symbols of their choice and specify a resolution in the Settings dialog screen that the script will use to find out any probable breakouts in those selected nine symbols continuously.
The symbols could be from any exchange across the world and of any type - stocks, futures, commodities, Forex and Crypto. Simply put, if you can plot the symbol in TradingView, PriceCatch BOSS can monitor that instrument for breakouts on the time interval chosen by you.
ACTIONABLE INFORMATION:
What traders look for and expect from their charts is actionable information. This script does that. It clearly tells you the Entry Price and Stop Loss price for each symbol when a breakout opportunity presents itself in that symbol. You can then open up the chart of that specific symbol to validate the given information with any other indicators that you use and then take the call with regards to a trade. You may also use this script alone without adding any other indicator to your chart. The choice is yours.
CLARITY BEFORE TRADE:
As both Entry Price and Stop Loss Price are identified by the script, you receive advance information about the risk and can set your own Reward based on your personal preferences. So, with the necessary information provided to you in advance, you can plan your trades with clarity.
HOW IT WORKS:
Once the list of symbols are selected and resolution chosen, the script then continuously monitors those given symbols for breakout opportunities. At the close of every interval, it presents the results as shown below:
Results Set
This script shows the results of the screening in a Table as under:
SYMBOL Entry Price Stop Price
TSLA 830.84 802.88
EURUSD 1.13425 1.13160
Similarly for seven more instruments chosen by you.
NOTE: 0.00 under Entry and Stop price columns mean that there is no opportunity in that symbol.
ADVANTAGE:
The advantage of this script is that it helps you spot trades in your favorite symbols without manually loading their charts. With the ability to screen the symbols from Intraday time frames to higher time frames such as Weekly, you will be able to spot opportunities to go long in intraday, swing and even positional trades of longer duration.
Another significant advantage of this script is that while you may be watching a symbol in, say 15 minutes time frame, you can set the script to monitor breakouts in any other higher time frame starting from 15 minutes. This, in effect, gives you unsurpassed advantage.
DISCIPLINE:
As you choose your nine instruments/assets, the script indirectly inculcates discipline as your attention will be only on the selected instruments and you will not be distracted or search for opportunities in a whole bunch of other symbols / assets / instruments. As you can at any time change the set of nine assets as per your personal preference, you get the flexibility that you seek to work with a different set of symbols. For Forex traders who like to monitor only Major Pairs the ability to scan Nine pairs is quite sufficient. Similarly, to traders who trade S&P500, ES1! and other instruments, the nine symbols flexibility is adequate.
LONG POSITION TOOL
For visual cues, you may use the Long Position tool to set the Entry, Stop and Targets as per your preference on the main chart.
TRICK:
Can I only screen nine instruments? What if I am interested to screen more? Actually, you can screen more instruments. You see, you can add this script on to your chart multiple times and can select a set of nine unique stocks per script instance. That way you can actually screen more than nine stocks!
EXAMPLES:
Nifty 50
TSLA
Maruti
USDJPY
MSFT
UI
The script allows you to fine tune display options as per your personal preferences.
NOTE: This script runs in a separate pane without obstructing the view of your main chart.
NOTE: The formatting of price is based on mintick. As a result, since Forex and Crypto have more number of digits after the Decimal, if your screener list consists of a mix of stocks, Forex and Crypto - please change to a Forex chart to get the correct Forex price and to Crypto for correct Crypto price and so on.
NOTE: You will not get accurate results if you are in a higher time frame chart and the Screener resolution is set to lower time frame. For example, if chart is in 15 MTF and Screener resolution is set to 3 MTF, the results may not be accurate.
TIP: If you have added this script multiple times to your chart, then you may have to maximize the pane to view the results table.
NOTE - PRIOR TO USING THIS SCRIPT:
Please remember that the script is shared with absolutely no assurances about usability and any warranties whatsoever and as a responsible trader, please satisfy yourselves thoroughly and use it only if you are convinced it works for you. Remember, you are 100% responsible for your actions and must, therefore, do your due diligence before using this script and also before every trade. Profits and losses are part and parcel of trading activity and you are solely responsible for both. If you understand and accept that, you may use the script.
QUERIES/FEEDBACK
Please PM me.
Hope you find this script useful. Wish everyone all the best with trading.
Sentinel 5 — OHL daybreak signals [KedArc Quant]Overview
Sentinel 5 plots the first-bar high/low of each trading session and gives clean, rules-based signals in two ways:
1) OHL Setups at the close of the first bar (Open equals/near High for potential short; Open equals/near Low for potential long).
2) Breakout Signals later in the session when price breaks the first-bar High/Low, with optional body/penetration filters.
Basic workflow
1. Wait for the first session bar to finish.
*If O≈H (optionally by proximity) → short setup. •
*If O≈L → long setup. • If neither happens, optionally allow later breakouts.
2. Optional: Act only on breakouts that penetrate a minimum % of that bar’s range/body.
3. Skip the day automatically if the first bar is abnormally large (marubozu-like / extreme ATR / outsized vs yesterday).
Signals & Markers
Markers on the chart:
▲ O=L (exact) / O near L (proximity) – long setup at first-bar close.
▼ O=H (exact) / O near H (proximity) – short setup at first-bar close.
▲ Breakout Long – later bar breaks above first-bar High meeting your penetration rule.
▼ Breakout Short – later bar breaks below first-bar Low meeting your penetration rule.

Rapid Killzone BreakoutFinal Indicator Title: Rapid Killzone Break & HTF Levels
Overview
Welcome to the Rapid Killzone Break & HTF Levels, an all-in-one trading toolkit designed for precision and context. This indicator was built to solve a common problem for day traders: how to combine a precise, lower-timeframe (LTF) entry model with the essential context of higher-timeframe (HTF) levels.
This tool is founded on a session-based breakout strategy, leveraging the volatility and liquidity generated during specific market hours (the "Killzones"). It then layers critical HTF support and resistance levels onto your chart, allowing you to make more informed trading decisions without ever needing to switch timeframes.
Whether you trade Forex, Gold, or major Indices, this indicator provides a comprehensive framework for identifying high-probability breakout opportunities.
The Core Strategy
The methodology is a powerful three-step process based on session liquidity and qualified breakouts:
The Killzone Range: The indicator first identifies the high and low established during a specific, high-volatility trading session (e.g., the first hour of London or New York). This range acts as a pool of liquidity. The core idea is that the market will often seek to "sweep" or run the liquidity resting above the session high or below the session low.
The Qualified Breakout: This is not just any breakout strategy. A valid entry signal only appears when price closes decisively outside the Killzone range with significant momentum. To ensure the quality of the signal, the breakout must meet several user-defined criteria:
The Killzone must have a minimum pip range.
The breakout candle must have a strong body-to-wick ratio.
The breakout must be accompanied by a spike in volume.
Higher Timeframe Confluence: A breakout is more likely to succeed if it aligns with the HTF narrative. This indicator plots the previous higher-timeframe candle's high and low directly onto your chart. These levels act as powerful magnets for price or as formidable support/resistance zones. A breakout on the LTF that targets the HTF previous high is a much higher-probability setup than one trading directly into it.
Key Features
📊 DST-Aware Killzones: Automatically adjusting session boxes for London and New York. The timezones are fully configurable (e.g., Europe/London, America/New_York) and automatically handle Daylight Saving Time changes so you never have to manually adjust them.
📈 Killzone Pivots: Automatically draws the High, Low, and a dotted Midpoint from each Killzone session, acting as key intraday levels.
🏛️ Higher Timeframe (HTF) Levels: Plots the previous HTF candle's High and Low as dashed lines on your chart, providing critical context for support, resistance, and targets.
🕯️ HTF Mini-Candles: Displays a visual summary of the last three HTF candles on the right side of your chart, so you can see the HTF trend at a glance.
⏰ Custom Vertical Timestamps: Up to three configurable vertical lines with labels to mark key events like other session opens (e.g., "Sydney Open").
🎛️ Advanced Breakout Filters: Fine-tune your signals with filters for minimum Killzone range, minimum candle body percentage, and volume spikes. (Important: The volume filter requires a data feed that provides real volume, such as OANDA, FXCM, or futures/stock data).
✅ Dynamic Entry Advice Table: After a signal, a table provides a suggested entry technique (e.g., "50% retrace to signal candle") based on how far price has moved from the breakout level.
📋 Killzone Range Stats Table: A clean table shows the current and average pip range for both the London and New York sessions, helping you gauge current volatility.
🛠️ Fully Customizable: Nearly every visual element can be toggled on/off or have its color and style changed to suit your personal chart theme.
How to Use This Indicator
This tool is designed to provide a clear, step-by-step workflow for your trading sessions.
Setup: In the settings, choose your desired Reference Timeframe (e.g., 240 for 4-Hour). Configure your Killzone session times and colors.
Context is King: Before the session begins, take note of where price is in relation to the dashed HTF High/Low lines. Is price consolidating below the previous HTF low? A breakout might target it. Is price approaching the HTF high? This could be a take-profit area or a point of resistance.
Wait for the Range: Allow the London or New York Killzone (the colored box) to form completely.
Anticipate the Breakout: Once the session box is closed, the indicator is now hunting for a valid breakout.
Validate the Signal: When a "Long" or "Short" label appears, this is your entry signal. Check the Info-Box data (RSI, volume, candle body %) to confirm the strength of the move.
Manage the Trade: Use the Killzone pivots and the HTF High/Low lines as potential areas to manage your trade, take partial profits, or identify a final target. Check the Entry Advice table for ideas on refined entries if you miss the initial move.
Applicable Markets
This strategy is most effective on instruments known for their session-based volatility. It has been tested and works exceptionally well on:
Forex Majors: EUR/USD, GBP/USD, etc.
Gold: XAU/USD
Indices: NASDAQ 100 (NQ100), S&P 500 (SPX500)
It is best used on lower timeframes (such as the 5-minute or 15-minute chart) for trade execution.

Pivot Breakouts with MA FilterPivot Breakouts with MA Filter
This script identifies pivot breakouts (both bullish and bearish) using support and resistance levels and overlays breakout labels, arrows, and customizable Moving Averages. It allows traders to fine-tune their analysis with multiple options to customize the display and behavior of the breakout signals.
Key Features:
Pivot Support and Resistance:
Support is defined by the lowest low in a given range (using the lookback period).
Resistance is defined by the highest high in a given range (using the lookback period).
The script draws support and resistance boxes on the chart when these levels change, providing clear visual markers for potential breakout areas.
Breakout Detection:
Bullish Breakout: A breakout above resistance and the price is above the selected moving average (MA).
Bearish Breakout: A breakdown below support and the price is below the selected MA.
Breakout events trigger labels indicating "Resistance Breakout" (for bullish) and "Support Breakout" (for bearish).
The option to show Breakout Labels (with customizable colors) is available in the settings.
Moving Average Filter:
You can select the type of moving average (SMA or EMA) to use for filtering breakout signals.
MA Filter Length: This input allows you to set the period of the moving average to act as a filter for breakout conditions. This helps ensure the breakout aligns with the broader trend.
Multiple Moving Averages (Optional):
You can add up to four different moving averages (SMA or EMA), each with its own length and color.
You have the option to toggle each moving average on or off and adjust their appearance settings (color and length).
The script supports dynamic plots for each moving average, helping to visualize multiple trends at once.
Breakout Arrows:
The script can display arrows (or other shapes) below the bar for bullish breakouts and above the bar for bearish breakouts.
Arrows are optional and can be turned on/off in the settings.
You can customize the shape of the arrows (e.g., arrow, circle, square, or even a large or small triangle).
Customizable Colors and Labels:
The color of the breakout labels and arrows can be customized in the settings to make them fit your chart's style and personal preferences.
Alerts:
Alerts can be set for new support and resistance levels, as well as when breakouts occur (either bullish or bearish).
The alert system helps to notify traders when significant price action takes place without needing to constantly monitor the chart.
Settings:
Select Moving Average Type (SMA or EMA)
MA Filter Length: Length of the moving average used for filtering breakout conditions.
Lookback Range: Determines the range over which the pivot points (support and resistance) are calculated.
Breakout Labels: Option to turn on/off breakout labels, and customize label colors.
Show Breakout Arrows: Enable or disable breakout arrows with shape options (arrow, circle, square, large triangle, small triangle).
Multiple Moving Averages: Option to show up to 4 MAs with customizable colors and lengths.

Head and Shoulders PatternHello Traders!
The Head and Shoulders Pattern indicator utilizes a unique swing-based pattern recognition to pinpoint head and shoulders patterns in real-time with unparalleled precision.
The head and shoulders chart pattern is a technical analysis pattern used to identify potential trend reversals in financial markets. It consists of three swing highs (peaks), with the middle peak being the highest and the two outside swing highs being slightly lower. The middle peak is referred to as the "head" and the two outside peaks are referred to as the "shoulders."
The pattern typically forms after an uptrend and is in most cases a bearish signal. The neckline is a support level that connects the lows of the two shoulders. Once the price breaks below the neckline, the pattern is confirmed, and a new down trend starts. Conversely, an "inverse head and shoulders" pattern forms after a downtrend and is a bullish signal.
Feature List
Real-time pattern detection
Visualization of entry, stop-loss and take-profit levels
Pattern performance statistics
Calculation of risk-rewards ratio
Risk Management
Breakout alerts
Customizable pattern size and accuracy
Customizable look and feel
The value of this indicator is to support traders to easily identify the Head and Shoulders pattern in an automated way. The special swing-based pattern recognition and the numerous built-in premium features make this indicator unique. The trader saves a lot of time scanning the markets for head and shoulders patterns, since everything is done automatically for the trader: Finding the pattern, looking and alerting for a breakout, computing the entry, stop loss and take profit levels as well as handling the risk management and computing the optimal order quantity.
How to Trade with the TRN Head and Shoulders Indicator
Identify the Pattern
Add the Head and Shoulders Pattern Indicator to your chart and look for the pattern on the asset and timeframe of your choice. The pattern is detected in real-time. If the pattern develops further in the next bars, then the indicator updates the pattern accordingly until a breakout is confirmed or the pattern becomes invalid.
You can also use the built-in alerts to easily get notified when a pattern occurs. In the indicator settings in the "Alerts" section you can choose whether you want to get notified when a pattern is
1. in the making (Pattern active),
2. confirms an up breakout (B/O Up Confirmed)
3. confirms a down breakout (B/O Down Confirmed)
4. (Unconfirmed) in case a pattern breakout occurs, even if the pattern is not yet confirmed
This allows you to stay informed about potential breakout opportunities that are still awaiting confirmation.
Check Pattern Statistics
The pattern statistics make it easy for you to see how successful a pattern is on the asset and timeframe you are watching. You should always check the statistics before entering a trade. The chart displays the statistics in the upper right corner. These statistics are categorized into two sections: "long" for inverse head and shoulders patterns and "short" for head and shoulders patterns.
In the initial columns, labeled as "short" and "long", the identified breakouts are further divided based on whether the risk-reward ratio (R) is below a specified value (< x) or equal to/greater than the specified value (>= x). The following columns represent the count of the events:
1. Occ. (Occurrence) categorized according to the values of R from the first column
2. TP1, TP2, TP3 (Take Profit) - targets 1, 2 and 3
3. SL (Stop Loss)
4. T/O (Time Out) - neither stop loss or targets where hit in a certain amount of time
Breakout – Entry, Stop Loss and Targets
The indicator automatically displays the entry price line (EP) in grey at the point where the price breaks through the neckline, indicating a breakout. Once a breakout has been confirmed, place a buy order near the EP level for a long position, or a sell order for a short position. Set your stop-loss at the price level of the red stop-loss line (SL) and set your take-profits at the price level of the green take-profit-lines (TP1, TP2, TP3).
Risk Management
The Head and Shoulders Pattern Indicator comes with a built-in risk management feature. Just go to the settings and scroll down to the section "Risk Management". Here you can enter your Account Size and the percentage you want to Risk when you enter a position after a pattern breakout.
In the "Trade Management" section, you have the option to define the minimum accepted risk-reward ratio for confirmed rectangles. This means that breakouts of patterns failing to meet the minimum risk-reward ratio will not be considered as confirmed signals. If a breakout gets confirmed, the indicator automatically calculates the position size (Quantity). You can read the quantity from the gray entry point line (EP), which is located to the right of the risk-reward ratio (R). Note that your risk-reward ratio (R) is calculated based on TP1.
Customization and Settings
The indicator can scan for smaller and larger patterns at the same time. Adjust the Head and Shoulders Sizes in the indicator settings to align them with your preferences. A larger size results in larger patterns. Depending on the asset class, the market or the market phase, different sizes should be used for the Head and Shoulders pattern detection.
To detect more patterns, increase the tolerance level, even though it may result in lower accuracy. However, be mindful that a higher tolerance level may result in more patterns hitting their stop-loss. Look for a tolerance level that leads to favorable statistics and focus on trading patterns with a proven performance history.
Finally, you have the flexibility to customize various visual elements, such as the color of the pattern and whether to display values like price, target, or risk-reward ratio on your chart. You can also choose where these values appear.
Computation Details
The real-time detection of the Head and Shoulders Pattern Indicator utilizes a unique swing-based pattern recognition. The difference to other swing-based computations is that the pivot points are identified without a look-ahead value. The result is a faster and better real-time detection. Furthermore, the detection of the ratios between the single swings is based on a dynamic volatility measurement similar to the ATR. The tolerance level unites several internal parameters into one and results in a user-friendly setting.
Risk Disclaimer
The content, tools, scripts, articles, and educational resources offered by TRN Trading are intended solely for informational and educational purposes. Remember, past performance does not ensure future outcomes.

First 15-Min Candle Detector [With Breakout Alerts]Indicator: First 15-Minute Candle Detector
Purpose
This indicator helps traders by identifying and marking the high, low, and mid-point of the first 15-minute candle of the market session. It also provides visual aids and alerts for price breakouts above or below these levels, making it ideal for intraday trading strategies.
This script is suitable for traders focusing on early session momentum or reversal strategies.
Key Features
Market Start Customization: Configure the market start time (hour and minute) to align with your trading session or exchange timezone.
Visual Aids:
Horizontal lines to mark the High , Low , and Mid-point of the first 15-minute candle.
Background highlighting to identify the first 15-minute candle.
Configurable colors and line widths for clear visuals.
Breakout Alerts:
Real-time alerts for breakouts above the high or below the low of the first 15-minute candle.
Customizable alert messages.
Alerts configured using alertcondition .
Dynamic Adjustments:
Adapts dynamically to timeframes of 15 minutes or lower.
Resets and recalculates at the start of each new session.
Inputs and Configurations
Market Settings:
Market Start Hour: Default is 9.
Market Start Minute: Default is 30.
Visual Settings:
Enable/disable background highlighting.
Set colors for the background, high line, low line, and mid-line.
Adjust line width (1 to 5).
Toggle the visibility of the mid-line.
Alert Settings:
Enable breakout alerts.
Set custom alert messages for high and low breakouts.
How It Works
// First 15-Minute Candle Detection
The indicator monitors the first 15-minute candle after the market opens based on the configured start time. It records the high , low , and calculates the mid-point of this candle.
// Visual Markings
Horizontal lines are drawn at the high, low, and mid-point of the first 15-minute candle, extending to the right for the rest of the session.
// Breakout Detection
The indicator checks for price breakouts above the high or below the low of the first 15-minute candle and triggers alerts if enabled.
// Dynamic Reset
The indicator resets values and deletes previous session lines at the start of each new session.
Conditions and Alerts
Breakout Conditions:
High Breakout: The closing price exceeds the high of the first 15-minute candle.
Low Breakout: The closing price falls below the low of the first 15-minute candle.
Alert Triggers: Configurable alerts notify you of breakouts in real-time.
Use Cases
Intraday Traders: Ideal for early-session momentum or reversal strategies.
Breakout Traders: Helps identify entry points when price breaks key levels.
Visual Clarity: Simplifies tracking important session levels.
Limitations
Works only on 15-minute or lower timeframes.
Requires accurate market start time configuration.

TradingIQ - Impulse IQIntroducing "Impulse IQ" by TradingIQ
Impulse IQ is an exclusive trading algorithm developed by TradingIQ, designed to trade breakouts and established trends. By integrating artificial intelligence and IQ Technology, Impulse IQ analyzes historical and real-time price data to construct a dynamic trading system adaptable to various asset and timeframe combinations.
Philosophy of Impulse IQ
Impulse IQ combines IQ Technology (AI) with the classic principles of trend and breakout trading. Recognizing that markets inherently follow trends that need to persist for significant price movements to unfold, Impulse IQ eliminates the need for rigid settings or manual intervention.
Instead, it dynamically develops, adapts, and executes trend-based trading strategies, enabling a more responsive approach to capturing meaningful market opportunities.
Impulse IQ is designed to work straight out of the box. In fact, its simplicity requires just one user setting, making it incredibly straightforward to manage.
Strategy type is the only setting that controls Impulse IQ’s functionality.
Traders don’t have to spend hours adjusting settings and trying to find what works best - Impulse IQ handles this on its own.
Key Features of Impulse IQ
Self-Learning Breakout Detection
Employs IQ Technology to identify breakouts.
AI-Generated Trading Signals
Provides breakout trading signals derived from self-learning algorithms.
Comprehensive Trading System
Offers clear entry and exit labels.
AI-Determined Trailing Profit Target and Stop Loss
Position exit levels are clearly defined and calculated by the AI once the trade is entered.
Performance Tracking
Records and presents trading performance data, easily accessible for user analysis.
Long and Short Trading Capabilities
Supports both long and short positions to trade various market conditions.
IQ Meter
The IQ Meter details where price is trading relative to a higher timeframe trend and lower timeframe trend. Fibonacci levels are interlaced along the meter, offering unique insights on trend retracement opportunities.
Self Learning, Multi Timeframe IQ Zig Zags
The Zig Zag IQ is a self-learning, multi-timeframe indicator that adapts to market volatility, providing a clearer representation of market movements than traditional zig zag indicators.
Dual Strategy Execution
Impulse IQ integrates two distinct strategy types: Breakout and Cheap (details explained later).
How It Works
Before diving deeper into Impulse IQ, it's essential to understand the core terminology:
Zig Zag IQ : A self-learning trend and breakout identification mechanism that serves as the foundation for Impulse IQ. Although it belongs to the “Zig Zag” class of technical indicators, it's powered by IQ Technology.
Impulse IQ : A self-learning trading strategy that executes trades based on Zig Zag IQ. Zig Zag IQ identifies market trends, while Impulse IQ adapts, learns, and executes trades based on these trend characterizations.
Impulse IQ operates on a simple heuristic: go long during upside volatility and go short during downside volatility, essentially capturing price breakouts.
The definition of a “price breakout” is determined by IQ Technology, TradingIQ's exclusive AI algorithm. In Impulse IQ, the algorithm utilizes two IQ Zig Zags (self-learning, multi-timeframe zig zags) to analyze and learn from market trends.
It identifies breakout opportunities by recognizing violations of established price levels marked by the IQ Zig Zags. Impulse IQ then adapts and evolves to trade similar future violations in a recurring and dynamic manner.
Put simply, IQ Zig Zags continuously learn from both historical and real-time price updates to adjust themselves for an "optimal fit" to price data. The aim is to adapt so that the marked price tops and bottoms, when violated, reveal potential breakout opportunities.
The strategy layer of IQ Zig Zags, known as Impulse IQ, incorporates an additional level of self-learning with IQ Technology. It learns from breakout signals generated by the IQ Zig Zags, enabling it to dynamically identify and signal tradable breakouts. Moreover, Impulse IQ learns from historical price data to manage trade exits.
All positions start with an initial fixed stop loss and a trailing stop target. Once the trailing stop target is reached, the fixed stop loss converts into a trailing stop, allowing Impulse IQ to remain in the breakout/trend until the trailing stop is triggered.
What Classifies as a Breakout, Price Top, and Price Bottom?
For Impulse IQ:
Price tops are considered the highest price achieved before a price bottom forms.
Price bottoms are the lowest price reached before a price top forms.
For price tops, the highest price continues to be calculated until a significant downside price move occurs. Similarly, for price bottoms, the lowest price is calculated until a significant upside price move happens.
What distinguishes Zig Zag IQ from other zig zag indicators is its unique mechanism for determining a "significant counter-trend price move." Zig Zag IQ evaluates multiple fits to identify what best suits the current market conditions. Consequently, a "significant counter-trend price move" in one market might differ in magnitude from what’s considered "significant" in another, allowing it to adapt to varying market dynamics.
For example, a 1% price move in the opposite direction might be substantial in one market but not in another, and Zig Zag IQ figures this out internally.
The image above illustrates the IQ Zig Zags in action. The solid Zig Zag IQ lines represent the most recent price move being calculated, while the dotted, shaded lines display historical price moves previously analyzed by IQ Zig Zag.
Notice how the green zig zag aligns with a larger trend, while the purple zig zag follows a smaller trend. This mechanism is crucial for generating breakout signals in Impulse IQ: for a position to be entered, the breakout of the smaller trend must occur in the same direction as the larger trend.
The image above depicts the IQ Meters—an exclusive TradingIQ tool designed to help traders evaluate trend strength and retracement opportunities.
When the lower timeframe Zig Zag IQ and the higher timeframe Zig Zag IQ are out of sync (i.e., one is uptrending while the other is downtrending, with no active positions), the meters display a neutral color, as shown in the image.
The key to using these meters is to identify trend unison and pinpoint key trend retracement entry opportunities. Fibonacci retracement levels for the current trend are interlaced along each meter, and the current price is converted to a retracement ratio of the trend.
These meters can mathematically determine where price stands relative to the larger and smaller trends, aiding in identifying entry opportunities.
The top of each meter indicates the highest price achieved during the current price move.
The bottom of each meter indicates the lowest price achieved during the current price move.
When both the larger and smaller trends are in sync and uptrending, or when a long position is active, the IQ meters turn green, indicating uptrend strength.
When both trends are in sync and downtrending, or when a short position is active, the IQ meters turn red, indicating downtrend strength.
The image above shows the Point of Change for both the larger and smaller Zig Zag IQ trends. A distinctive feature of Zig Zag IQ is its ability to calculate these turning points in advance—unlike most traditional zig zag indicators that lack predetermined turning points and often lag behind price movements. In contrast, Zig Zag IQ offers a minimal-lag trend detection capability, providing a more responsive representation of market trends.
Simply put, once the market Zig Zag anchors are touched, the corresponding Zig Zag IQ will change direction.
Trade Signals
Impulse IQ can trade in one of two ways: Entering breakouts as soon as they happen (Breakout Strategy Type) or entering the pullback of a price breakout (Cheap Strategy Type).
Generally, the Breakout Strategy type will take a greater number of trades and enter a breakout quicker. The Cheap Strategy type will usually take less trades, but potentially enter at a better time/price point, prior to the next leg up of a break up, or the next leg down of a break down.
Entry signals are given when price breaks out to the upside or downside for the "Breakout" strategy type, or for the "Cheap" strategy type, when price retraces to the level it broke out from!
Breakout Strategy Example
The image above demonstrates a long position entered and exited using the Breakout strategy. The price breakout level is marked by the dotted, horizontal green line, representing a previously established price high identified by IQ Zig Zag. Once the price breaks and closes above this level, a long position is initiated.
After entering a long position, Impulse IQ immediately displays the initial fixed stop price. As the price moves favorably for the long position, the trailing stop conversion level is reached, and the indicator switches to a trailing stop, as shown in the image. Impulse IQ continues to "ride the trend" for as long as it persists, exiting only when the trailing stop is triggered.
Cheap Strategy Example
The image above shows a short entry executed using the Cheap strategy. The aim of the Cheap strategy is to enter on a pullback before the breakout occurs. While this results in fewer trades if price doesn’t pull back before the breakout, it typically allows for a better entry time and price point when a pullback does happen.
The image above illustrates the remainder of the trade until the trailing stop was hit.
Green Arrow = Long Entry
Red Arrow = Short Entry
Blue Arrow = Trade Exit
Impulse IQ calculates the initial stop price and trailing stop distance before any entry signals are triggered. This means users don’t need to constantly tweak these settings to improve performance—Impulse IQ handles this process internally.
Verifying Impulse IQ’s Effectiveness
Impulse IQ automatically tracks its performance and displays the profit factor for both its long and short strategies, visible in a table located in the top-right corner of your chart.
The image above shows the profit factor for both the long and short strategies used by Impulse IQ.
A profit factor greater than 1 indicates that the strategy was profitable when trading historical price data.
A profit factor less than 1 indicates that the strategy was unprofitable when trading historical price data.
A profit factor equal to 1 indicates that the strategy neither gained nor lost money on historical price data.
Using Impulse IQ
While Impulse IQ functions as a comprehensive trading system with its own entry and exit signals, it was designed for the manual trader to take its trading signals and analysis indications to greater heights - offering numerous applications beyond its built-in trading system.
The standout feature of Impulse IQ is its ability to characterize and capitalize on trends. Keeping a close eye on “Breakout” labels and making use of the IQ meter is the best way to use Impulse IQ.
The IQ Meters can be used to:
Find entry points during trend retracements
Assess trend alignment across higher and lower timeframes
Evaluate overall trend strength, indicating where the price lies on both IQ Meters.
Additionally, "Break Up" and "Break Down" labels can be identified for anticipating breakouts. Impulse IQ self-learns to capture breakouts optimally, making these labels dynamic signals for predicting a breakout.
The Zig Zag IQ indicators are instrumental in characterizing the market's current state. As a self-learning tool, Zig Zag IQ constantly adapts to improve the representation of current price action. The price tops and bottoms identified by Zig Zag IQ can be treated as support/resistance and breakout levels.
Of course, you can set alerts for all Impulse IQ entry and exit signals, effectively following along its systematic conquest of price movement.
Script pago

Stochastic Trendlines with Breakouts [Jamshid] - EnhancedStochastic Trendlines with Breakouts - Enhanced Version
This advanced Stochastic Trendlines with Breakouts script combines several powerful features to provide enhanced breakout detection based on the Stochastic Oscillator and additional confirmation signals. This script is designed to help traders identify key trend reversals, breakout points, and pivot levels with more accuracy by integrating advanced filters such as RSI confirmation, moving average trend filtering, volatility filtering, divergence detection, and multi-timeframe analysis.
Key Features:
Stochastic Oscillator-Based Breakouts:
Automatically detects breakouts based on the smoothed Stochastic Oscillator values (%K and %D), providing insights into overbought and oversold conditions.
Customizable overbought and oversold levels, with a mid-level (50) line for additional reference.
Trendlines on Pivot Points:
Automatically plots dynamic trendlines based on pivot highs and lows of the smoothed Stochastic %K, helping to visualize potential reversal points.
RSI Confirmation (Optional):
Filters breakout signals using the Relative Strength Index (RSI) to confirm breakouts only when the RSI is below 50 for downtrend breakouts and above 50 for uptrend breakouts.
Visual confirmation with a green "RSI Conf." label displayed on the chart when the RSI condition is met.
Moving Average Filter (Optional):
Confirms breakout signals in the direction of a user-defined Moving Average (MA) to trade in the overall market trend direction.
MA length is fully customizable.
Stochastic Divergence Filter (Optional):
Detects bullish or bearish divergence between the price and Stochastic Oscillator values, adding an extra layer of confirmation.
Multi-Timeframe Confirmation (Optional):
Confirms breakouts by checking the Stochastic %K and %D values from a higher timeframe. This helps in avoiding false signals by aligning with the broader market trend.
The higher timeframe can be customized to any timeframe (e.g., daily, weekly, etc.).
Volatility Filter (Optional):
Uses the ATR (Average True Range) to filter out breakouts during periods of low volatility, ensuring signals are only triggered when there is sufficient price movement.
ATR length and multiplier are fully customizable.
Custom Alerts:
Alerts are available for new trendline detections (both pivot high and pivot low) and for confirmed breakout signals. These alerts help traders stay informed in real-time without needing to monitor the chart continuously.
How to Use:
Customize the Stochastic Oscillator settings, such as %K smoothing and %D line parameters, to fit your trading strategy.
Enable or disable additional filtering features (RSI, MA, divergence, MTF, volatility) as needed.
Set up alerts for specific breakout conditions directly in TradingView to stay notified when breakout signals are triggered.
This script is designed for traders who are looking for precision breakout signals with added layers of confirmation to avoid false breakouts and enhance trading accuracy.

ALN Sessions Box Breakout — Auto- DSTDevoleper: Sheikh Rakib
What it does
This indicator draws session range boxes for Asia (Dhaka), London, and New York using each market’s own local time (DST-aware). After a session closes, it watches for the first close above the session high or below the session low and then marks that breakout once per session with clear chart markers and optional alerts.
Key features
Auto-DST, per-city timezones
London session uses Europe/London
New York session uses America/New_York
Asia session uses Asia/Dhaka
Your chart timezone doesn’t matter—the sessions track real local hours.
Clean range boxes with adjustable opacity and optional outlines.
Session labels that auto-center at the end of each session.
One-shot breakout signals per session:
Triangle up when price closes above the session high.
Triangle down when price closes below the session low.
Built-in alerts for: session starts and each breakout direction.
Inputs
London / New York / Asia (Dhaka)
Show Session: toggle each session on/off
Time Range: default London 08:00–17:00 (local), New York 08:00–17:00 (local), Asia 06:00–15:00 (Dhaka)
Colour: box color for each session
Settings
Show Session Labels
Show Range Outline
Opacity Preset: Dark / Medium / Light
(UTC Offset input is kept for display, not used in session detection.)
Visuals & alerts
Boxes extend from session open to close, continually updating the high/low.
When the session ends, the final high/low are locked in, the label is centered, and the indicator begins monitoring for a breakout.
Alerts
Session start: Asia/London/New York
Breakouts: “High Breakout” (close > high) and “Low Breakout” (close < low) for each session
Create alerts from the TradingView alert dialog and choose the desired alertcondition.
Logic notes (how signals fire)
While a session is open, its box grows to contain all highs/lows.
On the first bar after close, the script starts listening for a breakout:
Close > session high → one up signal (fires once)
Close < session low → one down signal (fires once)
When the next same session begins, internal flags reset and a new box starts—so signals are inherently scoped to the period between that session’s close and its next open.
Tips
Use on intraday timeframes (e.g., 1m–30m) for clearer box structure.
If you only want specific markets, toggle others off for a cleaner chart.
For systematic entries, combine with your trend/volatility filters and use the breakout alerts as triggers or confirmations—this script doesn’t place trades.
Disclaimer: Market timing and risk management are your responsibility. Past session behavior does not guarantee future performance.

Intelligent Currency Breakout ChannelIndicator: Intelligent Currency Breakout Channel
This document provides a detailed explanation of the "Intelligent Currency Breakout Channel" indicator for TradingView.
1. Overview
The Intelligent Currency Breakout Channel is an advanced technical analysis tool designed to identify periods of price consolidation and signal potential breakouts. It automatically draws channels around ranging price action and utilizes sophisticated volume analysis to provide deeper insights into market sentiment. The indicator also includes a built-in logarithmic regression screener to help traders align their breakout signals with the broader market trend.
2. Key Features
Automatic Channel Detection: The indicator identifies periods of low volatility and automatically draws a containing channel (box) around the price action.
Breakout Signals: It generates clear visual alerts (▲ for bullish, ▼ for bearish) when the price closes decisively outside of a channel.
In-Depth Volume Analysis: Within each channel, the indicator plots volume as candlestick-like bars, offering three distinct modes: Total Volume, Buy/Sell Comparison, and Volume Delta. This helps traders gauge the strength and conviction behind price movements.
Real-time Sentiment Gauge: When a channel is active, a dynamic color-graded gauge appears on the right side of the chart. It visualizes the current volume delta momentum relative to its recent range, offering an at-a-glance sentiment reading.
Integrated Trend Screener: A secondary analysis tool based on logarithmic regression is included to determine the underlying trend direction (Up, Down, or Neutral), which can be used to filter breakout signals.
Fully Customizable: Users can extensively customize all parameters, from calculation lengths and breakout sensitivity to the visual appearance of every component.
3. How to Use
Channel Formation: Watch for the indicator to draw a new channel. This signifies that the market is in a consolidation or ranging phase. The formation of a channel itself can be an alertable event.
Volume Interpretation: Observe the volume bars inside the channel. An increase in volume as the price approaches the channel's upper or lower boundary can foreshadow a potential breakout. Use the Volume Display Mode to analyze if buying pressure (Comparison, Delta) or selling pressure is building.
Breakout Confirmation: A bullish breakout signal (▲) appears when the price closes above the channel's upper boundary. A bearish breakout signal (▼) appears when the price closes below the lower boundary. For higher-quality signals, enable the Strong Closes Only option.
Trend Confirmation (Screener): Use the screener's plot and background color to confirm the broader trend. For instance, you might choose to only take bullish breakout signals when the screener indicates an uptrend (green background) and bearish signals when it indicates a downtrend (red background).
Sentiment Gauge: The pointer on the gauge indicates current momentum. A pointer in the upper (green) section suggests bullish pressure, while a pointer in the lower (red) section suggests bearish pressure. This can provide additional confluence for a trade decision.
4. Settings and Inputs
Main Settings
Overlap Channels: If enabled, allows multiple channels to be drawn on the chart simultaneously, even if they overlap. When disabled, a new channel will only form if it doesn't intersect with an existing one.
Strong Closes Only: If enabled, a breakout is only triggered if the midpoint of the candle's body (average of open and close) is outside the channel. This helps filter out false signals caused by long wicks. If disabled, any close outside the channel triggers a breakout.
Normalization Length: The lookback period (in bars) used for price normalization. A higher value creates a more stable normalization but may be slower to react to recent price changes.
Box Detection Length: The lookback period used to detect the channel formation pattern. A lower value will result in more frequent channels but may be more sensitive to noise. A higher value will result in fewer, but potentially more significant, channels.
Volume Analysis
Show Volume Analysis: Toggles the visibility of the candlestick-like volume bars inside the channel.
Volume Display Mode:
Volume: Displays total volume as symmetrical bars around the channel's midline.
Comparison: Shows buying volume (green) above the midline and selling volume (red) below it.
Delta: Shows the net difference between buying and selling volume. Positive delta is shown above the midline, and negative delta is shown below.
Volume Delta Timeframe Source: The timeframe from which to source volume data for calculations. Using a lower timeframe can provide a more granular view of volume dynamics.
Volume Scaling: A multiplier that adjusts the vertical size of the volume bars relative to the channel's height.
Appearance
Volume Text Size: Sets the size of the volume data text displayed in the corners of the channel. Options: Tiny, Small, Medium, Large.
Bullish Color: The primary color for all bullish visual elements, including breakout signals and positive volume bars.
Bearish Color: The primary color for all bearish visual elements, including breakout signals and negative volume bars.
Screener Settings
Lookback Period: The number of bars used for the logarithmic regression calculation to determine the trend.
Screener Type:
Log Regression Channel: The signal is based on the slope of the entire regression channel over the lookback period. An upward sloping channel is bullish (1), and a downward sloping one is bearish (-1).
Logarithmic Regression: The signal is based on the most recent value of the regression line compared to its value 3 bars ago. This provides a more responsive measure of the immediate trend.
5. Alerts
You can set up the following alerts through the TradingView alerts panel:
New Channel Formed: Triggers when a new price consolidation channel is detected and drawn on the chart.
Bullish Breakout: Triggers when the price breaks out and closes above the upper boundary of a channel.
Bearish Breakout: Triggers when the price breaks out and closes below the lower boundary of a channel.
Is In Channel: Triggers on every bar that the price is currently trading inside an active channel.
Signal UP: Triggers when the Screener's signal turns bullish (1).
Signal DOWN: Triggers when the Screener's signal turns bearish (-1).

Alpha - Combined BreakoutThis Pine Script indicator, "Alpha - Combined Breakout," is a combination between Smart Money Breakout Signals and UT Bot Alert, The UT Bot Alert indicator was initially developer by Yo_adriiiiaan
The idea of original code belongs HPotter.
This Indicator helps you identify potential trading opportunities by combining two distinct strategies: Smart Money Breakout and a modified UT Bot (likely a variation of the Ultimate Trend Bot). It provides visual signals, draws lines for potential take profit (TP) and stop loss (SL) levels, and includes a dashboard to track performance metrics.
Tutorial:
Understanding and Using the "Alpha - Combined Breakout" Indicator
This indicator is designed for traders looking for confirmation of market direction and potential entry/exit points by blending structural analysis with a trend-following oscillator.
How it Works (General Concept)
The indicator combines two main components:
Smart Money Breakout: This part identifies significant breaks in market structure, which "smart money" traders often use to gauge shifts in supply and demand. It looks for higher highs/lows or lower highs/lows and flags when these structural points are broken.
UT Bot: This is a trend-following component that generates buy and sell signals based on price action relative to an Average True Range (ATR) based trailing stop.
You can choose to use these signals independently or combined to generate trading alerts and visual cues on your chart. The dashboard provides a quick overview of how well the signals are performing based on your chosen settings and display mode.
Parameters and What They Do
Let's break down each input parameter:
1. Smart Money Inputs
These settings control how the indicator identifies market structure and breakouts.
swingSize (Market Structure Time-Horizon):
What it does: This integer value defines the number of candles used to identify significant "swing" (pivot) points—highs and lows.
Effect: A larger swingSize creates a smoother market structure, focusing on longer-term trends. This means signals might appear less frequently and with some delay but could be more reliable for higher timeframes or broader market movements. A smaller swingSize will pick up more minor market structure changes, leading to more frequent but potentially noisier signals, suitable for lower timeframes or scalping.
Analogy: Think of it like a zoom level on your market structure map. Higher values zoom out, showing only major mountain ranges. Lower values zoom in, showing every hill and bump.
bosConfType (BOS Confirmation Type):
What it does: This string input determines how a Break of Structure (BOS) is confirmed. You have two options:
'Candle Close': A breakout is confirmed only if a candle's closing price surpasses the previous swing high (for bullish) or swing low (for bearish).
'Wicks': A breakout is confirmed if any part of the candle (including its wick) surpasses the previous swing high or low.
Effect: 'Candle Close' provides stronger, more conservative confirmation, as it implies sustained price movement beyond the structure. 'Wicks' provides earlier, more aggressive signals, as it captures momentary breaches of the structure.
Analogy: Imagine a wall. 'Candle Close' means the whole person must get over the wall. 'Wicks' means even a finger touching over the top counts as a breach.
choch (Show CHoCH):
What it does: A boolean (true/false) input to enable or disable the display of "Change of Character" (CHoCH) labels. CHoCH indicates the first structural break against the current dominant trend.
Effect: When true, it helps identify early signs of a potential trend reversal, as it marks where the market's "character" (its tendency to make higher highs/lows or lower lows/highs) first changes.
BULL (Bullish Color) & BEAR (Bearish Color):
What they do: These color inputs allow you to customize the visual appearance of bullish and bearish signals and lines drawn by the Smart Money component.
Effect: Purely cosmetic, helps with visual identification on the chart.
sm_tp_sl_multiplier (SM TP/SL Multiplier (ATR)):
What it does: A float value that acts as a multiplier for the Average True Range (ATR) to calculate the Take Profit (TP) and Stop Loss (SL) levels specifically when you're in "Smart Money Only" mode. It uses the ATR calculated by the UT Bot's nLoss_ut as its base.
Effect: A higher multiplier creates wider TP/SL levels, potentially leading to fewer trades but larger wins/losses. A lower multiplier creates tighter TP/SL levels, potentially leading to more frequent but smaller wins/losses.
2. UT Bot Alerts Inputs
These parameters control the behavior and sensitivity of the UT Bot component.
a_ut (UT Key Value (Sensitivity)):
What it does: This integer value adjusts the sensitivity of the UT Bot.
Effect: A higher value makes the UT Bot less sensitive to price fluctuations, resulting in fewer and potentially more reliable signals. A lower value makes it more sensitive, generating more signals, which can include more false signals.
Analogy: Like a noise filter. Higher values filter out more noise, keeping only strong signals.
c_ut (UT ATR Period):
What it does: This integer sets the look-back period for the Average True Range (ATR) calculation used by the UT Bot. ATR measures market volatility.
Effect: This period directly influences the calculation of the nLoss_ut (which is a_ut * xATR_ut), thus defining the distance of the trailing stop loss and take profit levels. A longer period makes the ATR smoother and less reactive to sudden price spikes. A shorter period makes it more responsive.
h_ut (UT Signals from Heikin Ashi Candles):
What it does: A boolean (true/false) input to determine if the UT Bot calculations should use standard candlestick data or Heikin Ashi candlestick data.
Effect: Heikin Ashi candles smooth out price action, often making trends clearer and reducing noise. Using them for UT Bot signals can lead to smoother, potentially delayed signals that stay with a trend longer. Standard candles are more reactive to raw price changes.
3. Line Drawing Control Buttons
These crucial boolean inputs determine which type of signals will trigger the drawing of TP/SL/Entry lines and flags on your chart. They act as a priority system.
drawLinesUtOnly (Draw Lines: UT Only):
What it does: If checked (true), lines and flags will only be drawn when the UT Bot generates a buy/sell signal.
Effect: Isolates UT Bot signals for visual analysis.
drawLinesSmartMoneyOnly (Draw Lines: Smart Money Only):
What it does: If checked (true), lines and flags will only be drawn when the Smart Money Breakout logic generates a bullish/bearish breakout.
Effect: Overrides drawLinesUtOnly if both are checked. Isolates Smart Money signals.
drawLinesCombined (Draw Lines: UT & Smart Money (Combined)):
What it does: If checked (true), lines and flags will only be drawn when both a UT Bot signal AND a Smart Money Breakout signal occur on the same bar.
Effect: Overrides both drawLinesUtOnly and drawLinesSmartMoneyOnly if checked. Provides the strictest entry criteria for line drawing, looking for strong confluence.
Dashboard Metrics Explained
The dashboard provides performance statistics based on the lines drawing control button selected. For example, if "Draw Lines: UT Only" is active, the dashboard will show stats only for UT Bot signals.
Total Signals: The total number of buy or sell signals generated by the selected drawing mode.
TP1 Win Rate: The percentage of signals where the price reached Take Profit 1 (TP1) before hitting the Stop Loss.
TP2 Win Rate: The percentage of signals where the price reached Take Profit 2 (TP2) before hitting the Stop Loss.
TP3 Win Rate: The percentage of signals where the price reached Take Profit 3 (TP3) before hitting the Stop Loss. (Note: TP1, TP2, TP3 are in order of distance from entry, with TP3 being furthest.)
SL before any TP rate: This crucial metric shows the number of times the Stop Loss was hit / the percentage of total signals where the stop loss was triggered before any of the three Take Profit levels were reached. This gives you a clear picture of how often a trade resulted in a loss without ever moving into profit target territory.
Short Tutorial: How to Use the Indicator
Add to Chart: Open your TradingView chart, go to "Indicators," search for "Alpha - Combined Breakout," and add it to your chart.
Access Settings: Once added, click the gear icon next to the indicator name on your chart to open its settings.
Choose Your Signal Mode:
For UT Bot only: Uncheck "Draw Lines: Smart Money Only" and "Draw Lines: UT & Smart Money (Combined)". Ensure "Draw Lines: UT Only" is checked.
For Smart Money only: Uncheck "Draw Lines: UT Only" and "Draw Lines: UT & Smart Money (Combined)". Ensure "Draw Lines: Smart Money Only" is checked.
For Combined Signals: Check "Draw Lines: UT & Smart Money (Combined)". This will override the other two.
Adjust Parameters:
Start with default settings. Observe how the signals appear on your chosen asset and timeframe.
Refine Smart Money: If you see too many "noisy" market structure breaks, increase swingSize. If you want earlier breakouts, try "Wicks" for bosConfType.
Refine UT Bot: Adjust a_ut (Sensitivity) to get more or fewer UT Bot signals. Change c_ut (ATR Period) if you want larger or smaller TP/SL distances. Experiment with h_ut to see if Heikin Ashi smoothing suits your trading style.
Adjust TP/SL Multiplier: If using "Smart Money Only" mode, fine-tune sm_tp_sl_multiplier to set appropriate risk/reward levels.
Interpret Signals & Lines:
Buy/Sell Flags: These indicate the presence of a signal based on your selected drawing mode.
Entry Line (Blue Solid): This is where the signal was generated (usually the close price of the signal candle).
SL Line (Red/Green Solid): Your calculated stop loss level.
TP Lines (Dashed): Your three calculated take profit levels (TP1, TP2, TP3, where TP3 is the furthest target).
Smart Money Lines (BOS/CHoCH): These lines indicate horizontal levels where market structure breaks occurred. CHoCH labels might appear at the first structural break against the prior trend.
Monitor Dashboard: Pay attention to the dashboard in the top right corner. This dynamically updates to show the win rates for each TP and, crucially, the "SL before any TP rate." Use these statistics to evaluate the effectiveness of the indicator's signals under your current settings and chosen mode.
*
Set Alerts (Optional): You can set up alerts for any of the specific signals (UT Bot Long/Short, Smart Money Bullish/Bearish, or the "Line Draw" combined signals) to notify you when they occur, even if you're not actively watching the chart.
By following this tutorial, you'll be able to effectively use and customize the "Alpha - Combined Breakout" indicator to suit your trading strategy.

Multi Timeframe Breakout/Retest (Gap, FVG, B&R)📊 Breakout & Retest Multi-Timeframe Indicator - Support and Resistance Indicator 📊
In short, this indicator scans 4 timeframes of your choice to check if a proper breakout of your support and resistance lines you input has happened. It color-coats your support and resistance levels based on the type of breakout, labels the levels, and shows which timeframes have had a proper breakout in an interactive table. This tool is primarily used to determine when a breakout—whether Fair Value Gap (FVG), gap, or regular—has occurred, allowing you to confidently play the retest.
🔍 Types of Breakouts:
This indicator highlights three types of breakouts:
Regular Breakouts: Defined when a candle breaks above or below your level, then closes, and the next candle’s wick does not touch that level.
Gap Breakouts: A gap breakout occurs when we gap above or below the level—often happening on daily candle opens and closes.
FVG Breakouts: An FVG breakout happens when a breakout above or below your level forms a Fair Value Gap, with your level inside the gap. These breakouts tend to have stronger retests
📋 Interactive Table
The table helps you visualize which levels are experiencing a breakout and on which timeframes. It color-codes each level based on breakout activity:
🔴 Red: No active breakouts
🟢 Green: Active regular breakout
🔵 Blue: Active FVG breakout
🟡 Yellow: Active gap breakout
🎨 Color Coating & Minimum Timeframe Breakouts
To make sure you're playing a true breakout, you want confirmation on at least 3 of your chosen timeframes. This indicator has an adjustable "active minimum breakout" setting, which can be customized between 1 and 4 timeframes. I personally find that when a breakout occurs on at least 3 timeframes, the retest tends to have a higher success rate. But you can adjust this setting based on your strategy.
🔧 Future Updates (Follow for Updates):
🚨 Alerts: Set alerts for breakouts and retests.
⚙️ Improved Error Handling: For a smoother experience.

MJForex Breakout Detector X SessionsThis Pine Script code is a Breakout Detector with Trading Session highlights for use on a financial chart. Here's a detailed breakdown of its functionality:
1. Breakout Detection
The main purpose of this script is to detect breakouts based on specific price levels (like highs and lows) within a given lookback period. It identifies different types of breakouts in real time, specifically:
Higher High (HH): The highest price in the lookback period is exceeded, suggesting bullish momentum.
Higher Low (HL): A low that is higher than the previous low, which might indicate a potential upward trend continuation.
Lower High (LH): The price makes a lower high than the previous high, indicating a possible downward reversal.
Lower Low (LL): A low that is lower than the previous low, indicating bearish momentum.
Breakout Logic:
A buy signal is generated when there is a breakout above a Higher High or a Higher Low, signaling a potential bullish trend.
A sell signal is generated when there is a breakout below a Lower High or a Lower Low, signaling a potential bearish trend.
These signals are plotted on the chart using shapes (green triangles for buy signals and red triangles for sell signals).
2. Candle Body vs. Wick Consideration
The indicator allows you to choose whether the breakout is detected based on the candle body (the open and close prices) or the wick (the high and low prices).
This is controlled by a user input (use_body), so you can switch between these modes depending on your preference.
3. Trading Session Highlights
The script also visually highlights different trading sessions on the chart. Three sessions can be configured:
First Session (e.g., Asia/Tokyo)
Second Session (e.g., Europe/London)
Third Session (e.g., America/New York)
Each session is colored differently on the chart's background (blue, yellow, and green), helping you easily visualize which trading session is currently active.
4. Real-Time Alerts
The script generates real-time alerts when a breakout occurs.
Alerts are sent based on the current price action without waiting for the candle to close, which helps traders respond quickly to potential breakout signals and be aware of the particular zone or area.
Alerts:
A Buy alert is triggered when there's a Higher High (HH) or Higher Low (HL) breakout.
A Sell alert is triggered when there's a Lower High (LH) or Lower Low (LL) breakout.
These alerts can be used to notify traders when certain breakout conditions are met, allowing them to take action immediately.
5. Customizability
The script allows for several customizable inputs:
Lookback Period: The number of bars used to calculate the highest high and lowest low (default is 5).
Breakout Detection Toggle: You can choose whether to show the breakout signals on the chart.
Session Visibility: You can turn on/off the visual highlights for the trading sessions.
Body/Wick Toggle: You can select whether to consider the candle body or the wick when detecting breakouts.
In Summary:
Breakout Detection: Detects and highlights Higher High, Higher Low, Lower High, and Lower Low breakouts on the chart, generating buy/sell signals.
Candle Body/Wick Option: You can choose to detect breakouts based on the body or wick of the candle.
Real-Time Alerts: Sends alerts as soon as a breakout occurs, without waiting for the candle to close.
Trading Session Highlights: Highlights different global trading sessions for easy visual reference on the chart.
This indicator is particularly useful for traders who want to identify key breakouts and visually track trading sessions across different markets.