Mining Cash Flow LineTakes QUANDL Bitcoin blockchain difficulty data, three variables (hashrate in THs/sec, power consumption in kWh, and electricity costs in cents/kWh) and calculates the base line for cash flow in US dollars. The default is an AntMiner S15 at 10 cents/kWh.
When price is above this line, miners with the given conditions have positive cash flow (i.e. they make more money mining than their running costs), and when below the line, they would be better off turning their rigs off (if this simple model can be applied to their particular circumstance).
Assumptions:
1. All costs are consolidated into one "electricity cost" variable, including things like rent and wages for mining farms.
2. 12.5 BTC/block emission schedule (update source code upon next halving).
Warnings:
It is likely that actual costs to miners varies in complex ways. This indicator only shows a cash flow calculation for a very simple set of parameters that will generally apply to miners, but not necessarily all of them. (For example, a miner may be locked into a prepaid contract for cheap electricity, or sell exhaust heat in the winter for extra revenue.)
Positive cash flow is also different from ROI, as this model does not take into account the cost of acquiring an ASIC mining rig.
Pesquisar nos scripts por "bitcoin"

Aggregated Volume BTCAggregates the Bitcoin volume from multiple exchanges into a single indicator.
# Exchanges and Pairs
Included are only exchanges supported by TradingView:
* Binance
* Bitstamp
* Bittrex
* Coinbase
* Gemini
* itBit
* Bitfinex
* Kraken
* Poloniex
* HitBTC
* OKCoin
* BitMEX
Excluded low volume exchanges (not in CMC Top):
* CEX.IO
* Coinfloor
Excluded low volume pairs (not in CMC Top):
* KRAKEN:XBTCAD, COINBASE:BTCUSDC, ITBIT:BTCEUR, ITBIT:BTCSGD, BITFINEX:BTCJPY, BITFINEX:BTCGBP, POLONIEX:BTCUSDC, OKCOIN:BTCUSD, OKCOIN:BTCCNY
Many other top exchanges are not included, because they are not supported by TradingView.
# Inputs
By default the spot exchanges are selected. You can select also the other margin trading and derivatives exchanges.
# Contribute
Feel free to share any ideas and issues you have.
# Open Source
The code is open source @ github.com and uses the commonpine library github.com

Deribit Bitcoin IndexDeribit Bitcoin index, with hl2 as mid price substitute, as it tracks price more accurately than close alone.
Bitfinex excluded as Deribit has been doing so for a while now.

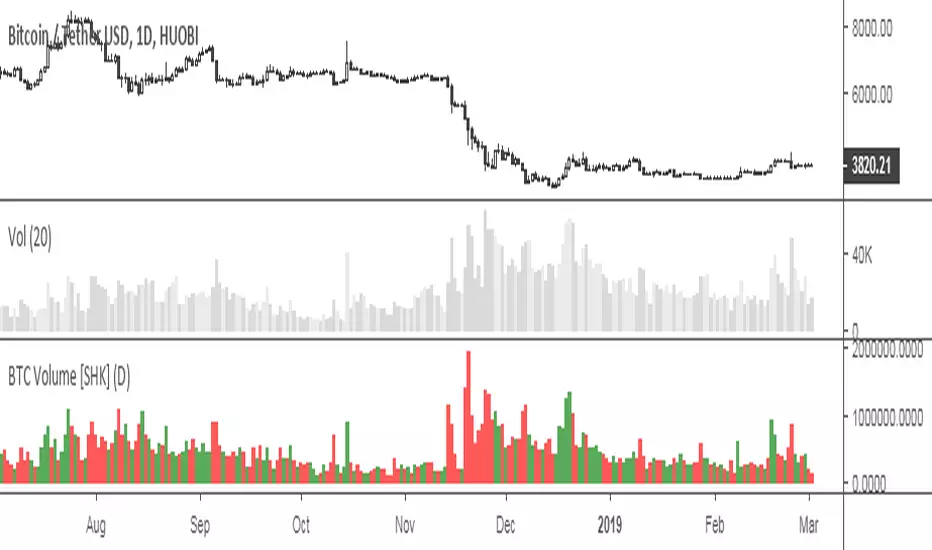
BTC Exchanges Volume [SHK]Useful script to calculate sum of BTC ( Bitcoin ) volumes on different exchanges.
Supported Exchanges:
Coinbase
Bitfinex
Bitmex
Houbi
CEX
Bitstamp
Binance
BitFlyer
Poloniex
Bittrex
Flyer
OkEx
Poloniex
Gemini
HitBTC
Bitmex BTC FuturesBitmex / Bitcoin indicator.
Just a simple overlay to visualise the contango / backwardation on Bitmex btc futures products so you know which to take position in, at a glance.
There are two selectable instruments (I have Dec18 and Mar19 selected already). By default the one with nearest settlement date is plotted with a filled coloured band from current price, the other plots a cross symbol.

Renko CandlesticksRenko charts are awesome . They reduce noise by only painting a brick on the chart when price moves by a specified amount up/down. When the price reverses, it must go twice the specified amount before a brick is painted. Time is not a factor, just price movement. Sometimes however, you want the pros of a renko chart, but on a regular candlestick chart. This indicator attempts to do just that.
A band is placed around price action showing the upper and lower bounds of what would be the current renko brick. The band only goes up/down when the price action itself moves up/down by the amount you specify. There are several ways of specifying the amount:
Fixed Price Amount: As the name says, you enter the brick size amount, i.e. the amount the price has to move before being in a new brick.
% of Price: This method will calculate the amount the price has to move as a percentage of the price itself. This way as price goes up/down, your brick size will adjust accordingly. Recommended values would be around 1% or less.
% of ATR: This option will make the brick size a percentage of the Average True Range. You can specify the ATR time frame to be different from your current time frame as well as the ATR length. For instance you could be on a 10 minute chart but specify the ATR to be daily with a length of 3 and a percentage amount of 15. This would make your brick size 15% of the Average True Range for the last 3 days. Recommended values are 10 to 20%.
Use this indicator on any time frame, even the 1 minute as the renko bands span the price action the same way on any time frame easily letting you know whether or not the price has moved appreciably, regardless of how much time has passed.
You can also set alerts easily, simply set the alert to crossing and choose “Renko Candlesticks” instead of “Value”. You will then see the options for the renko upper and lower bounds.
Tested on Bitcoin with the following values:
Fixed Price Amount: 30 ($30)
% of Price: 0.45 (if Bitcoin is $7000 then the brick size would be $31.50)
% of ATR: 15%, ATR Time Frame: 1D, ATR Length: 3 (3 days)

Combo Basic IndicatorsThe indicator consists of multiple time frame SMA and PSAR, the very basic indicator but could be profitable.
SMA can be used as dynamic Support-Resistant levels, and value of higher time frame are considered more significant (major level).
For example, Bitcoin currently has weekly support at 6568$, and regarding to SMA of lower time frame (Day, 4H,..) that are near then concluded as sideways condition.
However, trading opportunities still can be found for short term and tight range (scalping).

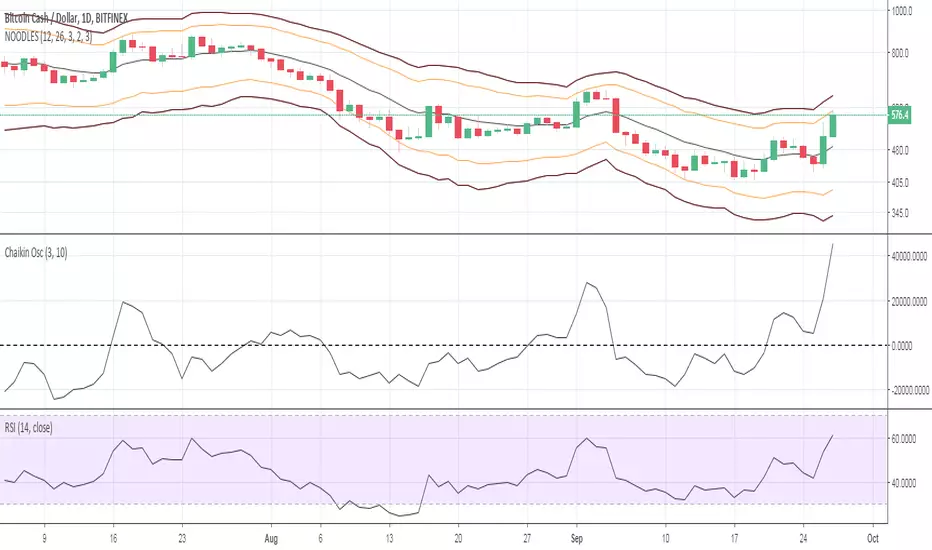
Noodles ema bands 12/26ema bands 12/26 for crypto trading, to find perfect support and resistance on each timeframe. 12/26 exponential moving average as you know is a perfect tool who working very well on bitcoin and others crypto. With this indicator now you have s/r too.
Simba Bitcoin MomentumMaybe the best to trade Bitcoin on 1D!
Do you want to use it?
You can get access for one week free, after that, the weekly rental costs are 0.1 BTC. When you dont pay accurate the weekly subscription, you will be removed.
Write me an email to simba_cfd@protonmail.com when you want access.

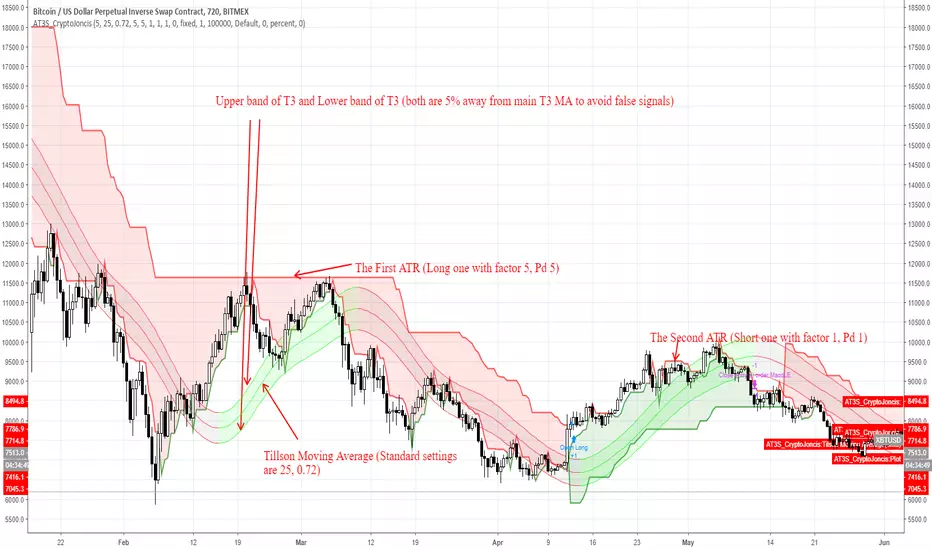
ATR and T3 strategyT3 Moving Average indicator was originally developed by Tim Tillson in 1998/99.
T3 Moving Average is considered as improved and better to traditional moving averages as it is smoother and performs better in trending market conditions.
It offers multiple opportunities when the price is in the state of retracement and therefore allows to minimize your exposed risk and allowing your profits run.
This strategy is for trend followers who are patient enough to have 6-10 trades per year.
What's included in strategy?
Two ATR (Code was taken from J.Dow and modified)
Tillson Moving average
Enter long signal:
When both ATR (Long and Short) are in uptrend and the bar closes above Upper Tillson's moving average band: Enter Long
Exit Long signal:
When hl2 is lower than Lower Tillson Moving Average band
Enter short signal:
When both ATR (Long and Short) are in downtrend and the bar closes below Lower Tillson's moving average band: Enter Short
Exit Shortsignal:
When hl2 is higher than Upper Tillson's Moving Average band
Best to use with Bitcoin on 12H TF
Can be used for different time frames as well but the settings must be adjusted accordingly
Remember, overtrading can be harmful to your trading account.
If this is helpful for you, consider a tip
BTC: 3FiBnveHo3YW6DSiPEmoCFCyCnsrWS3JBR
ETH: 0xac290B4A721f5ef75b0971F1102e01E1942A4578
Created by CryptoJoncis
Bithumb Ticker USD/BTC PairConverts Bithumb tickers into USD or bitcoin pairings from KRW.
This currently uses the FX pair to convert. There is an option to toggle between candlesticks and line.

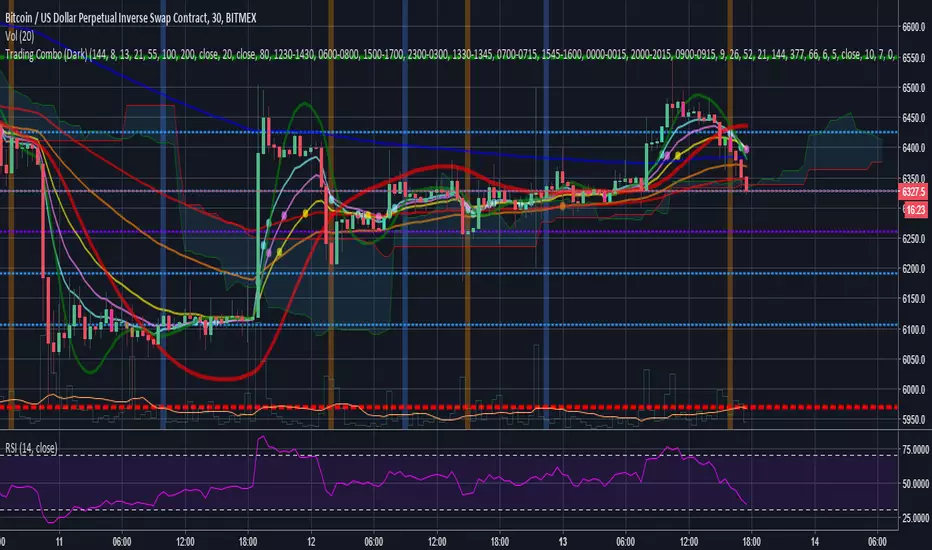
Trading Combo (Dark)This is a combo of many indicators including :
Ichimoku Cloud (With Buy and Sell Signals)
EMA
MA
HULL MA
Fibonacci Lines
Bitcoin 0.57% Kill Zones(Turned off by Default)
MA Turning Points
Reversal(Pin) Bars and Upshaved and Downshaved Bars(Inside and Outside Bars Disabled By default)
Credits to revanchdg for creating the script!
Credits for the source code go to:
Lazybear
ChrisMoody
100kiwi
Gesundheit
Updates:
- Removed all black colors so the script also works fine on the Dark theme
- Changed EMA9 to EMA8 and added EMA13
- Updated some labels for ease of configuration
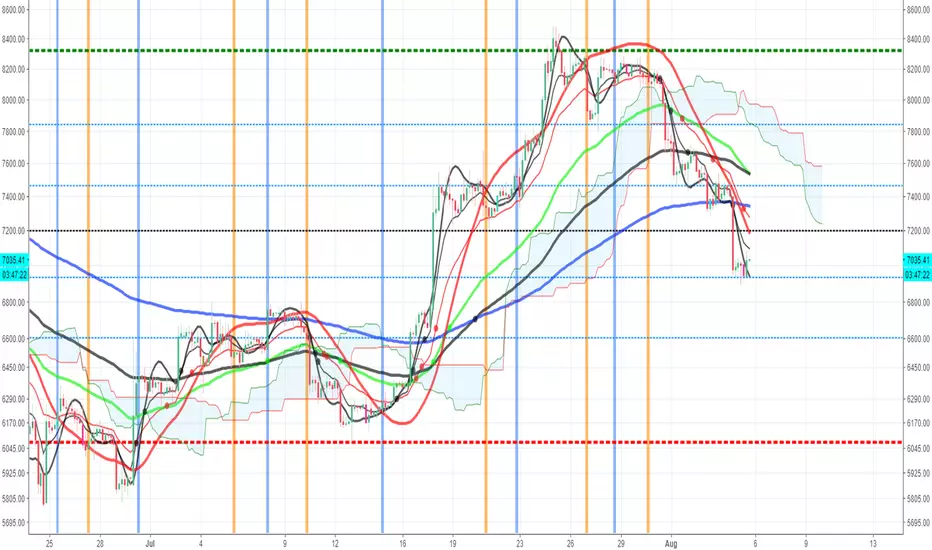
Trading ComboThis is a combo of many indicators including :
Ichimoku Cloud(With Buy and Sell Signals)
EMA
MA
HULL MA
Fibonacci Lines
Bitcoin Kill Zones(Turned off by Default)
MA Turning Points
Reversal(Pin) Bars and Upshaved and Downshaved Bars(Inside and Outside Bars Disabled By default)
Credits to for the source code:
Lazybear
ChrisMoody
100kiwi
Gesundheit
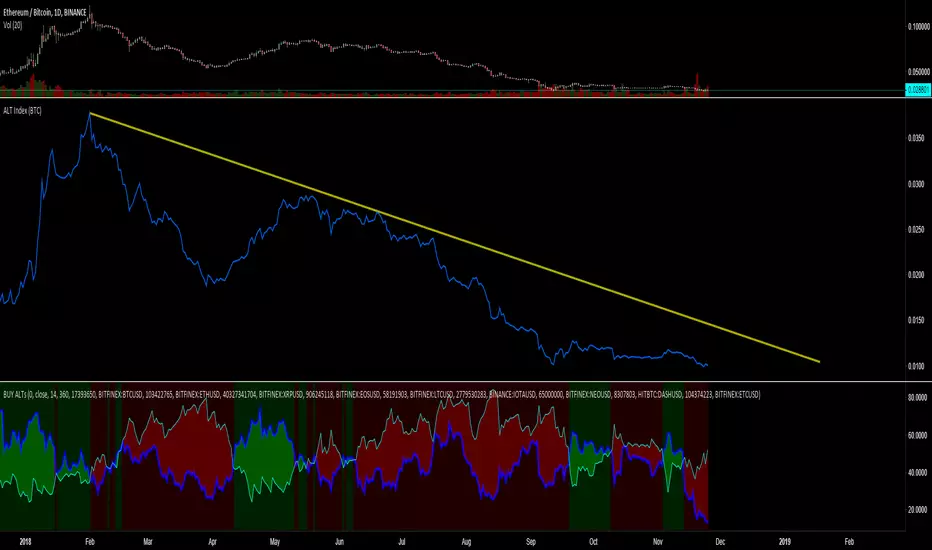
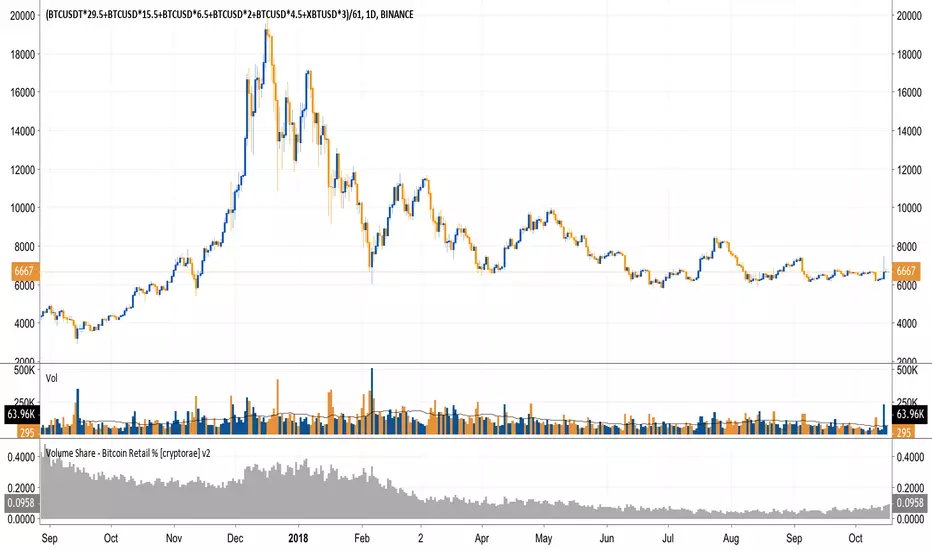
Volume Share - Bitcoin Retail % [cryptorae]I've been keeping my eyes on retail BTC trading volume as a % of total BTC trading volume (charted).
It's the single best chart showing the death of sentiment in this bear market. Retail fell to as low as 5.6% on 6/8. The good news is that the % has stabilized at these levels.
I think retail interest will need to trend higher in tandem with higher price moves for us to break through key resistance levels.
To know why, let's look closer at the anatomy of the recent bull and bear market.
In the 2017 bull market:
- Retail interest trended higher or sideways with each drive up
- Average retail volume share was ~46%
In other words, price movements were dominated by infusions of new money.
In the 2018 bear market:
- Retail interest trended LOWER with each recovery in price
- Average retail volume share was ~15%
In other words, price movements were dominated by money exchanging through the hands of traders.
Open thoughts:
- If the bear market persists and prices reach critical levels, I think that retail % would spike as some finally rush for the exit and new investors happily jump in
- If prices recover w/o a sustained increase in retail %, I'd not be so quick to call a bull market
Things I classify as "retail":
- Bitflyer
- Bithumb
- Coinbase
- Bistamp
- Kraken
Things classified as "non-retail"
- Bitmex
- Bitfinex
The formula is retail / (retail + non-retail)
The script is open for you to modify if you disagree. Let me know your thoughts/tweaks.
GBTC Premium to NAV IndicatorWhen bitcoin is in an uptrend, a very profitable strategy is to buy GBTC when premium to NAV is low, and sell when it reaches extremes. This can be far more profitable than buying bitcoin itself.
CryptoShadows V1The first Diagonal Support and Resistance indicator. Best for bitcoin and cryptocurrencies


Custom Time ranges
Description:
This script colours the background of any time range you specify, including weekend periods.
It can be useful for spotting patterns on Bitcoin (recurring times of buying or selling).
Checkboxes to switch on and off. Inputs to specify time and day of week.
Monday = 2
Tuesday = 3
Wednesday = 4
Thursday = 5
Friday = 6
Saturday = 7
Sunday = 1
Example 1:
1500-1800:2
This will colour the background between 3pm and 6pm on Mondays.
Example 2:
0000-0600:247
This will colour the background between midnight and 6am on Mondays, Wednesdays, and Saturdays.
Any questions you may have, please leave in comments below and I'll respond when I have time.

Estimate exchange/broker fee commission from trade volumeThis script is used to estimate how much an exchange/broker makes off a particular pair/symbol. If Coinbase(GDAX) has a 0.25% taker fee and a 0.15% maker fee per trade and you estimate the average commission fee at 0.19% then you simple input that, and how many periods you'd like to know the total fee for (30 periods on the 1 day chart = last 30 days, 28 periods on 4 hour chart = last 7 days, etc).
This is for broad estimates of a single pair and only works well on exchanges that show only the volume on that exchange (stock markets may be less useful for this tool).
THIS TOOL IS TO PROVIDE A BROAD ESTIMATE , NOT AN EXACT FIGURE!
// percentage fee rate is entered as a percent: 3.5=3.5%, not 350%.
// pbtc , the one for calculating the USD value of fees that are in bitcoin, uses the price at time fees were realized. IE chart is on
// 1 day interval and XBARFEE is set at 4, then PBTC gives the USD value as if the exchange sold all btc at the end of each day for
// 4 days. i.e.:
// Day 1: BTCUSD= $5000 fees=1.5, Day 2: BTCUSD = $5000 fees=3.0, Day 3 BTCUSD = $10,000 fees=1.0, Day 4 BTCUSD = $20,000 fees=1.0
// PBTC would NOT show (1.5+ 3 + 1 + 1) = 6.5 * $20k = $130,000. It would do: (1.5*5000)+(3*5000)... = $52,500.

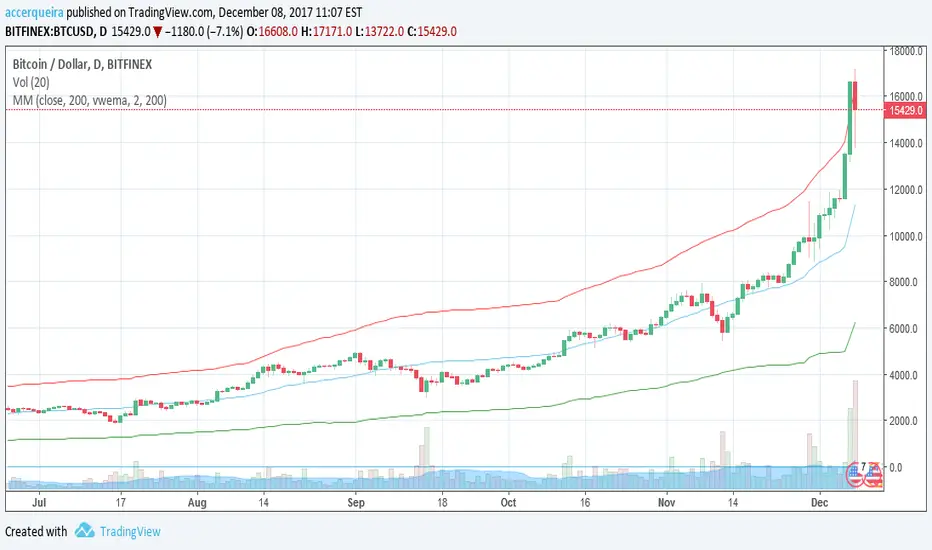
MayerMultiple StochasticThis is an stochastic chart of Price adjusted Mayer Multiple Average Delta.
Moving Average Function can be selected from a list with standard functions and following experimental extras:
- Volume Weighted Exponential Moving Average
- Volume Weighted Time Decayed Moving Average // similar to vwema, but alpha is calculated from length as half-life decay function (not sure if I got that right...)
Default MA function is sma, to keep it true to the original MM indicator, but I think VWEMA and VWTDMA may perform better with exponential nature of Bitcoin .
See also:
Suggestions and bug reports are welcome =)

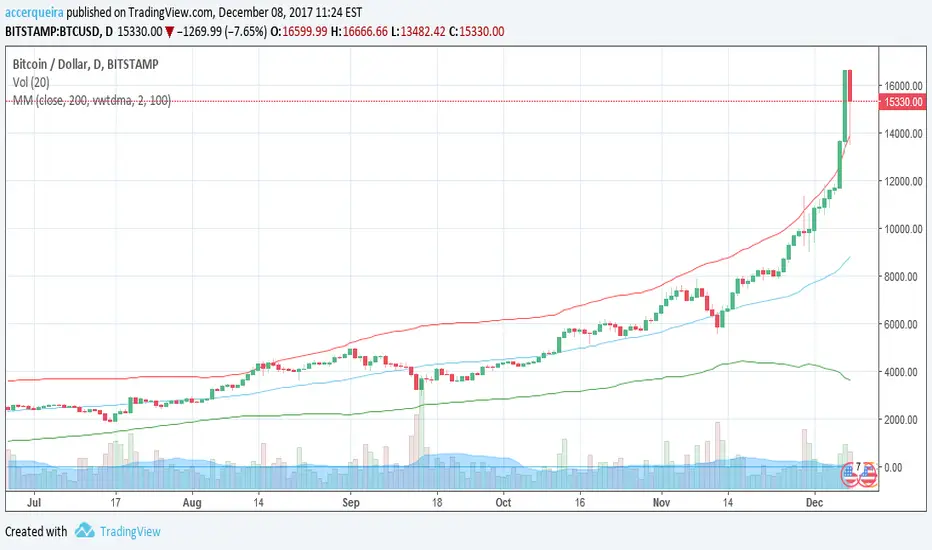
MayerMultiple Price BBThis charts an indicator created by Trace Mayer with some extras.
Plots:
- Mayer Multiple (may be hard to notice, since it overlays by default and stay at the bottom...)
- Price adjusted by Mayer Multiple Average with Bollinger Bands
Moving Average Function can be selected from a list with standard functions and following experimental extras:
- Volume Weighted Exponential Moving Average
- Volume Weighted Time Decayed Moving Average // similar to vwema, but alpha is calculated from length as half-life decay function (not sure if I got that right...)
Default MA function is sma, to keep it true to the original MM indicator, but I think VWEMA and VWTDMA may perform better with exponential nature of Bitcoin .
Suggestions and bug reports are welcome =)
MayerMultiple Price BBThis charts an indicator created by Trace Mayer with some extras.
Plots:
- Mayer Multiple
- Price adjusted by Mayer Multiple Average with Bollinger Bands
Moving Average Function can be selected from a list with standard functions and following experimental extras:
- Volume Weighted Exponential Moving Average
- Volume Weighted Time Decayed Moving Average // similar to vwema, but alpha is calculated from length as half-life decay function (not sure if I got that right...)
Default MA function is sma, to keep it true to the original MM indicator, but I think VWEMA and VWTDMA may perform better with exponential nature of Bitcoin .
Suggestions and bug reports are welcome =)