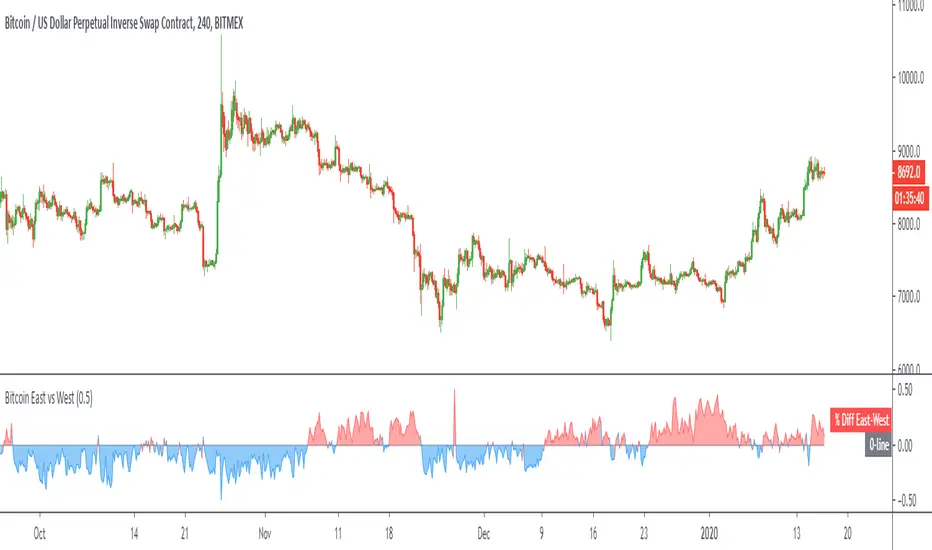
Bitcoin East vs WestPlots the volume weighted price difference between the top spot exchanges in the "East" (Asian markets) versus the "West" (US/UK/EU markets).
Optional: view the volume difference between the two.
Pesquisar nos scripts por "bitcoin"
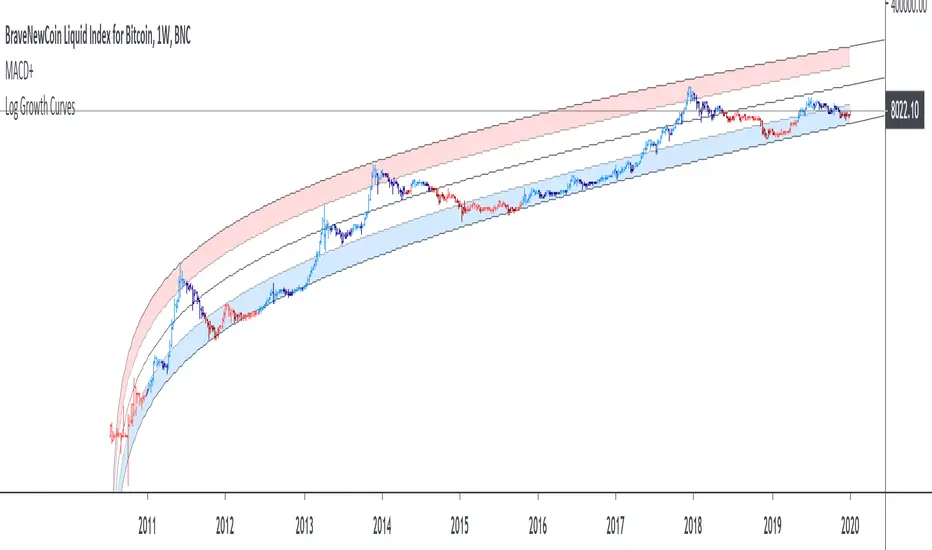
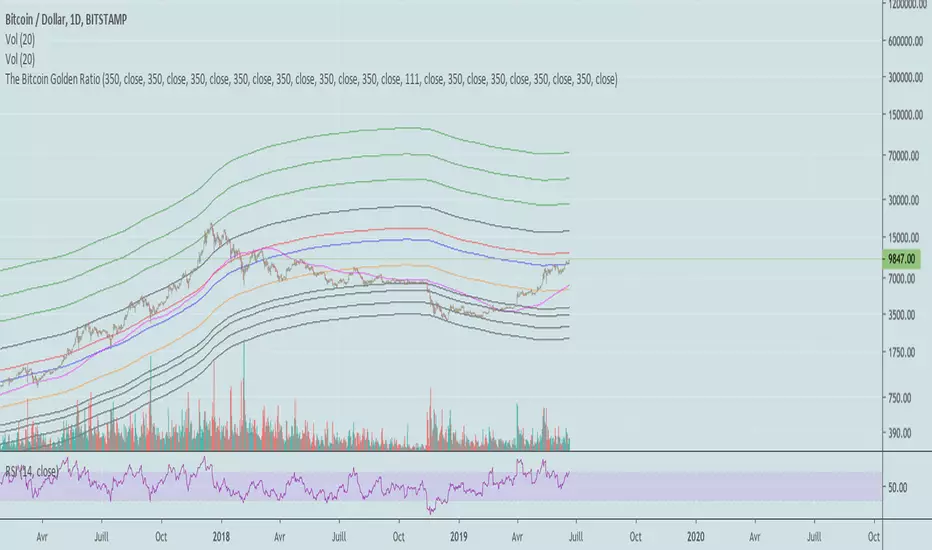
Bitcoin Logarithmic Growth CurvesThis is a version of the Log Growth Curves previously published by Quantadelic. The update includes customizable fib levels and filled upper and lower bands. This script is only intended for the Bitcoin log chart to reflect the channel that can be found on a log/log Bitcoin chart. The projections out from current levels are theoretical path of BTC based on the current trajectory.
In theory, reaching into the bottom zone of this chart is a good zone for accumulation while the top zone is a good are for distribution.
Bitcoin ASIC Cost [Tainoko]This indicator shows the break-even price of ASIC BTC mining.
The data can be customized, but the following four models are set as standard.
Antminer S9i
Antminer S15
Antminer S17
Antminer S17+

Bitcoin CoP - OverlayA good estimate of what it would cost in electricity to mine 1 whole bitcoin with your preferred mining equipment. The overlay allows to change a few ASIC related variables like hash rate, device wattage, and electrical cost by KW/h. Defaults are set for the Antminer S17 Pro, which hashes at 53 Th/s and consumes 2.1 KW at 7.5 cents a KW/h. The overlay also considers halvings and plots CoP in those events.
Note that this overlay does not include other business related costs like building lease, labor, or cooling.
The graph below shows CoP of three machines at 7.5 cents a KW/h
Antminer S7 4.74 Th/s 1.3 KW
Antminer S9 16 Th/s 1.28 KW
Antminer s17 Pro 53 Th/s 2.1 KW

Bitcoin Volume from Biggest Exchanges TogetherEnglish description:
With this script you can see BTC to Fiat/Stable/Contracts together on one volume chart:
- Fiat exchanges: Bitfinex, Coinbase, Bitstamp, Kraken, Gemini, Bittrex
- Stable coins exchanges (USDT for now): Binance, Poloniex, Bitterx
- Contract exchange: Bitmex
Polish description:
Dzięki temu skryptowi możesz wyświetlić na jedym wykresie wolumen BTC do Fiato/Stable coinów/Kontraktów:
- Giełdy z parami do walut fiducjarnych/Fiat: Bitfinex, Coinbase, Bitsamp, Kraken, Gemini, Bittrex
- Giełdy z parą do Stable-coinów(USDT): Binance, Poloniex, Bittrex
- Giełda z kontraktami terminowymi: Bitmex

True Trend BTC (Conquer Trading & Investing)Bitcoin tends to really trend for long period of times, whether it’s up or down. It’s a trending asset because it’s a new asset, full of price discovery.
I really hope this indicator is instrumental in your Bitcoin trading, it really does an outstanding job in defining the trend and helping you stay with it.

Bitcoin entry pointSimple script implementing lookintobitcoin dot com/charts/Bitcoin-Investor-Tool/
There are alerts available

Bitcoin Network Value to Transactions [aamonkey]Cryptoassets have been quite turbulent in the past few weeks.
At times like this, it is especially important to look at the fundamental foundations of cryptoassets.
This indicator is based on the Network Value to Transactions , or NVT .
Definition:
NVT = Network Value / Daily Transaction Volume
Because this indicator is pulling the Daily Transaction Volume for BTC it can only be used for BTC and the daily timeframe.

Bitcoin Heat MapHeat Map for directional Change based on Bitcoin hedging activity. Blue = Buy the dips. Red = Sell the rips. Wait 3 bars for confirmation on color change.

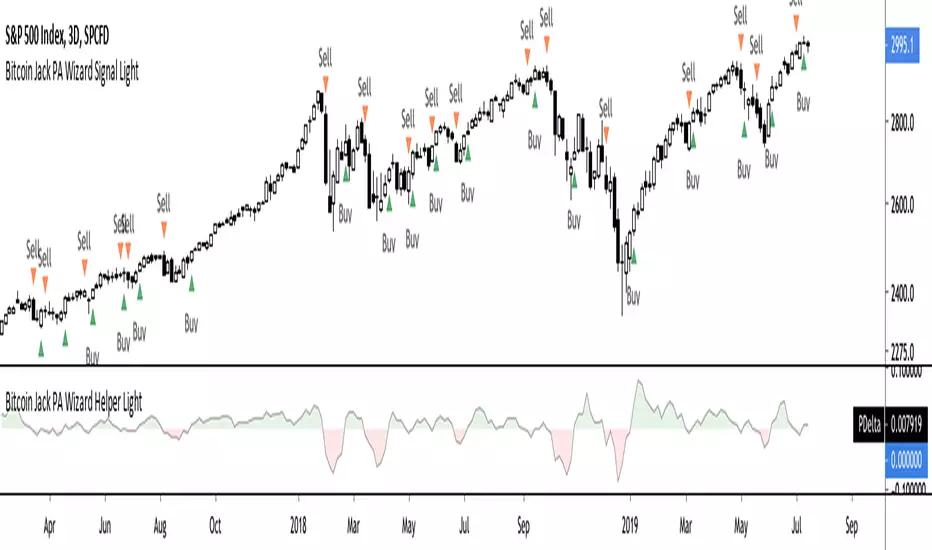
Bitcoin Jack PA Wizard Helper LightThis is the visual helper for the Bitcoin Jack PA Wizard light version.
Light version supports:
- 4H, D and 3D timeframes. Nothing will be shown on different timeframes.
- Fixed pre-configured settings.
Instructions:
- For assets with unreliable volume data or missing volume data, turn off the "Volume adjusted" setting in the settings menu, otherwise nothing will be displayed.
- PDelta > 0 = bulls are in charge
- PDelta < 0 = bears are in charge
- PDelta near 0 = balance between bulls and bears
This indicator is not for sale & will be occasionally given away in Twitter give-aways.

Bitcoin Jack PA Wizard Signal LightThis is the light version of the Bitcoin Jack PA Wizard signal overlay.
This algorithm will signal sells if it believes bears are in charge and buys if it believes the opposite.
Light version:
- Support for 4H, D and 3D timeframes. You will not see any signals on other timeframes.
- Fixed configuration for each timeframe, non adjustable.
Accompanying this overlay, there is a helper indicator, visually showing the strength of bears / bulls.
This indicator is not for sale & will be given away to randomly selected winners of occasional Twitter give-aways.
Bitcoin Golden RatioGives the top and bottom of the cryptocurrencies cycles.
When DMA111 crosses DMA350*2, the top is in.
Show accumulation phases and resistances with very precise accuracy.
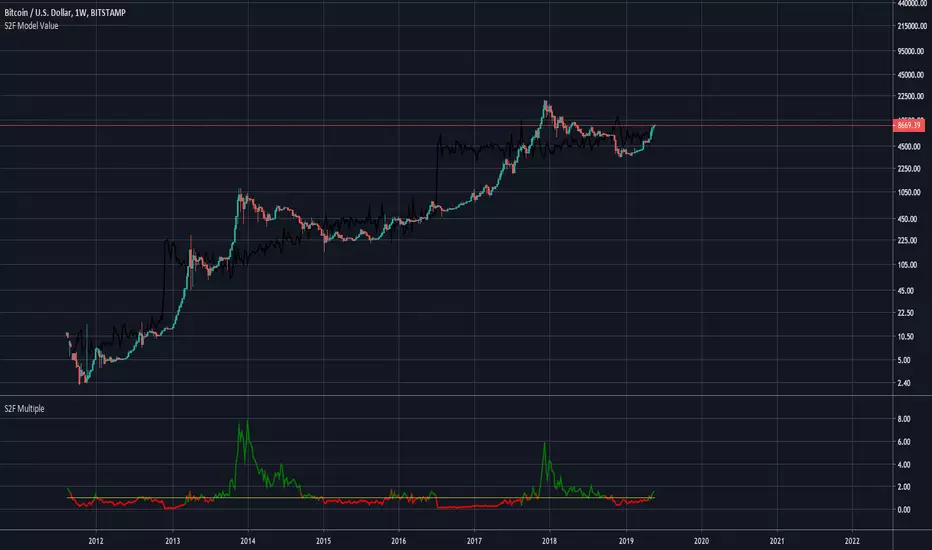
Bitcoin Stock to Flow Multiple (fixed)This is a fixed version of the original script by yomofoV:
I fixed the variable assignments and added switching of timeframes over indicator inputs.
To switch timeframes click on the indicator, open its settings and switch the timeframe to either monthly, weekly or daily.
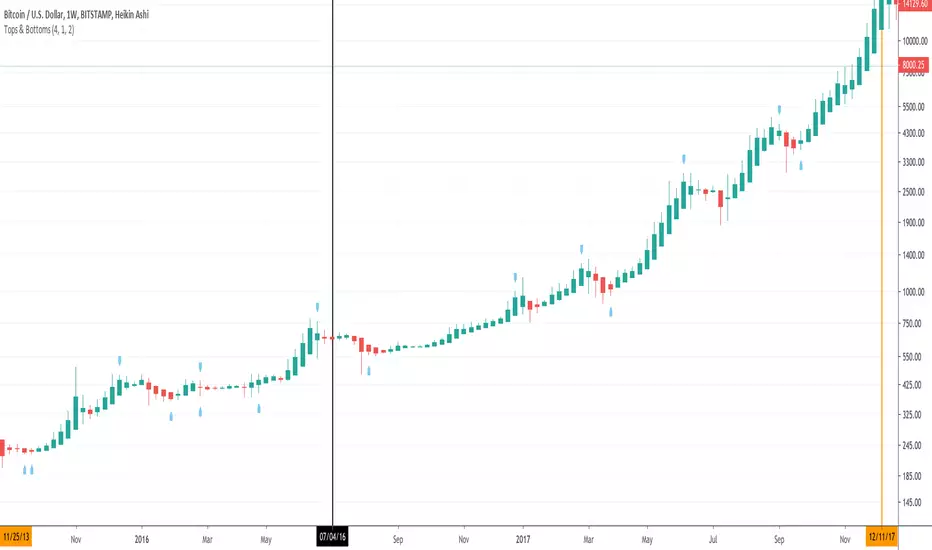
Bitcoin Peaks & ValleysTimes Tops & Bottoms of Bitcoin
-use with 1 week HA candles
-predicted the 2018 top
-very straightforward
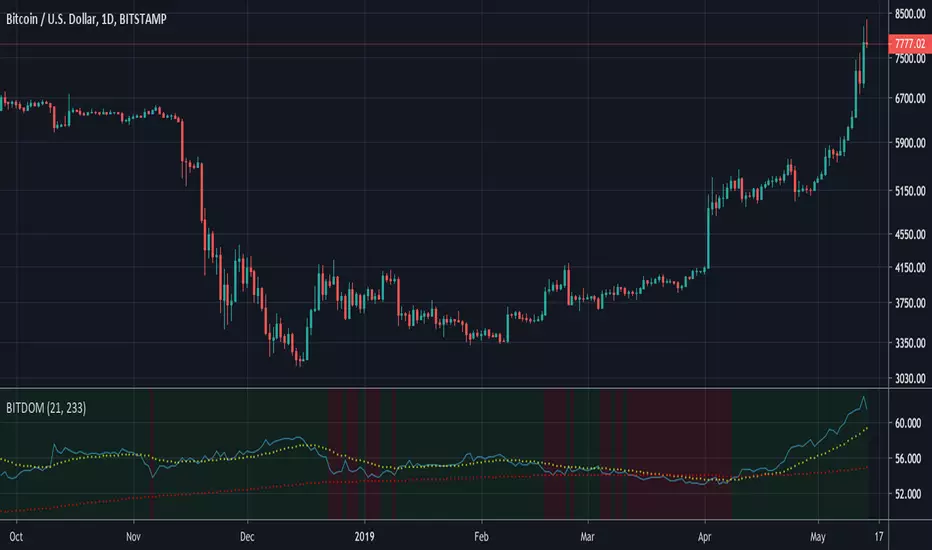
Bitcoin DominanceA simple indicator which shows the percentage of bitcoin dominance.
Data sourced from Cryptocap charts: TOTAL and TOTAL2
Cyan = bitcoin dominance%
Yellow = 21 EMA
Red = 233 EMA
BG = red when dominance is below the average of the EMAs and green when above.
Bitcoin COTBased on BennettStein's Bitcoin COT (CME) indicator, this adds 7 day ema and average up and down trend.
White = Institutional
Red = Retail
Cyan = Professional
Green = Average of Institutional, Retail, and Professional
Yellow = % open interest held by largest 4 longs
Purple = % open interest held by largest 4 shorts
Green/Red background = Directionality over time of Institutional, Retail, and Professional
DATA SOURCE: various Quandl feeds on trading view
// HOW TO INTERPRET: (from BennettStein's documentation) -- NOT FINANCIAL ADVICE
// 1. Trade in the same direction of institutional money.
// 2. Trade in the opposite direction of retail money.
// 3. Trade in the direction of professional money.
// 4. When %open interest held by largest 4 longs > %open interest held by largest 4 shorts = look to buy
// 5. When %open interest held by largest 4 shorts > %open interest held by largest 4 longs = look to sell

Bitcoin! RSI Chart Art - Color ChangingJust for fun:
Logo changes colors based on RSI level.
>=60 is one color, <=40 another color, or in the center it's gold by default.

Bitcoin Liquid Indexbravenewcoin.com
TV doesn't allow you to view the Bitcoin Liquid Index on lower time frames if you aren't a Premium subscriber >:(
I cheesed the system by recreating the formula that BNC uses. It isn't an exact replica, but very very close!
It can be slow to load due to the security( ) calls.
Default settings use the timeframe of the chart, however, you can set a custom timeframe if you wish.
Cheers
DasanC

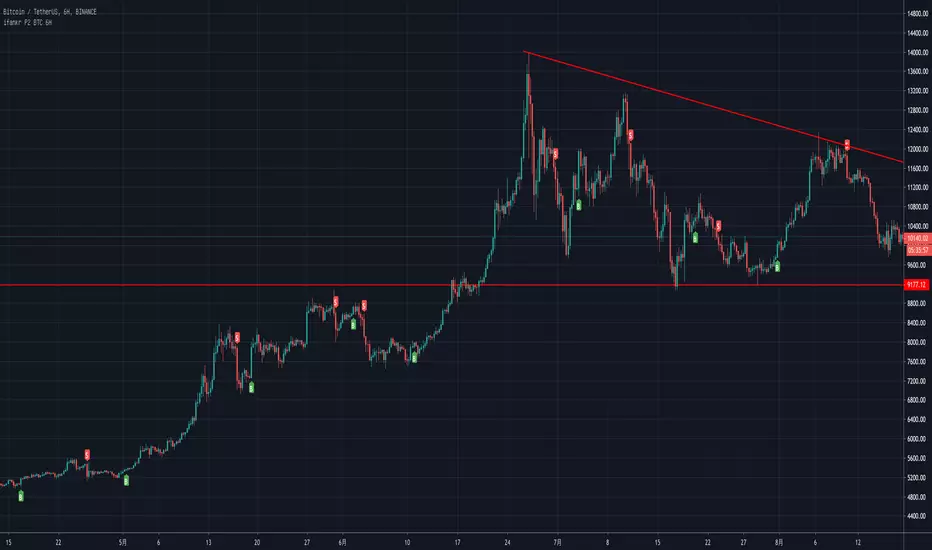
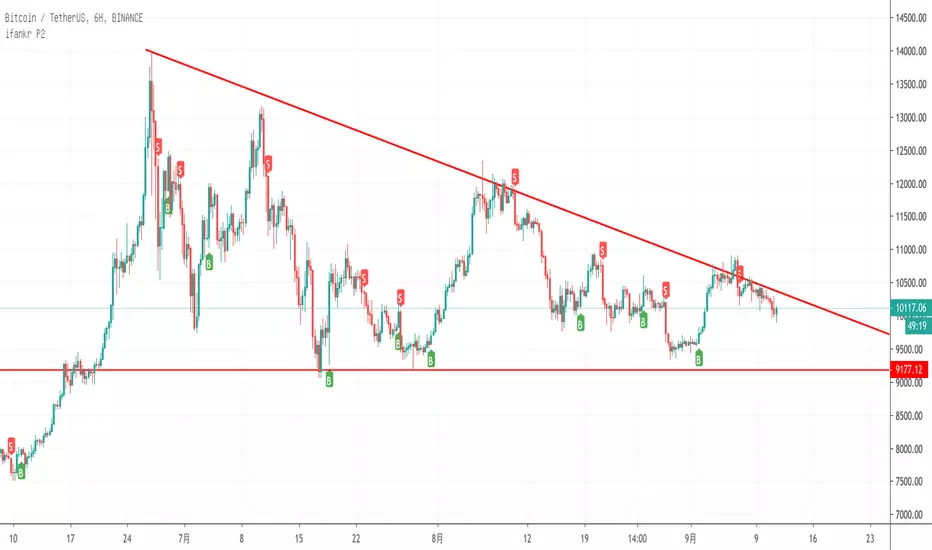
Bitcoin Buy & Sell Signal V3Mark Bitcoin Buy & Sell Signal on your chart.
You could also add alerts for those signals.

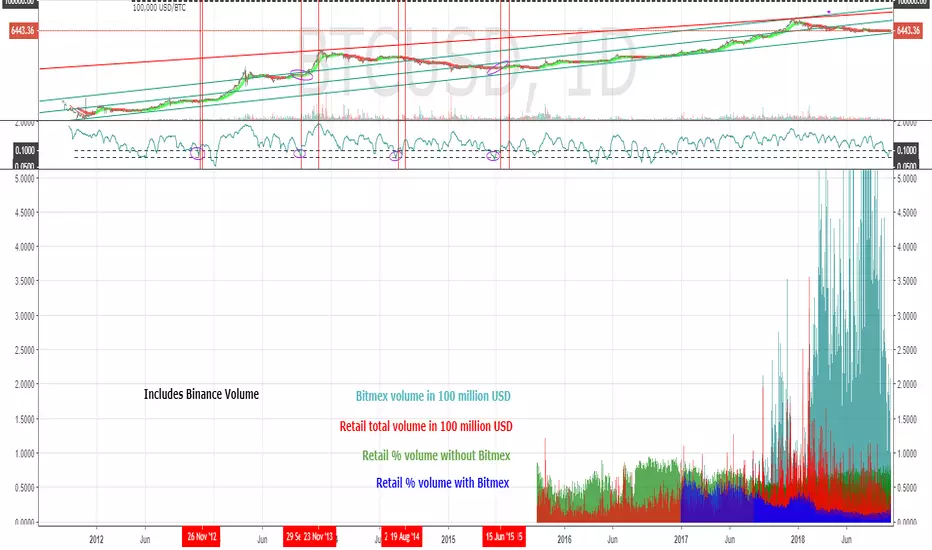
Bitcoin Retail Volume [jarederaj]Based on work published by @cryptorae
www.tradingview.com
Merges Binance volume into several metrics.
Bitcoin StableCoins Histogram -- @CryptoNTezThe script will let you see the histogram volume of TrueUSD -- USDTether -- USD or the combination of them.
The values are being pulled from all the available pairs in Tradingview. Once new pairs hit the site I will be adding them aswell
enjoy :)
