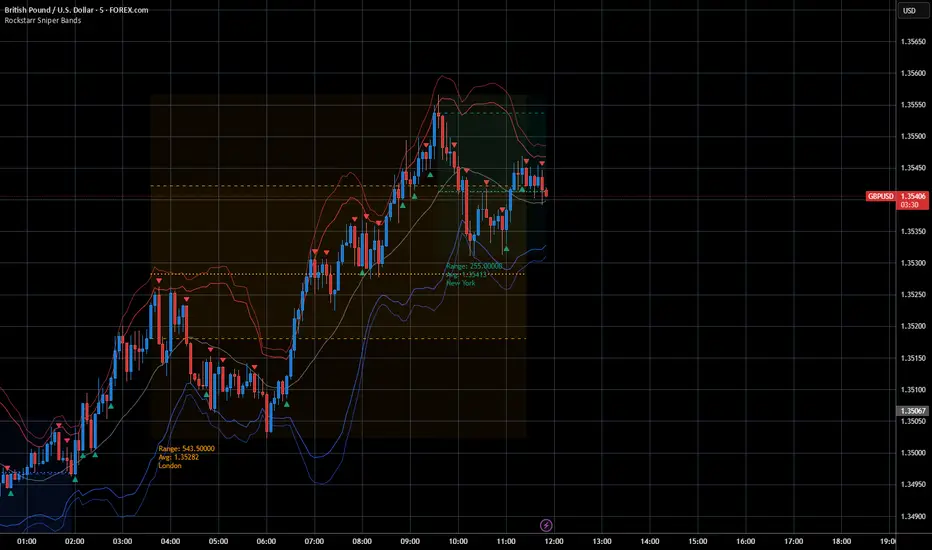
Session Sniper Bands — Pro Overlay (Bollinger, Sessions, Engulf)The Session Sniper Bands — Pro Overlay combines three powerful tools into one clean, professional script designed to help traders spot high-probability setups across any market.
📌 What’s included:
Dual Bollinger Bands → track volatility squeezes, expansions, and mean reversion zones.
Customizable Trading Sessions (Tokyo / London / New York) → shaded regions with editable names, open/close lines, range, and average price markers.
Engulfing Candlestick Signals → automatic bullish and bearish engulfing arrows for precision entry timing.
✨ Features:
Session names and times are fully customizable (rename “Tokyo” to “Asia Open,” etc.).
Clear OB/OS volatility cues via Bollinger stack.
Lightweight visuals that won’t clutter your chart.
Works across Forex, Crypto, Indices, and Binary Options.
⚡ Why use it?
This overlay is built for traders who want to snipe entries with session context. Spot when volatility contracts, align with session flows, and confirm with engulfing momentum candles — all in one view.
⚠️ Disclaimer: This script is for educational purposes only and is not financial advice. Always test on demo before trading live.
Pesquisar nos scripts por "binary option"
BTC/USD sainBTC/USD 30s Trend-Following Alert v2
Description
This script is designed for short-term trading on BTC/USD, especially for 30-second entries.
It combines EMA (trend direction) and RSI (momentum filter) to generate trend-following buy/sell alerts.
• Core logic
1. EMA (Exponential Moving Average) identifies the main market direction.
2. RSI (Relative Strength Index) checks overbought/oversold conditions within the short-term trend.
3. A signal appears only when both conditions align with the trend, filtering out weak entries.
• Entry conditions
・High (BUY): Price closes above EMA and RSI is above the high threshold → bullish continuation.
・Low (SELL): Price closes below EMA and RSI is below the low threshold → bearish continuation.
• Features
・Simple but effective trend-following method for very short timeframes.
・Customizable parameters: EMA length, RSI length, RSI thresholds.
・Clear chart labels (“HIGH” / “LOW”) with real-time alerts for automated or manual trading decisions.
• Usage
Apply on lower timeframes (e.g., 30s–1m) to catch quick trend continuations.
Signals can be used for scalping or binary options style entries.
• Disclaimer
This script does not guarantee profits. Always manage risk and combine with price action or additional confirmation tools.
M & W Checklistindicator to Validate & Grade M & W Patterns.
Indicator Inputs
Table Color Palette
• Position Valid : Positions the Valid Trade table on the chart.
• Position Grade : Positions the Grade table on the chart, hover over the Column 1 Row 1 for a description of the bands.
• Size: Text size for all tables.
• Text Color : Sets text color.
• Border Color : Sets the table border color for all tables.
• Background Color : Sets table backgroud color for all tables.
Valid Trade Table
Checkboxes to indicate if the trade is valid. Fail is displayed if unchecked, Pass if checked.
Grade Table
• S/R Level 1: distance between neckline and 1st resistance area in % of the total distance between neckline and take profit. This is not for road blocks but pivot points etc before the initial run up/down in price. I have this set to 30% , this means that if there is a pivot point between the neckline and 30% of the TP level I weight it negatively.
• S/R Level 2: distance between neckline and 1st resistance area in % of the total distance between neckline and take profit. This is not for road blocks but pivot points etc before the initial run up/down in price. I have this set to 50% , this means that if there is a pivot point between the neckline and 50% of the TP level 2 weight it negatively but less so than level 1.
• S/R Level 3: distance between neckline and 1st resistance area in % of the total distance between neckline and take profit. This is not for road blocks but pivot points etc before the initial run up/down in price. I have this set to 70% , this means that if there is a pivot point between the neckline and 70% of the TP level 3 weight it negatively but less so than level 1 & level 2.
• Checkboxes are self explanatory, they are binary options, all are weighted negatively if checked and are weighted positively if unchecked. Divergence values for weighting are neutral if unckecked & weighted positively if checked.
• The select options are neutral weighting if set to neutral , if set to For its weighted positive and set to Against weighted negatively.
Technical Specification of the Scoring and Band System
Overview
The scoring system is designed to evaluate a set of technical trade conditions, assigning weights to various criteria that influence the quality of the trade. The system calculates a total score based on both positive and negative conditions. Based on the final score, the system assigns a grade or band (A, B, or C) for positive scores, and a "Negative" label for negative scores.
Scoring System
The system calculates the score by evaluating a set of 12 conditions (gradeCondition1 to gradeCondition12). These conditions are manually input by the user via checkboxes or dropdowns in a technical indicator (written in Pine Script for TradingView). The score weights vary according to the relative importance of each condition.
Condition Breakdown and Weighting:
1. Divergences (GradeCondition1 & GradeCondition2):
◦ 1H Divergence: +5 points if condition is true.
◦ 4H Divergence: +10 points if condition is true (stronger weight than 1H).
2. Support/Resistance at Neckline (GradeCondition3):
◦ Negative if present: -15 points if true (carries significant negative weight).
3. RB near Entry (GradeCondition4):
◦ Very Negative: -20 points if true (this is a critical negative condition).
4. RB can Manage (GradeCondition5):
◦ Slightly Negative: -5 points if true.
5. Institutional Value Zones (GradeCondition6 to GradeCondition8):
◦ For the trade: +5 points.
◦ Against the trade: -5 points.
◦ Neutral: 0 points.
6. S/R between Neckline & Targets (GradeCondition9 to GradeCondition11):
◦ Level 1: -10 points if true, +7 points if false.
◦ Level 2: -7 points if true, +7 points if false.
◦ Level 3: -5 points if true, +7 points if false.
◦ Use fib tool or Gann Box to measure any S/R levels setup according to your preferences.
7. News Timing (GradeCondition12):
◦ News within 3 hours: -20 points if true (strong negative factor).
◦ No upcoming news: +10 points if false.
Scoring Calculation Formula:
totalScore = score1 + score2 + score3 + score4 + score5 + score6 + score7 + score8 + score9 + score10 + score11 + score12
Where:
• score1 to score12 represent the points derived from the conditions described above.
Coloring and Visual Feedback:
• Positive Scores: Displayed in green.
• Negative Scores: Displayed in red.
Band System
The Band System classifies the total score into different grades, depending on the final value of totalScore. This classification provides an intuitive ranking for trades, helping users quickly assess trade quality.
Band Classification:
• Band A: If the totalScore is 41 or more.
◦ Represents a highly favorable trade setup.
• Band B: If the totalScore is between 21 and 40.
◦ Represents a favorable trade setup with good potential.
• Band C: If the totalScore is between 1 and 20.
◦ Represents a trade setup that is acceptable but may have risks.
• Negative: If the totalScore is 0 or less.
◦ Represents a poor trade setup with significant risks or unfavorable conditions.
Band Calculation Logic (in Pine Script):
var string grade = ""
if (totalScore >= 41)
grade := "Band A"
else if (totalScore >= 21)
grade := "Band B"
else if (totalScore >= 1)
grade := "Band C"
else
grade := "Negative"
Technical Key Points:
• Highly Negative Conditions:
◦ The system penalizes certain conditions more heavily, especially those that suggest significant risks (e.g., News in less than 3 hours, RB near Entry).
• Positive Trade Conditions:
◦ Divergences, Institutional Value Zones in favor of the trade, and lack of significant nearby resistance all contribute positively to the score.
• Flexible System:
◦ The system can be adapted or fine-tuned by adjusting the weights of individual conditions according to trading preferences.
Use Case Example:
• If a trade has 1H and 4H Divergence, RB near Entry (negative), and no upcoming news:
◦ 1H Divergence: +5 points.
◦ 4H Divergence: +10 points.
◦ RB near Entry: -20 points.
◦ No news: +10 points.
◦ Total Score: 5 + 10 - 20 + 10 = 5 → Band C.
This modular and flexible scoring system allows traders to systematically evaluate trades and quickly gauge the trade's potential based on technical indicators
Summary:
Maximum Score: 61
Minimum Score: -97
These are the bounds of the score range based on the current logic of the script.

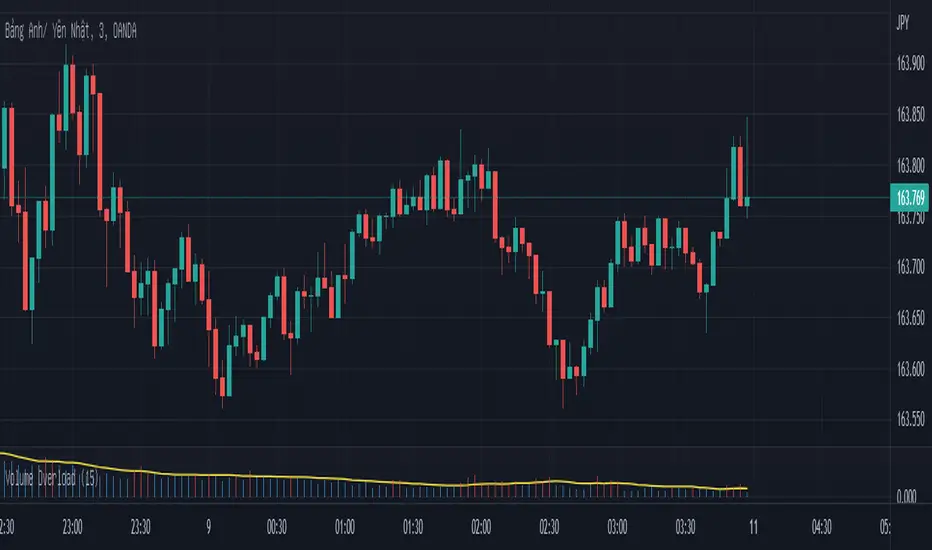
Overloaded Volume-Canddle v1This indicator will detect the candle has volume "too strong" base on "n" previous candle.
The Yellow Line is avg volume base n candle previous.
The Red line show over power volume of canlde.
Important : This indicator can use for forex, but i recommend it for binary options only.
The GM Slip Signals - VIP Revactory - Public SignalsThe GM Slip Signals,
The GM Slip is a signal that uses the strategy based on Candlestick Formation.
This is the pattern formula of GM Slip signals :
1. BASIC SLIP STRATEGY,
- Bullish Basic Slip Pattern : ((BULLISH CANDLE) - (BULLISH CANDLE) - (BEARISH CANDLE) - (BULLISH CANDLE)) = BUY
- Bearish Basic Slip Pattern : ((BEARISH CANDLE) - (BEARISH CANDLE) - (BULLISH CANDLE) - (BEARISH CANDLE)) = SELL
2. COMBINATION SLIP STRATEGY,
- Bullish Combination Slip Pattern : ((BULLISH CANDLE) - (BULLISH CANDLE) - (BEARISH CANDLE) - (BULLISH OUTSIDEBAR CLOSE > UPPER BOLLINGER BANDS )) = BUY
- Bearish Combination Slip Pattern : ((BEARISH CANDLE) - (BEARISH CANDLE) - (BULLISH CANDLE) - (BEARISH OUTSIDEBAR CLOSE < LOWER BOLLINGER BANDS )) = SELL
// ----------- Add-ons Setting ----------- //
Setting for Basic Slip Strategy for Signals :
// ----------- Add-ons Setting ----------- //
Setting for Combination Slip Strategy for Signals :
--------
Recommendations Formula Entry for Binary Options,
// Formula : Timeframe X 1 = Expiration Entry
Ex,
Timeframe : M1 X 1 = 1 Minute
Timeframe : M5 X 1 = 5 Minute
Timeframe : M15 X 1 = 15 Minute
Etc.
--------
Signal Instructions,
1. Diamond BUY / SELL Arrow : PREPARATION SIGNAL
2. Highlight Line Arrow : OPEN POSITION SIGNAL
3. If lose, automatically will be appear "Highlight Line Arrow" on next bar for open position level 1 martingale
--------
Regards Profit Digdaya,
- VIP Revactory Indonesia
--------
DISCLAIMER: No sharing, copying, reselling, modifying, or any other forms of use are authorized for our documents, script / strategy, and the information published with them. This informational planning script / strategy is strictly for individual use and educational purposes only. This is not financial or investment advice. Investments are always made at your own risk and are based on your personal judgement. I am not responsible for any losses you may incur. Please invest wisely.*

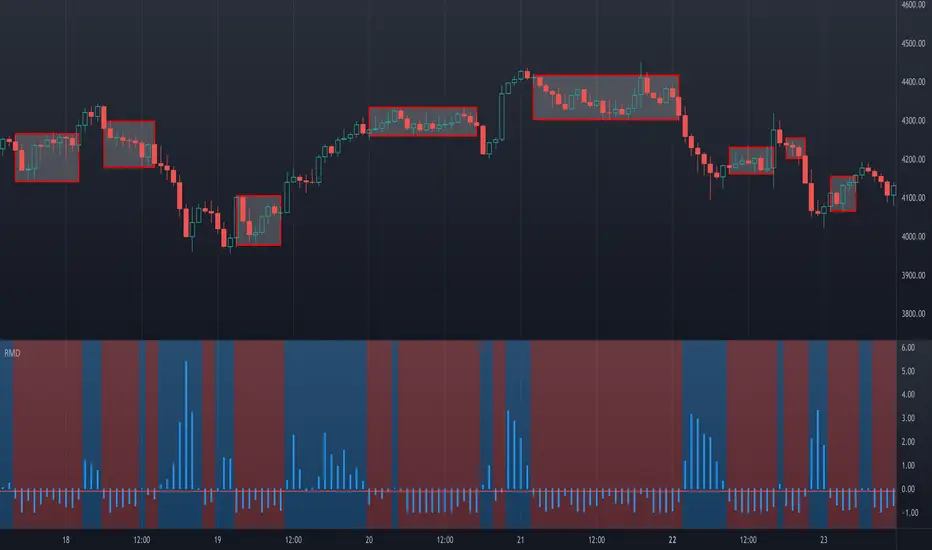
Ranging Market Detector [AstrideUnicorn]Determining if the market is in a trend or a range regime is a very complex problem. And knowing the answer can be, in some situations, the real holy grail. If the trader knows when the market is in a range regime, they can avoid overtrading and make moving average crossover strategies more profitable. A regime switch from a trend to a range can be a signal to close open positions. It can also be helpful when trading such instruments as short-term binary options. When the market is ranging directional moves are not expected, and the trader should be careful as opening a position in such conditions is, by some degree, a random outcome game. Range breakouts trading is one more example when knowing the market regime is critical.
We have created an indicator that predicts the current market regime. It smooths the price using the Kalman filter and analyzes the curve's slope. If the absolute value of the slope is low, then the market is in range mode and vice versa. To distinguish between the two regimes, the algorithm compares the absolute value of the slope with its long-term average.
HOW TO USE
The indicator shows the difference between the absolute slope value and its long-term average as a histogram. When a bar of the histogram is higher than the threshold level presented by the red line, the market is in a trending regime. In this regime, the background of the indicator is blue. When the market is in a range regime, the indicator background turns red.
The threshold level helps to control the lag. The greater it is, the more lagging the indicator will be. By default, this value is set to a negative value. It means that the indicator switches from range to trend a little bit earlier than the slope gets higher than the average slope. You can use the value of zero or low negative values to find the optimal tradeoff between the strength of the signals and their lag.
SETTINGS
The indicator has one input parameter called Threshold. It sets the threshold level described above. Its value should be close to zero. The less the value is, the less is the indicator's lag, but at the same time, the less confirmed the regime-switching signals are.
The use cases can be very different. And as the code is open, you can also use the indicator as a building block for your custom trading strategies.
Let us know your thoughts and suggestions!
Multi-TimeFrame SignalsI trade binary options on reversals. I use this as a confluence to prove that my analysis is correct. I use this on smaller time frames given the type of trading I do.
I do not use this as an entry trigger, so you should not blindly enter trades based on this solely . You were warned
This indicator (on default settings) will let you know when the 1 minute, 3 minute, and 5 minute timeframes RSI & Stochastics are all in an overbought or oversold state. It shows this by changing the background color on your chart to red (overbought) or green (oversold).
All of these settings are changeable. #winning
I left this as open-source as I figured out how to code this by using other open-source scripts as reference. I am a programmer that uses other languages.
I only published this script as a request from a close friend.

Money Heist• This strategy is based off of Matthew Thayers Cashtrap Strategy.
• Market Timing markers based off of Evan Cabrals Market Timing Strategy.
• Psychological Support and Resistance Levels as well as 4 Hour High and Low Support and Resistance Levels.
• The Bollinger Bands will turn Red for Resistance and Green for Support when the Market is Consolidating. The bands will turn Red at the Bottom and Green at the Top when the Market is in a Heavy Trend.
• There is a 50 ema and 200 ema used to determine the trend of price and can also be used as support and resistance
• Two types of arrows can be used by heading to the settings and choosing one or the other. Either Conditional arrows based on a point system (3 being the highest) can be used or Regular CashTrap Arrows. Arrows should be used to confirm trade not as a the only reason to take a trade
PUT
Price should be below 50 EMA and 200EMA touching Top Red Bollinger Band at a Resistance level
CALL
Price should be above 50 EMA and 200EMA touching Bottom Green Bollinger Band at a Support Level
**This Strategy Is To Be Used With The Momentum RSI, Stochastic+, and RSI+**

QQE-CCI Hello guys;
This indicator is a simple combination of two oscillators "Quantitative Qualitative Estimation Signals"(based on RSI) and "Commodity Channel Index".
To summarize, the method of signaling from this indicator is that by observing the "Long" signal and CCI cross with the midline upwards simultaneously, we open the buy position; and if we see the "Short" signal and CCI cross with the midline down at the same time, we open a sell position.
I have designed this indicator for use in Binary options; 70% of the trades I have made based on this indicator signals have been successful.
I put my telegram ID here incase if U need, txt me :)
@QQECCi

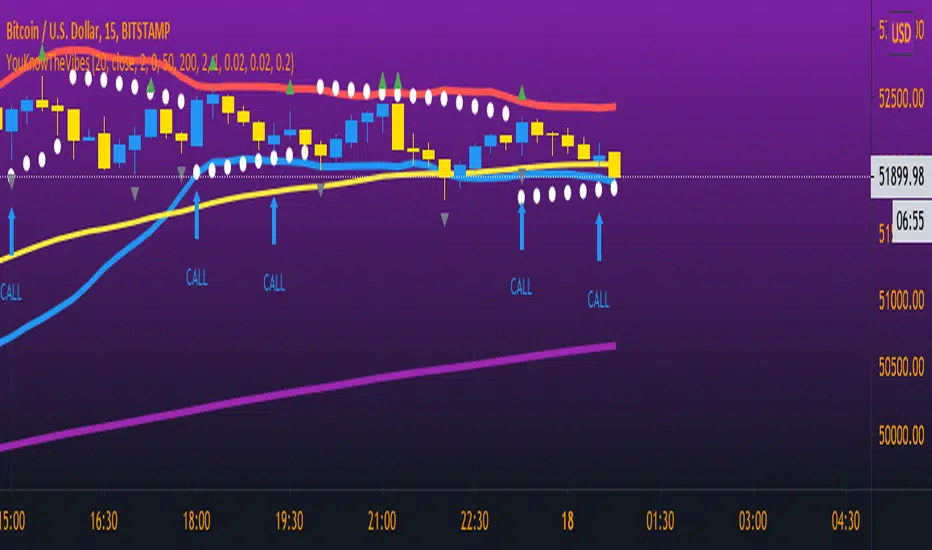
YouKnowTheVibesThis is mainly used for trading binary options but can be used for regular forex trading as well. If price is above BOTH EMAs and PSAR then you're looking for BUY opportunities. If price is below then you're looking for sell opportunities. Wait for price to break the most recent fractal high/low and retest; wait for a confirmation candle then enter a call/put and the expiry time is THREE candles.
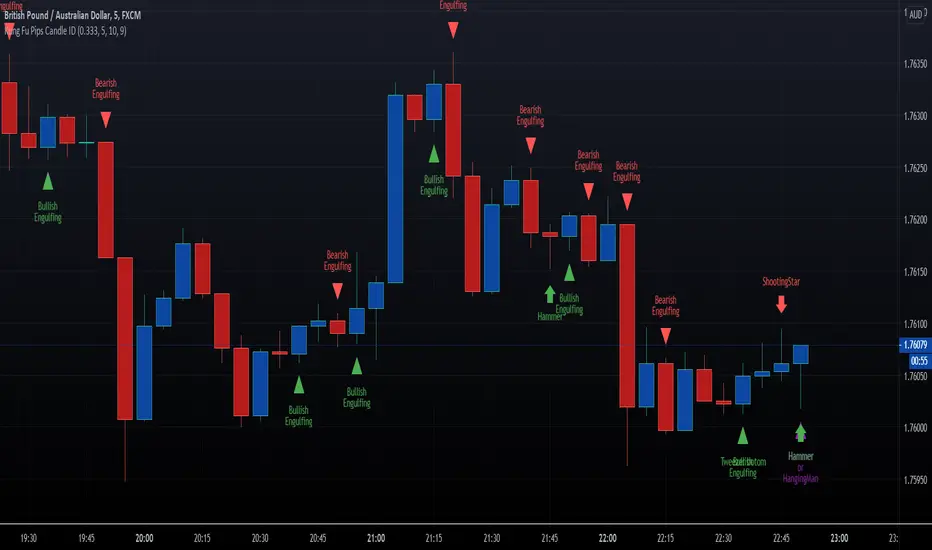
HFX Kung Fu Pips Candlestick Identifier by Trader ZThis indicator identifies the following candle stick patterns:
Bullish and Bearish Engulfing
Hammer/Hanging Man, Shooting Star
Tweezer Tops and Bottoms
Doji Star
Doji Gravestone
Made for trading Forex Binary Options but can be used in any market. When the candlestick pattern emerges the script will label the pattern. A helpful visual tool for your analysis.
Enjoy!!!!
Evan Cabral's Quarter Theory by MrTuanDoanThis indicator is based on Evan Cabral's Market Timing Strategy.
In Binary Option or High Frequency Forex (HFX), it's very common to see the market make reversals at hours and half hours.
This indicator just simply draw vertical lines at each quarter of the hour.
You should change the color and opacity to fit your chart style.
With this indicator, you're going to know when to positions yourself with more accuracy on trade setups.
Note
It works best if you take your reversal trade at the top of the hour using your other (overbought/oversold) confirmation using RSI, Stoch RSI, DMI, etc.
It works better if you take your trade at resistance/support zones
You should pay attention to the direction the market is going before the hour (or half hour) and looking at how the direction changes going into the hour or after it.
Please backtest before taking real trades

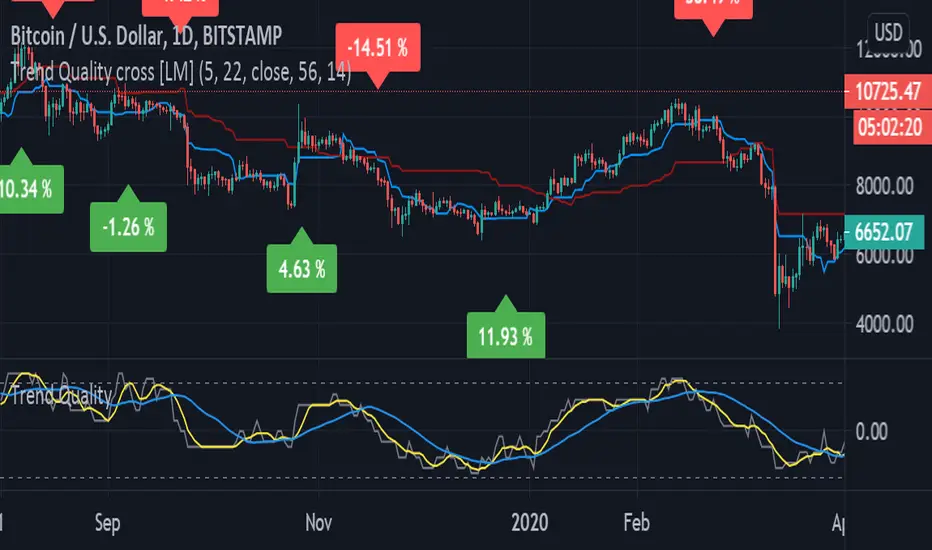
Trend Quality cross [LM]Hi Guys,
I would like to introduce you Trend quality cross indicator. The idea orginallybcomes from @kruskakli and his indicator "Trend Quality" so shout-out to him
I have modified the indicator to display just binary option buy/sell and display diff percentage from previous cross. Also there is a difference that I have double smoothed tq indicator results to give less false signals.
and also added for the same reason like in my other indicator vpci ma cross base line and conversion line from ichimoku.
Any suggestions are welcomed
Williams Fractals with Alerts by MrTuanDoanCustom William Fractals for alerts and educational purpose.
Added custom alerts for Williams Fractals.
Also added filter to show less fractals on chart.
The simple idea how I use fractals in Binary Option is to determine temporary resistance and support.
Simple strategy:
- Mark Resistance/Support on higher time frame (e.g. 5M)
- Set an alert for new fractal
- Whenever a new fractal that appears close to your marked Resistance/Support, go to lower time frame (e.g. 1M)
- Wait for rejection at the level that lower than new down fractal (or higher than new up fractal).
- Enter with the same expiry of lower time frame.
Good luck and happy trading. :-)

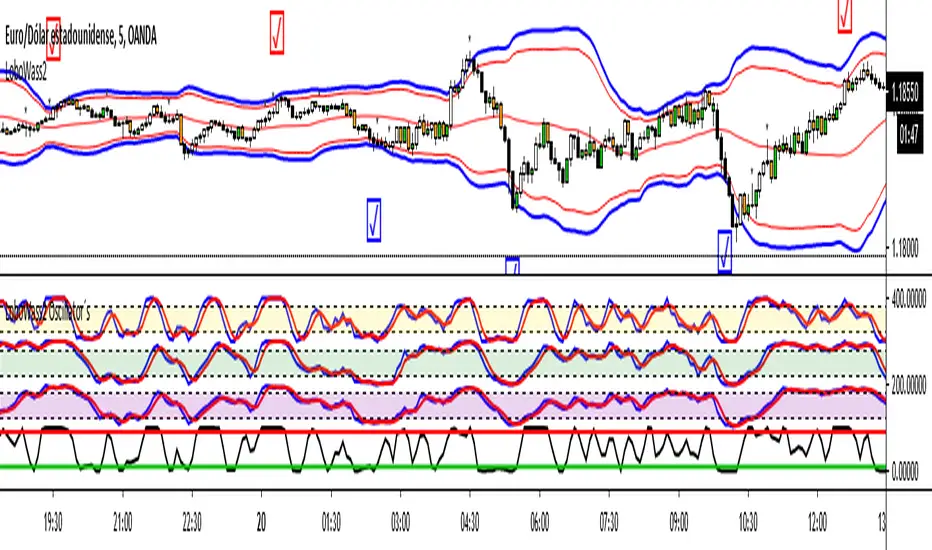
LoboWass2 Oscillator´s by Hashtag_binaryThis indicator composed of several oscillators was designed to be used with the strategy called LoboWass2 to be applied with Binary Options.
The idea of these oscillators is to be able to observe when all together appear in the same position, either overbought or oversold, and take the trade.
Remember that this is a confirmation tool, you must carry out prior analysis as your capital could be at risk. I recommend using this tool for the indicated strategy, as it was designed for that purpose. By working properly and professionally you can achieve great results, it all depends on you.
Viejito MMR2 UpperThis set will help you get better opportunities to trade binary options. When price is close to any line, use the fibonacci to get confirmation and you can take 5 minutes trades. Always analyze in 5 min timeframe

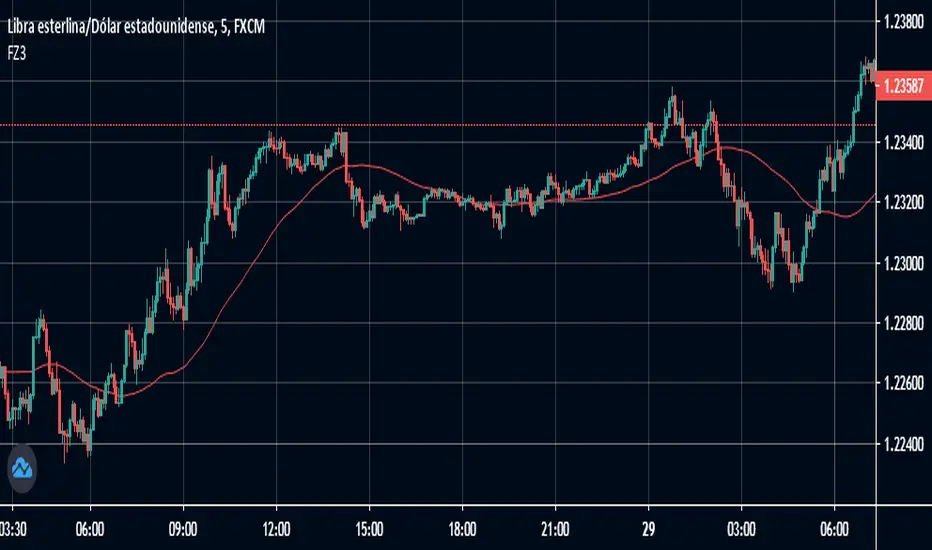
FZ3 DDemo version (02 / Jun / 20)
How to take tickets (binary options)
To take the tickets there are two ways and in both we configure the time limit to the time of the candles that we see, in medium and high volatility
• When the signal is displayed on a candlestick moving candle at the best possible point after seeing the signal
• When the signal is shown in a candle with movement against we will wait for the next candle and enter in favor of the signal
MTM S/R BounceThe MTM S/R Bounce is a Line Plotter that you can set to Plot any Timeframe. I use it somewhat as a Support and Resistance "Bounce" If I set the Chart to 30min and the candles are above the Yellow Daily Plotter, I use it as a Support. If the candles are Below the Yellow Daily Plotter then I use it as a resistance and Trade Binary Options Based on the Bounce. It can be used with Other Indicators to help predict the direction of the Bounce.
PM me to obtain Access to this Indicator

EMA200 with alerts before touchingInitial version: provide alert when price is in range before it touches ema.
Used for Binary Option to enter rejection from EMA200.
Why Jason200?
It's a legitimate request from Jason Estudillo.

Trig's Law 2.0This script uses a combination of candlestick patterns and indicators to produce signals that indicate potential trade opportunities for binary options traders.
These signals are meant to serve as additional confirmation.
Best suited for EURNZD pair on the 5min and 3min timeframes.
In the settings menu, you will see a list of pattern-based signals you can choose to have displayed on the chart.
ideally should wait for the signal candle to close before entering any trade.

yutas_BOindicator_β1_simpleVer.1.0
・High-low sign indicator for binary option only. (β_simple version)
・Signs are displayed where repulsion is likely to occur on special oscillators.
・You can expect a rebound in the next candle after you sign.
・The filter can be in a certain numerical range.
・We recommend cross-yen for currency pairs.
・バイナリーオプション専用ハイローサインインジケーター。 (ベータシンプルバージョン)
・特殊なオシレーターでの反発しやすい所にサインを表示します。
・サインが出た次のローソクでの反発が期待できます。
・フィルターとして一定数値範囲内という条件も可能。
・通貨ペアはクロス円がオススメです。

L&S PROFIT SCALP Indicator for scalp trades for TF 1-15 minutes. 1-4 signals per day depending on the currency pair. Suitable for all crypto exchanges, Forex, binary options. Signals+ take profit Levels.

Stochastic binary option styleUsing Time Frames For Trend – You can also use different time frames to determine trends with stochastic. To do this you will need to use two different time frame charts, I like to use the weekly/daily or daily/hourly combination depending on the asset. Weekly/daily works well with stocks and indices while I prefer the shorter time frame for currency and commodities. This is how it works; stochastic on the longer term chart sets trend, stochastic on the shorter term chart gives the signal. If, on the weekly chart, stochastic is pointing up then you would trade bullish signals on the daily charts. Or if using the daily/hourly combo the stochastic on the daily would set trend while signals would come from the hourly chart.
Green color bar and background means k is > d, the crowd is bullish (trend is bullish, a bullish crossover is happened), red is the contrary (bears are the leaders)
Credit to Michael Hodges
