MACD Binary Strategy by Hashtag_binary MACD Binary Options Strategy is an trend momentum system, It's based on the double MACD in the sub window below the chart.
- Markets: Stocks, Indicies, Metals, Forex. This binary strategy works good on the Indicies ( S&P 500, DAX, FTSE, ).
- MACD Binary System il also good as trading system for to trade.
- Time Frame 30 min or higher ( best 4H).
- Expires Time 3 bars after. (90 min, 180 min, 720 min, 3 daily).
Rules MACD Binary Options Strategy
Buy Call:
- EMA 6 over EMA 13;
- MACD ( 5, 15, 1) crosses upward MACD ( 12,26,1 );
- MACD (5,15, 1) over level 0.
Buy Put:
- EMA 6 under EMA 13;
- MACD ( 5, 15, 1) crosses downward MACD ( 12,26,1 );
- MACD (5,15, 1) under level 0.
The same conditions for entry trade.
Exit position options:
- When MACD (5, 15, 1,) crosses in opposite direction MACD (12,26,1);
- When exponential moving average crosses in opposite direction;
- Make profit with ratio 1:3 stop loss.
- Initial stop loss at the previous swing.
Pesquisar nos scripts por "binary option"

QQE Cross Indicator Alert v2.0 by JustUncleLThis version of the indicator makes a distinction between the types of QQE cross alerts on the chart and now only recommends the Thresh Hold channel exit crosses for BUY/SELL alerts, the other two types of crosses are still there to provide pre-warning of pending BUY/SELL alerts. Also only the BUY/SELL alerts are filtered by Moving Average Filter and/or the new Directional filter (default). The default settings in this version have also been changed, particularly the Moving Averages, to indicate trend changes quicker.
Indicator Project Description:
*** This is a trend following indicator alert that uses fast QQE crosses with Moving Averages for trend direction filtering. QQE or Qualitative Quantitative Estimation is based on the relative strength index, but uses a smoothing technique as an additional transformation. Three crosses can be selected (all selected by default):
RSI signal crossing ZERO (XZERO)
RSI signal crossing Fast RSIatr line (XQQE)
RSI signal exiting the RSI Threshhold Channel (BUY/SELL)
The (BUY/SELL) alerts can be optionally filtered by the Moving Average Combo:
For BUY alert the Close must be above the fast MA and
fast MA (EMA8) > medium MA (EMA20) > slow MA (SMA50).
For SELL alert the Close must be below the fast MA and
fast MA (EMA8) < medium MA (EMA20) < slow MA (SMA50).
and/or Directional filter (default filter):
For BUY alert the Close must be above the slow MA (SMA50) and the directional MA (EMA20) must be green.
For SELL alert the Close must be below the slow MA (SMA50) and the directional MA (EMA20) must be red.
The XZERO and XQQE are not included in the filtering, they are used to indicate pending BUY/SELL alerts, particularly the XZERO.
Note: I have found the XQQE cross can also be quite good alert for BUY/SELL as well, particularly in direction of current trend. The XZERO I have found to be totally unreliable for BUY/SELL alerts.
This indicator should work on any currency pair, most chart timeframes and expiry in 3 to 6 candles for binary option trading. For hourly or longer charts expiry can be longer for binary options, or if available use standard forex trading techniques
Some Hints for using this indicator:
Avoid taking trades in non-trending market, this is normally indicated by a near Horizontal SMA50 line.
Avoid trading when all the moving averages are close together.
When trading 1min and 5min charts, expiry should set to 1-3 candles.
Avoid trading when market choppy, this is normally indicated by the fast EMA8 crossing the EMA20 back and forwards quickly.
High probability trades tend to occur when you get a XQQE followed by a XZERO and then BUY/SELL in the same direction of trend.
Don't trade near nor directly on any major market news (sometime better no trade day).
Please practise this system in DEMO first, before committing any real money. Be patient the more you practise the better and more confident you will be.
I hope you enjoy this indicator, it has proven very effective for me.

fuson DEMA-->it does not need to be played with any settings. so I did not add a period.
-->l shows bearish trends very well but not as good as bearish trends in bullish trends
-->vdub can be used with binary options v3 and increases the leakage rates very high
-->If used for forex, it can be used in periods of 1 hour and longer
-->vdub binary option v3can be used for 1 minute verification with binary option if it will be used in binary option

Candlestick Trend Indicator v0.5 by JustUncleLRequested Update to this Indicator alert project. In this update I have added the option to be able select which Price Action candles you want included in the display and the generated alarm Alert. Other changes also included in this update:
Also added a Price Action candle for "Last Fractal S/R Break", this also a good continuation indication.
Added option to select a different moving average types for directional MA line.
Modified some default settings, using HullMA instead of Zero Lag EMA and standard MACD settings(12,26,9).
Description:
This is a trend following indicator and alert for Binary Options based on Candlestick patterns and trend line -
NOTE: original system was a forex trading system.
This code combines a number of indicators to create an overall trading strategy.
The indicator recognises and displays some useful candle named defined patterns that are used to support trend continuation:
Bearish + Bullish PinBars
Dark Cloud Cover
Piecing Line
Bullish + Bearish Harami
Bullish + Bearish Engulfing Candle
Bullish + Bearish Last Fractal S/R break
Also recognises main Price Action candles from ChrisMoody (CM), the four(4) price action patterns are colored coded bars:
Yellow = Inside Bar - breakout/continuance
Orange = Outside Bar - breakout/continuance
Aqua/Fuschia = Up/Down Shaved Bars - Buying/Selling pressure
Red/Green = Possible reversal PinBars - Reverse Down / reverse Up
The highlighted candles (maroon and darker green) represent the defined PA patterns that have been confirmed following the current trend direction that is indicated by the Hull MA(20) line (can select a different type of MA, or even disable) and confirmed by MACD direction (can be disabled). The confirmed Alerts are indication by green (buy) and red (sell) dots at the bottom of the chart. An alert is generated from this selection for the alert condition of the alarming system.
The fractal upper/lower break lines are also draw, if the (optional) last fractal break line is broken by a highlighted bar then this indicates a stronger trend conformation.
The MACD indicator MACD DEUTER 2 colour(12,26,9) you can visually see the MACD histogram colours with MACD direction - needs "MACD DEUTER 2 colour" indicator.
This multi-indicator set up is suitable for 1hr, 4hr and daily charts with 1-4 candle expiry.
References and Inspiration from:
Fractal Levels by RicardoSantos
Almost Zero Lag EMA
Candlestick Patterns With EMA by rmwaddelljr
CM_Price-Action-Bars by ChrisMoody
www.forexstrategiesresources.com
"Scalp Jockey - MTF MA Cross Visual Strategizer by JayRogers"

Trend Gauge [BullByte]Trend Gauge
Summary
A multi-factor trend detection indicator that aggregates EMA alignment, VWMA momentum scaling, volume spikes, ATR breakout strength, higher-timeframe confirmation, ADX-based regime filtering, and RSI pivot-divergence penalty into one normalized trend score. It also provides a confidence meter, a Δ Score momentum histogram, divergence highlights, and a compact, scalable dashboard for at-a-glance status.
________________________________________
## 1. Purpose of the Indicator
Why this was built
Traders often monitor several indicators in parallel - EMAs, volume signals, volatility breakouts, higher-timeframe trends, ADX readings, divergence alerts, etc., which can be cumbersome and sometimes contradictory. The “Trend Gauge” indicator was created to consolidate these complementary checks into a single, normalized score that reflects the prevailing market bias (bullish, bearish, or neutral) and its strength. By combining multiple inputs with an adaptive regime filter, scaling contributions by magnitude, and penalizing weakening signals (divergence), this tool aims to reduce noise, highlight genuine trend opportunities, and warn when momentum fades.
Key Design Goals
Signal Aggregation
Merged trend-following signals (EMA crossover, ATR breakout, higher-timeframe confirmation) and momentum signals (VWMA thrust, volume spikes) into a unified score that reflects directional bias more holistically.
Market Regime Awareness
Implemented an ADX-style filter to distinguish between trending and ranging markets, reducing the influence of trend signals during sideways phases to avoid false breakouts.
Magnitude-Based Scaling
Replaced binary contributions with scaled inputs: VWMA thrust and ATR breakout are weighted relative to recent averages, allowing for more nuanced score adjustments based on signal strength.
Momentum Divergence Penalty
Integrated pivot-based RSI divergence detection to slightly reduce the overall score when early signs of momentum weakening are detected, improving risk-awareness in entries.
Confidence Transparency
Added a live confidence metric that shows what percentage of enabled sub-indicators currently agree with the overall bias, making the scoring system more interpretable.
Momentum Acceleration Visualization
Plotted the change in score (Δ Score) as a histogram bar-to-bar, highlighting whether momentum is increasing, flattening, or reversing, aiding in more timely decision-making.
Compact Informational Dashboard
Presented a clean, scalable dashboard that displays each component’s status, the final score, confidence %, detected regime (Trending/Ranging), and a labeled strength gauge for quick visual assessment.
________________________________________
## 2. Why a Trader Should Use It
Main benefits and use cases
1. Unified View: Rather than juggling multiple windows or panels, this indicator delivers a single score synthesizing diverse signals.
2. Regime Filtering: In ranging markets, trend signals often generate false entries. The ADX-based regime filter automatically down-weights trend-following components, helping you avoid chasing false breakouts.
3. Nuanced Momentum & Volatility: VWMA and ATR breakout contributions are normalized by recent averages, so strong moves register strongly while smaller fluctuations are de-emphasized.
4. Early Warning of Weakening: Pivot-based RSI divergence is detected and used to slightly reduce the score when price/momentum diverges, giving a cautionary signal before a full reversal.
5. Confidence Meter: See at a glance how many sub-indicators align with the aggregated bias (e.g., “80% confidence” means 4 out of 5 components agree ). This transparency avoids black-box decisions.
6. Trend Acceleration/Deceleration View: The Δ Score histogram visualizes whether the aggregated score is rising (accelerating trend) or falling (momentum fading), supplementing the main oscillator.
7. Compact Dashboard: A corner table lists each check’s status (“Bull”, “Bear”, “Flat” or “Disabled”), plus overall Score, Confidence %, Regime, Trend Strength label, and a gauge bar. Users can scale text size (Normal, Small, Tiny) without removing elements, so the full picture remains visible even in compact layouts.
8. Customizable & Transparent: All components can be enabled/disabled and parameterized (lengths, thresholds, weights). The full Pine code is open and well-commented, letting users inspect or adapt the logic.
9. Alert-ready: Built-in alert conditions fire when the score crosses weak thresholds to bullish/bearish or returns to neutral, enabling timely notifications.
________________________________________
## 3. Component Rationale (“Why These Specific Indicators?”)
Each sub-component was chosen because it adds complementary information about trend or momentum:
1. EMA Cross
o Basic trend measure: compares a faster EMA vs. a slower EMA. Quickly reflects trend shifts but by itself can whipsaw in sideways markets.
2. VWMA Momentum
o Volume-weighted moving average change indicates momentum with volume context. By normalizing (dividing by a recent average absolute change), we capture the strength of momentum relative to recent history. This scaling prevents tiny moves from dominating and highlights genuinely strong momentum.
3. Volume Spikes
o Sudden jumps in volume combined with price movement often accompany stronger moves or reversals. A binary detection (+1 for bullish spike, -1 for bearish spike) flags high-conviction bars.
4. ATR Breakout
o Detects price breaking beyond recent highs/lows by a multiple of ATR. Measures breakout strength by how far beyond the threshold price moves relative to ATR, capped to avoid extreme outliers. This gives a volatility-contextual trend signal.
5. Higher-Timeframe EMA Alignment
o Confirms whether the shorter-term trend aligns with a higher timeframe trend. Uses request.security with lookahead_off to avoid future data. When multiple timeframes agree, confidence in direction increases.
6. ADX Regime Filter (Manual Calculation)
o Computes directional movement (+DM/–DM), smoothes via RMA, computes DI+ and DI–, then a DX and ADX-like value. If ADX ≥ threshold, market is “Trending” and trend components carry full weight; if ADX < threshold, “Ranging” mode applies a configurable weight multiplier (e.g., 0.5) to trend-based contributions, reducing false signals in sideways conditions. Volume spikes remain binary (optional behavior; can be adjusted if desired).
7. RSI Pivot-Divergence Penalty
o Uses ta.pivothigh / ta.pivotlow with a lookback to detect pivot highs/lows on price and corresponding RSI values. When price makes a higher high but RSI makes a lower high (bearish divergence), or price makes a lower low but RSI makes a higher low (bullish divergence), a divergence signal is set. Rather than flipping the trend outright, the indicator subtracts (or adds) a small penalty (configurable) from the aggregated score if it would weaken the current bias. This subtle adjustment warns of weakening momentum without overreacting to noise.
8. Confidence Meter
o Counts how many enabled components currently agree in direction with the aggregated score (i.e., component sign × score sign > 0). Displays this as a percentage. A high percentage indicates strong corroboration; a low percentage warns of mixed signals.
9. Δ Score Momentum View
o Plots the bar-to-bar change in the aggregated score (delta_score = score - score ) as a histogram. When positive, bars are drawn in green above zero; when negative, bars are drawn in red below zero. This reveals acceleration (rising Δ) or deceleration (falling Δ), supplementing the main oscillator.
10. Dashboard
• A table in the indicator pane’s top-right with 11 rows:
1. EMA Cross status
2. VWMA Momentum status
3. Volume Spike status
4. ATR Breakout status
5. Higher-Timeframe Trend status
6. Score (numeric)
7. Confidence %
8. Regime (“Trending” or “Ranging”)
9. Trend Strength label (e.g., “Weak Bullish Trend”, “Strong Bearish Trend”)
10. Gauge bar visually representing score magnitude
• All rows always present; size_opt (Normal, Small, Tiny) only changes text size via text_size, not which elements appear. This ensures full transparency.
________________________________________
## 4. What Makes This Indicator Stand Out
• Regime-Weighted Multi-Factor Score: Trend and momentum signals are adaptively weighted by market regime (trending vs. ranging) , reducing false signals.
• Magnitude Scaling: VWMA and ATR breakout contributions are normalized by recent average momentum or ATR, giving finer gradation compared to simple ±1.
• Integrated Divergence Penalty: Divergence directly adjusts the aggregated score rather than appearing as a separate subplot; this influences alerts and trend labeling in real time.
• Confidence Meter: Shows the percentage of sub-signals in agreement, providing transparency and preventing blind trust in a single metric.
• Δ Score Histogram Momentum View: A histogram highlights acceleration or deceleration of the aggregated trend score, helping detect shifts early.
• Flexible Dashboard: Always-visible component statuses and summary metrics in one place; text size scaling keeps the full picture available in cramped layouts.
• Lookahead-Safe HTF Confirmation: Uses lookahead_off so no future data is accessed from higher timeframes, avoiding repaint bias.
• Repaint Transparency: Divergence detection uses pivot functions that inherently confirm only after lookback bars; description documents this lag so users understand how and when divergence labels appear.
• Open-Source & Educational: Full, well-commented Pine v6 code is provided; users can learn from its structure: manual ADX computation, conditional plotting with series = show ? value : na, efficient use of table.new in barstate.islast, and grouped inputs with tooltips.
• Compliance-Conscious: All plots have descriptive titles; inputs use clear names; no unnamed generic “Plot” entries; manual ADX uses RMA; all request.security calls use lookahead_off. Code comments mention repaint behavior and limitations.
________________________________________
## 5. Recommended Timeframes & Tuning
• Any Timeframe: The indicator works on small (e.g., 1m) to large (daily, weekly) timeframes. However:
o On very low timeframes (<1m or tick charts), noise may produce frequent whipsaws. Consider increasing smoothing lengths, disabling certain components (e.g., volume spike if volume data noisy), or using a larger pivot lookback for divergence.
o On higher timeframes (daily, weekly), consider longer lookbacks for ATR breakout or divergence, and set Higher-Timeframe trend appropriately (e.g., 4H HTF when on 5 Min chart).
• Defaults & Experimentation: Default input values are chosen to be balanced for many liquid markets. Users should test with replay or historical analysis on their symbol/timeframe and adjust:
o ADX threshold (e.g., 20–30) based on instrument volatility.
o VWMA and ATR scaling lengths to match average volatility cycles.
o Pivot lookback for divergence: shorter for faster markets, longer for slower ones.
• Combining with Other Analysis: Use in conjunction with price action, support/resistance, candlestick patterns, order flow, or other tools as desired. The aggregated score and alerts can guide attention but should not be the sole decision-factor.
________________________________________
## 6. How Scoring and Logic Works (Step-by-Step)
1. Compute Sub-Scores
o EMA Cross: Evaluate fast EMA > slow EMA ? +1 : fast EMA < slow EMA ? -1 : 0.
o VWMA Momentum: Calculate vwma = ta.vwma(close, length), then vwma_mom = vwma - vwma . Normalize: divide by recent average absolute momentum (e.g., ta.sma(abs(vwma_mom), lookback)), clip to .
o Volume Spike: Compute vol_SMA = ta.sma(volume, len). If volume > vol_SMA * multiplier AND price moved up ≥ threshold%, assign +1; if moved down ≥ threshold%, assign -1; else 0.
o ATR Breakout: Determine recent high/low over lookback. If close > high + ATR*mult, compute distance = close - (high + ATR*mult), normalize by ATR, cap at a configured maximum. Assign positive contribution. Similarly for bearish breakout below low.
o Higher-Timeframe Trend: Use request.security(..., lookahead=barmerge.lookahead_off) to fetch HTF EMAs; assign +1 or -1 based on alignment.
2. ADX Regime Weighting
o Compute manual ADX: directional movements (+DM, –DM), smoothed via RMA, DI+ and DI–, then DX and ADX via RMA. If ADX ≥ threshold, market is considered “Trending”; otherwise “Ranging.”
o If trending, trend-based contributions (EMA, VWMA, ATR, HTF) use full weight = 1.0. If ranging, use weight = ranging_weight (e.g., 0.5) to down-weight them. Volume spike stays binary ±1 (optional to change if desired).
3. Aggregate Raw Score
o Sum weighted contributions of all enabled components. Count the number of enabled components; if zero, default count = 1 to avoid division by zero.
4. Divergence Penalty
o Detect pivot highs/lows on price and corresponding RSI values, using a lookback. When price and RSI diverge (bearish or bullish divergence), check if current raw score is in the opposing direction:
If bearish divergence (price higher high, RSI lower high) and raw score currently positive, subtract a penalty (e.g., 0.5).
If bullish divergence (price lower low, RSI higher low) and raw score currently negative, add a penalty.
o This reduces score magnitude to reflect weakening momentum, without flipping the trend outright.
5. Normalize and Smooth
o Normalized score = (raw_score / number_of_enabled_components) * 100. This yields a roughly range.
o Optional EMA smoothing of this normalized score to reduce noise.
6. Interpretation
o Sign: >0 = net bullish bias; <0 = net bearish bias; near zero = neutral.
o Magnitude Zones: Compare |score| to thresholds (Weak, Medium, Strong) to label trend strength (e.g., “Weak Bullish Trend”, “Medium Bearish Trend”, “Strong Bullish Trend”).
o Δ Score Histogram: The histogram bars from zero show change from previous bar’s score; positive bars indicate acceleration, negative bars indicate deceleration.
o Confidence: Percentage of sub-indicators aligned with the score’s sign.
o Regime: Indicates whether trend-based signals are fully weighted or down-weighted.
________________________________________
## 7. Oscillator Plot & Visualization: How to Read It
Main Score Line & Area
The oscillator plots the aggregated score as a line, with colored fill: green above zero for bullish area, red below zero for bearish area. Horizontal reference lines at ±Weak, ±Medium, and ±Strong thresholds mark zones: crossing above +Weak suggests beginning of bullish bias, above +Medium for moderate strength, above +Strong for strong trend; similarly for bearish below negative thresholds.
Δ Score Histogram
If enabled, a histogram shows score - score . When positive, bars appear in green above zero, indicating accelerating bullish momentum; when negative, bars appear in red below zero, indicating decelerating or reversing momentum. The height of each bar reflects the magnitude of change in the aggregated score from the prior bar.
Divergence Highlight Fill
If enabled, when a pivot-based divergence is confirmed:
• Bullish Divergence : fill the area below zero down to –Weak threshold in green, signaling potential reversal from bearish to bullish.
• Bearish Divergence : fill the area above zero up to +Weak threshold in red, signaling potential reversal from bullish to bearish.
These fills appear with a lag equal to pivot lookback (the number of bars needed to confirm the pivot). They do not repaint after confirmation, but users must understand this lag.
Trend Direction Label
When score crosses above or below the Weak threshold, a small label appears near the score line reading “Bullish” or “Bearish.” If the score returns within ±Weak, the label “Neutral” appears. This helps quickly identify shifts at the moment they occur.
Dashboard Panel
In the indicator pane’s top-right, a table shows:
1. EMA Cross status: “Bull”, “Bear”, “Flat”, or “Disabled”
2. VWMA Momentum status: similarly
3. Volume Spike status: “Bull”, “Bear”, “No”, or “Disabled”
4. ATR Breakout status: “Bull”, “Bear”, “No”, or “Disabled”
5. Higher-Timeframe Trend status: “Bull”, “Bear”, “Flat”, or “Disabled”
6. Score: numeric value (rounded)
7. Confidence: e.g., “80%” (colored: green for high, amber for medium, red for low)
8. Regime: “Trending” or “Ranging” (colored accordingly)
9. Trend Strength: textual label based on magnitude (e.g., “Medium Bullish Trend”)
10. Gauge: a bar of blocks representing |score|/100
All rows remain visible at all times; changing Dashboard Size only scales text size (Normal, Small, Tiny).
________________________________________
## 8. Example Usage (Illustrative Scenario)
Example: BTCUSD 5 Min
1. Setup: Add “Trend Gauge ” to your BTCUSD 5 Min chart. Defaults: EMAs (8/21), VWMA 14 with lookback 3, volume spike settings, ATR breakout 14/5, HTF = 5m (or adjust to 4H if preferred), ADX threshold 25, ranging weight 0.5, divergence RSI length 14 pivot lookback 5, penalty 0.5, smoothing length 3, thresholds Weak=20, Medium=50, Strong=80. Dashboard Size = Small.
2. Trend Onset: At some point, price breaks above recent high by ATR multiple, volume spikes upward, faster EMA crosses above slower EMA, HTF EMA also bullish, and ADX (manual) ≥ threshold → aggregated score rises above +20 (Weak threshold) into +Medium zone. Dashboard shows “Bull” for EMA, VWMA, Vol Spike, ATR, HTF; Score ~+60–+70; Confidence ~100%; Regime “Trending”; Trend Strength “Medium Bullish Trend”; Gauge ~6–7 blocks. Δ Score histogram bars are green and rising, indicating accelerating bullish momentum. Trader notes the alignment.
3. Divergence Warning: Later, price makes a slightly higher high but RSI fails to confirm (lower RSI high). Pivot lookback completes; the indicator highlights a bearish divergence fill above zero and subtracts a small penalty from the score, causing score to stall or retrace slightly. Dashboard still bullish but score dips toward +Weak. This warns the trader to tighten stops or take partial profits.
4. Trend Weakens: Score eventually crosses below +Weak back into neutral; a “Neutral” label appears, and a “Neutral Trend” alert fires if enabled. Trader exits or avoids new long entries. If score subsequently crosses below –Weak, a “Bearish” label and alert occur.
5. Customization: If the trader finds VWMA noise too frequent on this instrument, they may disable VWMA or increase lookback. If ATR breakouts are too rare, adjust ATR length or multiplier. If ADX threshold seems off, tune threshold. All these adjustments are explained in Inputs section.
6. Visualization: The screenshot shows the main score oscillator with colored areas, reference lines at ±20/50/80, Δ Score histogram bars below/above zero, divergence fill highlighting potential reversal, and the dashboard table in the top-right.
________________________________________
## 9. Inputs Explanation
A concise yet clear summary of inputs helps users understand and adjust:
1. General Settings
• Theme (Dark/Light): Choose background-appropriate colors for the indicator pane.
• Dashboard Size (Normal/Small/Tiny): Scales text size only; all dashboard elements remain visible.
2. Indicator Settings
• Enable EMA Cross: Toggle on/off basic EMA alignment check.
o Fast EMA Length and Slow EMA Length: Periods for EMAs.
• Enable VWMA Momentum: Toggle VWMA momentum check.
o VWMA Length: Period for VWMA.
o VWMA Momentum Lookback: Bars to compare VWMA to measure momentum.
• Enable Volume Spike: Toggle volume spike detection.
o Volume SMA Length: Period to compute average volume.
o Volume Spike Multiplier: How many times above average volume qualifies as spike.
o Min Price Move (%): Minimum percent change in price during spike to qualify as bullish or bearish.
• Enable ATR Breakout: Toggle ATR breakout detection.
o ATR Length: Period for ATR.
o Breakout Lookback: Bars to look back for recent highs/lows.
o ATR Multiplier: Multiplier for breakout threshold.
• Enable Higher Timeframe Trend: Toggle HTF EMA alignment.
o Higher Timeframe: E.g., “5” for 5-minute when on 1-minute chart, or “60” for 5 Min when on 15m, etc. Uses lookahead_off.
• Enable ADX Regime Filter: Toggles regime-based weighting.
o ADX Length: Period for manual ADX calculation.
o ADX Threshold: Value above which market considered trending.
o Ranging Weight Multiplier: Weight applied to trend components when ADX < threshold (e.g., 0.5).
• Scale VWMA Momentum: Toggle normalization of VWMA momentum magnitude.
o VWMA Mom Scale Lookback: Period for average absolute VWMA momentum.
• Scale ATR Breakout Strength: Toggle normalization of breakout distance by ATR.
o ATR Scale Cap: Maximum multiple of ATR used for breakout strength.
• Enable Price-RSI Divergence: Toggle divergence detection.
o RSI Length for Divergence: Period for RSI.
o Pivot Lookback for Divergence: Bars on each side to identify pivot high/low.
o Divergence Penalty: Amount to subtract/add to score when divergence detected (e.g., 0.5).
3. Score Settings
• Smooth Score: Toggle EMA smoothing of normalized score.
• Score Smoothing Length: Period for smoothing EMA.
• Weak Threshold: Absolute score value under which trend is considered weak or neutral.
• Medium Threshold: Score above Weak but below Medium is moderate.
• Strong Threshold: Score above this indicates strong trend.
4. Visualization Settings
• Show Δ Score Histogram: Toggle display of the bar-to-bar change in score as a histogram. Default true.
• Show Divergence Fill: Toggle background fill highlighting confirmed divergences. Default true.
Each input has a tooltip in the code.
________________________________________
## 10. Limitations, Repaint Notes, and Disclaimers
10.1. Repaint & Lag Considerations
• Pivot-Based Divergence Lag: The divergence detection uses ta.pivothigh / ta.pivotlow with a specified lookback. By design, a pivot is only confirmed after the lookback number of bars. As a result:
o Divergence labels or fills appear with a delay equal to the pivot lookback.
o Once the pivot is confirmed and the divergence is detected, the fill/label does not repaint thereafter, but you must understand and accept this lag.
o Users should not treat divergence highlights as predictive signals without additional confirmation, because they appear after the pivot has fully formed.
• Higher-Timeframe EMA Alignment: Uses request.security(..., lookahead=barmerge.lookahead_off), so no future data from the higher timeframe is used. This avoids lookahead bias and ensures signals are based only on completed higher-timeframe bars.
• No Future Data: All calculations are designed to avoid using future information. For example, manual ADX uses RMA on past data; security calls use lookahead_off.
10.2. Market & Noise Considerations
• In very choppy or low-liquidity markets, some components (e.g., volume spikes or VWMA momentum) may be noisy. Users can disable or adjust those components’ parameters.
• On extremely low timeframes, noise may dominate; consider smoothing lengths or disabling certain features.
• On very high timeframes, pivots and breakouts occur less frequently; adjust lookbacks accordingly to avoid sparse signals.
10.3. Not a Standalone Trading System
• This is an indicator, not a complete trading strategy. It provides signals and context but does not manage entries, exits, position sizing, or risk management.
• Users must combine it with their own analysis, money management, and confirmations (e.g., price patterns, support/resistance, fundamental context).
• No guarantees: past behavior does not guarantee future performance.
10.4. Disclaimers
• Educational Purposes Only: The script is provided as-is for educational and informational purposes. It does not constitute financial, investment, or trading advice.
• Use at Your Own Risk: Trading involves risk of loss. Users should thoroughly test and use proper risk management.
• No Guarantees: The author is not responsible for trading outcomes based on this indicator.
• License: Published under Mozilla Public License 2.0; code is open for viewing and modification under MPL terms.
________________________________________
## 11. Alerts
• The indicator defines three alert conditions:
1. Bullish Trend: when the aggregated score crosses above the Weak threshold.
2. Bearish Trend: when the score crosses below the negative Weak threshold.
3. Neutral Trend: when the score returns within ±Weak after being outside.
Good luck
– BullByte

Philpose's Binary Turbo 1.2Hello there,
I'm thrilled to introduce my very first TradingView indicator - "Philpose's Binary Turbo 1.0." This indicator isn't just another tool; it's my unique take on binary options trading, powered by the Relative Strength Index (RSI).
Differences from Other Indicators:
This indicator is designed for traders who prefer short-term trading, as it uses a 1-minute timeframe.
It assumes that RSI crossovers of overbought and oversold levels can be used to generate binary options signals.
Users should backtest and evaluate the indicator's performance in different market conditions and consider risk management strategies.
Custom Logic: This indicator implements a custom trading logic based on RSI crossovers of overbought and oversold levels. Many indicators on TradingView use standard indicators, but this script incorporates unique logic.
Signal Tracking: It tracks and displays the last buy and sell signals on the chart. This visual representation can be helpful for traders to see when signals were generated.
Streak Tracking: The script keeps track of winning and losing streaks, which can provide traders with insights into their trading performance over time.
Table Summary: It creates a table summarizing various statistics related to the signals generated, such as total signals, wins, losses, and streaks. This tabular representation can be useful for traders to assess the indicator's performance.
How to Use:
To use this indicator effectively, follow these steps:
Add the Indicator: Copy and paste the script into TradingView's Pine Script editor. Then, apply the indicator to the chart.
Customize Parameters: Adjust the RSI parameters (period, overbought, and oversold levels) and the minimum bars between signals according to your trading strategy and preferences.
Interpret Signals: Buy signals are generated when the RSI crosses above the oversold level, and sell signals occur when it crosses below the overbought level.
Analyze Streaks: Keep an eye on the win and loss streaks to assess the indicator's performance and your trading strategy.
Review Table: The table at the top-right corner of the chart provides a summary of important statistics related to signals, wins, losses, and streaks.
Markets and Conditions:
The script can be used in various financial markets, including stocks, forex, commodities, and indices. However, it's important to note that binary options trading has a distinct risk profile and is available on certain platforms. Therefore, you should ensure that your chosen binary options platform supports TradingView indicators and that you understand the specific conditions of binary options trading.
Conditions for Use:
This indicator is designed for traders who prefer short-term trading, as it uses a 1-minute timeframe.
It assumes that RSI crossovers of overbought and oversold levels can be used to generate binary options signals.
Users should backtest and evaluate the indicator's performance in different market conditions and consider risk management strategies.
Please exercise caution when using any trading indicator or strategy, especially in binary options trading, as it involves a high level of risk, and you may lose your entire investment. It's advisable to thoroughly test any strategy on a demo account before trading with real funds and to seek the advice of a qualified financial advisor if you are unsure about your trading decisions.

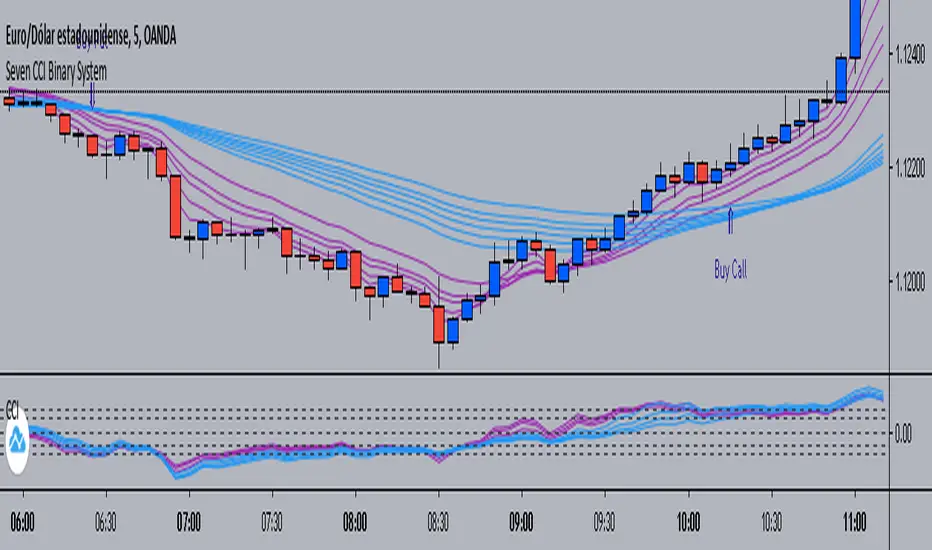
Seven CCI Binary System by Hashtag_binarySeven CCI binary system is trend-momentum strategy based on CCI and exponential moving averages. This trading system is also good for scalping and intraday trading.
Rules for Binary Options:
- Time Frame 5 min or 15 min.
- Expiry time 4-5 candles.
- Trades only in trend.
Buy Call:
- EMA's lines color magenta above EMA's lines color blue;
- CCI lines color magenta are above CCI lines color blue and zero level.
- When thes conditions are agree buy call at opening of the next bar.
Buy Put:
- EMA's lines color magenta below EMA's lines color blue;
- CCI lines color magenta are below CCI lines color blue and zero level.
- When thes conditions are agree buy put at opening of the next bar.
Scalping:
-Time Frame 5 min, 15min.
- Currency Pairs: EUR/USD, GBP/USD, AUD/USD, USD/CHF, USD/JPY.
- The rules for buy and sell are the same.
- When the price is within the bundle of the moving averages do not trade.
Exit position
- Make Profit on the pivot points levels or with fast profit target.
- Initial stop loss on the previous swing price.
Acmillions88 Binary Prediction 1For those who followed me, I have good news for you.
I went into binary options.
The key to binary options is to predict the next candle,
here's a script with high success rate.
Tested on EURUSD 1min.
When the green or red line didn't touch any candle body for a period of time,
then it touches a candle's body.
If the candle is green, a red one is coming soon,
most likely is the next one.
If the candle is red, a green one is coming soon,
most likely is the next one.
Important to note that when the line crosses the body of the candle, it has to be slanted,
meaning the line has to be going up or down.
Please don't ask me why and how it works. Its a secret.
Cheers.

PROFIT_CANDLE_BillionWay_ExclusiveBinaryOptionAndForexHere is the spectacular working Binary option script with Alert condition enabled code.
Tested this with 1min and 5min and proven to be 80% ITM 8 win to loss out of 10 trades.One can use this for Binary option trading for some good win rates.
This is the upgraded version of Read through this before using this updated version.
How it works and How to use this :
1.This can be applied for any time frame ,Best works in 30min ,1hr,1D,W,M -- For BinaryOption 1minchart ,5minchart with 1-2min expiry,5-10min expiry works best.
2.Only Look for the Blue handle to appear in the chart once you see the candle as soon as Enter "CALL in Binary option" ,Now you can enable the Tradingview Alert after the setting so that you get alert and trade (Put option logic not included ,This is only work for Call ,But it can be used for any forex,equity ,currency market)
3.As soon as you sea the blue candle forming Enter Buy (If you see the black candle after the candle made huge high avoid entering the trade at very high level price) and expiry time should be 1-2min for 1min chart, 5 to 10min for 5min chart ,Normally 1plus times of chart frame time.
4.If it is forex or equity Cover the the trade after 2to3 candle for quick profit or keep it for 15-20 candles for good profits ,This gives some false signal as well so this might work only 80%.Be cautious risking your money .
Test it and provide your feedback in the comment section ,Invited user will be given access,Do not comment grant access in comment section ,Send me pvt message in Tradingview.
How to enable the alert
1.First choose the timeframe in which u want to get the alert for example EURJPY 1min chart
2.Go to Tools(Right top corner in Tradingview) Click on the Alerts and then click on the SetAlerts or press Alt+A
3.Now in the "Condition" Choose PROFIT_CANDLE_BillionWay_ExclusiveBinaryOptionAndForex
4.Choose the frequency one per bar and choose other option if you wish and then click on create
--> If you are pro member you can set 10 alerts for various time frame or for 10 differrent currency pair which will alert on live time to enter call
if you atleast get 3call in an hour from each script in 10script ,30calls you would trade in an hour and if the win rate is 70% you would go with good money every time.
Please post your valuable feedback so that it will help others too. Happy Trading Happy Earning.
Published on 12-08-2018 12PM
Here is the spectacular working Binary option script with Alert condition enabled code.
Tested this with 1min and 5min and proven to be 80% ITM 8 win to loss out of 10 trades.One can use this for Binary option trading for some good win rates.
This is the upgraded version of Read through this before using this updated version.
How it works and How to use this :
1.This can be applied for any time frame ,Best works in 30min ,1hr,1D,W,M -- For BinaryOption 1minchart ,5minchart with 1-2min expiry,5-10min expiry works best.
2.Only Look for the Blue handle to appear in the chart once you see the candle as soon as Enter "CALL in Binary option" ,Now you can enable the Tradingview Alert after the setting so that you get alert and trade (Put option logic not included ,This is only work for Call ,But it can be used for any forex,equity ,currency market)
3.As soon as you sea the blue candle forming Enter Buy (If you see the black candle after the candle made huge high avoid entering the trade at very high level price) and expiry time should be 1-2min for 1min chart, 5 to 10min for 5min chart ,Normally 1plus times of chart frame time.
4.If it is forex or equity Cover the the trade after 2to3 candle for quick profit or keep it for 15

VDUB BB %B REVERSAL_v4.2 revised by JustUncleLThis is an revised Open Public version of Vdub Bollinger Band %B reversal indicator. This version includes optional Divergence Finder with selectable channel width, optional Market Session time highlighting and optional Binary Option expiry markers.

Alpha V3 proAlpha V3 pro is a custom technical indicator designed specifically for binary options trading. It analyzes market structure, price action behavior, and momentum shifts to generate high-probability buy and sell signals. The indicator filters out noise and focuses on identifying clear market reversals or trend continuations, helping traders take more accurate entries within short-term timeframes. With its optimized signal logic, Alpha V3 aims to provide timely alerts, improved decision-making, and greater consistency for traders looking to capitalize on fast binary option opportunities.

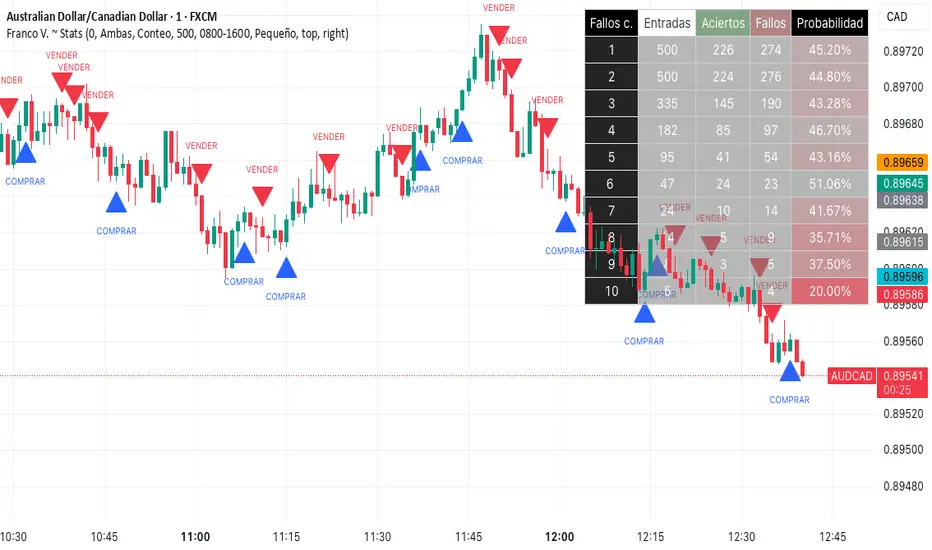
Franco Varacalli binary options |ENGLISH|
What if you could know, with mathematical precision, when your trades have the highest probability of success?
Franco V. ~ Stats is not just an indicator: it’s a real-time performance tracking and analysis system that transforms price action into clear, actionable metrics.
🔍 What it does
It analyzes candle sequences and detects changes in price dynamics, filtering opportunities according to your settings (buy only, sell only, or both). From there, it records each entry, counts wins and losses, and calculates success probabilities for different scenarios.
🛠 How it works (core concepts)
-Evaluates proportional relationships between open, close, high, and low prices.
-Detects shifts in the balance of buying/selling pressure.
-Classifies trades by the number of prior consecutive losses.
-Calculates success probabilities based on accumulated historical data.
📈 What you get
-On-chart table showing entries, wins, losses, and win percentage.
-Dynamic colors to instantly spot the best-performing scenarios.
-Optional arrows marking moments when conditions are met.
-Filters and thresholds to adapt the analysis to your trading style.
💡 How to use it
-Set your preferred signal type and consecutive loss threshold.
-Monitor the table to see which sequences show higher probability.
-Use the signals as a reference and confirm with your own technical analysis.
⚠ Disclaimer: This tool is designed for market analysis and performance tracking. It should be used in combination with your own research, risk management, and decision-making process.
Franco Varacalli
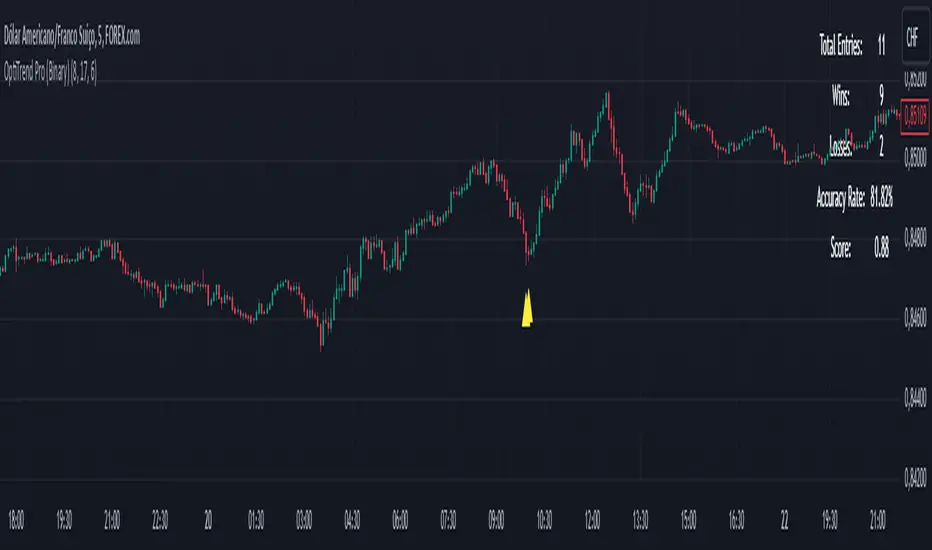
OptiTrend Pro (Binary)
OptiTrend Pro for Binary Options
The OptiTrend Pro indicator is specifically crafted for binary options trading, providing timely, accurate buy and sell alerts with clear arrow signals. This advanced tool combines multiple indicators, offering a comprehensive analysis of trends, volatility, momentum, and key levels, which help traders make well-informed decisions in digital asset markets.
Key Features:
Scoring System: OptiTrend Pro uses a scoring system based on the accuracy and frequency of signals, giving you an objective way to assess the quality of signals. This composite score considers both the hit rate and the number of entries, allowing you to focus on higher-quality setups. Alerts are only sent if the signal score is above 0.5, ensuring notifications are limited to strong signals.
Custom Time Filter: Designed to focus your trading to specific hours, the time filter aligns with the America/Sao_Paulo time zone. For optimal results, we recommend setting the time filter from 8 AM to 5 PM, especially when trading major Forex pairs like EURUSD, GBPUSD, USDJPY, AUDUSD, and USDCAD.
Result Tracking & Win/Loss Counts: Easily monitor win/loss ratios based on a set number of candlesticks (user-defined), which aids in assessing strategy success.
Flexible Alert System: Receive alerts for bullish and bearish signals with arrow markers, ensuring clarity for entries. Additionally, users can set a minimum score to trigger alerts, focusing only on high-quality signals.
How to Use:
Adjust the Parameters: Customize each indicator, time filter, and win/loss tracking period based on your binary trading needs.
Follow the Arrows: Look for bullish signals (up arrows) for buy opportunities and bearish signals (down arrows) for sell opportunities.
Monitor Performance: Leverage the win/loss tracking system and composite score to assess the effectiveness of the signals and optimize your setup.
Set Alerts: Enable alerts to stay informed of new signals as they happen, with filtering options based on your confidence level. Remember, alerts are triggered only if the signal score exceeds 0.5, ensuring that only strong opportunities prompt a notification.
Interpreting the Signals:
Bullish Signal (Up Arrow): Indicates a potential opportunity to enter a buy position as price may rise.
Bearish Signal (Down Arrow): Signals a potential sell position as price may decline.
Usage Tips:
Use OptiTrend Pro alongside other analysis tools for confirmation and additional context.
Adjust the indicator settings to suit the specific asset and timeframe you’re working with.
Apply the results simulation to refine your strategy and manage risk effectively.
This indicator is ideal for binary options on 5-minute and 15-minute charts, designed for entries of 20 and 90 minutes, respectively. For best performance, trade during the 8 AM to 5 PM window on major Forex pairs.
Disclaimer: OptiTrend Pro is a support tool for making trading decisions. It does not guarantee profits and should not be your sole basis for trading. Perform your own analysis and trade responsibly.
Try OptiTrend Pro now to refine your strategies with precise alerts and complete market insights!
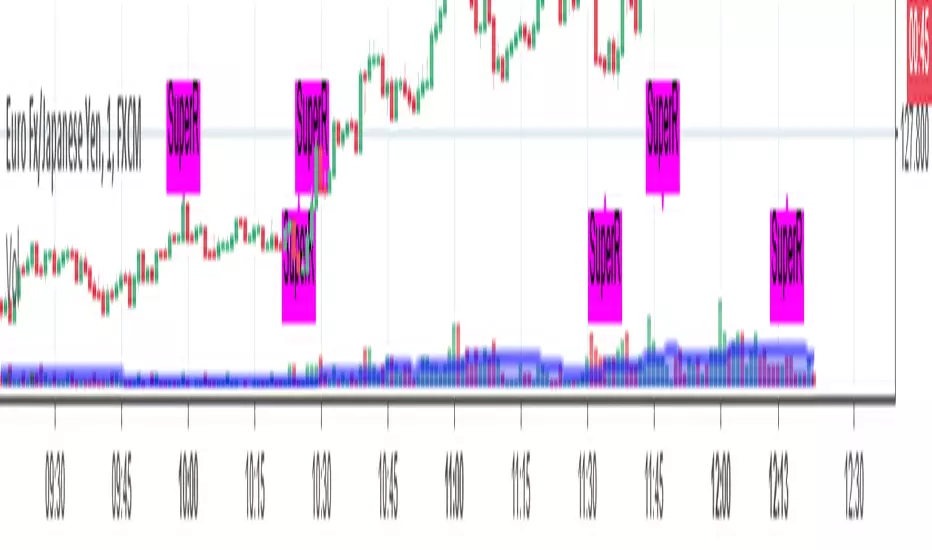
SuperR V.2Hi,
This is the same indicator but now it's more accurate. you can use it with 1- minute binary options trading. Please note that SuperR is not for FX or stock trading expect binary options. With this system, we're using 2 step of martingale.
And my indicator is for sale. once you buy it you will get permission to access indicator. as simple as that.
Mail me, if you are interested. SuperR indicator is priced at $150. once-off fee.
For more information
Drop me a mail, id is jogadiyahemlata786@gmail.com ( Ensure spelling before you send it out )
(This is officile annocenment )
Big Snapper Alerts R2.0 by JustUncleLThis is a diversified Binary Option or Scalping Alert indicator originally designed for lower Time Frame Trend or Swing trading. Although you will find it a useful tool for higher time frames as well.
The Alerts are generated by the changing direction of the ColouredMA (HullMA by default), you then have the choice of selecting the Directional filtering on these signals or a Bollinger swing reversal filter.
The filters include:
Type 1 - The three MAs (EMAs 21,55,89 by default) in various combinations or by themselves. When only one directional MA selected then direction filter is given by ColouredMA above(up)/below(down) selected MA. If more than one MA selected the direction is given by MAs being in correct order for trend direction.
Type 2 - The SuperTrend direction is used to filter ColouredMA signals.
Type 3 - Bollinger Band Outside In is used to filter ColouredMA for swing reversals.
Type 4 - No directional filtering, all signals from the ColouredMA are shown.
Notes:
Each Type can be combined with another type to form more complex filtration.
Alerts can also be disabled completely if you just want one indicator with one colouredMA and/or 3xMAs and/or Bollinger Bands and/or SuperTrend painted on the chart.
Warning:
Be aware that combining Bollinger OutsideIn swing filter and a directional filter can be counter productive as they are opposites. So careful consideration is needed when combining Bollinger OutsideIn with any of the directional filters.
Hints:
For Binary Options try ColouredMA = HullMA(13) or HullMA(8) with Type 2 or 3 Filter.
When using Trend filters SuperTrend and/or 3xMA Trend, you will find if price reverses and breaks back through the Big Fat Signal line, then this can be a good reversal trade.
Some explanation about the what Hull Moving average and ideas of how the generated in Big Snapper can be used:
tradingsim.com
forextradingstrategies4u.com
Inspiration from @vdubus
Big Snapper's Bollinger OutsideIn Swing filter in Action:

Smart Money Setup 08 [TradingFinder] Binary Options Gold Scalper🔵 Introduction
In the Smart Money methodology, the market is understood as a structure driven by liquidity flow. This structure forms through the movement of large orders, the accumulation of liquidity, and the reactions that occur around key price zones. The logic of Smart Money is based on the idea that price movement is not random and usually evolves with the intention of collecting liquidity and creating price inefficiencies known as imbalances.
Within this framework, several important stages including the liquidity sweep, the formation of a point of interest, the appearance of an imbalance and the transition of market structure play major roles and collectively define the broader direction of price.
In many bullish scenarios, the market begins by sweeping sell side liquidity and targeting important lows in order to collect the liquidity resting below them. This liquidity collection often becomes the starting point for creating a point of interest which usually marks the area where Smart Money begins to enter the market.
After price moves away from this point, it breaks a structural high and forms a change of character. This shift marks a transition in the balance of power between buyers and sellers and is considered the first clear signal that the market structure is changing.
After the change of character, new institutional order flow often creates a strong and rapid movement that leaves behind an imbalance. This imbalance is one of the most important elements in Smart Money analysis because price tends to return to this area in order to complete structure and restore balance.
The return into the imbalance becomes meaningful when it occurs together with the liquidity sweep, the presence of a validated point of interest and a confirmed structural transition. These conditions frequently mark the beginning of powerful movements within the Smart Money cycle.
Understanding the sequence of liquidity, point of interest, imbalance, change of character and market structure builds the foundation of Smart Money analysis and provides a clear view of the true direction of institutional strength.
Bullish Setup :
Bearish Setup :
🔵 How to Use
To use this framework effectively, the trader must analyze the market through the principles of Smart Money and observe how liquidity drives price. A trade becomes valid only when several essential components appear together in a clear and consistent order.
These components include the liquidity sweep, the formation of a point of interest, the confirmation of a change of character, the transition of market structure and the return of price into an imbalance. The method is built on the understanding that the market first collects liquidity, then shifts order flow and finally provides an entry opportunity inside an inefficient area or inside a point of interest.
For this reason, the trader must follow the path of liquidity from the moment the sweep occurs, through the point of interest and the change of character and finally into the return of price toward the imbalance. When applied correctly, this approach creates entries that are more precise, more structural and more aligned with the real behavior of the market rather than with superficial signals.
🟣 Long Position
A bullish setup in Smart Money structure begins with a liquidity sweep on the sell side. The market first targets the areas where sell side liquidity is located and collects the stops and resting liquidity under previous lows. This collection is the condition that Smart Money requires to begin creating a new order flow. After this liquidity has been taken, a point of interest forms which is usually the last bearish candle or the effective demand zone that initiated the upward movement.
Price then moves away from the point of interest and breaks a structural high which creates a change of character. This event confirms that the market structure has moved from a bearish state to a bullish one and that buying pressure has taken control of the order flow. Following this shift, a strong upward movement often occurs and creates an imbalance between candles. This imbalance reflects the entrance of strong Smart Money orders and is seen as an important confirmation of bullish strength.
When price returns to this imbalance after the displacement, the market enters a phase where Smart Money aims to complete the corrective movement and continue the upward direction. The reaction inside the imbalance when combined with the liquidity sweep, the confirmed point of interest and the change of character completes the bullish setup and forms a structure that often leads to a continuation of the bullish trend.
🟣 Short Position
A bearish setup follows the same Smart Money logic but in the opposite direction. The market begins by collecting buy side liquidity and targets the highs where buy side liquidity and resting stops are located. This liquidity sweep on the buy side becomes the starting phase for Smart Money to initiate a downward order flow. After the liquidity is collected, a bearish point of interest forms which is usually the last bullish candle or the supply zone that created the initial drop.
Price then moves away from this point and breaks the first structural low. This creates a change of character to the downside which confirms that the market structure has transitioned from bullish to bearish and that selling pressure has gained control. After this shift, a strong downward displacement appears and leaves behind a bearish imbalance that clearly shows the dominance of sellers.
As price returns to this imbalance and corrects the inefficient movement, the bearish setup becomes complete as long as the market structure remains bearish. The combination of the buy side liquidity sweep, the bearish point of interest, the change of character, the imbalance and the corrective return creates the ideal structure that Smart Money uses to continue the downward movement and develop a reliable selling opportunity.
🔵 Settings
🟣 Logic Settings
Pivot Period : Defines how many bars are analyzed to identify swing highs and lows. Higher values detect larger, slower structures, while lower values respond to faster patterns. The default value of 5 offers a balanced sensitivity.
🟣 Alert Settings
Alert : Enables alerts for SMS08.
Message Frequency : Determines the frequency of alerts. Options include 'All' (every function call), 'Once Per Bar' (first call within the bar), and 'Once Per Bar Close' (final script execution of the real-time bar). Default is 'Once per Bar'.
Show Alert Time by Time Zone : Configures the time zone for alert messages. Default is 'UTC'.
🔵 Conclusion
The Smart Money approach demonstrates that price movement is not random or based on surface level patterns. Instead, it develops through a clear cycle of liquidity collection, structural transition and corrective movement toward key price zones. By recognizing events such as the liquidity sweep, the formation of the point of interest, the change of character and the return into the imbalance, the trader gains the ability to understand order flow more accurately and identify the true direction of market structure.
Both bullish and bearish setups show that the alignment of these elements creates a transparent view of institutional behavior and reveals the source of strong movements in the market. When the trader correctly identifies this sequence, entry points become more reliable and more aligned with liquidity flow. The combination of liquidity, structure and imbalance provides a consistent framework that removes guesswork and guides decisions through the real logic of the market.

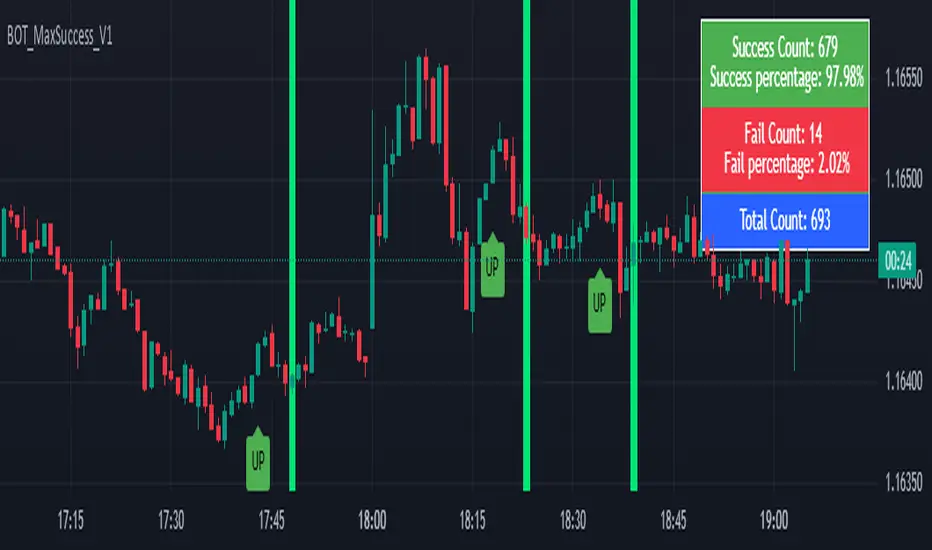
Options Trading Max Success_V1DISCLAIMER:
The information provided is NOT financial advice. I am not a financial adviser, accountant or the like. This information is purely from my own due diligence and an expression of my thoughts, my opinions based on my personal experiences, and the way I transact.
Utilize this indicator at your own risk..! The indicator creator is not liable for your loss due to untimely action / adverse consequences / server lags from Tradingview (if any).
======================================================
Welcome!
This is a 95-100% Success rate High Frequency Indicator exclusively for Binary Options Traders. It works on any time frames and pairs but is EXCLUSIVELY built for 1-minute candles for EUR/USD currency on "OANDA" forex chart. So, use it for same to get this indicator working at its best.
Use Martingale strategy (5 attempts max) for making profits / recover loss with some profits.
======================
Martingale Strategy For your knowledge with an example:
1) Lets say you are trading on binary options platform that gives 80% profit upon successful trade.
2) UP signal seen. You do the below from next candle:
a) 1st attempt = Rs.100.
- If Success, then profit = Rs.80. Cycle close and exit.
- If Loss, then do 2nd attempt.
b) 2nd attempt =Rs.200.
- If Success, then profit = Rs.160. (Rs. 100 recovery + Rs.60 Profit). Cycle close and exit.
- If Loss, then do 3rd attempt.
c) 3rd attempt = Rs. 400.
- If Success, then profit = Rs.320. (Rs. 300 recovery + Rs.20 Profit). Cycle close and exit.
- If Loss, then do 4th attempt.. and so on.
=======================
If you see any body less/Doji candle in between your attempts. Then do not continue further.
Hold this cycle for next similar stage. For example:
Select chart which promises: Success = 80% profit.
Then attempt the below on the next candle AFTER you see an UP signal.
Cycle 1: UP signal seen. 5 attempts from next candle:
Let's say:
1st attempt = Rs.100. Result = loss
2nd attempt =Rs.200. Result = loss
3rd attempt = Rs.400. Result = No profit/loss (due to Doji candle/candle without body).
Recommendation: Do not proceed further in current cycle. Hold on for next cycle/UP signal.
Park Rs.400 rupees attempt aside for a while.
Cycle 2: UP signal seen. 5 attempts from next candle:
Let's say:
1st attempt = Rs.100. Result = loss
2nd attempt =Rs.200. Result = Success
Cycle Completed. Wait for next cycle/Up signal
Cycle 3: UP signal seen. 5 attempts from next candle:
Let's say:
1st attempt = Rs.100. Result = loss
2nd attempt =Rs.200. Result = loss
3rd attempt = Now you can attempt with Rs. 800.
.
=====================
Recommendations:
- Keep a good discipline and make smart moves.
- You may add other supporting indicators of your choice along with this.
- You can keep your trading attempts low i.e. After you see an UP signal, let go the 1st one/two/three candles. If they turn out to be Red candles back to back, then good for you, as you can start entry of attempts from the 2nd/3rd/4th candle. Thereby evading one/two/three few failed attempts. If any candle gets green After Up signal and before your entry, then do not enter this cycle. Wait for next cycle.
Good luck.
================
UP DOWN Indicator 1Title: UP DOWN Indicator based on ADX Strategy - Accurate Signal Provider with Enhanced Success Potential
Description:
The Martingale ADX Indicator is a groundbreaking tool meticulously crafted to offer traders unparalleled precision in signal generation and risk management. Leveraging the power of the Average Directional Index (ADX), this indicator provides 100% non-repaint signals on the current candle, guiding traders to opportune and prepare for trade entry with remarkable accuracy.
With a focus on empowering traders across various financial markets, including Forex and Binary Options, this ADX Strategy-1 Indicator introduces a unique approach to trading dynamics. By seamlessly integrating the renowned Martingale Step-1 risk management strategy, this indicator not only minimizes losses but also enhances the potential for success, even in volatile market conditions.
Key Features:
Non-Repaint Signals: The Martingale ADX Indicator stands as a testament to reliability, offering 100% non-repaint signals. Traders can trust in the consistency and not removing losing Signals which is very important to trust the previous generated signals also, eliminating uncertainties and facilitating confident decision-making.
ADX-Based Precision: Built upon the robust framework of the Average Directional Index (ADX), this indicator delivers precise signals tailored to prevailing market trends and volatility levels. Whether trading in longer timeframes or engaging in Binary Options, traders can rely on the Martingale Step-1 ADX Indicator for superior insights.
Next Candle Trading: Seamlessly integrated into trading strategies, signals from the Martingale ADX Indicator prompt action on the subsequent candle. This real-time approach ensures traders stay ahead of market movements, seizing opportunities as they emerge. Giving Signals Once Candle ahead makes traders to prepare early and decide whether they want to enter the trade on presented Signal or not as per their own experience too. If the trading candle is loss then the very next candle shall be used for taking Martingale Sep-1 to enhance the Accuracy.
Enhanced Success Potential: With Martingale Step-1 risk management, this ADX Indicator offers more than just signal accuracy – it presents the potential for heightened success rates. Through strategic position sizing and leveraging experience and Price Action insights, traders can elevate overall accuracy to levels ranging from 80% to 90%.
Conclusion:
The UP DOWN Strategy-1 Indicator represents a paradigm shift in trading technology, combining precision signal generation with advanced risk management strategies. Whether you're a seasoned trader or just starting your journey, this indicator empowers you to navigate financial markets with confidence and achieve consistent results.
Experience the difference with the Martingale ADX Indicator – where reliability meets profitability, and success becomes attainable with every trade.
Trade wisely, and may your ventures be marked by prosperity and fulfillment.
Pardon for any descriptive language grammatical error and comment about this indicator and to get my other strategy as well. Happy trading !!
Risk Disclaimer:
Trading in financial markets carries inherent risks and should be approached with caution. It is imperative to exercise sound judgment and trade only with funds that you can afford to lose. We strongly advise against using borrowed funds for trading purposes. First practice on demo for own learning then make decision wisely.

IU Probability CalculatorHow This Script Works:
1. This script calculate the probability of price reaching a user-defined price level within one candle with the help Normal Distribution Probability Table.
2. Normal Distribution Probability Table is use for calculating probability of events, it's very powerful for calculation of probability and this script is fully based on that table.
3. It takes the Average True Range value or Standard Deviation value of past user-defined length bar.
4. After that it take this formula z = ( price_level - close ) / (ATR or Standard Deviation) and return the value for z, for the bearish side it take z = (close - price level) / (ATR or Standard Deviation ) formula.
5. Once we have the z it look into Normal Distribution Probability Table and match the value.
6. Now the value of z is multiple buy 100 in order to make it look in percentage term.
7. After that this script subtract the final value with 100 because probability always comes under 100%
8. finally we plot the probability at the bottom of the chart the red line indicates "The probability of price not reaching that price level", While the green line indicates "Probability of price Reaching that level " .
9. This script will work fine for both of the directions
How This Is Useful For The User:
1. With this script user can know the probability of price reaching the certain level within one candle for both Directions .
2. This is useful while creating options hedging strategies
3. This can be helpful for deciding stop loss level.
4. It's useful for scalpers for managing their traders and it can be use by binary option traders.

Quantum Cryptocurrency Strength Indicator (CCSI)Exciting new markets require exciting new indicators and with the plethora of cryptocurrencies now available and increasingly being offered through mainstream brokers, at Quantum Trading we thought it was time for us to step in and develop something unique to help traders and investors trading the new kids on the block.
Cryptocurrencies like their more established cousins in forex, are in a constant state of flux moving from overbought to oversold and back again, but at a much faster pace, and generally associated with volatility. The challenge of course is picking those phases of price action where these conditions have been met and so offering the trader two opportunities. Either to take a position ahead of any reversal and so get in early before the trend develops, or alternatively to wait until the trend is underway and then jump in. You can think of this as a train in the station. Do you board early before it leaves, or jump aboard once it is underway? Both approaches have advantages and disadvantages, but the choice is yours.
So, our development team set to work to deliver the perfect indicator to deliver this information for you visually and quickly, and we are proud to announce the Cryptocurrency Strength Indicator or the CCSI for short. And if you thought this looks similar to its hugely popular currency strength indicator for forex then you would be right.
This indicator is of course a little different, though the principles of how to use it can be considered the same. So how does it work? Well, first of all, here we are dealing with a cryptocurrency pair, rather than isolating out the currency itself, as every cryptocurrency is quoted against the USD in some way. In these markets we are seeing the movement of the cryptocurrency against the US dollar and in developing the indicator we have chosen to display this against Tether. In other words, USDT.
The indicator displays seven of the most popular cryptocurrencies against the USDT, but what we have also included in the design is the option to deselect these and select others of your choice, so you have complete control of those cryptocurrencies you wish to trade. In addition, we understand that alerts are a hugely popular function of the TradingView platform, so we have added these in these also. And of course, as you would expect we have included the option to isolate out those of interest. So how do we use the indicator?
First, as you might expect, the cryptocurrency market tends to move ‘en mass’ – in other words generally either moving higher or lower together. You can think of this as an equivalent to the currency matrix in forex, where currencies of one denomination, such as the yen will all move in the same direction if the yen is being bought or sold universally. It is the same here. On occasion, on the faster timeframes, one does see divergence, but as a general rule, they will all tend to move together which is great as it gives you the confidence you are trading in the direction of the entire market. What is important however is the direction of the USDT. This will ALWAYS be in the opposite direction which is why we isolate it out from the others, to reveal precisely how this is moving. Remember, what drives a strong trend is when one currency is rising and another falling in forex and it is exactly the same here. When the USDT is rising strongly and the cryptocurrencies are falling, then a strong trend is underway. Equally, if the USDT is falling strongly then you will see a strong trend in your chosen cryptocurrency.
Next, we look for overbought and oversold opportunities in precisely the same way as for the currency strength indicator. Cryptocurrencies are in a constant state of flux moving from oversold to overbought and back again in all timeframes so there are always plenty of opportunities to employ this tactic and get in early at the start of a new trend. The angle of inclination of the line reveals the strength of the move, but equally, if the cryptocurrencies are moving sideways along with the USDT then we have to wait and be patient. But the beauty of this market is that it genuinely trades twenty-four hours a day, and seven days a week. Trend trading is another great tactic and as soon as the move is underway you can jump on the moving train and join a current trend and with cryptocurrencies, you don’t normally have to wait long as the price action is constant.
However, don’t just think of the Cryptocurrency Strength Indicator as a tool for simply getting you in. It will also help you to stay in and get out at the right time. After all if it’s good enough to get you in then it’s good enough to keep you in also. But remember, when the lines are moving sideways along with the USDT, then it’s a question of being patient and waiting. In other words, it helps to keep you out too.
The indicator works in all timeframes on the TradingView platform from seconds and upwards, so all trading approaches and tactics are catered for with this indicator. It can be used with any instrument whether through a conventional broker or for trading binary options which are extremely popular, and of course cryptocurrency futures too.

RSI with Bollinger Bands Binary system by Hashtag_binaryRSI with Bollinger Bands is binary options high/low trading system based on the volatility.
- Time frame 30min - 1H
- Expiry time 2 candles
- Markets: Forex currency pairs majors: EUR/USD, USD/CHF, GBP/USD, AUD/USD, NZD/USD, EUR/JPY, USD/JPY, AUD/JPY
Rules for RSI with Bollinger Bands Binary system
- Do not start before the economic news
- We wait for the price to eitherhit the lower bollinger band or the upper bollinger band and the moment this happens we take the trade immediatly.
Buy Put:
If the price touches the lower Bollinger band we and RSI is below the 30 we take a put.
Buy Call:
If the price touches the upper Bollinger band we and RSI is above the 70 we take a call.

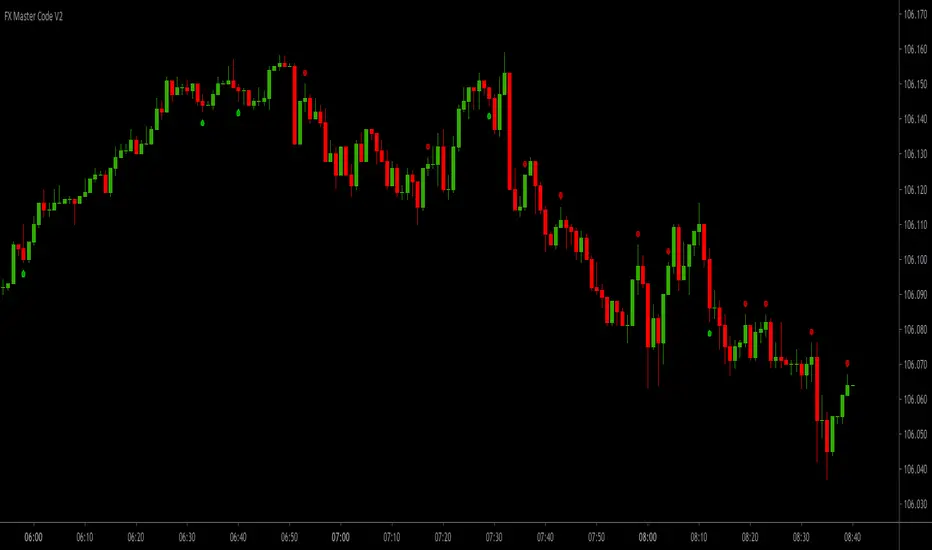
FX Master Code V2FX Master Code V2 (Non Repaint)
TradingView Account Needed: Free
Are you making the making the kind of results you want from trading right now?
Well, if the answer's no, then read this!
Even if you're a complete beginner in trading or an experienced trader, you can use these signals and alerts to start making great results.
The main goal of trading the 1-minute time frame is to make a profit through buying or selling currency pairs by holding a position for a very short period of time, and closing it for a profit.
FX Master Code will give you signals based on my proven and profitable 1-minute trading strategy.
You should be aware that this strategy will demand a certain amount of time and concentration. If you are not able to dedicate at least one hour a day to trade this strategy, then trading the 1-minute chart might not be the best strategy for you.
This is a day trading strategy suitable scalpers and binary options traders, as it involves opening a buy or sell position, gaining a few pips, and then closing the position 3 candlesticks after the signal (3 minute expiration time for binary options).
The exiting aspect of this is quantity. It is not unusual for traders to place more than +10 trades a day (and the more trades you place, the higher returns you can make).
Why not try FX Master Code and see if this system works for you?
The essence of the system will not allow for high losses. We will help you with risk management, use the best-practice risk and trade management for successful trading we give you with FX Master Code.
FX Master Code can be an extremely effective and profitable strategy – even for those who are beginners or use it purely as a supplementary strategy.
What is even better, using this strategy you are rewarded for quantitative work – the more trading you perform, the higher returns you can make.
If you want more details, the link is in the signature.
Disclaimer:
Past performance is not indicative of future performance. No representation is being made that any results discussed within the service and its related media content will be achieved. All opinions, news, research, analyses, prices or other information is provided as general market commentary and not as investment advice. TradingWalk, their members, shareholders, employees, agents, representatives and resellers do not warrant the completeness, accuracy or timeliness of the information supplied, and they shall not be liable for any loss or damages, consequential or otherwise, which may arise from the use or reliance of the TradingWalk service and its content. © 2019 TradingWalk.
TradingWalk indicators are built for TradingView. TradingWalk is on no way a part of TradingView.