Bullish and Bearish Candlestick Patterns StrategyThe strategy is a combination of candlestick pattern analysis and Fibonacci retracement levels to identify potential buy and sell signals in the market. Here's how the strategy works and how you can trade accordingly:
Candlestick Pattern Analysis:
The strategy looks for specific bullish and bearish candlestick patterns to identify potential trend reversals or continuations. The bullish patterns include:
Bullish Engulfing: This pattern occurs when a bullish candle fully engulfs the previous bearish candle.
Hammer: It is a single candlestick pattern with a small body and a long lower wick, indicating a potential bullish reversal.
Morning Star: This pattern consists of three candles, with the middle one being a small-bodied candle that gaps down and the other two being bullish candles.
The bearish patterns include:
Bearish Engulfing: Similar to the bullish engulfing, but this time, a bearish candle fully engulfs the previous bullish candle.
Shooting Star: A single candlestick pattern with a small body and a long upper wick, suggesting a potential bearish reversal.
Evening Star: This pattern is the opposite of the morning star, with a small-bodied candle that gaps up between two bearish candles.
Fibonacci Retracement Levels:
The strategy uses Fibonacci retracement levels to determine potential support and resistance levels in the market. The main level considered in this strategy is the Fibonacci 0.5 level, which is the midpoint of the previous swing move.
Trading Accordingly:
To trade using this strategy, follow these steps:
a. Observe the Chart: Apply the indicator to your preferred chart, and observe the candlestick patterns and the plotted support, resistance, and Fibonacci 0.5 levels.
b. Buy Signal: A buy signal is generated when any of the bullish candlestick patterns (Bullish Engulfing, Hammer, Morning Star) occur, and the low price of the current candle is above or equal to the Fibonacci 0.5 level. This suggests a potential bullish reversal or continuation of an existing uptrend.
c. Sell Signal: A sell signal is generated when any of the bearish candlestick patterns (Bearish Engulfing, Shooting Star, Evening Star) occur, and the high price of the current candle is below or equal to the Fibonacci 0.5 level. This indicates a potential bearish reversal or continuation of an existing downtrend.
d. Risk Management: Place stop-loss orders to protect your position in case the market moves against your trade. Consider setting the stop-loss below the recent swing low for buy trades and above the recent swing high for sell trades.
e. Take Profit: Set a target for taking profits based on your risk-reward ratio. You can use the recent swing high for buy trades as a potential target and the recent swing low for sell trades.
f. Filter Signals: Keep in mind that not all signals will result in profitable trades. It's essential to filter signals with other technical analysis tools and consider the overall market context.
Remember that no trading strategy guarantees profits, and trading always carries inherent risks. It's crucial to practice proper risk management, use appropriate position sizing, and test the strategy thoroughly in a demo environment before applying it to live trading. Additionally, consider combining this strategy with other indicators or analysis methods to make more informed .
Pesquisar nos scripts por "bear"

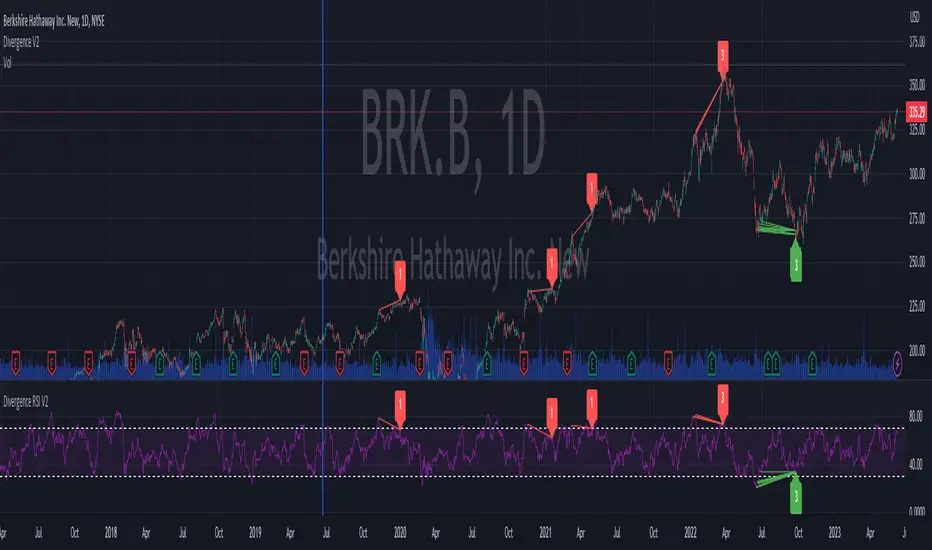
Divergence RSI V2This indicator is based on the concept of divergence. I recommend that you find out and study about this yourself as the concept of divergence will not be explained in depth in this description.
This indicator will show divergences between the asset price and the RSI oscillator. The indicator will look for divergent points between the rising highs and falling lows of the asset; and the rising lows and falling highs of the RSI.
The trend of the asset tends to follow the behavior of the oscillator when a divergence occurs. So if we find a divergence between the two, the price of the asset is likely to follow the trend of the oscillator.
This indicator looks for these types of divergences and will show (based on the RSI) if there is a bullish or bearish divergence.
If it is bullish, it will show a line joining those points in green and if it is bearish in red. In addition, it will show a label where you can see the number of occurrences that have been found from a certain point to another.
Note: this indicator can be complemented with the “Divergence V2” indicator which is also found in my library.
Settings
Backtesting Bars : is the number of bars back that the indicator will check. No more than 1000 is recommended as this will slow down the search.
Tolerance: number of times a divergent line can cross a bar. If you place 0, no bar can be crossed by a diverging line.
Min Bars To detect: will only search for divergences (or lines) that have the minimum number of bars selected in this option. Default option is 30.
Min Bars To detect: it will only search for divergences (or lines) that have the maximum number of bars selected in this option. Default option is 100.
Source Highs: The high points will be based on the close of each bar. You can use as another alternative.
Source Lows: The low points will be based on the close of each bar. You can use as another alternative.
Use squeeze parameter: only look for divergences (bullish or bearish) at times when such an indicator is in favor of the trend or coincides with the corresponding RSI divergence.
Divergence V2This indicator is based on the concept of divergence. I recommend that you find out and study about this yourself as the concept of divergence will not be explained in depth in this description.
This indicator will show divergences between the asset price and the RSI oscillator. The indicator will look for divergent points between the rising highs and falling lows of the asset; and the rising lows and falling highs of the RSI.
The trend of the asset tends to follow the behavior of the oscillator when a divergence occurs. So if we find a divergence between the two, the price of the asset is likely to follow the trend of the oscillator.
This indicator looks for these types of divergences and will show (based on the RSI) if there is a bullish or bearish divergence.
If it is bullish, it will show a line joining those points in green and if it is bearish in red. In addition, it will show a label where you can see the number of occurrences that have been found from a certain point to another.
Note: this indicator can be complemented with the “Divergence RSI V2” indicator which is also found in my library.
Settings
Backtesting Bars: is the number of bars back that the indicator will check. No more than 1000 is recommended as this will slow down the search.
Tolerance: number of times a divergent line can cross a bar. If you place 0, no bar can be crossed by a diverging line.
Min Bars To detect: will only search for divergences (or lines) that have the minimum number of bars selected in this option. Default option is 30.
Min Bars To detect: it will only search for divergences (or lines) that have the maximum number of bars selected in this option. Default option is 100.
Source Highs: The high points will be based on the close of each bar. You can use as another alternative.
Source Lows: The low points will be based on the close of each bar. You can use as another alternative.
Use squeeze parameter : only look for divergences (bullish or bearish) at times when such an indicator is in favor of the trend or coincides with the corresponding RSI divergence.

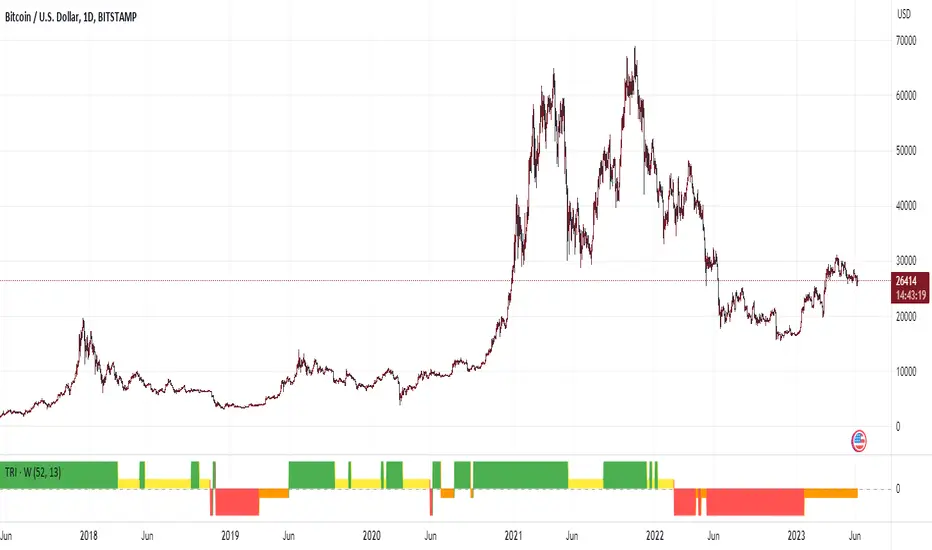
Trend Reversal Indicator (Bull/Bear)Simple indicator utilising time series momentum to identify secular/cyclical trends in asset classes. Default setting is weekly timeframe - yearly/quarterly. The indicator helps define when in bull/bear market, and corrections/rebounds within larger trends.
Long & Short / Bullish & Bearish & Neutral / Sentiment LONG and SHORT signal generation:
The LONG and SHORT signals in this script are generated based on a combination of sentiment, price strength, and volume strength calculations. The following parameters and calculations are used in determining these signals:
Sentiment:
The sentiment is calculated using a Simple Moving Average ( SMA ) of the SMO (oscillator) over a specified sentiment_length.
Price Strength:
The price strength is calculated as the percentage change in the closing price compared to the previous closing price.
Volume Strength:
The volume strength is calculated as the percentage change in the trading volume compared to the previous trading volume .
Custom Oscillator:
This oscillator is calculated as the difference between price strength and volume strength, followed by calculating its SMA over a specified strength_length.
The LONG signal is triggered when:
The sentiment_diff (difference between the oscillator and the SMA oscillator) is greater than 0, and the close price is greater than the fast EMA ( Exponential Moving Average ) of the close price, OR
The custom oscillator crosses over its SMA , and the close price is greater than the open price, and the close price of the previous period is greater than the close price of two periods ago.
The SHORT signal is triggered when:
The sentiment_diff is less than 0, and the close price is less than the fast EMA of the close price, OR
The custom oscillator crosses under its SMA , and the close price is less than the open price, and the close price of the previous period is less than the close price of two periods ago.
Color change description:
The color change in this script is based on the relationship between the close price and the highest/lowest SMAs of the high/low price over a specified lengthInputRoR. The following colors are used:
Green:
Bullish area (close price is greater than the highest SMA of the high price)
Red:
Bearish area (close price is less than the lowest SMA of the low price)
Yellow:
Neutral area (close price is between the highest and lowest SMAs of the high and low prices)
Color meaning description:
Yellow (Neutral Area):
This color indicates that the close price is between the highest and lowest SMAs of the high and low prices, signaling more caution and uncertainty in the market.
Green ( Bullish Area):
This color represents a bullish market condition where the close price is greater than the highest SMA of the high price, suggesting a higher probability of a successful LONG position.
Red ( Bearish Area):
This color signifies a bearish market condition where the close price is less than the lowest SMA of the low price, indicating a higher probability of a successful SHORT position.
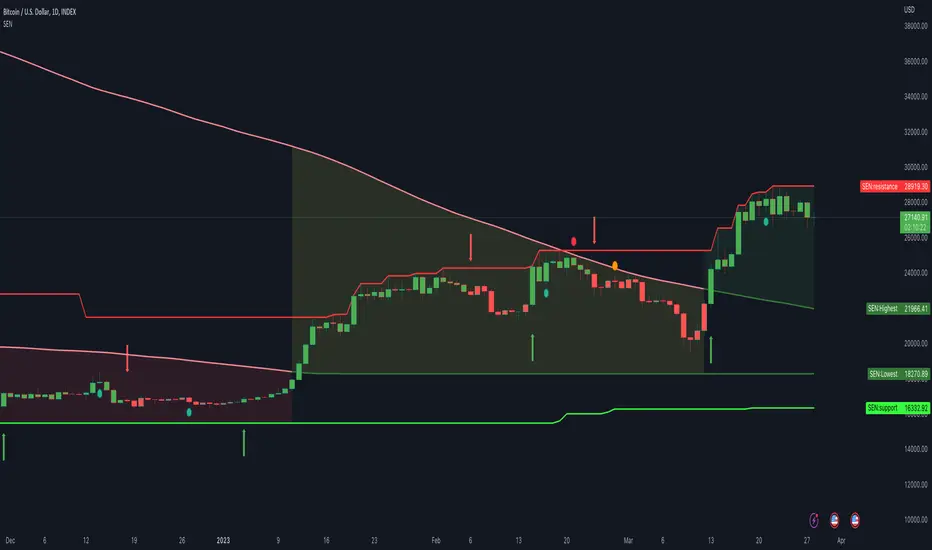
Support and Resistance lines explanation:
Support and resistance lines are calculated based on the highest and lowest prices over a specified number of periods. These lines are used to identify significant price levels where the market may experience increased buying or selling pressure.
Resistance:
The resistance line is calculated using the highest high price over a specified number of periods. This line represents a price level where selling pressure is expected to increase, making it more difficult for the price to rise further. Traders often consider resistance levels as potential entry points for SHORT positions or exit points for LONG positions.
Support:
The support line is calculated using the lowest low price over a specified number of periods. This line represents a price level where buying pressure is expected to increase, making it more difficult for the price to fall further. Traders often consider support levels as potential entry points for LONG positions or exit points for SHORT positions.
The resistance and support lines are plotted using different colors to help traders visualize the important price levels where the market may experience a reversal or consolidation.
Final Words:
This script provides LONG and SHORT signals and alerts based on a combination of sentiment, price strength, and volume strength calculations. It is designed to serve as a high-quality aid for executing well-informed trading ideas. However, it's important to note that the LONG and SHORT signals and alerts generated by this script should not be considered as trading advice. Traders should always conduct their own research and analysis before making any trading decisions. The script aims to assist in visualizing important market trends and price levels, helping traders make more informed decisions based on their personal trading strategies.
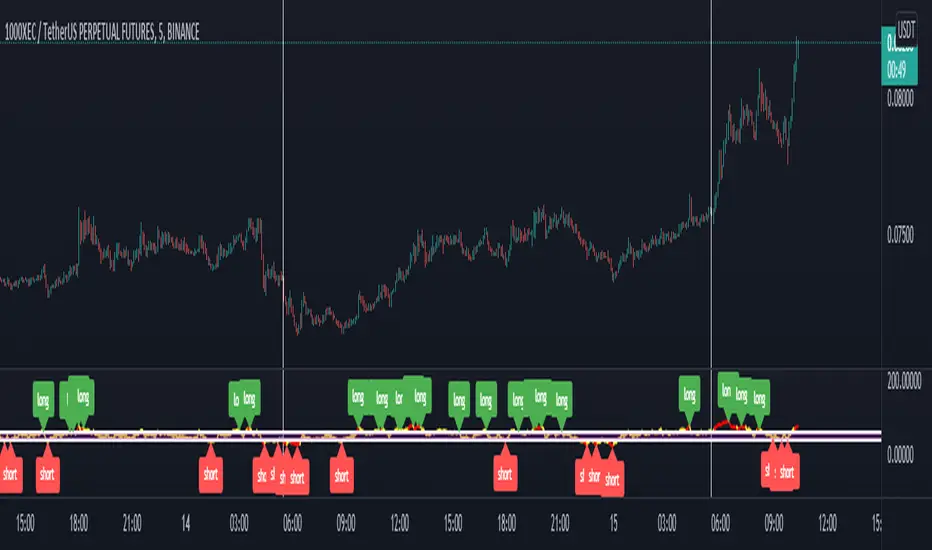
My LONG and SHORT signals and Bullish and Bearish by seatripsLONG and SHORT signal generation:
The LONG and SHORT signals in this script are generated based on a combination of sentiment, price strength, and volume strength calculations. The following parameters and calculations are used in determining these signals:
Sentiment: The sentiment is calculated using a Simple Moving Average ( SMA ) of the SMO (oscillator) over a specified sentiment_length.
Price Strength: The price strength is calculated as the percentage change in the closing price compared to the previous closing price.
Volume Strength: The volume strength is calculated as the percentage change in the trading volume compared to the previous trading volume .
Custom Oscillator: This oscillator is calculated as the difference between price strength and volume strength, followed by calculating its SMA over a specified strength_length.
The LONG signal is triggered when:
The sentiment_diff (difference between the oscillator and the SMA oscillator) is greater than 0, and the close price is greater than the fast EMA ( Exponential Moving Average ) of the close price, OR
The custom oscillator crosses over its SMA , and the close price is greater than the open price, and the close price of the previous period is greater than the close price of two periods ago.
The SHORT signal is triggered when:
The sentiment_diff is less than 0, and the close price is less than the fast EMA of the close price, OR
The custom oscillator crosses under its SMA , and the close price is less than the open price, and the close price of the previous period is less than the close price of two periods ago.
Color change description:
The color change in this script is based on the relationship between the close price and the highest/lowest SMAs of the high/low price over a specified lengthInputRoR. The following colors are used:
Green: Bullish area (close price is greater than the highest SMA of the high price)
Red: Bearish area (close price is less than the lowest SMA of the low price)
Yellow: Neutral area (close price is between the highest and lowest SMAs of the high and low prices)
Color meaning description:
Yellow (Neutral Area): This color indicates that the close price is between the highest and lowest SMAs of the high and low prices, signaling more caution and uncertainty in the market.
Green ( Bullish Area): This color represents a bullish market condition where the close price is greater than the highest SMA of the high price, suggesting a higher probability of a successful LONG position.
Red ( Bearish Area): This color signifies a bearish market condition where the close price is less than the lowest SMA of the low price, indicating a higher probability of a successful SHORT position.
Support and Resistance lines explanation:
Support and resistance lines are calculated based on the highest and lowest prices over a specified number of periods. These lines are used to identify significant price levels where the market may experience increased buying or selling pressure.
Resistance: The resistance line is calculated using the highest high price over a specified number of periods. This line represents a price level where selling pressure is expected to increase, making it more difficult for the price to rise further. Traders often consider resistance levels as potential entry points for SHORT positions or exit points for LONG positions.
Support: The support line is calculated using the lowest low price over a specified number of periods. This line represents a price level where buying pressure is expected to increase, making it more difficult for the price to fall further. Traders often consider support levels as potential entry points for LONG positions or exit points for SHORT positions.
The resistance and support lines are plotted using different colors to help traders visualize the important price levels where the market may experience a reversal or consolidation.
Final Words:
This script provides LONG and SHORT signals and alerts based on a combination of sentiment, price strength, and volume strength calculations. It is designed to serve as a high-quality aid for executing well-informed trading ideas. However, it's important to note that the LONG and SHORT signals and alerts generated by this script should not be considered as trading advice. Traders should always conduct their own research and analysis before making any trading decisions. The script aims to assist in visualizing important market trends and price levels, helping traders make more informed decisions based on their personal trading strategies.

Balance of Force (BOF)The script "Balance of Force" is an indicator that aims to provide insight into the bullish and bearish forces present in the market by analyzing the relationship between bullish and bearish true ranges. The indicator first calculates the bearish and bullish true ranges by taking the absolute difference between the open and close prices for each period and summing these values over a user-specified length. It then calculates the ratio of the bullish true range to the bearish true range and takes the natural logarithm of this value, resulting in the "bullish-bearish ratio".
The script then calculates the standard deviation of this ratio over a user-specified length to create a measure of volatility. Using this deviation and the dominant cycle, it then applies an exponential moving average to smooth the ratio. The indicator plots the smoothed ratio, the raw ratio, and the deviation of the ratio multiplied by 1, 2 and 3 in addition to filling the area between the deviation multiplied by 3 and the log(1) with red and green. The user can use the indicator to identify potential bullish or bearish market conditions by analyzing the relationship between the smoothed ratio and the log(1) and the deviation of the ratio.

Rotational Gravity OscillatorMade using elements from two Cheatcountry scripts:
Includes a Bollinger Band for bounds that forms a trend follower based on the 0 point.
Includes CheatCountry color code signals, different color scheme. Bright colors are strong signals, ark are weak, green bull, red bear, the basics.
Switches for Bollinger Band color codes, which can actually be useful signals.
This oscillator can be used for divergences, trends, signal strength, confirmation, volatility readings, you name it.
It is a comparative oscillator, that compares adaptively smoothed, weighted modified Change of Gravity oscillators between 2 symbols and multiple lengths to determine directional momentum as one asset compares to another.
The default uses the Crypto TOTAL market cap to help trade cryptocurrencies. You will notice that BTC will give sell signals in uptrends at times. That is because it is being compared to an index of the total Crypto market cap, and since alt-coins move faster, BTC will lag behind this index.
Give CheatCountry a follow, hes one of the MVPs of Tradingview Pinescripters, constantly giving us access to novel new concepts as they are published by professionals.

Quantum CDV HistogramThis script is an addition to Fixed Quantum Cdv.
It shows vector cdv ratio in columns.
You can select the length as an input to how many bars to look back for the whole calculation.
The green bars represent the bullish values and the red bars the bearish values.
The green line represents an ema of the bullish value and the red line the ema of the bearish value.
The momentum ema (in purple) represent the cdv ratio (bullish - bearish).
When the momentum ema is at 100% or more it’s a good sell opportunity and when the momentum ema is at or under 100% it’s a good buy opportunity. It is not financial advise. Make sure to make your own analysis. This script help to make entries, but do not enter positions only based on this signal.
In the inputs you can select the emas that you want to display on your histogram.
The original script is the Cumulative Delta Volume by LonesomeTheBlue.

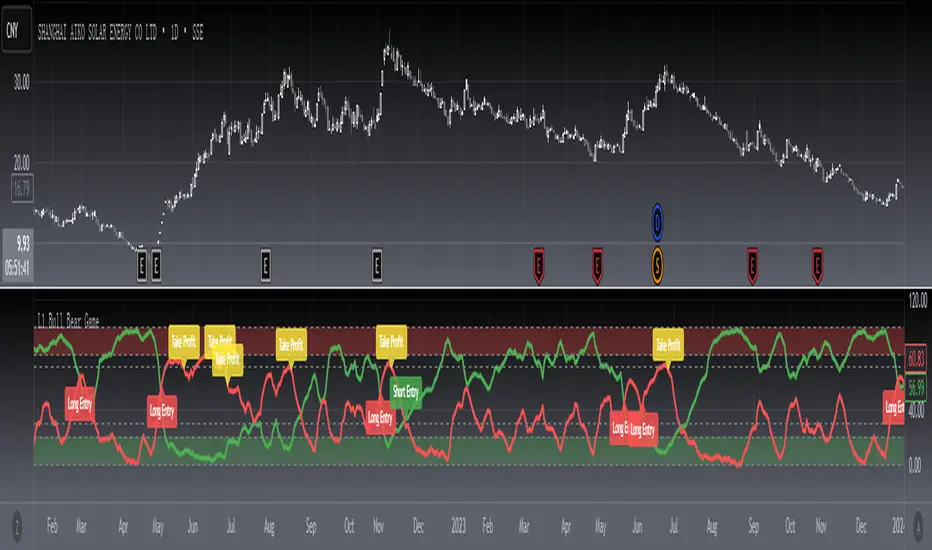
[blackcat] L3 Bull Bear GameLevel 3
Background
A bull bear banker fund game trajectories.
Function
This technical indicator draws a track diagram of the long-short power comparison through a custom trend line. The red curve represents the long line, and the green curve represents the short line. When the red line crosses the green line, it means that the upward momentum is sufficient, the whale is controlling the market, and the rise is imminent, which is a buy signal. When the red line enters the strong zone, it means that the whale is in control of the stock, and the stock is about to enter the stage of pulling up. On the contrary, if the green line turns upwards, it means that the whale is washing or retreating, and we must quickly reduce or clear the position. Sometimes when the indicator sends out a long entry signal, because the whale still has to go through a round of washing, I introduced a golden pit inflection point filter scheme, which can filter out these signals, so only when the signals appear at the same time is a long entry point signal.
Remarks
Feedbacks are appreciated.
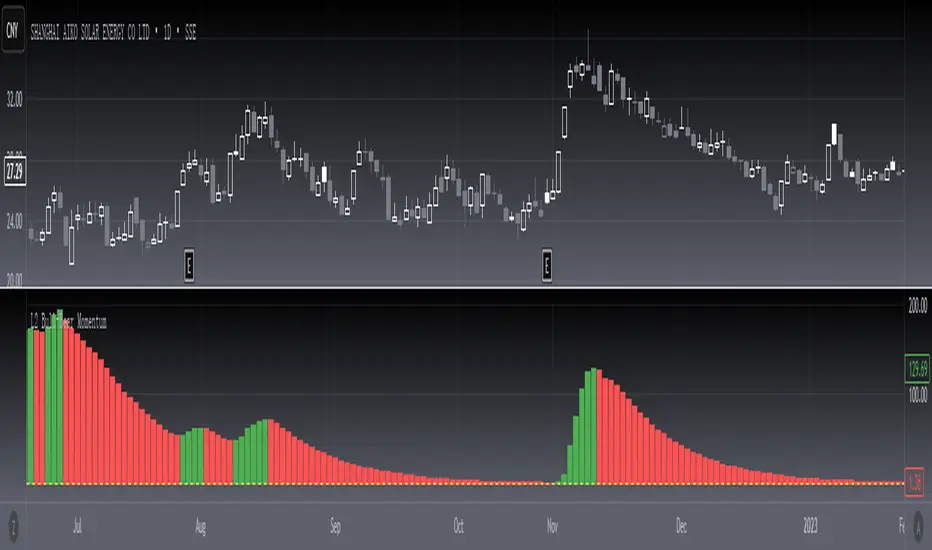
[blackcat] L2 Bull-Bear MomentumLevel 2
Background
Momentum effect is generally called "inertia effect". Momentum effect was proposed by Jegadeesh and Titman (1993), which refers to the tendency of the return rate of the stock to continue the original direction of movement, that is, the return rate of the stock with a higher return rate in the past period will still be higher than the return rate in the past low-yielding stocks.
Function
The Bullish and Bearish Momentum Technical Indicator is a strategy for buying and selling by analyzing the strength and weakness of recent price trends. Traders seek to take advantage of the rising or falling trend of stock prices. When this technical indicator indicates that the stock is entering a strong upward trend, the trader will buy the stock; Will choose to short the stock.
In short, momentum trading is trading with the trend. Momentum trading is based on the idea that if there is enough momentum behind the current price action, it will continue to move in the same direction. When an asset reaches a higher price, it usually attracts more investor attention, driving up the market price. The price rise continues until sellers start to enter the market consistently, and once sellers slowly outpace buyers, momentum weakens and the trend may reverse.
I have not marked special tags for this indicator usage. Users are expected to define according to their own understanding. On the whole, the basic usage is to start long positions when the first green column appears; when the first red column appears, close long positions or open short positions.
Remarks
Feedbacks are appreciated.
Master/Last CandleMaster/Followers: Master candle is defined as the start of a trend (bullish/bearish) and followed by a series of candles in the same direction (bullish/bearish) called followers.
Last/Reversals: Last candle is defined as the end of a trend (bullish/bearish) and followed by a series of candles in the opposite direction (bearish/bullish) called reversals.
This indicator marks master/last candle, whether it is master or last depending on the breakout direction of the next candle. Next, we have to look for support (medium/low) and resistance (medium/high) to determine the target, which is not covered here. Remember that, target must cover sell-buy spread or commission offered by broker. When the two points are taken into considered, it is that time to decide making a trade (buy/sell) or not.
Detailed prices at entry and stop loss are included in alerts.
Markets: All.
Timeframes: All.
Usage: Used in combination with support/resistance.

Current price & Daily openFor those who likes clean chart:
I made a simple script that shows Current price based on the last candle color.
Also can show Daily open line based on the daily candle color.
Daily open line is same as strong support and resistance levels.
Mostly price shows strong responces on daily open line.
1: Daily open line color is blue if current price is above the daily open line.
And daily open line is red if current price is below the daily open line.
This means blue daily open line represents bullish daily candle and red daily open line represents bearish daily candle.
Simply you can expect Buy setup on the daily open line if it is blue and vice versa. That means you are following the daily trend, nothing else.
Always double confirm with your own trading style. It's not guaranteed.
You can use this script when you want to see daily price action or to find daily high lows.
This script helps to identify the following day high and lows too on the lower timeframe.
2: When you add drawing tools on your chart price labels are overlapping or if you choose not overlap then price moves up or down so you are not able to see current price easily.
This script helps to show current price on the last candle. You can easily see the current price.
Current price color is blue when last candle is bullish and it's red when last candle is bearish .
It always calculates last candle. So it could be weekly or 1 minute candle, whatever timeframe you working on.
Thank you.

Volume Bull & BearHello Trader,
thanks to the new request.security_lower_tf()-function we are able to calculate intrabar volume. So here is my approach.
Please be aware, that the selected resolution should always be smaller than the selected chart timeframe.
You can find the exact values for bullish and bearish volume in the data window.
Hope it helps some of you :)

Money Flow Index With Bullish & Bearish SignalsMONEY FLOW INDEX WITH BULLISH AND BEARISH SIGNALS
Money Flow Index shows whether money is coming into the market or going out of the market. This can be used to gauge market sentiment and whether people are buying or selling at the current price.
***HOW TO USE***
If the MFI line is green, it is above the 50 line and in a bullish trend.
If the MFI line is red, it is below the 50 line and in a bearish trend.
If the background color is green, Money Flow is in a bullish trend, holding above the 50 line.
If the background color is red, Money Flow is in a bearish trend, holding below the 50 line.
If the MFI is above the 75 level it indicates a possible top or overbought conditions.
If the MFI is below the 25 level it indicates a possible bottom or oversold conditions.
***BULLISH/BEARISH LABELS***
There is also a label on the right side that tells you whether the overall trend is bullish or bearish, if there is a possible bottom or top and if the current money flow index is going up or down. This table updates in real time and changes colors so you can get an easy, quick interpretation of the current money flow without having to look at the data so you can make faster decisions on whether to enter or exit a trade. The flashing from red to green or the opposite also grabs your attention so you know immediately if there is a change in trend. The table changes colors in sync with the MFI line and it's trends and bottom/top areas. Green means money is coming in. Red means money is going out. Blue means a neutral amount of money flow.
***MARKETS***
This indicator can be used as a signal on all markets, including stocks, crypto, futures and forex.
***TIMEFRAMES***
This Money Flow Index indicator can be used on all timeframes.
***TIPS***
Try using numerous indicators of ours on your chart so you can instantly see the bullish or bearish trend of multiple indicators in real time without having to analyze the data. Some of our favorites are our Auto Fibonacci, DMI, Momentum, Auto Support And Resistance and Volume Profile in combination with this Money Flow Index. They all have real time Bullish and Bearish labels as well so you can immediately understand each indicator's trend.

Bull Bear Momentum (MYTRIC)█ What market information does this indicator tell you ?
Bull Bear Momentum(BBM) indicator is a combination of leading + lagging indicator.
• Leading Indicator are used to predict the next movement.
• Lagging Indicator are used to show the current movement.
The main purpose of BBM is to measure the factors that affect the rise and fall of stock prices, and thereby increase confidence on your trading.
We use an unique algorithm to separate the movement of each candlestick in the market to calculate the individual momentums between buyer and seller.
By using BBM, you will be able to know whether the current market is leading by buyers or sellers, and know what is the current trend.
Below is the function of indicator.
1 - The battle between buyers & sellers ⚔️
Momentum Balancing
【🟦 Buyer Leading The Market / 🟨 Seller Leading The Market】
2 - Buyer & Seller active 🔥 or inactive
【🟩 Buyer active / 🟥 Seller active】
3 - Buyer & Seller momentum strength 💪
BBM has a value between -20 to +50 and is used to measure the strength of current trend.
-20 ~ -10 = Very Weak Momentum
-09 ~ -05 = Weak Momentum
-04 ~ +00 = Lower Neutral Momentum (Downward Sideway / Ranging Market)
+00 ~ +05 = Upper Neutral Momentum (Upward Sideway / Ranging Market)
+06 ~ +15 = Strong Momentum
+16 ~ +50 = Very Strong Momentum
4 - AD Osc / Risk Osc (same as DT Smart Trend AD Osc)
██████████████████████████████████████████████████████████████████████████████████████████████████████████████████████
——————————————————————————————————————————————————————————————————————————————————————————————————————————————————
█ Benefits & Features
✅ Momentum Balancing
Momentum balancing is measure combination of momentums between buyer and seller
——————————————————————————————————————————————————————————————————————————————————————————————————————————————————
✅ Buyer & Seller / Bull & Bear Momentum
Analyze the momentums of the buyer and seller individually
🟩 Buyer Momentums
• 🟩 Buyer Momentums Active 🔥
• ⬜ Buyer Momentums inactive
🟥 Seller Momentums
• 🟥 Seller Momentums Active 🔥
• ⬜ Seller Momentums inactive
——————————————————————————————————————————————————————————————————————————————————————————————————————————————————
✅ Risk Oscillator / Accumulation & Distribution Oscillator
██████████████████████████████████████████████████████████████████████████████████████████████████████████████████████
——————————————————————————————————————————————————————————————————————————————————————————————————————————————————
█ CASE STUDY
*Length setting default as "10", this value determines the period of the algorithm.
The more common settings are 10 or 60.
Below settings are recommended for different trading style.
• Short-term trader / Swing trader = 8 ~ 14
• Mid-term trader = 20 ~ 60
• Long-term trader = 60 and above
• Example 01 (Downtrend) * We do not recommend trading in a downtrend, it is only suitable for swing trade or batch investment
• Example 02 (Weak Trend)
• Example 03 (Strong Trend)
██████████████████████████████████████████████████████████████████████████████████████████████████████████████████████
——————————————————————————————————————————————————————————————————————————————————————————————————————————————————
█ CASE STUDY OF DIVERGENCE ANALYSIS
• Ex 01
• Ex 02
██████████████████████████████████████████████████████████████████████████████████████████████████████████████████████
——————————————————————————————————————————————————————————————————————————————————————————————————————————————————
█ How to find super-trend by using BBM?
*Length setting change to "60"
1. Superbull (Potential Rate 90%) 🐮
• Buyer's momentum must greater than 10 = Strong Trend 🟩; in the meantime Seller's Momentum smaller than -5 = Weak Trend ⬜
• The potential for stock prices to rise 📈 is very large, which is 90% and above, refer example below.
2. Superbear (Potential Rate 90%) 🐻
• Seller's momentum must greater than 10 = Strong Trend 🟥; in the meantime Buyer's Momentum smaller than 0 = Weak Trend ⬜
• The potential for stock prices to fall 📉 is very large, which is 90% and above, refer example below.
• Example 01
• Example 02
• Example 03

20 SMA based Bull/Bear sentiment indicatorThis script is only doing one thing, plots the 20 SMA and based on whether the asset's price is above or below of the SMA it changes the color of the SMA and the background's color.
Helping it to visualize whether from the 20 SMA's point of view we are in a Bull or a Bear trend.
I created this because I myself use this SMA with Bitcoin on the weekly time frame to identify the macro trend on the weekly.
IMO this is a good crypto market sentiment indicator.

The Namib SpikeThank you to Karl S who coded my idea. Below are the trigger conditions. Testing would be welcomed. I have not looked at the effectivity on higher or lower timeframes. Feedback highly appreciated.
A 3-tiered alert/notification system:
Level 1 Alert (Pop-up notification "Level 1 Bullish Alert" or "Level 1 Bearish Alert"
1. Determine bullish or bearish trend of price above or below 200 EMA
2. RSI level (customizable level)
3. ADX (customizable level as well as option to filter that the current ADX value is higher/lower as 1,2,3,4,or 5 candles ago)
AND/OR
Level 2 Alert (Pop-up notification "Level 2 Bullish Alert" or "Level 2 Bearish Alert"
1. Determine bullish or bearish trend of price above or below 200 EMA
2. RSI level (customizable level)
3. ADX (customizable level as well as option to filter that the current ADX value is higher/lower as 1,2,3,4,or 5 candles ago)
4. Higher Timeframe trends for 2 higher Timeframes (price above/below 200EMA) agrees with current Timeframe
AND/OR
Level 3 Alert (Pop-up notification "Level 3 Bullish Alert" or "Level 3 Bearish Alert"
1. Determine bullish or bearish trend of price above or below 200 EMA
2. RSI level (customizable level)
3. ADX (customizable level as well as option to filter that the current ADX value is higher/lower as 1,2,3,4,or 5 candles ago)
4. Higher Timeframe trends for 2 higher Timeframes (price above/below 200EMA) agrees with current Timeframe
5. Percentage (customizable) from previous H1/H4/D1/W1's (customizable) high & low prices

NSDT Bearish-Bullish CandlesThis is another interesting take on candlesticks . These Bearish-Bullish Candles do not show the wicks. Instead, the upper wick is made into a Red body and the lower wick is made into a Green body. If you match the candle body color in the chart settings (or turn off the candles completely), you get a unique way of seeing how Bearish or how Bullish a candle is because the wick will now match the body size and color.
This indicator is very similar to our NSDT Special High-Low Candles.

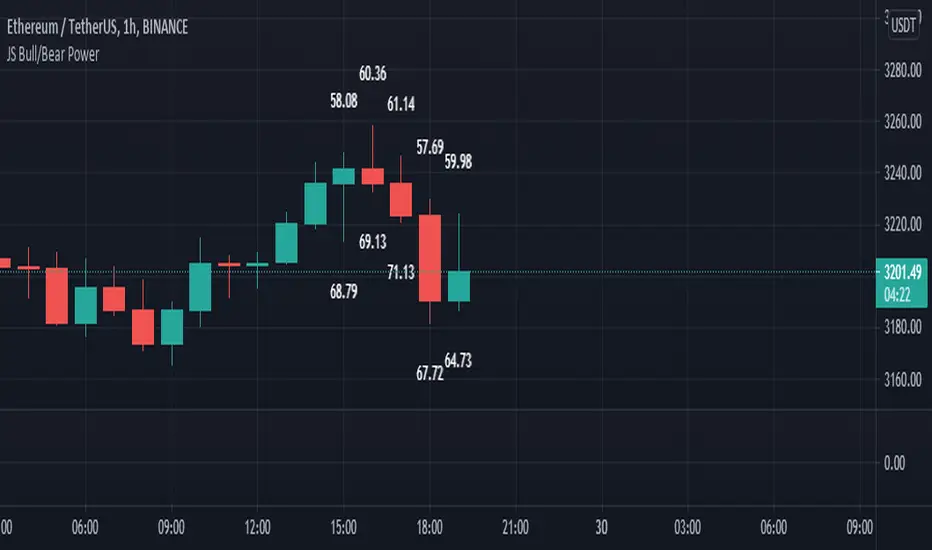
JS Bull/Bear PowerI created this Indicator for all chart lovers.
This Indicator measures the wick parts of candles and sum it up. Wick part of candle is a sign of strength that's why it measures the 60 bars of candles wick. then sum it up and converted it in percentage. The output is indicated in the last 10 candles. that's how simple this indicator is but very useful to analyze the strength of every candles.
The upper numbers is the bear power.
The lower numbers is the bull power.
Happy Trading
Harmonic Pattern Educational Volume 0 (Source Code)This indicator was intended as educational purpose only for Harmonic Patterns using XABCD Pattern Tool.
Gartley and Butterfly patterns were ideal patterns explained from The Harmonic Trader written by Scott M Carney.
Some values are further updated later in Harmonic Trading: Volume Three, also by Scott M Carney.
The Harmonic Trader book was also known as Harmonic Trading: Volume Zero.
Usually Bullish Patterns show as "M" shape while Bearish Patterns show as "W" shape.
";" indicates range, example : 1.27;1.618 meaning that value between 1.27 to 1.618.
Indikator ini bertujuan sebagai pendidikan sahaja untuk Harmonic Pattern menggunakan XABCD Pattern Tool.
Pattern Gartley dan Butterfly, juga sebagai pattern ideal telah diterangkan dari buku The Harmonic Trader ditulis oleh Scott M Carney.
Beberapa nilai kemudiannya telah dikemaskini dalam Harmonic Trading: Volume Three, juga oleh Scott M Carney.
Buku The Harmonic Trader book juga dikenali sebagai Harmonic Trading: Volume Zero.
Kebiasaanya Bullish Pattern tunjuk sebagai bentuk "M" manakala Bearish Pattern tunjuk sebagai bentuk "W".
";" menunjukkan range, contoh : 1.27;1.618 bermaksud nilai 1.27 hingga 1.618.
Indicator features :
1. List XAB=CD patterns including ratio and reference page.
2. For desktop display only, not for mobile.
Kemampuan indikator :
1. Senarai XAB=CD pattern termasuk ratio and rujukan muka surat.
2. Untuk paparan desktop sahaja, bukan untuk mobile.
FAQ
1. Credits / Kredit
Scott M Carney, The Harmonic Trader
2. Pattern and Chapter involved / Pattern dan Bab terlibat
Bullish Ideal Gartley - Page 160
Bearish Ideal Gartley - Page 171
Bullish Ideal Butterfly - Page 194
Bearish Ideal Butterfly - Page 204
3. Code Usage / Penggunaan Kod
Free to use for personal usage but credits are most welcomed especially for credits to Scott M Carney.
Bebas untuk kegunaan peribadi tetapi kredit adalah amat dialu-alukan terutamanya kredit kepada Scott M Carney.
Bullish (M) / Bearish (W) Ideal Gartley
Bullish (M) / Bearish (W) Ideal Butterfly

Percentage Oscillator SwingThe percentage price oscillator (PPO) is a technical momentum indicator.
It shows the relationship between the close of a candle and the highest/lowest point with a specific lenght in percentage terms.
Rules
The higher percentage on the values upwards, compared to those downwards, the higher the power of the bull trend.
The higher percentage on the values downwards, compared to those upwards, the higher the power of the bear trend.
