Ichimoku Crosses_RSI_AITIchimoku Crosser_RSI_AIT
Overview
The "Ichimoku Cloud Crosses_AIT" strategy is a technical trading strategy that combines the Ichimoku Cloud components with the Relative Strength Index (RSI) to generate trade signals. This strategy leverages the crossovers of the Tenkan-sen and Kijun-sen lines of the Ichimoku Cloud, along with RSI levels, to identify potential entry and exit points for long and short trades. This guide explains the strategy components, conditions, and how to use it effectively in your trading.
1. Strategy Parameters
User Inputs
Tenkan-sen Period (tenkanLength): Default value is 21. This is the period used to calculate the Tenkan-sen line (conversion line) of the Ichimoku Cloud.
Kijun-sen Period (kijunLength): Default value is 120. This is the period used to calculate the Kijun-sen line (base line) of the Ichimoku Cloud.
Senkou Span B Period (senkouBLength): Default value is 52. This is the period used to calculate the Senkou Span B line (leading span B) of the Ichimoku Cloud.
RSI Period (rsiLength): Default value is 14. This period is used to calculate the Relative Strength Index (RSI).
RSI Long Entry Level (rsiLongLevel): Default value is 60. This level indicates the minimum RSI value for a long entry signal.
RSI Short Entry Level (rsiShortLevel): Default value is 40. This level indicates the maximum RSI value for a short entry signal.
2. Strategy Components
Ichimoku Cloud
Tenkan-sen: A short-term trend indicator calculated as the simple moving average (SMA) of the highest high and the lowest low over the Tenkan-sen period.
Kijun-sen: A medium-term trend indicator calculated as the SMA of the highest high and the lowest low over the Kijun-sen period.
Senkou Span A: Calculated as the average of the Tenkan-sen and Kijun-sen, plotted 26 periods ahead.
Senkou Span B: Calculated as the SMA of the highest high and lowest low over the Senkou Span B period, plotted 26 periods ahead.
Chikou Span: The closing price plotted 26 periods behind.
Relative Strength Index (RSI)
RSI: A momentum oscillator that measures the speed and change of price movements. It ranges from 0 to 100 and is used to identify overbought or oversold conditions.
3. Entry and Exit Conditions
Entry Conditions
Long Entry:
The Tenkan-sen crosses above the Kijun-sen (bullish crossover).
The RSI value is greater than or equal to the rsiLongLevel.
Short Entry:
The Tenkan-sen crosses below the Kijun-sen (bearish crossover).
The RSI value is less than or equal to the rsiShortLevel.
Exit Conditions
Exit Long Position: The Tenkan-sen crosses below the Kijun-sen.
Exit Short Position: The Tenkan-sen crosses above the Kijun-sen.
4. Visual Representation
Tenkan-sen Line: Plotted on the chart. The color changes based on its relation to the Kijun-sen (green if above, red if below) and is displayed with a line width of 2.
Kijun-sen Line: Plotted as a white line with a line width of 1.
Entry Arrows:
Long Entry: Displayed as a yellow triangle below the bar.
Short Entry: Displayed as a fuchsia triangle above the bar.
5. How to Use
Apply the Strategy: Apply the "Ichimoku Cloud Crosses_AIT" strategy to your chart in TradingView.
Configure Parameters: Adjust the strategy parameters (Tenkan-sen, Kijun-sen, Senkou Span B, and RSI settings) according to your trading preferences.
Interpret the Signals:
Long Entry: A yellow triangle appears below the bar when a long entry signal is generated.
Short Entry: A fuchsia triangle appears above the bar when a short entry signal is generated.
Monitor Open Positions: The strategy automatically exits positions based on the defined conditions.
Backtesting and Live Trading: Use the strategy for backtesting and live trading. Adjust risk management settings in the strategy properties as needed.
Conclusion
The "Ichimoku Cloud Crosses_AIT" strategy uses Ichimoku Cloud crossovers and RSI to generate trading signals. This strategy aims to capture market trends and potential reversals, providing a structured way to enter and exit trades. Make sure to backtest and optimize the strategy parameters to suit your trading style and market conditions before using it in a live trading environment.
Pesquisar nos scripts por "bar"

HFT V.2 EnhancedTitle: HFT V.2 Enhanced - ATR Dynamic Stop-Loss & Take-Profit
Description:
The HFT V.2 Enhanced strategy is designed for high-frequency trading with dynamic trade management and robust entry/exit logic. This strategy uses simple moving averages (SMA) for trend identification and the relative strength index (RSI) for momentum confirmation. In this enhanced version, the strategy also incorporates dynamic stop-loss and take-profit levels based on the Average True Range (ATR), offering better adaptability to market volatility.
Features:
Moving Average Crossover: Uses a fast and slow SMA to capture trend reversals and generate trade entries.
RSI Confirmation: Ensures momentum is in the direction of the trade by incorporating the RSI threshold for both long and short entries.
Dynamic Stop-Loss and Take-Profit: Stop-loss and take-profit levels are calculated based on the ATR, allowing the strategy to adjust its exit points according to market volatility. This helps manage risk more effectively and capture larger trends.
Auto-Close Opposing Positions: Automatically closes any open long positions when a short entry is triggered, and vice versa.
Once-Per-Bar Execution: Ensures that a position is entered only once per bar, avoiding multiple trades within the same bar.
Parameters:
Fast MA Length: Defines the length of the fast-moving average.
Slow MA Length: Defines the length of the slow-moving average.
RSI Length: Sets the period for the RSI indicator.
RSI Threshold: Controls the RSI level for confirming momentum (50 by default).
ATR Length: Determines the period for the ATR calculation.
ATR Multiplier for Stop-Loss/Take-Profit: Adjusts the sensitivity of the stop-loss and take-profit levels based on ATR.
How it Works:
Long Entry: The strategy opens a long trade when the fast SMA crosses above the slow SMA, and the RSI is above the user-defined threshold. A dynamic stop-loss is placed below the entry price, and a take-profit target is set based on ATR.
Short Entry: The strategy opens a short trade when the fast SMA crosses below the slow SMA, and the RSI is below the inverse threshold. A stop-loss is placed above the entry price, and a take-profit target is set using ATR.
Risk Management: The strategy adapts to changing market conditions by dynamically adjusting its stop-loss and take-profit levels, ensuring it remains responsive to market volatility.
This script is ideal for traders looking for a high-frequency strategy with advanced trade management, including dynamic exits and volatility-based risk management.
Disclaimer: Always backtest and optimize the parameters to fit your trading style and risk tolerance before using the strategy in live trading.

Varanormal Mac N Cheez Strategy v1Mac N Cheez Strategy (Set a $200 Take profit Manually)
It's super cheesy. Strategy does the following:
Here's a detailed explanation of what the entire script does, including its key components, functionality, and purpose.
1. Strategy Setup and Input Parameters:
Strategy Name: The script is named "NQ Futures $200/day Strategy" and is set as an overlay, meaning all elements (like moving averages and signals) are plotted on the price chart.
Input Parameters:
fastLength: This sets the length of the fast moving average. The user can adjust this value, and it defaults to 9.
slowLength: This sets the length of the slow moving average. The user can adjust this value, and it defaults to 21.
dailyTarget: The daily profit target, which defaults to $200. If set to 0, this disables the daily profit target.
stopLossAmount: The fixed stop-loss amount per trade, defaulting to $100. This value is used to calculate how much you're willing to lose on a single trade.
trailOffset: This value sets the distance for a trailing stop. It helps protect profits by automatically adjusting the stop-loss as the price moves in your favor.
2. Calculating the Moving Averages:
fastMA: The fast moving average is calculated using the ta.sma() function on the close price with a period length of fastLength. The ta.sma() function calculates the simple moving average.
slowMA: The slow moving average is also calculated using ta.sma() but with the slowLength period.
These moving averages are used to determine trend direction and identify entry points.
3. Buy and Sell Signal Conditions:
longCondition: This is the buy condition. It occurs when the fast moving average crosses above the slow moving average. The script uses ta.crossover() to detect this crossover event.
shortCondition: This is the sell condition. It occurs when the fast moving average crosses below the slow moving average. The script uses ta.crossunder() to detect this crossunder event.
4. Executing Buy and Sell Orders:
Buy Orders: When the longCondition is true (i.e., fast MA crosses above slow MA), the script enters a long position using strategy.entry("Buy", strategy.long).
Sell Orders: When the shortCondition is true (i.e., fast MA crosses below slow MA), the script enters a short position using strategy.entry("Sell", strategy.short).
5. Setting Stop Loss and Trailing Stop:
Stop-Loss for Long Positions: The stop-loss is calculated as the entry price minus the stopLossAmount. If the price falls below this level, the trade is exited automatically.
Stop-Loss for Short Positions: The stop-loss is calculated as the entry price plus the stopLossAmount. If the price rises above this level, the short trade is exited.
Trailing Stop: The trail_offset dynamically adjusts the stop-loss as the price moves in favor of the trade, locking in profits while still allowing room for market fluctuations.
6. Conditional Daily Profit Target:
The script includes a daily profit target that automatically closes all trades once the total profit for the day reaches or exceeds the dailyTarget.
Conditional Logic:
If the dailyTarget is greater than 0, the strategy checks whether the strategy.netprofit (total profit for the day) has reached or exceeded the target.
If the strategy.netprofit >= dailyTarget, the script calls strategy.close_all(), closing all open trades for the day and stopping further trading.
If dailyTarget is set to 0, this logic is skipped, and the script continues trading without a daily profit target.
7. Plotting Moving Averages:
plot(fastMA): This plots the fast moving average as a blue line on the price chart.
plot(slowMA): This plots the slow moving average as a red line on the price chart. These help visualize the crossover points and the trend direction on the chart.
8. Plotting Buy and Sell Signals:
plotshape(): The script uses plotshape() to add visual markers when buy or sell conditions are met:
"Long Signal": When a buy condition (longCondition) is met, a green marker is plotted below the price bar with the label "Long".
"Short Signal": When a sell condition (shortCondition) is met, a red marker is plotted above the price bar with the label "Short".
These markers help traders quickly see when buy or sell signals occurred on the chart.
In addition, triangle markers are plotted:
Green Triangle: Indicates where a buy entry occurred.
Red Triangle: Indicates where a sell entry occurred.
Summary of What the Script Does:
Inputs: The script allows the user to adjust moving average lengths, daily profit targets, stop-loss amounts, and trailing stop offsets.
Signals: It generates buy and sell signals based on the crossovers of the fast and slow moving averages.
Order Execution: It executes long positions on buy signals and short positions on sell signals.
Stop-Loss and Trailing Stop: It sets dynamic stop-losses and uses a trailing stop to protect profits.
Daily Profit Target: The strategy stops trading for the day once the net profit reaches the daily target (unless the target is disabled by setting it to 0).
Visual Markers: It plots moving averages and buy/sell signals directly on the main price chart to aid in visual analysis.
This script is designed to trade based on moving average crossovers, with robust risk management features like stop-loss and trailing stops, along with an optional daily profit target to limit daily trading activity. Let me know if you need further clarification or want to adjust any specific part of the script!

Combo 2/20 EMA & CCI
This is another part of my research work, where I test a combination of two strategies, receiving a combined signal. In order to understand which indicator combinations work better, which work worse, as filters for trades. This is combo strategies for get a cumulative signal.
First strategy
This indicator plots 2/20 exponential moving average. For the Mov Avg X 2/20 Indicator, the EMA bar will be painted when the Alert criteria is met.
Second strategy
The Commodity Channel Index (CCI) is best used with markets that display cyclical or seasonal characteristics, and is formulated to detect the beginning and ending of the cycles by incorporating a moving average together with a divisor that reflects both possible and actual trading ranges. The final index measures the deviation from normal, which indicates major changes in market trend.
Strategy tester settings:
Initial capital: 1000
Order size: 0.5
Commission: 0.1%
Other as default.
Indicator settings:
EMA Length: 50
CCI Length: 10
Fast MA Length: 15
Slow MA Length: 20
Other as default.
WARNING:
- For purpose educate only
- This script to change bars colors.

Scalper Bot [SMRT Algo]The SMRT Algo Bot is a trading strategy designed for use on TradingView, enabling traders to backtest and refine their strategies with precision. This bot is built to provide key performance metrics through TradingView’s strategy tester feature, offering insights such as net profit, maximum drawdown, profit factor, win rate, and more.
The SMRT Algo Bot is versatile, allowing traders to execute either pro-trend or contrarian strategies, each with customizable parameters to suit individual trading styles.
Traders can automate the bot to their brokerage platform via webhooks and use third-party software to facilitate this.
Core Features:
Backtesting Capabilities: The SMRT Algo Bot leverages TradingView’s powerful strategy tester, allowing traders to backtest their strategies over historical data. This feature is crucial for assessing the viability of a strategy before deploying it in live markets. By providing metrics such as net profit, maximum drawdown, profit factor, and win rate, traders can gain a comprehensive understanding of their strategy's performance, helping them to make informed decisions about potential adjustments or optimizations.
Advanced Take Profit and Stop Loss Methods: The SMRT Algo Bot offers multiple methods for setting Take Profit (TP) and Stop Loss (SL) levels, providing flexibility to match different market conditions and trading strategies.
Take Profit Methods:
- Normal (Percent-based): Traders can set their TP levels as a percentage. This method adjusts the TP dynamically based on market volatility, allowing for more responsive profit-taking in volatile markets.
- Donchian Channel: Alternatively, the bot can use the Donchian Channel to set TP levels, which is particularly useful in trend-following strategies. The Donchian Channel identifies the highest high and lowest low over a specified period, providing a clear target for profit-taking when prices reach extreme levels.
Stop Loss Methods:
- Percentage-Based Stop Loss: This method allows traders to set a fixed percentage of the entry price as the stop loss. It provides a straightforward, static risk management approach that is easy to implement.
- Normal (Percent-based): Traders can set their SL levels as a percentage. This method adjusts the SL dynamically based on market volatility, allowing for more responsive profit-taking in volatile markets.
- ATR Multiplier: Similar to the TP method, the SL can also be set using a multiple of the ATR.
Pro-Trend and Contrarian Strategies: The SMRT Algo Bot is designed to execute either pro-trend or contrarian trading strategies, though only one can be active at any given time.
Pro-Trend Strategy: This strategy aligns with the prevailing market trend, aiming to capitalize on the continuation of current price movements. It is particularly effective in trending markets, where momentum is expected to carry the price further in the direction of the trend.
Contrarian Strategy: In contrast, the contrarian strategy seeks to exploit potential reversals or corrections, trading against the prevailing trend. This approach is more suitable in overextended markets where a pullback is anticipated. Traders can switch between these strategies based on their market outlook and trading style.
Dashboard Display: A dashboard located in the bottom right corner of the TradingView interface provides real-time updates on the bot’s performance metrics. This includes key statistics such as net profit, drawdown, profit factor, and win rate, specific to the current instrument being tested. This immediate access to performance data allows traders to quickly assess the effectiveness of the strategy and make necessary adjustments on the fly.
Input Settings:
Reverse Signals: If turned on, buy trades will be shown as sell trades, etc.
Show Signal (Bar Color): Shows the signal bar as a green candle for buy or red candle for sell.
RSI: Used as a filter for one of the conditions for trade. Can be turned on/off by clicking on the checkbox.
Timeframe: Affects the timeframe of RSI filter.
Length: Length of RSI used in measurement.
First Cross: Whether or not to factor in the first RSI cross in the calculation.
Buy/Sell (Above/Below): Look for trades if RSI is above or below these values.
EMA: Used as a trend filter for one of the conditions for trade. Can be turned on/off by clicking on the checkbox.
Timeframe: Affects the timeframe of EMA filter.
Fast Length: Value for the fast EMA.
Middle Length: Value for the middle EMA
Slow Length: Value for the slow EMA.
ADX: Used as a volatility filter for one of the conditions for trade. Can be turned on/off by clicking on the checkbox.
Threshold: Threshold value for ADX.
ADX Smoothing: Smoothing value for the ADX
DI Length: DI length value for the ADX.
Donchian Channel Length: This value affects the length value of the DC. Used in TP calculation.
Close Trade On Opposite Signal: If true, the current trade will close if an opposite trade appears.
RSI: If turned on, it will also use the RSI to exit the trade (overextended zones).
Take Profit Option: Choose between normal (percentage-based) and Donchian Channel options.
Stop Loss Option: Choose between normal (percentage-based) and Donchian Channel options.
The SMRT Algo Bot’s components are designed to work together seamlessly, creating a comprehensive trading solution. Whether using the ATR multiplier for dynamic adjustments or the Donchian Channel for trend-based targets, these methods ensure that trades are managed effectively from entry to exit. The ability to switch between pro-trend and contrarian strategies offers adaptability, enabling traders to optimize their approach based on market behavior. The real-time dashboard ties everything together, providing continuous feedback that informs strategic adjustments.
Unlike basic or open-source bots, which often lack the flexibility to adapt to different market conditions, the SMRT Algo Bot provides a robust and dynamic trading solution. The inclusion of multiple TP and SL methods, particularly the ATR and Donchian Channel, adds significant value by offering traders tools that can be finely tuned to both volatile and trending markets.
The SMRT Algo Suite, which the SMRT Algo Bot is a part of, offers a comprehensive set of tools and features that extend beyond the capabilities of standard or open-source indicators, providing significant additional value to users.
What you also get with the SMRT Algo Suite:
Advanced Customization: Users can customize various aspects of the indicator, such as toggling the confirmation signals on or off and adjusting the parameters of the MA Filter. This customization enhances the adaptability of the tool to different trading styles and market conditions.
Enhanced Market Understanding: The combination of pullback logic, dynamic S/R zones, and MA filtering offers traders a nuanced understanding of market dynamics, helping them make more informed trading decisions.
Unique Features: The specific combination of pullback logic, dynamic S/R, and multi-level TP/SL management is unique to SMRT Algo, offering features that are not readily available in standard or open-source indicators.
Educational and Support Resources: As with other tools in the SMRT Algo suite, this indicator comes with comprehensive educational resources and access to a supportive trading community, as well as 24/7 Discord support.
The educational resources and community support included with SMRT Algo ensure that users can maximize the indicators’ potential, offering guidance on best practices and advanced usage.
SMRT Algo believe that there is no magic indicator that is able to print money. Indicator toolkits provide value via their convenience, adaptability and uniqueness. Combining these items can help a trader make more educated; less messy, more planned trades and in turn hopefully help them succeed.
RISK DISCLAIMER
Trading involves significant risk, and most day traders lose money. All content, tools, scripts, articles, and educational materials provided by SMRT Algo are intended solely for informational and educational purposes. Past performance is not indicative of future results. Always conduct your own research and consult with a licensed financial advisor before making any trading decisions.

Self Optimizing RSI and Self Adaptive TP/SL [Starbots]Self Optimizing RSI and Self Adaptive TP/SL Strategy. (non-repainting)
This script continuously backtests 20 different combinations of RSI Buy conditions across 5 different Take Profit/Stop Loss combinations. In total, it tests 100 variants on every bar close and records the Net Profit gained for each combination. The strategy then selects and uses the best-performing combination of settings currently available for you to trade.
---------------------------------------------------------------------------------------------------------
The Relative Strength Index (RSI), developed by J. Welles Wilder, is a momentum oscillator that measures the speed and change of price movements. The RSI oscillates between zero and 100. Traditionally the RSI is considered overbought when above 70 and oversold when below 30. Signals can be generated by looking for divergences and failure swings. RSI can also be used to identify the general trend.
To improve our results we are calculating Multiple Length RSI - Average RSI based on the multiple periods. You can use just 1 Length or Multiple.
Set Inputs to Min=14, Max=14 if you want to use just 1 period.
= RSI(14)
3 RSI Lengths example (12,13 and 14):
Min=12, Max=14
(12+13+14) / 3 = avg. RSI
-----------------------------------------------------------------------------------------------------------
Backtester - Optimizer Explained:
The backtester runs numerous backtests in the background to optimize trading strategies. Here’s how it works:
Default Inputs (Combinations of TP/SL)
TP 1%, SL4%
TP 2%, SL4%
TP 3%, SL4%
TP 2%, SL5%
TP 4.5%, SL10%
Default Inputs (RSI Crossover Buys) :
18 ,20,21,22,23,24,25,26,27,28,29,30,31,32,33,34,35,45,55, 69
_______________________________________________________
Backtest RSI Crossover 18:
TP1%, SL4% => Save net profit
TP2%, SL4% => Save net profit
TP3%, SL4% => Save net profit
TP2%, SL5% => Save net profit
TP4.5%, SL10% => Save net profit
,...
,...
Backtest RSI Crossover 69:
TP1%, SL4% => Save net profit
TP2%, SL4% => Save net profit
TP3%, SL4% => Save net profit
TP2%, SL5% => Save net profit
TP4.5%, SL10% => Save net profit
Self Optimizing Buy Condition and Self Optimizing Take Profit - Stop Los
This process involves testing various combinations of RSI crossover values with different Take Profit (TP) and Stop Loss (SL) percentages. The net profit for each combination is saved, allowing the optimizer to select the best-performing settings for trading.
It recalculates on every bar close. If one combination starts performing better than others—achieving a higher net profit gain (essentially like running 100 backtests with different settings in the background)—the strategy switches to that combination of TP/SL and Buy condition. It continues trading with the new settings until another parameter starts performing better and the strategy switches to that setting.
________________________________________________________________________
If you wish to use it as INDICATOR - turn on 'Recalculate - On every tick' in Properties tab to have this script updating constantly and use it as a normal Indicator tool for manual trading.
Other functions:
Set the %fee for optimizing engine. If you set this % higher, you also punish small average trades and make the strategy prefer larger avg. trades, giving you better chances to make your strategy profitable.
Trade with trend and optimize the strategy only when the market is uptrending with EMA/HMA
Use Moving Average of avg.RSI and smooth the values for indicator even more. (Yes strategy is self optimizing RSI or avg.RSI or RSI-MA, you can select all sorts of this indicator for optimizing)
All trading alerts are working and functional, if you want to automate the strategy
This script is simple to use for any trader as it saves a lot of time for searching good parameters on your own. It's self-optimizing and adjusting to the markets on the go.

TSI w SuperTrend decision - Strategy [presentTrading]This strategy aims to improve upon the performance of Traidngview's newly published "Trend Strength Index" indicator by incorporating the SuperTrend for better trade execution and risk management. Enjoy :)
█ Introduction and How it is Different
The "TSI with SuperTrend Decision - Strategy" combines the Trend Strength Index (TSI) with SuperTrend indicators to determine entry and exit points. Unlike traditional strategies that rely solely on one indicator, this method leverages the strengths of both TSI and SuperTrend to provide a more nuanced and adaptive trading strategy.
This dual approach allows for capturing trends more effectively, especially in volatile markets.
BTCUSD 8h LS Performance
█ Strategy, How it Works: Detailed Explanation
🔶 Trend Strength Index (TSI)
The TSI is a momentum oscillator that shows both the direction and strength of a trend. It is calculated by comparing the price movement with the bar index over a specified period. The formula for TSI is as follows:
```
TSI = (PC / |PC|)
where:
PC = Change in price over the period
```
In this strategy, TSI is calculated using the closing prices and a default period of 64 bars. The TSI values help identify overbought and oversold conditions, providing signals for potential market reversals.
🔶 SuperTrend Indicator
The SuperTrend is a trend-following indicator based on the average true range (ATR). It helps in identifying the direction of the market trend. The SuperTrend calculation involves:
```
SuperTrend = HLC3 ± (Factor * ATR)
where:
HLC3 = (High + Low + Close) / 3
Factor = User-defined multiplier
ATR = Average True Range over a period
```
The SuperTrend settings in this strategy include a length of 10 bars and a factor of 3.0.
Last Bull Cycle of BTC
🔶 Entry and Exit Conditions
The strategy uses the TSI and SuperTrend together to determine entry and exit points:
- Long Entry: When the SuperTrend indicates a downward trend (st.d < 0) and the TSI is above the oversold level (-0.241).
- Long Exit: When the SuperTrend indicates an upward trend (st.d > 0) and the TSI is below the overbought level (0.241).
- Short Entry: When the SuperTrend indicates an upward trend (st.d > 0) and the TSI is below the overbought level (0.241).
- Short Exit: When the SuperTrend indicates a downward trend (st.d < 0) and the TSI is above the oversold level (-0.241).
█ Trade Direction
The strategy allows users to select the trade direction through the `tradeDirection` input. The options are:
- Both: Enables both long and short trades.
- Long: Enables only long trades.
- Short: Enables only short trades.
█ Default Settings
- TSI Length: 64
- SuperTrend Length: 10
- SuperTrend Factor: 3.0
- Trade Direction: Both
- Take Profit (%): 30.0
- Stop Loss (%): 20.0
Impact of Default Settings
- TSI Length: A longer TSI period smooths out noise but may lag in identifying trends. A shorter period is more responsive but can generate false signals.
- SuperTrend Length: A shorter length provides quicker signals but can be prone to whipsaws. A longer length is more reliable but may delay entries and exits.
- SuperTrend Factor: A higher factor increases the distance of the SuperTrend from the price, reducing sensitivity to minor price fluctuations.
- Trade Direction: Allows flexibility in trading strategies by enabling both long and short trades based on market conditions.
- Take Profit and Stop Loss: These settings manage risk by automatically closing trades at predefined profit or loss levels. Higher percentages provide larger potential gains but also higher risk.

RSI and ATR Trend Reversal SL/TPQuick History:
I was frustrated with a standard fixed percent TP/SL as they often were not receptive to quick market rallies/reversals. I developed this TP/SL and eventually made it into a full fledge strategy and found it did well enough to publish. This strategy can be used as a standalone or tacked onto another strategy as a TP/SL. It does function as both with a single line. This strategy has been tested with TSLA , AAPL, NVDA, on the 15 minutes timeframe.
HOW IT WORKS:
Inputs:
Length: Simple enough, it determines the length of the RSI and ATR used.
Multiplier: This multiplies the RSI and ATR calculation, more on this later.
Delay to prevent Idealization: TradingView will use the open of the bar the strategy triggers on when calculating the backtest. This can produce unrealistic results depending on the source. If your source is open, set to 0, if anything else, set to 1.
Minimum Difference: This is essentially a traditional SL/TP, it is borderline unnecessary, but if the other parameters are wacky this can be used to ensure the SL/TP. It multiplies the source by the percent, so if it is set to 10, the SL/TP is initialized at src +- 10%.
Source input: Self Explanatory, be sure to update the Delay if you use open.
CALCULATION:
Parameters Initialization:
The strategy uses Heikinashi values for calculations, this is not toggleable in parameters, but can be easily changed by changing hclose to equal src.
FUNCTION INITIALIZATION:
highest_custom and lowest_custom do the same thing as ta.highest and ta.lowest, however the built in ta library does not allow for var int input, so I had to create my own functions to be used here. I actually developed these years ago and have used them in almost every strategy since. Feel especially free to use these in your own scripts.
The rsilev is where the magic happens.
SL/TP min/max are initially calculated to be used later.
Then we begin by establishing variables.
BullGuy is used to determine the length since the last crossup or crossdown, until one happens, it returns na, breaking the function. BearGuy is used in all the calculations, and is the same as BullGuy, unless BullGuy is na, where BearGuy counts up from 1 on each bar from 0.
We create our rsi and have to modify the second one to suit the function. In the case of the upper band, we mirror the lower one. So if the RSI is 80, we want it to be 20 on the upper band.
the upper band and lower band are calculated the exact same way, but mirrored. For the purpose of writing, I'm going to talk about the lower band. Assume everything is mirrored for the upper one. It finds the highest source since the last crossup or crossdown. It then multiplies from 1 / the RSI, this means that a rapid RSI increase will increase the band dramatically, so it is able to capture quick rally/reversals. We add this to the atr to source ratio, as the general volatility is a massive factor to be included. We then multiply this number by our chosen amount, and subtract it from the highest source, creating the band.
We do this same process but mirrored with both bands and compared it to the source. If the source is above the lower band, it suggests an uptrend, so the lower band is outputted, and vice versa for the upper one.
PLOTTING:
We also determine the line color in the same manner as we do the trend direction.
STRATEGY:
We then use the source again, and if it crosses up or down relative to the selected band, we enter a long or short respectively.
This may not be the most superb independent strategy, but it can be very useful as a TP/SL for your chosen entry conditions, especially in volatile markets or tickers.
Thank you for taking the time to read, and please enjoy.

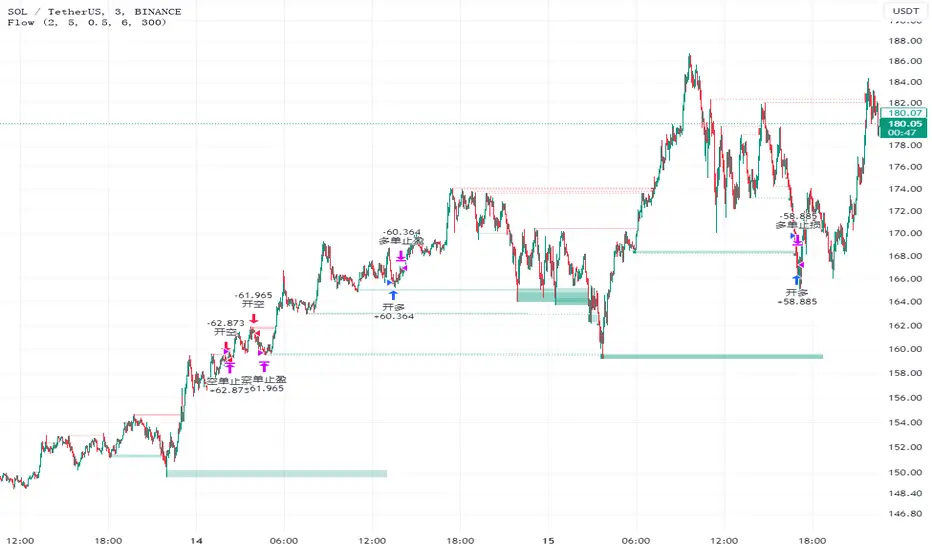
FlowHello, everyone,
Recently I found a useful indicator for the short-term minute-level trading called Liquidity Sweeps. This is a technical indicator that studies the resistance and support levels of candle patterns.
The strategy takes into account the following market factors:
Lql -> resistance formed by a rapid rise or support formed by a rapid rise
Sweep Area -> potential entry point
The inspiration of this strategy comes mostly from Liquidity Sweeps (LuxAlgo), but I have also optimized it based on my own trading experience.
What are the differences from the original strategy?
The Only Outbreaks & Retest option has been removed, and the formation of Wicks is enough to prevent conflicting signals.
The P&L ratio of the strategy has been set, which allows more combinations of the appropriate strategy parameters to match different characteristics of trading pairs.
Signals
1. Enter the trade when three consecutive bars are formed in the Wicks block (resistance or support) and set the stop-loss/stop-profit
2. The condition is not met when three bars are formed in the Wicks block, and the Wicks index is reset when the price returns.
Risk Management
1. Use the P&L ratio, plus appropriate ATR volatility to prevent false breakouts.
2. When the signal is reversed.
3. The strategy is suitable for the short-term level, not for the trend market.
Now, for the inexperienced reader, a series of knowledge. ATR: Like Boolean channel and ADX, Average True Rage is an indicator used to measure price volatility. But unlike these two indicators, it can reflect the price volatility more accurately because of the factors such as gaps added in its calculation process. For this reason, it is called "true" volatility.
Sincerely,
Special thanks to @LuxAlgo for sharing.
Strategy / Connectable [Azullian]The connectable strategy serves as a foundational component in our indicator system on TradingView, designed for intuitive testing, visualization, and construction of trading strategies. In concert with the connectable signal filter , it forms a cohesive unit that allows for efficient signal processing and strategy implementation. This integration enables the strategy to receive and act on weighted signals from various connectable indicators, making it a versatile tool for both novice and experienced traders.
Let's review the separate parts of this indicator.
█ STRATEGY INPUTS
We've provided an input to connect a signal filter or indicators or chains (→) which is set to 'Close' by default.
An input has several controls:
• Input: Connect indicators or signal filter here, choose indicators with a compatible : Signal connector.
• SM - Signal Mode: Choose a trading direction compatible with the settings in your signal filter
█ POSITION INVESTMENT
Determine the percentage of your trading budget you would like to use in each position based on the strategy's profit or loss.
• LINVB - Loss Investment Base: Choose which base to use to determine the investment percentage when the strategy is in a loss.
○ Equity: Use the equity as the base for percentage calculation.
○ Initial capital: Use the initial capital as the base for percentage calculation.
• LINV% - Loss Investment Percentage: Set a percentage of the chosen investment base as the investment for a new position.
○ For example, when 10% in loss, and a initial capital of $100, and the investment base is set to equity with a percentage of 50%, your investment will be 50% of $90, $45.
• PINVB - Profit Investment Base: Choose which base to use to determine the investment percentage when the strategy is in profit.
○ Equity: Use the equity as the base for percentage calculation.
○ Initial capital: Use the initial capital as the base for percentage calculation.
• PINV% - Profit Investment Percentage: Set a percentage of the chosen investment base as the investment for a new position.
○ For example, when 10% in profit, and an initial capital of $100, and the investment base is set to equity with a percentage of 100%, your investment will be 100% of $110, $110.
• RISK% - Risk Percentage:
○ Determine how much of the calculated position investment is at risk when the stop-loss is hit.
- For example, 1% of $45 represents a maximum loss of $0.45.
○ Risk percentage works together with the stop loss and the max leverage.
• MXLVG - Maximum Leverage:
○ Investigate the trading rules for your trading pair and use the maximum allowed amount of leverage.
○ To determine the number of contracts to be bought or sold, considering the stop loss and the specified risk percentage, the maximum leverage available will constrain the amount of leverage utilized to ensure that the maximum risk threshold is not exceeded. For instance, suppose the stop loss is set at 1%, and the risk percentage is defined as 10%. Initially, the calculated leverage to be used would be 10. However, if there is a maximum leverage cap set at 5, it would constrain the calculated leverage of 10 to adhere to the maximum limit of 5.
█ EXIT STOP LOSS
Determine the Stop Loss price based on your selected configuration.
As the stop loss is an integral part of the ordered contracts calculation used in conjunction with the Risk and Max leverage, you'll always need to provide a stop loss price.
• SLB - Stop Loss Base: Choose a stop loss mode for calculating stop loss prices.
○ Risk: Determines the price using the Risk parameter (RISK%) and maximum leverage (MXLVG). In this case, SLB% will not have any impact.
○ Price Entry + Offset: Calculates the stop loss price based on a offset percentage (SLB%) from the entry price of the position.
• SLB% - Stop Loss Base Percentage: Define an offset percentage that will be applied in the price entry + offset stop loss mode.
• SLT - Stop Loss Trailing:
○ Fixed: The initial stop loss will be kept and no trailing stop loss will be applied.
○ Trail Price: Computes the trailing stop loss price based on an offset percentage (SLT%) from the closing price of the current candle.
- If a better stop loss price is calculated, it will be set as the new stop loss price.
○ Trail Incr: Adapts the trailing stop loss price based on the offset percentage (SLT%).
- Each price change in favor of your position will incrementally adapt the trailing stop loss with SLT%.
• SLT% - Stop Loss Trailing Percentage: This percentage serves as an offset or increment depending on your chosen trailing mode.
█ EXIT TAKE PROFIT
Determine the Take Profit price based on your selected configuration.
• TPB - Take Profit Base: Choose a take profit mode for calculating take profit prices.
○ Reward: Determines the take profit price using the Risk parameter (RISK%) and the calculated Stop Loss price and the set reward percentage (TPB%).
- For example: Risk 1%, Calculated Stop loss price: $90, Entry price: $100, Reward (TPB%): 2%, will result in a take profit price on $120.
○ Price Entry + Offset: Calculates the take profit price based on a offset percentage (TPB%) from the entry price of the position.
- For example: Entry price: $100, Offset (TPB%): 2%, will result in a take profit price on $102.
• TPB% - Take Profit Base Percentage: Define an offset percentage that will be applied in the price entry + offset take profit mode.
• TPT - Take Profit Trailing:
○ Fixed: The initial take profit will be kept and no trailing take profit will be applied.
○ Trail Price: Computes the trailing take profit price based on an offset percentage (TPT%) from the closing price of the current candle.
- If an applicable take profit price is calculated, it will be set as the new take profit price.
○ Trail Incr: Adapts the trailing take profit price based on the offset percentage (TPT%). Each price change against your position will incrementally adapt the trailing take profit with TPT%.
• TPT% - Take Profit Trailing Percentage: This percentage serves as an offset or increment depending on your chosen trailing mode.
█ STRATEGY CONDITIONS
Specify when the strategy is permitted to execute trades.
• DATE: Enable the Date Range filter to restrict entries to a specific date range.
○ START: Set a start date and hour to commence trading.
○ END: Set an end date and hour to conclude trading within the defined range.
■ VISUALS
• LINE: Activate a colored dashed diagonal line to visually connect the entry and exit points of positions.
• SLTP: Enable visualization of stop loss, take profit, and break-even levels.
• PNL: Enable Break-Even and Close Lines along with a colored area in between to visualize profit and loss.
• ☼: Brightness % : Adjust the opacity of the plotted trading visuals.
• P - Profit Color : Choose the color for profit-related elements.
• L - Loss Color: Choose the color for loss-related elements.
• B - Breakeven Color : Select the color for break-even points.
• EL - Long Color: Specify the color for long positions.
• ES - Short Color: Specify the color for short positions.
• TRADE LABELING: For better analysis we've labeled all entries and exits conform with the type of order your strategy has executed, some examples:
○ XL-TP-150: Exit Long - Take Profit - Position 150
○ XS-TP-154: Exit Short - Take Profit - Position 154
○ XL-SL-160: Exit Long - Stop Loss - Position 160
○ XS-SL-164: Exit Short - Stop Loss - Position 164
█ USAGE OF CONNECTABLE INDICATORS
■ Connectable chaining mechanism
Connectable indicators can be connected directly to the signal monitor, signal filter or strategy , or they can be daisy chained to each other while the last indicator in the chain connects to the signal monitor, signal filter or strategy. When using a signal filter you can chain the filter to the strategy input to make your chain complete.
• Direct chaining: Connect an indicator directly to the signal monitor, signal filter or strategy through the provided inputs (→).
• Daisy chaining: Connect indicators using the indicator input (→). The first in a daisy chain should have a flow (⌥) set to 'Indicator only'. Subsequent indicators use 'Both' to pass the previous weight. The final indicator connects to the signal monitor, signal filter, or strategy.
■ Set up the strategy with a signal filter and an RSI indicator
Let's connect the Strategy to a connectable signal filter and a connectable RSI indicator :
1. Load all relevant indicators
• Load RSI / Connectable
• Load Signal filter / Connectable
• Load Strategy / Connectable
2. Signal Filter: Connect the RSI to the Signal Filter
• Open the signal filter settings
• Choose one of the three input dropdowns (1→, 2→, 3→) and choose : RSI / Connectable: Signal Connector
• Toggle the enable box before the connected input to enable the incoming signal
3. Signal Filter: Update the filter signals settings if needed
• The default settings of the filter enable EL (Enter Long), XL (Exit Long), ES (Enter Short) and XS (Exit Short).
4. Signal Filter: Update the weight threshold settings if needed
• All connectable indicators load by default with a score of 6 for each direction (EL, XL, ES, XS)
• By default, weight threshold (TH) is set at 5. This allows each occurrence to score, as the default score in each connectable indicator is 1 point above the threshold. Adjust to your liking.
5. Strategy: Connect the strategy to the signal filter in the strategy settings
• Select the strategy input → and select the Signal filter: Signal connector
6. Strategy: Enable filter compatible directions
• Set the signal mode of the strategy to a compatible direction with the signal filter.
Now that everything is connected, you'll notice green spikes in the signal filter representing long signals, and red spikes indicating short signals. Trades will also appear on the chart, complemented by a performance overview. Your journey is just beginning: delve into different scoring mechanisms, merge diverse connectable indicators, and craft unique chains. Instantly test your results and discover the potential of your configurations. Dive deep and enjoy the process!
█ BENEFITS
• Adaptable Modular Design: Arrange indicators in diverse structures via direct or daisy chaining, allowing tailored configurations to align with your analysis approach.
• Streamlined Backtesting: Simplify the iterative process of testing and adjusting combinations, facilitating a smoother exploration of potential setups.
• Intuitive Interface: Navigate TradingView with added ease. Integrate desired indicators, adjust settings, and establish alerts without delving into complex code.
• Signal Weight Precision: Leverage granular weight allocation among signals, offering a deeper layer of customization in strategy formulation.
• Advanced Signal Filtering: Define entry and exit conditions with more clarity, granting an added layer of strategy precision.
• Clear Visual Feedback: Distinct visual signals and cues enhance the readability of charts, promoting informed decision-making.
• Standardized Defaults: Indicators are equipped with universally recognized preset settings, ensuring consistency in initial setups across different types like momentum or volatility.
• Reliability: Our indicators are meticulously developed to prevent repainting. We strictly adhere to TradingView's coding conventions, ensuring our code is both performant and clean.
█ COMPATIBLE INDICATORS
Each indicator that incorporates our open-source 'azLibConnector' library and adheres to our conventions can be effortlessly integrated and used as detailed above.
For clarity and recognition within the TradingView platform, we append the suffix ' / Connectable' to every compatible indicator.
█ COMMON MISTAKES AND CLARIFICATIONS
• Removing an indicator from a chain: Deleting a linked indicator and confirming the "remove study tree" alert will also remove all underlying indicators in the object tree. Before removing one, disconnect the adjacent indicators and move it to the object stack's bottom.
• Point systems: The azLibConnector provides 500 points for each direction (EL: Enter long, XL: Exit long, ES: Enter short, XS: Exit short) Remember this cap when devising a point structure.
• Flow misconfiguration: In daisy chains the first indicator should always have a flow (⌥) setting of 'indicator only' while other indicator should have a flow (⌥) setting of 'both'.
• Recalculate: While this strategy has undergone extensive testing, enabling recalculation options like 'After order is filled' or 'On every tick' may lead to unexpected behavior.
• Fill orders: The strategy is thoroughly tested, yet enabling fill order options such as 'Using bar magnifier', 'On bar close', or 'Using standard OHLC' might result in unexpected outcomes.
• Layout and abbreviations: To maintain a consistent structure, we use abbreviations for each input. While this may initially seem complex, you'll quickly become familiar with them. Each abbreviation is also explained in the inline tooltips.
• Optimized for crypto trading: While many principles are common across markets, this strategy is specifically optimized and tested for crypto trading.
• Inputs: Connecting a connectable indicator directly to the strategy delivers the raw signal without a weight threshold, meaning every signal will trigger a trade.
█ A NOTE OF GRATITUDE
Through years of exploring TradingView and Pine Script, we've drawn immense inspiration from the community's knowledge and innovation. Thank you for being a constant source of motivation and insight.
█ RISK DISCLAIMER
Azullian's content, tools, scripts, articles, and educational offerings are presented purely for educational and informational uses. Please be aware that past performance should not be considered a predictor of future results.

MACD + MA HTF Strategy - Dynamic SmoothingMACD + MA HTF Strategy - Dynamic Smoothing
The MACD alone generally gives too many false signals and is therefore often used in combination with different indicators. The basic idea to combine the MACD with a moving average on a higher time frame is a commonly used technique to only enter Longs in a uptrend and only Shorts in a downtrend while trading on lower timeframe charts. However, the main issue in many strategy scripts is that the HTF indicator is not visible on lower timecharts. With this strategy example I used the Dynamic Smoothing code to visualise the HTF MA filter to display on you lower timechart. This way it is easier to optimize the strategy settings to the instrument chart.
Orginality and Usefulness - Dynamic Smoothing
Visualizing a higher time frame on a lower timechart often gives jagged lines on your chart. As the calculation is done on less bars, compared to the bars you have open on your timechart. The dynamic smoothing factor is derived by taking the ratio of minutes of the higher time frame to the current time frame. This ensures the moving average remains fluid and consistent across different time frames, eliminating 'jagged' lines on your chart. This new MA value is then used as HTF filter on top of the MACD entry settings. Always make sure the time chart is equal or lower than the timeframe settings in the configuration settings. The intention of the script is to visualise the higher time frame confirmations while trading on a lower timechart.
Code example how to achieve Dynamic Smoothing:
// Get minutes for current and higher timeframes
// Function to convert a timeframe string to its equivalent in minutes
timeframeToMinutes(tf) =>
multiplier = 1
if (str.endswith(tf, "D"))
multiplier := 1440
else if (str.endswith(tf, "W"))
multiplier := 10080
else if (str.endswith(tf, "M"))
multiplier := 43200
else if (str.endswith(tf, "H"))
multiplier := int(str.tonumber(str.replace(tf, "H", "")))
else
multiplier := int(str.tonumber(str.replace(tf, "m", "")))
multiplier
// Get minutes for current and higher timeframes
currentTFMinutes = timeframeToMinutes(timeframe.period)
higherTFMinutes = timeframeToMinutes(TimeFrame_Trend)
// Calculate the smoothing factor
dynamicSmoothing = math.round(higherTFMinutes / currentTFMinutes)
MA_Value_Smooth = ta.sma(MA_Value_HTF, dynamicSmoothing)
Complete Strategy
The MACD and HTF moving average is used to determine when to enter a new position. However a strategy should consider more factors than only the timing of entering a trade. To complete the strategy I included:
an option to choose from different MA types per indicator
a Risk Management Tool
a Take Profit Logic
a Trailing stop loss
a Hard Stoploss
a visual representation of TP and SL
This is merely an example how to structure a strategy and many different setups are possible.
The features in this script are explained below:
Different MA types
The script supports various MA types like EMA, SMA, DEMA, TEMA, WMA and HMA. You can select the MA type and different timeframe to your liking.
Risk Management Tool
Traders can choose to allocate their position size based on a percentage of equity or a fixed number of contracts. This feature ensures prudent risk management and helps traders align their position sizes with their risk tolerance. In the strategy -0.5 is equal to 50% of equity and 1.5 is 150% of equity used. Make sure to align the % of equity with your maxdrawn results with backtesting. Personally I don't want higher max drawdowns than 15%. For the strategy results the script considers 0.05 commission rate on each trade, to stay conservative. For a more detailed explanation I refer to my earlier published tradingviewblog about risk management:
Take Profit Logic
The take profit logic in this script is designed for optimization, offering three distinct exit levels. Traders can customize these levels based on their risk appetite. The script allows adjustment of both the percentage take profit level and the position size, catering to individual trading strategies and objectives. The default settings closes 33% of the position when TP target is hit. The TP levels are simply calculated by inputting a % of of the entryprice.
Trailing Stop and Hard Stoploss
To mitigate downside risks and protect profits, the script incorporates a well-thought-out trailing stop mechanism based on the Average True Range (ATR). This dynamic trailing stop adapts to market volatility, allowing traders to secure gains while letting profitable positions run. Additionally, to prevent significant losses, a fixed stop loss is implemented, providing an added layer of protection.
Visual Representation of Take Profit and Stoploss Levels
For enhanced visualization, take profit and stoploss levels are displayed on the chart. Take profit levels are depicted with green lines, providing a clear indication of potential exit points. Conversely, the trailing stop loss is presented by the red line, serving as visual cues for risk management. Visualizing indicators makes is easier to optimize settings to your liking.
Ideal Settings and Accessibility
This script is intended to be used on lower timeframe charts like 10 to 30 minutes. You can Align the MACD entry settings equal to your opened timechart or use a slightly higher timeframe. For the MA trend filters, higher timeframe settings such as 30 min, 1 hour, 4 hours, or 1 day are recommended for trading the trend.
Disclaimer
Trading involves significant risk and may not be suitable for all investors. The information provided in this script is for educational purposes only and should not be considered as financial advice. Past performance is not indicative of future results. By using this script, you acknowledge that you understand and accept these risks.

Pairs strategyHello, Tradingview community,
I am been playing with this idea that nowadays trading instruments are interconnected and when one goes too far "out of order" it should return to the mean.
So, here's a relatively simple idea.
This is a LONG-ONLY strategy.
Buy when your traded instrument's last bar closes down, and the comparing instrument closes up.
Sell when close is higher than the previous bar's high.
Best results I found with medium timeframes: 45min, 120min, 180min.
Also, feel free to test non-typical timeframes such as 59min, 119min, 179min, etc.
My reasoning for medium timeframes would be, that they are big enough to avoid "market noise"
of smaller timeframes + commissions & slippage is less negligible, and small enough to avoid exposure of higher timeframes, although, I haven't tested D timeframe and above.
The best results, I found were with instruments that aren't directly correlated. I mostly tested equities and equity futures, so for equity indexes, equity index futures, or large-cap stocks, NASDAQ:SMH , NASDAQ:NVDA , EURUSD, and Crude Oil would be a good candidate for comparing symbols.
When testing either futures or stocks, please adjust the commission for each asset, for stocks I use % equity, so it compounds over time, whereas, for futures, I use 1 contract all the time.
Here's NASDAQ:MSFT on 119min chart
Here's AMEX:SPY on 59min chart using NASDAQ:NVDA as comparison
Here's CME_MINI:ES1! on 179min chart using NYMEX:CL1! as comparison
To change comparison symbol just insert your symbol between the brackets on both fields down here.
SymbolClose = request.security("YOUR SYMBOL HERE", timeframe.period, close)
SymbolOpen = request.security("YOUR SYMBOL HERE", timeframe.period, open)
Since I am still relatively new to testing, hence, I am publishing this idea, so you can point out some crucial things I may have missed.
Thanks,
Enjoy the strategy!

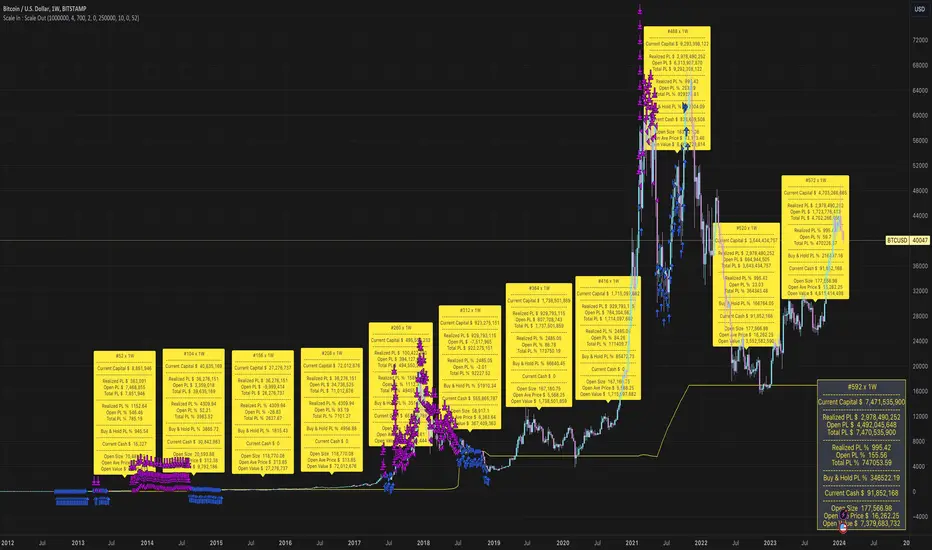
Scale In : Scale OutScale In : Scale Out strategy is an adaptation and extension of dollar-cost-averaging.
As the name implies it not only scales in - allocates a given percentage of available capital to buy at each bar - it also scales out - sells a given percentage of holdings at each bar when a target profit level is reached.
The strategy can potentially mitigate risks associated with market timing.
Although dollar-cost-averaging is often recommended as a strategy for building a position, the management of taking and retaining profits is not often addressed. This strategy demonstrates the potential benefits of managing both the building and (full or partial) liquidation of an investment.
We do not provide any mechanism for managing stop losses. We assume a scale in/out strategy will typically be applied to investing in assets with a high conviction thesis based on criteria external to the strategy. If the strategy does not perform, then the thesis may need to be re-evaluated, and the position liquidated. Even in this case, scaling out should still be considered.
Backtesting ModuleDo you often find yourself creating new 'strategy()' scripts for each trading system? Are you unable to focus on generating new systems due to fatigue and time loss incurred in the process? Here's a potential solution: the 'Backtesting Module' :)
INTRODUCTION
Every trading system is based on four basic conditions: long entry, long exit, short entry and short exit (which are typically defined as boolean series in Pine Script).
If you can define the conditions generated by your trading system as a series of integers, it becomes possible to use these variables in different scripts in efficient ways. (Pine Script is a convenient language that allows you to use the integer output of one indicator as a source in another.)
The 'Backtesting Module' is a dynamic strategy script designed to adapt to your signals. It boasts two notable features:
⮞ It produces a backtest report using the entry and exit variables you define.
⮞ It not only serves for system testing but also to combine independent signals into a single system. (This functionality enables to create complex strategies and report on their success!)
The module tests Golden and Death cross signals by default, when you enter your own conditions the default signals will be neutralized. The methodology is described below.
PREPARATION
There are three simple steps to connect your own indicator to the Module.
STEP 1
Firstly, you must define entry and exit variables in your own script. Let's elucidate it with a straightforward example. Consider a system generating long and short signals based on the intersections of two moving averages. Consequently, our conditions would be as follows:
// Signals
long = ta.crossover(ta.sma(close, 14), ta.sma(close, 28))
short = ta.crossunder(ta.sma(close, 14), ta.sma(close, 28))
Now, the question is: How can we convert boolean variables into integer variables? The answer is conditional ternary block, defined as follows:
// Entry & Exit
long_entry = long ? 1 : 0
long_exit = short ? 1 : 0
short_entry = short ? 1 : 0
short_exit = long ? 1 : 0
The mechanics of the Entry & Exit variables are simple. The variable takes on a value of 1 when your trading system generates the signal and if your system does not produce any signal, variable returns 0. In this example, you see how exit signals can be generated in a trading system that only contains entry signals. If you have a system with original exit signals, you can also use them directly. (Please mind the NOTES section below).
STEP 2
To utilize the Entry & Exit variables as source in another script, they must be plotted on the chart. Therefore, the final detail to include in the script containing your trading system would be as follows:
// Plot The Output
plot(long_entry, "Long Entry", display=display.data_window, editable=false)
plot(long_exit, "Long Exit", display=display.data_window, editable=false)
plot(short_entry, "Short Entry", display=display.data_window, editable=false)
plot(short_exit, "Short Exit", display=display.data_window, editable=false)
STEP 3
Now, we are ready to test the system! Load the Backtesting Module indicator onto the chart along with your trading system/indicator. Then set the outputs of your system (Long Entry, Long Exit, Short Entry, Short Exit) as source in the module. That's it.
FEATURES & ORIGINALITY
⮞ Primarily, this script has been created to provide you with an easy and practical method when testing your trading system.
⮞ I thought it might be nice to visualize a few useful results. The Backtesting Module provides insights into the outcomes of both long and short trades by computing the number of trades and the success percentage.
⮞ Through the 'Trade' parameter, users can specify the market direction in which the indicator is permitted to initiate positions.
⮞ Users have the flexibility to define the date range for the test.
⮞ There are optional features allowing users to plot entry prices on the chart and customize bar colors.
⮞ The report and the test date range are presented in a table on the chart screen. The entry price can be monitored in the data window.
⮞ Note that results are based on realized returns, and the open trade is not included in the displayed results. (The only exception is the 'Unrealized PNL' result in the table.)
STRATEGY SETTINGS
The default parameters are as follows:
⮞ Initial Balance : 10000 (in units of currency)
⮞ Quantity : 10% of equity
⮞ Commission : 0.04%
⮞ Slippage : 0
⮞ Dataset : All bars in the chart
For a realistic backtest result, you should size trades to only risk sustainable amounts of equity. Do not risk more than 5-10% on a trade. And ALWAYS configure your commission and slippage parameters according to pessimistic scenarios!
NOTES
⮞ This script is intended solely for development purposes. And it'll will be available for all the indicators I publish.
⮞ In this version of the module, all order types are designed as market orders. The exit size is the sum of the entry size.
⮞ As your trading conditions grow more intricate, you might need to define the outputs of your system in alternative ways. The method outlined in this description is tailored for straightforward signal structures.
⮞ Additionally, depending on the structure of your trading system, the backtest module may require further development. This encompasses stop-loss, take-profit, specific exit orders, quantity, margin and risk management calculations. I am considering releasing improvements that consider these options in future versions.
⮞ An example of how complex trading signals can be generated is the OTT Collection. If you're interested in seeing how the signals are constructed, you can use the link below.
THANKS
Special thanks to PineCoders for their valuable moderation efforts.
I hope this will be a useful example for the TradingView community...
DISCLAIMER
This is just an indicator, nothing more. It is provided for informational and educational purposes exclusively. The utilization of this script does not constitute professional or financial advice. The user solely bears the responsibility for risks associated with script usage. Do not forget to manage your risk. And trade as safely as possible. Best of luck!

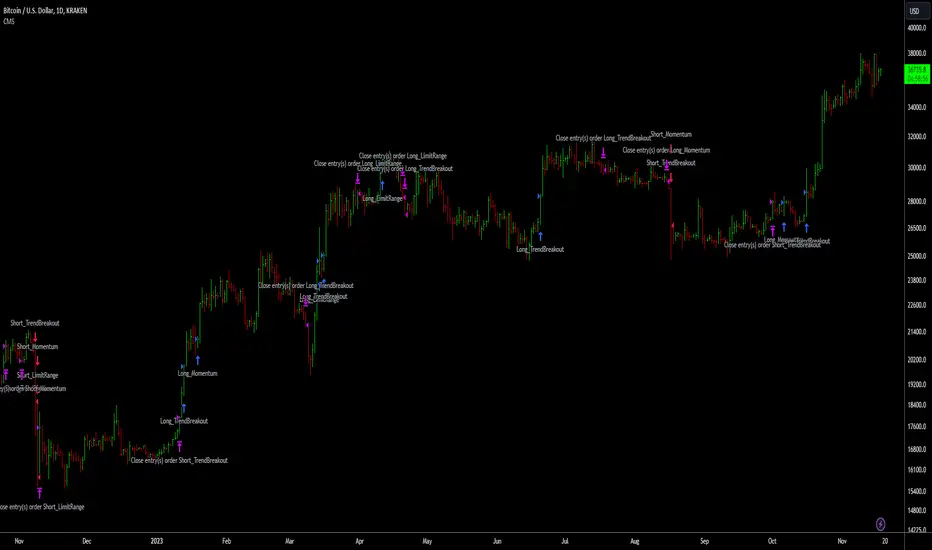
Crypto Market Strategy (CMS)/Introduction
The Crypto Market Strategy (CMS) is a composite strategy for the cryptocurrency market. It integrates multiple strategies (called signals) to ensure you are exploiting multiple patterns/anomalies in the market.
/Signals
The three distinct strategies, each providing signals based on specific market conditions are explained below:
1. Limit Range: This signal targets stable market periods, triggering signals based on micro breakouts in price. The market during this period is described as stable because of the short lookback period required for breakout, four bars is the default.
2. Trend Breakout: This signal seeks to capitalize on significant market movements following consolidation periods, it triggers when large price breakouts occur. The market during this period is described as volatile because of the long lookback period required for breakout, forty bars is the default.
3. Momentum: After breakouts, price uptrends may persist for a long time, typically weeks to months. This signal captures long term trends.
An upward blue arrow signifies a long entry signal, a downward red arrow indicates a short entry signal, while an upward/downward pink arrow indicates an exit signal. All signals will have a label indicating the triggering strategy and number of units (this can be disabled in the style settings).
/Construction
The strategy is constructed using minimal indicators, it is basically price action and moving averages.
/Settings
The settings are organised according to the signals;
1. Limit range
Entry - This is the size of breakout
+Exit - Closes the trade in profit
-Exit - Closes the trade to minimise loss
2. Trend breakout
Entry - This is the size of the breakout
Exit - Closes the trade to minimise loss
3. Momentum
Entry - This determines how quickly a signal is triggered
Lookback - This is the duration considered for the entry
/Results
The backtest results are based on a starting capital of $13,700 (convenient amount for retail traders) with 5% of equity for the position size and pyramiding of 3 consecutive positions because there are three signals. Commissions vary from broker to broker with some charging zero commissions, so commissions is set to an exorbitant $3 per order to ensure profitability in backtests is reproducible in live trading. Slippage of 3 ticks is used to ensure the results are representative of real world, market order, end-of-day trading. The backtest results are available to view at the bottom of this page.
Note:
Past performance in backtesting does not guarantee future results. Cryptocurrency markets are particularly volatile, and individual execution and market changes can significantly affect strategy performance. Price data may also vary across exchanges.
/Tickers
CMS has been backtested primarily on BTCUSD. It also performs well on ETHUSD.
IchiBot - [SigmaStreet]
The IchiBot Indicator has been used to develop automated trading systems. It leverages the open-source Ichimoku framework provided by Trading View, to enable users to creatively generate over 1 trillion different combinations of trading conditions with the use of multiple timeframes to create unique “signal labels” that can be used to create custom strategies or provide in depth market analysis. At the end of this description, I have provided an example of input settings for a simple scalping strategy that I have back tested on US30 on the 5 minute timeframe.
Overview of the Settings:
The visuals section includes an option to show or hide certain parts of the indicator and change the size of the signal labels plotted on the chart.
Next to the “Signal color on baseline/candles” section, you can choose if you want to see additional signals generations from the most previous plotted label on a color changing baseline, or color changing candles. A color change from gray to blue/red indicate that the conditions from the most previously plotted signal label have been met again.
The next 5 sections are all related to the strategy portion of the indicator, used to aid in the back testing process. These sections are titled “Stop loss”, “Take Profit”, “Trail Stop”, “Trade Settings” and “Trade Schedule”.
The Stop Loss section includes an option to choose between value of “pts”, “atr” (average true range) or “None”. The stop loss value in “pts” is simply a specified number of points or pips from the current entry price of a trade that are input in the “SL” section. If the stop loss type is “atr” the “SL” section is not used and the value is calculated and displaced from the current entry price of a trade based on the atr period multiplied by the atr multiplier.
The take profit section is based on the same logic as the stop loss.
The Trail Stop section includes an option to choose between values “pts” or “None”. If the Trail Stop value is “pts”, a trailing stop loss is activated if a trade moves a point value into profit that exceeds the value of the “Trail Activation”. If the Trail Offset type is “pts”, the trailing stop loss is placed a point value away from the current price that is equal to the “Trail Offset” value.
The trade settings section has two options to either prevent or allow trade reversals and prevent or allow only 1 trade per signal label.
If the “Don’t allow trade reversals” is on, then a currently active trade can not be cancelled by an opposite trade signal. It can only be cancelled by the exit logic selected in the above sections. If the “One trade per signal” is selected, the strategy will only enter a trade if the most recent signal label is different from the last signal label where a trade was entered, or if the most recent signal label is in the opposite direction of the most recent signal label where a trade was entered.
The trade schedule section includes an option to only generate signal labels during the specified time. You can choose between 24/7 which will generate signals without any time restriction, or you can choose a custom time which is based on the America / New York time zone.
The timeframe settings section includes an option to choose “single” or “multiple” timeframes, as well as an option to show every signal label combination (“all”), or only the signal labels with the highest numerical value (“absolute”).
If you select “single” next to “timeframe”, the indicator will show you labels based on trade conditions met from only 1 selected timeframe. If you select “multiple” next to “timeframe”, the indicator is designed to return signal labels based on trade conditions that have been met on at least 2 different timeframes.
If you select “multiple” and “use current timeframe”, the indicator will include labels that always include a minimum of 2 timeframes where 1 timeframe is always the current timeframe. If you unselect the “use current timeframe”, the indicator will include labels with a minimum of 2 timeframes.
If you select “multiple” next to “timeframe” and “all” next to “Show all/absolute labels”, the indicator will show you every possible combination of labels that vary from trade conditions met on a minimum of 2 timeframes, to the maximum number of timeframes selected.
If you select “multiple” next to “timeframe” and “absolute” next to “Show all/absolute labels”, the indicator will only show you labels where the numerical value is equivalent to the maximum number of timeframes selected.
Each signal label provides a number which refers to the number of timeframes used to generate the label, offering insights briefly. Hover over a label to reveal detailed tooltip information that details the exact timeframes used to generate each label.
You can choose all from “Show all/absolute labels” to see every possible combination of trade signals or “absolute” to only see labels that have the highest possible numerical value. Absolute means that every condition selected from every timeframe was calculated to be true at the same time on the same candle.
The next 8 sections are “Current timeframe trade conditions”, “1-minute timeframe trade conditions”, “5-minute timeframe trade conditions”, “15-minute timeframe trade conditions”, “30-minute timeframe trade conditions”, “1-hour timeframe trade conditions”, “4-hour timeframe trade conditions”, “Daily timeframe trade conditions”.
These sections include the same 10 trade conditions, that can be used independently, or in combination with each other. This brings the total number of trade conditions to 70.
The final section includes a standard option to adjust the current Ichimoku values.
Understanding the Calculations:
The term “future” refers to a value that is calculated 26 candles to the right of the most recent closing price.
The term “current” refers to a value that is calculated on the most recent closing price.
The term “past” refers to a value that is calculated 26 candles to the left of the most recent closing price.
Bullish is referred to as “blue” and bearish is referred to as “red”.
Buy Signals:
1. The current closing price is greater than the current cloud value.
2. The future cloud is blue.
3. The current closing price is greater than the current conversion line.
4. The current conversion line is greater than the current baseline.
5. The lagging span is greater than the closing price of the last 25 candles.
6. The lagging span is greater than the past cloud.
7. The lagging span is greater than the past conversion line and the past baseline.
8. The current conversion line is greater than the current cloud.
9. The current baseline is greater than the current cloud.
10. The value of the current cloud to the future cloud is completely blue.
Sell Signals:
1. The current closing price is less than the current cloud value.
2. The future cloud is red.
3. The current closing price is less than the current conversion line.
4. The current conversion line is less than the current baseline.
5. The lagging span is less than the closing price of the last 25 candles.
6. The lagging span is less than the past cloud.
7. The lagging span is less than the past conversion line and the past baseline.
8. The current conversion line is less than the current cloud.
9. The current baseline is less than the current cloud.
10. The value of the current cloud to the future cloud is completely red.
The script enables users to access the value of these 10 trade conditions across the 7 major time frames (1-minute, 5-minute, 15-minute, 30-minute, 1-hour, 4-hour, Daily, and the current charts time frame) by using the official non repainting request security function provided by Trading View:
f_secSecurity(_src, _res, _exp) =>
request.security(_src, _res, _exp )
This indicator provides up to 70 variables (10 variables X 7 timeframes) that can be used separately, or in combination to generate signal labels.
Enhance your visual analysis with a color-changing baseline and candle colors that adapt to signal shifts, offering an immediate understanding of market trends. The base line will change from gray to blue/red which will reference the most previously plotted signal label. This change in color indicate that the conditions from the most recently plotted signal label have been met once again. Please refer to the example below.
Adjustments to the Ichimoku Indicator:
The script uses a slightly refined version of the Ichimoku indicator to calculate 10 different “trade conditions”. Each trade condition can create 1 bullish signal label and 1 bearish signal label. The calculations are primarily based on “greater than and less than logic” which is standard for signal generation.
In the original Ichimoku calculations, the “Lagging Span” has a default value of 26 periods. In the actual calculations, this input with the title “Lagging Span” is referred to as the “displacement”. When the lagging span is plotted on the chart, it is plotted with an offset value of offset = -displacement + 1 which technically plots the lagging span 25 candles to the left the most recent candle (if you count the most recent closing price as 0 and not 1). The clouds are plotted with an offset of offset = displacement -1 which technically plots the clouds 25 candles to the right of the most recent candle.
I have adjusted the logic of the Ichimoku indicator so the lagging span is still plotted 25 candles to the left of the most recently confirmed candle close, but the cloud is plotted 26 candles to the right of the most recent confirmed candle close.
This seemingly small adjustment of one candle cannot simply be adjusted in the settings of the original Ichimoku indicator since the calculations of the cloud and lagging span displacements are directly affected by the same value (displacement = 26, also known as the “lagging span”). My script is adjusted to make calculations where the lagging span is 25 candles to the left of the most recent candle, and the cloud is displaced 26 candles to the right of the most recent candle.
For example, my scripts logic to detect if the current closing price is over the current cloud is (close > leadLead1 and close > leadLine2 and leadLine1 > leadLine2 . By using a lookback of , the logic assumes that the displaced value is 26 bars to the right of the most recent candle. My script also reflects this logic in the plotted values of the cloud where the offset values are offset = displacement. This adjustment is made without affecting any other part of the Ichimoku indicators calculations, only the displacement of the cloud which directly affects the logic of trade conditioins. This change is a deliberate and necessary function of this script’s logic to generate trade conditions and signal labels.
I’ve removed the conversion line and the lagging span and introduced a 26-period pivot high/low to provide a less cluttered chart. The pivot high/low looks 26 periods to the left and only 1 period to the right. The lagging span and conversion line logic is still built into the framework of the trading signals. If you choose to enable the lagging span, or conversion line.
trading approach, and always test your strategies thoroughly.
The function to generate the "Signal Labels" calculates every single possible combination of the 7 different timeframes which is a total of 127 combinations for bullish signal labels, and 127 combinations for bearish signal labels. This function also provides the necessary criteria for the strategy entry conditions, based on the dynamically calculated values derived from the signal labels themselves. For example: "buy signal on 1 minute and 5 minute timeframe" is considered 1 combination, and "Buy signal on current, 5 minute, 15 minute, 30 minute, 1 hour, 4 hour and daily timeframe" is also considered 1 combination. There are a total of 254 combinations between buy and sell signal labels along with 254 individual variables with their own unique tool tip description. The signal label function alone spans over 1340 lines of code (minus spaces and comments) to specifically account for every possible variable combination. This unique and original function also calculates the signal label "value" which is the number you see on the signal label. This function adjusts the amount of labels plotted, the value and description of all labels based on the timeframe settings "single"/"multiple", the use of "use current timeframe" setting, and the "trade schedule". This signal label function has been a landmark piece of code for me in my endeavor to create and optimize my strategies based on its ability to provide an in depth analysis of the timeframes used when generating signal labels. This function is main reason that this script has been published closed source.
Back tested results.
The current results are from US30 (Dow Jones Industrial Average CFD) on the 5-minute timeframe using regular candles. The inputs are as follows:
Stop loss = 5000 pts
No take profit.
Trail activation = 100 pts
Trail offset = 100 pts
Don’t allow trade reversals
Trade 24/7
Timeframe = multiple
Show absolute signals
Use current timeframe, lag span over/under candles
Use 30m timeframe, all cloud is bull/bear
Initial capital = $10,000 USD, 1 contract, $0.07 per contract, slippage = 3 ticks, use bar magnifier = on
Timeframe = June 1st, 2023 – November 10th, 2023, risk = 5% (greatest loosing trade = $500.44)
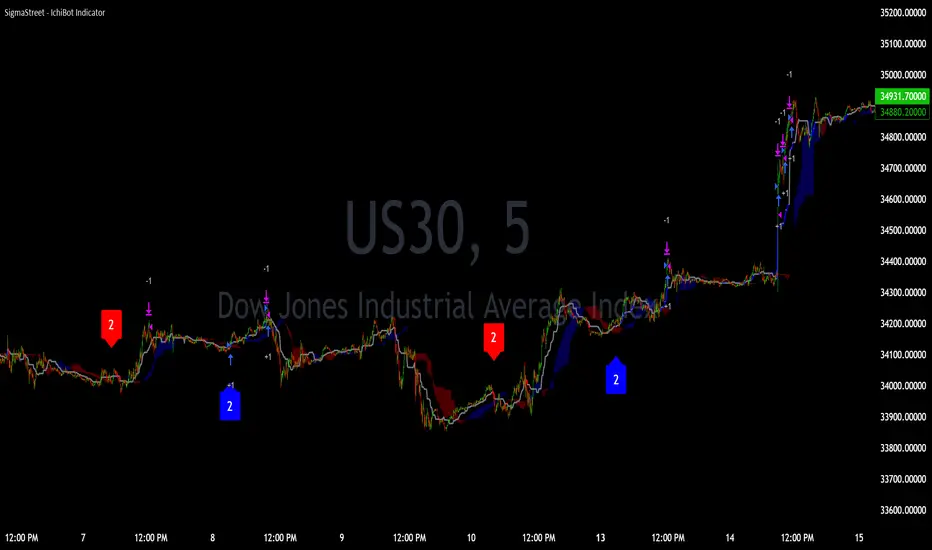
Indian NIFTY Correlation Daytrade/Swing StrategyINTRODUCTION :
This is a daytrading/swing strategy designed mainly for indian market where internally has been adapted to NIFTY market and as well using for internal calculations the values of the candles from NIFTY asset.
With it we search to use with the most correlated asset from the indian market.
For this example I choosed BANKNIFTY
STRATEGY:
The strategy initially uses as candle values the data from the NIFTY asset.
With them I am dividing the work into two calculation parts such as :
-For first part logic, I am doing calculations regarding the volatility of NIFTY, where I initially take into consideration INDIAVIX to have an idea of the expected implied volatility of NIFTY asset and then I compare it with different tools such as ATR, BB and Percentile location of the volatility.
Based on all these factors I take into account the location of the volatility which is atm and if there is a possibility of a strong movement(trend) or sidemarket situation.
-Once I am done with the values of the volatility, the next process in the script logic is to start looking into the trend.
For it I am using different tools such as volume checker, support and resistence key points, pivot points, price actions patterns and different moving averages.
-Risk management part : once we are done with calculation for the entry, the next part is to have an idea where to exit. In this case I am making use of a dynamic risk management which is compressed from multiple ideas such as : we can exit if there were a big gap on the next day in our initial direction, we can also exit based of an internal daily ATR calculation value(we use initially 15min timeframe chart) and lastly if we are around some key points like support/resistence or other different chart patterns like double top, double bot and so on.
CASE EXAMPLE:
As I said before we are initially using for calculation the NIFTY chart with 15min timeframe. With it we can apply to any indian etf,stocks,future. All the assets are going to have the same time of entry and the same time of exit(we get this from NIFTY) and we plot it on the chart we are using, so its key point to look for assets which have a min 75-80% correlation with NIFTY. For this example I used BANKNIFTY chart.
So a type of entry would be this way
Lets assume NIFTY50 is on 19.000 level
INDIAVIX level is currently at 11 which can be translated : 11 / sqrt(250)
So 11 means that on a yearly base we expect the asset to move 11% upwards or downwards
and in a year we have aprox 250 days. So we divide the 11 by sqrt of 250 to get an idea of a daily expected move from the implied volatility of india VIX
11/15.87 = +-0.69%
So INDIAVIX tells us that the values for today nifty is 19000+0,69% and 19000-0.69%
After that I am looking into the daily ATR, and I see that the expected is around 0.8% and is ascending over the last 2 weeks.
Lastly I am looking at the percentile which is currently the volatility on both ATR and INDIAVIX, and I get a value of 90th percentile.
With this my biased is that we are going to expect a short trend, but i cant confirm on the volatility alone so next step is start looking into technical analysis.
I look at volume and is increasing, I look at different price actions paterns and pivots and I see a lower low and a lower high (a descending pattern).
I also see the price is below the key MA like SMA50/100/200, VWAP and so on.
With all of this I get more confirmation that the asset is in a short trend.
Internally once a certain specific % of confirmation from all the logics is achieved, it will trigger a long/short entry, so in this case lets assume we have 80% of our indicators pointing to the short, is going to enter a short.
Now for a long scenario the scene would be , indiavix is around 9,5, ATR is descending. We are around 40th percentile of the volatility.
Our asset is above multiple moving averages, vwap , etc
We have an increasing volume towards bullish side.
And so on( overall 75% of our indicators are pointing towards the long side)
Now for the exit, since we are dealing with a daytrade/swing mentality, short on average we keep the trade open for a less period of time than long ( 19 bars of 15min candles, compared to 57 bars of 15min for long) , so most of the times for short we are going to exit next day and if the trend is still in our favour we re enter the trade.
For long we can stay much more time, sometimes even weeks and we exit mainly when the % of confirmation of indicators point out a reversal/short confirmation fo a big pice action pattern.
STRATEGY RESULTS
For strategy analysis I have used BANKNIFTY NSE with deep history to get access to data from 2011 until present( giving more than 2500 trades) .
For inputs I am using 0.02% comission total ( the comission applied from ZERODHA indian exchange is close to 0.0175% total) so I used it a bit higher in order to take into account some slippages.
For capital THE REASON I USED 100% of the capital allocation is to make a proper comparison with the buy an hold from the same period
Lets assume we had an account of 1M ruppes initially in 2011, we start using 100% of it and then the new values automatically compounded with the new profits and losses so directly compare with 1M of rupees in shares on BANKNIFTY ETFs bought in 2011(buy n hold) until present day.
STRATEGY ACCESS
Strategy is free to be tested for everyone, just let me know in private that you wish to get access to it.

Elliott Wave with Supertrend Exit - Strategy [presentTrading]## Introduction and How it is Different
The Elliott Wave with Supertrend Exit provides automated detection and validation of Elliott Wave patterns for algorithmic trading. It is designed to objectively identify high-probability wave formations and signal entries based on confirmed impulsive and corrective patterns.
* The Elliott part is mostly referenced from Elliott Wave by @LuxAlgo
Key advantages compared to discretionary Elliott Wave analysis:
- Wave Labeling and Counting: The strategy programmatically identifies swing pivot highs/lows with the Zigzag indicator and analyzes the waves between them. It labels the potential impulsive and corrective patterns as they form. This removes the subjectivity of manual wave counting.
- Pattern Validation: A rules-based engine confirms valid impulsive and corrective patterns by checking relative size relationships and fib ratios. Only confirmed wave counts are plotted and traded.
- Objective Entry Signals: Trades are entered systematically on the start of new impulsive waves in the direction of the trend. Pattern failures invalidate setups and stop out positions.
- Automated Trade Management: The strategy defines specific rules for profit targets at fib extensions, trailing stops at swing points, and exits on Supertrend reversals. This automates the entire trade lifecycle.
- Adaptability: The waveform recognition engine can be tuned by adjusting parameters like Zigzag depth and Supertrend settings. It adapts to evolving market conditions.
ETH 1hr chart
In summary, the strategy brings automation, objectivity and adaptability to Elliott Wave trading - removing subjective interpretation errors and emotional trading biases. It implements a rules-based, algorithmic approach for systematically trading Elliott Wave patterns across markets and timeframes.
## Trading Logic and Rules
The strategy follows specific trading rules based on the detected and validated Elliott Wave patterns.
Entry Rules
- Long entry when a new impulsive bullish (5-wave) pattern forms
- Short entry when a new impulsive bearish (5-wave) pattern forms
The key is entering on the start of a new potential trend wave rather than chasing.
Exit Rules
- Invalidation of wave pattern stops out the trade
- Close long trades on Supertrend downturn
- Close short trades on Supertrend upturn
- Use a stop loss of 10% of entry price (configurable)
Trade Management
- Scale out partial profits at Fibonacci levels
- Move stop to breakeven when price reaches 1.618 extension
- Trail stops below key swing points
- Target exits at next Fibonacci projection level
Risk Management
- Use stop losses on all trades
- Trade only highest probability setups
- Size positions according to chart timeframe
- Avoid overtrading when no clear patterns emerge
## Strategy - How it Works
The core logic follows these steps:
1. Find swing highs/lows with Zigzag indicator
2. Analyze pivot points to detect impulsive 5-wave patterns:
- Waves 1, 3, and 5 should not overlap
- Waves 3 and 5 must be longer than wave 1
- Confirm relative size relationships between waves
3. Validate corrective 3-wave patterns:
- Look for overlapping, choppy waves that retrace the prior impulsive wave
4. Plot validated waves and Fibonacci retracement levels
5. Signal entries when a new impulsive wave pattern forms
6. Manage exits based on pattern failures and Supertrend reversals
Impulsive Wave Validation
The strategy checks relative size relationships to confirm valid impulsive waves.
For uptrends, it ensures:
```
Copy code- Wave 3 is longer than wave 1
- Wave 5 is longer than wave 2
- Waves do not overlap
```
Corrective Wave Validation
The strategy identifies overlapping corrective patterns that retrace the prior impulsive wave within Fibonacci levels.
Pattern Failure Invalidation
If waves fail validation tests, the strategy invalidates the pattern and stops signaling trades.
## Trade Direction
The strategy detects impulsive and corrective patterns in both uptrends and downtrends. Entries are signaled in the direction of the validated wave pattern.
## Usage
- Use on charts showing clear Elliott Wave patterns
- Start with daily or weekly timeframes to gauge overall trend
- Optimize Zigzag and Supertrend settings as needed
- Consider combining with other indicators for confirmation
## Default Settings
- Zigzag Length: 4 bars
- Supertrend Length: 10 bars
- Supertrend Multiplier: 3
- Stop Loss: 10% of entry price
- Trading Direction: Both

Merovinh - Mean Reversion Lowest lowThe "Merovinh - Mean Reversion Lowest Low" strategy is a mean reversion trading approach that aims to identify potential reversal points based on the updated lowest low of the specified number of bars. This strategy focuses on the detection of bullish price movements. Works well on Tech giant's shares.
Strategy Overview:
The strategy detects the lowest low and highest high over a specified number of bars.
It uses a mean reversion concept where it expects the price to revert back towards the updated lowest low.
The strategy enters a long position when the current lowest low breaks the previous lowest low (based on the specified number of broken lows).
It closes the long position when the highest high breaks the previous highest high.
The strategy aims to capitalize on potential reversals in the market by buying at lower price levels and selling at higher price levels.
Strategy Parameters:
Minimum number of bars: Specifies the minimum number of bars considered for calculating the lowest low and highest high.
Number of broken lows: Determines the number of previous lows that need to be broken for entering a long position.
How It Works:
The strategy calculates the lowest low and highest high based on the specified number of bars.
It compares the current lowest low with the previous lowest low.
If the current lowest low breaks the previous lowest low (based on the specified number of broken lows), a long position is entered.
The strategy continuously updates the previous lows and highs.
It closes the long position if the highest high breaks the previous highest high.

TrendGuard Flag Finder - Strategy [presentTrading]
Introduction and How It Is Different
In the vast world of trading strategies, the TrendGuard Flag Finder stands out as a unique blend of traditional flag pattern detection and the renowned SuperTrend indicator.
- A significant portion of the Flag Pattern detection is inspired by the "Flag Finder" code by @Amphibiantrading, which serves as one of foundational element of this strategy.
- While many strategies focus on either trend-following or pattern recognition, this strategy harmoniously combines both, offering traders a more holistic view of the market.
- The integration of the SuperTrend indicator not only provides a clear direction of the prevailing trend but also offers potential stop-loss levels, enhancing the strategy's risk management capabilities.
AAPL 1D chart
ETHBTC 6hr chart
Strategy: How It Works
The TrendGuard Flag Finder is primarily built on two pillars:
1. Flag Pattern Detection : At its core, the strategy identifies flag patterns, which are continuation patterns suggesting that the prevailing trend will resume after a brief consolidation. The strategy meticulously detects both bullish and bearish flags, ensuring traders can capitalize on opportunities in both rising and falling markets.
What is a Flag Pattern? A flag pattern consists of two main components:
1.1 The Pole : This is the initial strong price move, which can be either upwards (for bullish flags) or downwards (for bearish flags). The pole represents a strong surge in price in a particular direction, driven by significant buying or selling momentum.
1.2 The Flag : Following the pole, the price starts consolidating, moving against the initial trend. This consolidation forms a rectangular shape and is characterized by parallel trendlines. In a bullish flag, the consolidation will have a slight downward tilt, while in a bearish flag, it will have a slight upward tilt.
How the Strategy Detects Flags:
Identifying the Pole: The strategy first identifies a strong price movement over a user-defined number of bars. This movement should meet a certain percentage change to qualify as a pole.
Spotting the Flag: After the pole is identified, the strategy looks for a consolidation phase. The consolidation should be counter to the prevailing trend and should be contained within parallel lines. The depth (for bullish flags) or rally (for bearish flags) of this consolidation is calculated to ensure it meets user-defined criteria.
2. SuperTrend Integration : The SuperTrend indicator, known for its simplicity and effectiveness, is integrated into the strategy. It provides a dynamic line on the chart, signaling the prevailing trend. When prices are above the SuperTrend line, it's an indication of an uptrend, and vice versa. This not only confirms the flag pattern's direction but also offers a potential stop-loss level for trades.
When combined, these components allow traders to identify potential breakout (for bullish flags) or breakdown (for bearish flags) scenarios, backed by the momentum indicated by the SuperTrend.
Usage
To use the SuperTrend Enhanced Flag Finder:
- Inputs : Begin by setting the desired parameters. The strategy offers a range of user-controlled settings, allowing for customization based on individual trading preferences and risk tolerance.
- Visualization : Once the parameters are set, the strategy will identify and visually represent flag patterns on the chart. Bullish flags are represented in green, while bearish flags are in red.
- Trade Execution : When a breakout or breakdown is identified, the strategy provides entry signals. It also offers exit signals based on the SuperTrend, ensuring that traders can capitalize on the momentum while managing risk.
Default Settings
The strategy comes with a set of default settings optimized for general use:
- SuperTrend Parameters: Length set to 10 and Factor set to 5.0.
- Bull Flag Criteria: Max Flag Depth at 7, Max Flag Length at 10 bars, Min Flag Length at 3 bars, Prior Uptrend Minimum at 9%, and Flag Pole Length between 7 to 13 bars.
- Bear Flag Criteria: Similar settings adjusted for bearish patterns.
- Display Options: By default, both bullish and bearish flags are displayed, with breakout and breakdown points highlighted.

Bullish Divergence Short-term Long Trade FinderThis script is a Bullish divergence trade finder built to find small periods where Bitcoin will likely rise from. It looks for bullish divergence followed by a higher low as long as the hour RSI value is below the 40 mark, if then it will enter an long. It marks out Buy signals on the RSI if the value dips below 'RSI Bull Condition Minimum' (Default 40) on the current time frame in view. It also marks out Sell signals found when the RSI is above the 'RSI Bearish Condition Minimum' (Default 50). The sell signals are bearish divergence that has occurred recently on the RSI. When a long is in play it will sell if it finds bearish divergence or the time frame in view reaches RSI value higher than the 'RSI Sell Value'(Default 75). You can set your stop loss value with the 'Stop loss Percentage' (default 5).
Available inputs:
RSI Period: relative strength measurement length(Typically 14)
RSI Oversold Level: the bottom bar of the RSI (Typically 30)
RSI Overbought Level: the top bar of the RSI (Typically 70)
RSI Bearish Condition Minimum: The minimum value the script will use to look for a pivot high that starts the Bearish condition to Sell (Default 50)
RSI Bearish Condition Sell Min: the minimum value the script will accept a bearish condition (Default 60)
RSI Bull Condition Minimum: the minimum value it will consider a pivot low value in the RSI to find a divergence buy (Default 40)
Look Back this many candles: the amount of candles thee script will look back to find a low value in the RSI (Default 25)
RSI Sell Value: The RSI value of the exit condition for a long when value is reached (Default 75)
Stop loss Percentage: Percentage value for amount to lose (Default 5)
The formula to enter a long is stated below:
If price finds a lower low and there is a higher low found following a lower low and price has just made another dip and price closes lower than the last divergence and Relative strength index hour value is less than 40 enter a long.
The formula to exit a long is stated below:
If the value drops below the stop loss percentage OR (the RSI value is greater than the value of the parameter 'RSI Sell Value' or bearish divergence is found greater than the parameter 'RSI Bearish Condition Minimum' )
This script was built from much strategy testing on BTC but works with alts (occasionally) also. It is most successful to my knowledge using the 15 min and 7 min time frames with default values. Hope it helps! Follow for further possible updates to this script or other entry or exit strategies.
snapshot:
I only have a Pro trading view account so I cannot share a larger data set about this script because the buy signals happen pretty rarely. The most amount that I could find within a view for me was 40 trades within a viewable time. The suggested/default parameters that I have do not occur very often so it limits the data set. Adjustments can be made to the parameters so that trades can be entered more often. The scripts success is dependent on the values of the parameters set by the user. This script was written to be used for BTC/USD or BTC/USDT trading. I am unable to share a larger dataset without putting out results that are intended to fail or having a premium account so reaching the 100 trade minimum is not possible with my account.

Swing Breaker Strategy [v0.1] - Support and resistance breakoutSwing Breaker Strategy - Support and Resistance Breakouts
This strategy has no repainting.
Default settings:
Swing Barsback: 10
Number of Swings: 3
Stoploss Candles Lookback: 5
Why these default settings?
This strategy has been backtested with over 100 trades, and on a larger scale of 1000 trades, it has reported a 1.33 profit factor with a maximum 5% cumulative drawdown, using no leverage. In this backtest, the settings (10,3,5) were used, becoming the default settings as they are more adaptable to different market conditions.
How does this strategy work?
Defining swing lows (support) and swing highs (resistance): We can locate these candles by looking at a symmetrical candle unit around them. For example, the default settings present a 10 swing bars back, which means there is no superior level within a 10-candle radius in the case of a swing high, and the opposite for a swing low. Swings are located a few candles after, just the number of swing bars back (width), because it is needed to ensure it is a swing.
Locating trends: We locate trends by looking at consecutive swings. For example, in the default settings, to determine a bullish trend, we need 3 consecutive ascending swing lows; for a bearish trend, 3 consecutive descending swing highs. You can find this parameter in settings as "Number of swings."
When a trend is formed, a stop entry is placed at the last swing until it is broken.
Just after the entry, the stop is placed at the lowest (in the case of a long) or the highest (in the case of a short) of the last candles. You can define that number in the settings as "Stoploss candles lookback," which default is 5. The take profit is placed at 2 times the stop value, resulting in a 2 risk-reward ratio.
Why is this strategy protected?
No other strategy combines the way of locating swings and turning it into a strategy, including customizable parameters such as stop loss, swing width and introducing the number of swings. That's why we decided to protect it.
Powertrend - Volume Range Filter Strategy [wbburgin]The Powertrend is a range filter that is based off of volume, instead of price. This helps the range filter capture trends more accurately than a price-based range filter, because the range filter will update itself from changes in volume instead of changes in price. In certain scenarios this means that the Powertrend will be more profitable than a normal range filter.
Essentials of the Strategy
This is a breakout strategy which works best on trending assets with high volume and liquidity. It should be used on middle to higher timeframes and can be used on all assets that have volume provided by the data source (stocks, crypto, forex). It is long-only as of now. It can work on lower timeframes if you optimize the strategy filters to make less trades or if your exchange/broker is low/no fees, provided that your exchange/broker has high liquidity and volume.
The strategy enters a long position if the range filter is trending upwards and the price crosses over the upper range band, which signifies a price-volume breakout. The strategy closes the long position if the range filter is trending downwards and the price crosses under the lower range band, which signifies a breakdown. Both these conditions can be altered by the three filter options in the settings. The default trend filter is not alterable because it helps prevent false entries and exits that are against the trend.
Settings
The Length setting is the lookback period for the range smoothing.
The ADX Filter setting enables you to turn on an ADX filter, which will halt entries and exits unless the ADX of your customizable length is above a ADX VWMA of that length.
The Range Supertrend setting creates a supertrend from the top and bottom ranges, which can be used to filter entries and exits. The length is customizable. The filter can show you whether the range is making higher highs and lower lows. Below is an example of the Range Supertrend being used as a filter and plotted on-chart:
The VWMA setting halts entries if they are below a customizable length VWMA.
Both the Range Supertrend and the VWMA can also be plotted separately without actually filtering the strategy, so that you can use them independently if you wish. You can turn off the bar color, the highlighting, and the labels if you wish in the settings. A note about the bar color: if the color changes but the strategy does not signal an exit or entry this means that the crossover was against the trend. In these circumstances it may be indicative of a pullback to enter or exit or to add onto your position.
About the Strategy Results Below
A range filter is normally composed of two components - the range filter itself and a smoothing function. In the development of this script I tested both normal and volume-based varieties of the range filter and the smoothing function:
Tests Performed
Volume-based Range x VWMA smoothing
Price-based Range x VWMA smoothing
Price-based Range x EMA smoothing
Volume-based Range x EMA smoothing (final result)
The highest-performing was a volume-based range filter and a normal EMA-based smoothing function, but that does not mean that this strategy will be profitable - exits are based off of signal reversion so I strongly encourage you to develop your own take profits/stop losses for the strategy if you think it may be a good fit for you. The results below are with a commission value of 0.05% (because I built the strategy first for equities), slippage of 3, so if your exchange/broker has a higher fee schedule, I recommend adding filters and/or moving to higher timeframes for the strategy. Additionally, I used 10% of equity in each trade, while using the Range Supertrend filter (the previous upload was unrealistic because it used 100% of equity - missed a 0, apologies, and added in slippage).
