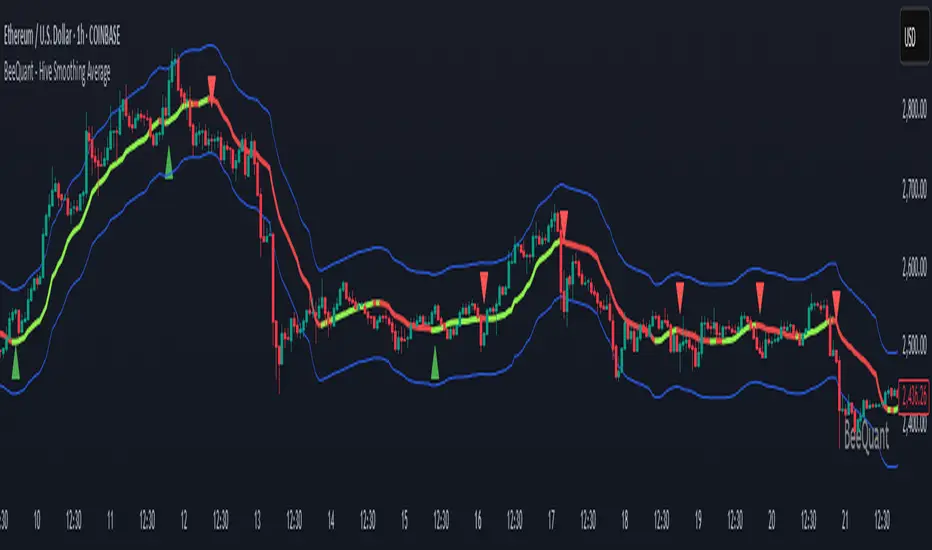
BeeQuant - Hive Smoothing Average🔶 OVERVIEW
The "Hive Smoothing Average" is your gateway to crystal-clear market insights, a truly advanced tool that cuts through confusing price "noise" to reveal the true underlying trend. Imagine having a panoramic view of the market's true direction, unclouded by minor ups and downs. This powerful indicator dynamically filters out market distractions, presenting you with a highly refined line that not only shows you the genuine path of price but also changes color. It’s built for traders who demand clarity and want to confidently spot opportunities that others might miss in messy charts.
__________________________________________________________________________
🧠 CONCEPTS
At its heart, the "Hive Smoothing Average" employs a sophisticated multi-stage processing system to transform raw price data into an incredibly smooth and responsive smoothed moving average line. It's designed to give you an unparalleled view of market direction and momentum.
⬜ Synthesizes multiple smoothing layers to deliver a balanced representation of underlying price action.
⬜ Offers enhanced visual consistency by filtering volatility distortion without delay-based lag.
⬜ Presents color-coded transitions and signal markers to aid in directional conviction and structural flow.
⬜ Embeds a modular smoothing core adaptable across market environments and asset classes.
Hive Smoothing Average doesn't forecast, it refines. It provides a more coherent view of price evolution, allowing for higher-confidence discretion and more robust strategy overlays.
__________________________________________________________________________
✨ FEATURES
Hive Smoothing Average is loaded with flexibility and visual power to enhance your decision-making:
🔹Customizable Smoothing
Tailor the indicator’s core behavior using a wide range of smoothing algorithms — from classic to advanced — to match your trading tempo and asset dynamics.
🔹 Intelligent Color Feedback
The line color dynamically shifts to reflect meaningful trend transitions, offering at-a-glance clarity without crowding your chart.
🔹 Trend Signal Markers
Built-in arrow markers highlight potential transitions in price momentum, acting as subtle nudges to investigate further.
🔹 Multi-Timeframe Ready
Designed to operate cleanly across all timeframes, from scalping micro-trends to monitoring macro cycles.
🔹 External Source Collaboration
Hive Smoothing Average includes two flexible input channels that can seamlessly connect with other indicators on your chart.
🔹 Adaptive Bands
A powerful enhancement to the Hive framework, the optional Standard Deviation Bands add dynamic context to price behavior by highlighting how far price is moving relative to its recent average volatility.
Length: Controls the lookback period for volatility calculation.
Lower values (e.g., 20 – 50) make the bands highly reactive Higher values (e.g., 200 – 500) smooth out the bands (classic envelope systems )
These bands offer valuable visual cues for both volatility expansion and mean reversion potential, especially when combined with Hive’s core candle coloration logic.
🔹Non-Repainting Logic for Historical Reliability
Each "Hive Smoothing Average" is plotted only when its internal reconstruction conditions are fully met and confirmed. This ensures that the historical display of Hive Smoothing Average does not repaint, providing a high degree of reliability and trust in past signals and visualizations.
🔹Cross-Market Versatility
This indicator is engineered to perform with precision across all major markets—whether you're trading forex, commodities, stocks, or indices. Its adaptive logic automatically aligns with the unique volatility and structure of each asset class, delivering consistently reliable insights no matter where you trade.
__________________________________________________________________________
⚙️ USAGE
Getting started with Hive Smoothing Average is seamless and intuitive:
✨ Apply to Any Chart
Simply add the indicator to any asset or timeframe and see immediate transformation in chart clarity.
💹 Source Data Flexibility
Choose your preferred price data source for each smoothing stage (e.g., Close, Open, High, Low), providing complete control over the input feeding the sophisticated smoothing algorithms.
🛠️ Adjust Smoothing Behavior
Choose your preferred initial and final smoothing types (EMA, HMA, ALMA, etc.), and tweak lengths for desired responsiveness or smoothness.
📐 Use Bands for Confluence
Enable the Bands mode to visualize dynamic zones around your smoothed price. Useful for breakout validation and fade zones.
🟩 Green Smoother Line
Indicates strengthening bullish bias and upward progression.
🟥 Red Smoother Line
Suggests weakening or shifting trend toward bearish territory.
📈 Arrow Signals
Upward or downward triangles appear when directional bias changes — confirming subtle pivots in trend behavior.
🎯 Offset Adjustment
Fine-tune the visual positioning of the smoothed line and bands on your chart with a convenient "Offset" input.
📏 Lookback Filter
Activate the “Lookback Filter” setting to remove weaker signals based on custom historical logic. By checking recent candle behavior, it filters out low-quality transitions and only keeps strong, confirmed shifts — helping you avoid noise and stay focused on reliable breakouts.
Experiment with settings based on your trading timeframe. Short-term traders may prefer fast-reactive configurations, while swing or positional traders can explore higher-period smoothings for structural signals.
__________________________________________________________________________
⚠️ LIMITATIONS
While Hive Smoothing Average delivers incredible trend clarity, it’s essential to use it within its designed purpose:
👉 Visual Clarity, Not Trade Calls: This tool enhances visibility of market behavior, not automatic signals. Use it as a trusted lens — not a standalone system.
👉 Reactive, Not Predictive: Hive Smoothing Average responds to price action with refined smoothing. It is not a forecasting model.
👉 Config-Sensitive Output: Different smoothing setups can produce different levels of sensitivity or delay. Calibration matters — explore what fits your asset and style.
👉 Focuses on Price Action Only: It does not integrate volume, fundamentals, or external market influences. It’s engineered purely for price structure refinement.
█ ▒▒▒▒▒▒▒▒▒▒▒▒▒▒▒▒▒▒▒▒▒▒▒ 『•••• ✎ ••••』 ▒▒▒▒▒▒▒▒▒▒▒▒▒▒▒▒▒▒▒▒▒▒▒▒ █
🎯 CONCLUSION
Hive Smoothing Average provides a high-performance, low-noise framework to view price with remarkable clarity. With its adaptive smoothing layers, bands support, and intelligent signal markers, it becomes a powerful tool to enhance your trend confidence and charting efficiency. By furnishing immediate, data-driven feedback on the market's core momentum and signaling critical turning points, it profoundly empowers traders to rapidly ascertain nascent market shifts and identify pivotal directional changes. Seamlessly integrate this sophisticated visual tool within your pre-existing technical analysis architecture to acquire a sharper, more insightful perspective, and fundamentally elevate your strategic acumen, optimizing your decision-making processes to a degree previously unattainable. It's about experiencing the market's true rhythm.
▣▣▣▣▣▣▣▣▣▣▣▣▣▣▣▣▣▣▣▣▣▣▣▣▣▣▣▣▣▣▣▣▣▣▣▣▣▣▣▣▣▣▣▣▣▣▣▣▣▣▣
🚨 RISK DISCLAIMER
Engagement in financial market speculation inherently carries a substantial degree of inherent risk, and the potential for capital diminution, potentially exceeding initial deposits, is a pervasive and non-trivial consideration. All content, algorithmic tools, scripts, articles, and educational materials disseminated by "Hive Smoothing Average" are exclusively purposed for informational and pedagogical objectives, strictly for reference. Historical performance data, whether explicitly demonstrated or implicitly suggested, offers no infallible assurance or guarantee of future outcomes. Users bear sole and ultimate accountability for their individual trading decisions and are emphatically urged to meticulously assess their financial disposition, risk tolerance parameters, and conduct independent due diligence prior to engaging in any speculative market activity.
Pesquisar nos scripts por "bands"
Money NoodleMoney Noodle Indicator - How It Works
The Money Noodle indicator is a trend-following and support/resistance tool that combines multiple exponential moving averages (EMAs) with dynamic volatility-based bands to create a comprehensive trading system.
Core Components
1. Triple EMA System ("The Noodles")
Fast EMA (12): Most responsive to price changes, shows short-term momentum
Medium EMA (21): Intermediate trend direction
Slow EMA (35): Main trend line that acts as the central reference point
The "noodle" effect comes from how these three EMAs weave around each other and the price action, creating curved, flowing lines that resemble noodles.
2. Dynamic Volatility Bands
Upper Band: Main EMA + (ATR × Band Multiplier)
Lower Band: Main EMA - (ATR × Band Multiplier)
Uses a 20-period ATR (Average True Range) to measure market volatility
Band width automatically adjusts - wider during volatile periods, tighter during consolidation
How It Functions
Trend Identification:
When all three EMAs are aligned (fast > medium > slow), it indicates a strong uptrend
When EMAs are inverted (fast < medium < slow), it signals a downtrend
EMA crossovers provide early trend change signals
Support & Resistance:
The bands act as dynamic support and resistance levels
Price tends to bounce off the bands during trending markets
Band breaks often signal strong momentum moves or trend changes
Volatility Assessment:
Band width indicates market volatility - wider bands = higher volatility
ATR-based calculation makes the bands adaptive to current market conditions
The 0.0125 multiplier provides optimal sensitivity for most timeframes
Trading Applications
Entry Signals:
Buy when price bounces off the lower band with EMA alignment
Sell when price bounces off the upper band against the trend
Breakout trades when price decisively breaks through bands
Trend Following:
Use the main EMA (35) as your trend filter
Trade in the direction of EMA alignment
The "noodles" help identify trend strength - tighter = stronger trend
Risk Management:
Bands provide natural stop-loss levels
Band width helps size positions (wider bands = smaller size due to higher volatility)
The indicator works best on daily timeframes and provides a visual, intuitive way to read market structure, trend direction, and volatility all in one tool.

Oculus Ultra Parallel S/R Channel**Oculus Ultra Parallel S/R Channel**
*Version 1.0 | Pine Script v6*
**Overview**
This indicator overlays a statistically-driven support/resistance channel on your chart by fitting a linear regression (median) line and plotting parallel bands at a configurable multiple of standard deviation. It adapts dynamically to both trend and volatility, highlights potential reaction zones, and offers optional alerts when price touches key levels.
**Key Features**
* **Median Regression Line**
Fits a best-fit line through the chosen lookback of price data, showing the underlying trend.
* **Volatility-Based Bands**
Upper and lower bands offset by *N*× standard deviation of regression residuals, capturing dynamic S/R zones.
* **Dynamic Coloring**
* Median line turns **teal** when sloping up, **orange** when sloping down.
* Bands tinted green or red depending on their position relative to the median.
* **Channel Fill**
Optional shaded area between the bands for immediate visual context.
* **Touch Alerts**
Precision alerts and on-chart markers when price touches the support or resistance band, with configurable tick tolerance.
* **Clean Layout**
Minimal lines and plots to avoid chart clutter, adjustable via toggle inputs.
**How to Use**
1. **Apply the Script** – Add to any timeframe in overlay mode.
2. **Configure Inputs** –
* **Channel Length**: Number of bars for regression and volatility calculation.
* **Deviation Factor**: Multiplier for band width (in standard deviations).
* **Show/Hide Elements**: Toggle median line, bands, fill, and touch alerts.
* **Color by Slope**: Enable slope-based median coloring.
* **Touch Tolerance**: Number of ticks within which a band touch is registered.
3. **Interpret the Channel** –
* **Trend**: Follow the slope and color of the median line.
* **Support/Resistance**: Bands represent dynamic zones where price often reacts.
* **Alerts**: Use touch markers or alert pop-ups to time entries or exits at band levels.
**Inputs**
* **Channel Length** (default: 100)
* **Deviation Factor** (default: 1.0)
* **Show Median Regression Line** (true/false)
* **Show Channel Bands** (true/false)
* **Fill Between Bands** (true/false)
* **Color Median by Slope** (true/false)
* **Alert on Band Touch** (true/false)
* **Touch Tolerance (ticks)** (default: 2)
**Version History**
* **1.0** – Initial release with dynamic regression channel, slope coloring, band fill, and touch alerts.
**Disclaimer**
This indicator is intended for educational purposes. Always backtest with your own settings and apply sound risk management before trading live.

Stochastic Overlay - Regression Channel (Zeiierman)█ Overview
The Stochastic Overlay – Regression Channel (Zeiierman) is a next-generation visualization tool that transforms the traditional Stochastic Oscillator into a dynamic price-based overlay.
Instead of leaving momentum trapped in a lower subwindow, this indicator projects the Stochastic oscialltor directly onto price itself — allowing traders to visually interpret momentum, overbought/oversold conditions, and market strength without ever taking their eyes off price action.
⚪ In simple terms:
▸ The Bands = The Stochastic Oscillator — but on price.
▸ The Midline = Stochastic 50 level
▸ Upper Band = Stochastic Overbought Threshold
▸ Lower Band = Stochastic Oversold Threshold
When the price moves above the midline → it’s the same as the oscillator moving above 50
When the price breaks above the upper band → it’s the same as Stochastic entering overbought.
When the price reaches the lower band →, think of it like Stochastic being oversold.
This makes market conditions visually intuitive. You’re literally watching the oscillator live on the price chart.
█ How It Works
The indicator layers 3 distinct technical elements into one clean view:
⚪ Stochastic Momentum Engine
Tracks overbought/oversold conditions and directional strength using:
%K Line → Momentum of price
%D Line → Smoothing filter of %K
Overbought/Oversold Bands → Highlight potential reversal zones
⚪ Volatility Adaptive Bands
Dynamic bands plotted above and below price using:
ATR * Stochastic Scaling → Creates wider bands during volatile periods & tighter bands in calm conditions
Basis → Moving average centerline (EMA, SMA, WMA, HMA, RMA selectable)
This means:
→ In strong trends: Bands expand
→ In consolidations: Bands contract
⚪ Regression Channel
Projects trend direction with different models:
Logarithmic → Captures non-linear growth (perfect for crypto or exponential stocks)
Linear → Classic regression fit
Adaptive → Dynamically adjusts sensitivity
Leading → Projects trend further ahead (aggressive mode)
Channels include:
Midline → Fair value trend
Upper/Lower Bounds → Deviation-based support/resistance
⚪ Heatmap - Bull & Bear Power Strength
Visual heatmeter showing:
% dominance of bulls vs bears (based on close > or < Band Basis)
Automatic normalization regardless of timeframe
Table display on-chart for quick visual insight
Dynamic highlighting when extreme levels are reached
⚪ Trend Candlestick Coloring
Bars auto-color based on trend filter:
Above Basis → Bullish Color
Below Basis → Bearish Color
█ How to Use
⚪ Trend Trading
→ Use Band direction + Regression Channel to identify trend alignment
→ Longs favored when price holds above the Basis
→ Shorts favored when price stays below the Basis
→ Use the Bull & Bear heatmap to asses if the bulls or the bears are in control.
⚪ Mean Reversion
→ Look for price to interact with Upper or Lower Band extremes
→ Stochastic reaching OB/OS zones further supports reversals
⚪ Momentum Confirmation
→ Crossovers between %K and %D can confirm continuation or divergence signals
→ Especially powerful when happening at band boundaries
⚪ Strength Heatmap
→ Quickly visualize current buyer vs seller control
→ Sharp spikes in Bull Power = Aggressive buying
→ Sharp spikes in Bear Power = Heavy selling pressure
█ Why It Useful
This is not a typical Stochastic or regression tool. The tool is designed for traders who want to:
React dynamically to price volatility
Map momentum into volatility context
Use adaptive regression channels across trend styles
Visualize bull vs bear power in real-time
Follow trends with built-in reversal logic
█ Settings
Stochastic Settings
Stochastic Length → Period of calculation. Higher = smoother, Lower = faster signals.
%K Smoothing → Smooths the Stochastic line itself.
%D Smoothing → Smooths the moving average of %K for slower signals.
Stochastic Band
Band Length → Length of the Moving Average Basis.
Volatility Multiplier → Controls band width via ATR scaling.
Band Type → Choose MA type (EMA, SMA, WMA, HMA, RMA).
Regression Channel
Regression Type → Logarithmic / Linear / Adaptive / Leading.
Regression Length → Number of bars for regression calculation.
Heatmap Settings
Heatmap Length → Number of bars to calculate bull/bear dominance.
-----------------
Disclaimer
The content provided in my scripts, indicators, ideas, algorithms, and systems is for educational and informational purposes only. It does not constitute financial advice, investment recommendations, or a solicitation to buy or sell any financial instruments. I will not accept liability for any loss or damage, including without limitation any loss of profit, which may arise directly or indirectly from the use of or reliance on such information.
All investments involve risk, and the past performance of a security, industry, sector, market, financial product, trading strategy, backtest, or individual's trading does not guarantee future results or returns. Investors are fully responsible for any investment decisions they make. Such decisions should be based solely on an evaluation of their financial circumstances, investment objectives, risk tolerance, and liquidity needs.

MA PremiumMA Premium: Advanced Moving Average with Dynamic ATR Bands
MA Premium is a cutting-edge moving average indicator designed to help traders identify potential price reversal zones and optimize their trading strategies. The indicator combines a proprietary “Safety MA” with dynamic ATR-based support and resistance bands, visualized through clean lines and optional cloud regions.
Key Features
1. Proprietary “Safety MA”
The Safety MA utilizes a custom multi-layered EMA algorithm, providing a highly responsive and smooth trend line.
Dynamically adjusts to changing market conditions, offering clear signals for trend direction and potential reversals.
2. Dynamic ATR-Based Bands
Generates multiple support and resistance levels using advanced ATR calculations.
Bands represent zones of increasing market volatility and highlight potential price reversal areas, suitable for tiered trading strategies.
Visually separates overbought and oversold zones to assist in identifying critical price action points.
3. Customizable Settings
Adjustable Bandwidth: Scale the ATR bands dynamically using the Bandwidth Coefficient to align with market volatility.
MA Speed Selection: Toggle between “Fast,” “Medium,” or “Slow” settings to adjust the sensitivity of the Safety MA.
4. Intuitive Visualizations
Optional display of cloud lines and shaded regions to visually enhance support/resistance zones.
A clean and structured design ensures clarity in interpretation.
How to Use
Set the MA Type (“Fast,” “Medium,” or “Slow”) for desired responsiveness.
Adjust the Bandwidth Coefficient to match the current market's volatility.
The Safety MA acts as a dynamic trend-following tool.
Use the ATR-based bands to identify areas where price may react (e.g., potential reversals in overbought or oversold zones).
Employ the dynamic bands for tiered trade execution to manage risk and enhance entry/exit strategies.
Green bands highlight overbought zones (potential bearish reactions).
Red bands indicate oversold zones (potential bullish reactions).
Unlike traditional moving average tools, MA Premium introduces advanced dynamic band calculations and unique visual cues to help traders navigate market volatility effectively. Its adaptability and precision make it an invaluable tool for scalpers, swing traders, and long-term investors alike.
Note on Closed-Source Policy
As part of my development principles, I choose to publish my indicators as closed-source to preserve the uniqueness and integrity of the algorithms used. While the underlying logic remains private, the detailed description provided ensures that traders can fully understand the purpose, functionality, and application of the indicator. This approach allows me to focus on delivering original tools that add value to the trading community.
Disclaimer
This script is provided under the Mozilla Public License 2.0 and is intended for educational purposes only. It should not be construed as financial advice. Always combine this indicator with additional market context and use sound risk management practices.

TP RSITP RSI - Integrated Trend, Momentum, and Volatility Analyzer
The TP RSI indicator is an innovative 3-in-1 technical analysis tool that combines RSI, Bollinger Bands, and an EMA ribbon to provide traders with a comprehensive view of trend, momentum, and volatility in a single, easy-to-interpret visual display.
Why This Combination? This mashup addresses three critical aspects of market analysis simultaneously:
Trend identification and strength (EMA ribbon)
Momentum measurement (RSI)
Volatility assessment (Bollinger Bands)
By integrating these components, traders can make more informed decisions based on multiple factors without switching between different indicators.
How Components Work Together:
1. EMA Ribbon (Trend):
10 EMAs form 5 color-coded bands
Blue: Uptrend, Red: Downtrend
Provides a nuanced view of trend strength and potential reversals
2. RSI (Momentum):
Color-coded for quick interpretation
Blue: Upward momentum, Red: Downward momentum, White: Neutral
Position relative to the ribbon offers additional insight
3. Bollinger Bands (Volatility):
Applied to RSI for dynamic overbought/oversold levels
Narrow bands indicate low volatility, suggesting potential breakouts
Unique Aspects and Originality:
Synergistic visual cues: Color coordination between ribbon and RSI
Multi-factor confirmation: Requires alignment of trend, momentum, and volatility for strong signals
Volatility-adjusted momentum: RSI interpreted within the context of Bollinger Bands
How these components work together:
Buy Signal: Blue ribbon with blue RSI outside the ribbon.
Sell Signal: Red ribbon with red RSI outside the ribbon.
Neutral: White RSI or RSI inside the ribbon (not recommended for trading)
Increasing Momentum: RSI crossing above upper Bollinger Band (upward) or below lower Band (downward).
Trend Strength: RSI rejection by the ribbon, while all bands are colored along with the trend direction, identifies a strong trend.

Johnny's Adjusted BB Buy/Sell Signal"Johnny's Adjusted BB Buy/Sell Signal" leverages Bollinger Bands and moving averages to provide dynamic buy and sell signals based on market conditions. This indicator is particularly useful for traders looking to identify strategic entry and exit points based on volatility and trend analysis.
How It Works
Bollinger Bands Setup: The indicator calculates Bollinger Bands using a specified length and multiplier. These bands serve to identify potential overbought (upper band) or oversold (lower band) conditions.
Moving Averages: Two moving averages are calculated — a trend moving average (trendMA) and a long-term moving average (longTermMA) — to gauge the market's direction over different time frames.
Market Phase Determination: The script classifies the market into bullish or bearish phases based on the relationship of the closing price to the long-term moving average.
Strong Buy and Sell Signals: Enhanced signals are generated based on how significantly the price deviates from the Bollinger Bands, coupled with the average candle size over a specified lookback period. The signals are adjusted based on whether the market is bullish or bearish:
In bullish markets, a strong buy signal is triggered if the price significantly drops below the lower Bollinger Band. Conversely, a strong sell signal is activated when the price rises well above the upper band.
In bearish markets, these signals are modified to be more conservative, adjusting the thresholds for triggering strong buy and sell signals.
Features:
Flexibility: Users can adjust the length of the Bollinger Bands and moving averages, as well as the multipliers and factors that determine the strength of buy and sell signals, making it highly customizable to different trading styles and market conditions.
Visual Aids: The script vividly plots the Bollinger Bands and moving averages, and signals are visually represented on the chart, allowing traders to quickly assess trading opportunities:
Regular buy and sell signals are indicated by simple shapes below or above price bars.
Strong buy and sell signals are highlighted with distinctive colors and placed prominently to catch the trader's attention.
Background Coloring: The background color changes based on the market phase, providing an immediate visual cue of the market's overall sentiment.
Usage:
This indicator is ideal for traders who rely on technical analysis to guide their trading decisions. By integrating both Bollinger Bands and moving averages, it provides a multi-faceted view of market trends and volatility, making it suitable for identifying potential reversals and continuation patterns. Traders can use this tool to enhance their understanding of market dynamics and refine their trading strategies accordingly.

VCBBDOVWAPSMA By Anil ChawraHow Users Can Make Profit Using This Script:
1. Volume Representation : Each candle on the chart represents a specific time period (e.g., 1 minute, 1 hour, 1 day) and includes information about both price movement and trading volume during that period.
2. Candlestick Anatomy : A volume candle has the same components as a regular candlestick: the body (which represents the opening and closing prices) and the wicks or shadows (which indicate the highest and lowest prices reached during the period).
3. Volume Bars : Instead of just the candlestick itself, volume candles also include a bar or histogram representing the trading volume during that period. The height or length of the volume bar indicates the amount of trading activity.
4. Interpreting Volume : High volume candles typically indicate increased market interest or activity during that period. This could be due to significant buying or selling pressure.
5. Confirmation : Traders often look for confirmation from other technical indicators or price action to validate the significance of a high volume candle. For example, a high volume candle breaking through a key support or resistance level may signal a strong market move.
6. Trend Strength : Volume candles can provide insights into the strength of a trend. A series of high volume candles in the direction of the trend suggests strong momentum, while decreasing volume may indicate weakening momentum or a potential reversal.
7. Volume Patterns : Traders also analyze volume patterns, such as volume spikes or divergences, to identify potential trading opportunities or reversals.
8. Combination with Price Action: Volume analysis is often used in conjunction with price action analysis and other technical indicators to make more informed trading decisions.
9. Confirmation and Validation: It's important to confirm the significance of volume candles with other indicators or price action signals to avoid false signals.
10. Risk Management : As with any trading strategy, proper risk management is crucial when using volume candles to make trading decisions. Set stop-loss orders and adhere to risk management principles to protect your capital.
How to script works :
1.Identify High Volume Candles: Look for candles with significantly higher volume compared to the surrounding candles. These can indicate increased market interest or activity.
2.Wait for Confirmation: Once you identify a high volume candle, wait for confirmation from subsequent candles to ensure the momentum is sustained.
3.Enter the Trade: After confirmation, consider entering a trade in the direction indicated by the high volume candle. For example, if it's a bullish candle, consider buying.
4.Set Stop Loss: Always set a stop loss to limit potential losses in case the trade goes against you.
5.Take Profit: Set a target for taking profits. This could be based on technical analysis, such as a resistance level or a certain percentage gain.
6.Monitor Volume: Continuously monitor volume to gauge the strength of the trend. Decreasing volume may signal weakening momentum and could be a sign to exit the trade.
7.Risk Management: Manage risk carefully by adjusting position sizes according to your risk tolerance and the size of your trading account.
8.Review and Adapt: Regularly review your trades and adapt your strategy based on what's working and what's not.
Remember, no trading strategy guarantees profits, and it's essential to practice proper risk management and have realistic expectations. Additionally, consider combining volume analysis with other technical indicators for a more comprehensive approach to trading.
**How Users Can Make Profit Using This Script:
**
DAYS OPEN LINE:
1.Purpose: Publishing a "Days Open Line" indicator serves to inform customers about the operational schedule of a business or service.
2.Visibility: It ensures that the information regarding the days of operation is easily accessible to current and potential customers.
3.Transparency: By making the operational schedule public, businesses demonstrate transparency and reliability to their customers.
4.Accessibility: The indicator should be published on various platforms such as the business website, social media channels, and physical locations to ensure accessibility to a wide audience.
5.Clarity: The information should be presented in a clear and concise manner, specifying the days of the week the business is open and the corresponding operating hours.
6.Updates: It's important to regularly update the "Days Open Line" indicator to reflect any changes in the operational schedule, such as holidays or special events.
7.Customer Convenience: Providing this information helps customers plan their visits accordingly, reducing inconvenience and frustration due to unexpected closures.
8.Expectation Management: Setting clear expectations regarding the business hours helps manage customer expectations and reduces the likelihood of disappointment or complaints.
9.Customer Service: Publishing the "Days Open Line" indicator demonstrates a commitment to customer service by ensuring that customers have the information they need to engage with the business.
10.Brand Image: Consistently .maintaining and updating the indicator contributes to a positive brand image, as it reflects professionalism, reliability, and a customer-centric approach.
SMA CROSS:
1.This indicator generates buy and sell signals based on the crossover of two Simple Moving Averages (SMA): a shorter 3-day SMA and a longer 8-day SMA.
When the 3-day SMA crosses above the 8-day SMA, it generates a buy signal indicating a potential upward trend.
Conversely, when the 3-day SMA crosses below the 8-day SMA, it generates a sell signal indicating a potential downward trend.
Signal Interpretation:
2.Buy Signal: Generated when the 3-day SMA crosses above the 8-day SMA.
Sell Signal: Generated when the 3-day SMA crosses below the 8-day SMA.
Usage:
3.Traders can use this indicator to identify potential entry and exit points in the market.
Buy signals suggest a bullish trend, indicating a favorable time to enter or hold a long position.
4.Sell signals suggest a bearish trend, indicating a potential opportunity to exit or take a short position.
Parameters:
5.Periods: 3-day SMA and 8-day SMA.
Price: Closing price is commonly used, but users can choose other price types (open, high, low) for calculation.
Confirmation:
6.It's recommended to use additional technical analysis tools or confirmatory indicators to validate signals and minimize false signals.
Risk Management:
7.Implement proper risk management strategies, such as setting stop-loss orders, to mitigate losses in case of adverse price movements.
Backtesting:
8.Before using the indicator in live trading, conduct thorough backtesting to evaluate its effectiveness under various market conditions.
Considerations:
9.While SMA crossovers can provide valuable insights, they may generate false signals during ranging or choppy markets.
Combine this indicator with other technical analysis techniques for comprehensive market analysis.
Continuous Optimization:
10.Monitor the performance of the indicator and adjust parameters or incorporate additional filters as needed to enhance accuracy over time.
BOLLINGER BAND:
1.Definition: A Bollinger Band indicator is a technical analysis tool that consists of a centerline (typically a moving average) and two bands plotted above and below it. These bands represent volatility around the moving average.
2.Purpose: Publishing a Bollinger Band indicator serves to provide traders and investors with insights into the volatility and potential price movements of a financial instrument.
3.Visualization: The indicator is typically displayed on price charts, allowing users to visualize the relationship between price movements and volatility levels.
4.Interpretation: Traders use Bollinger Bands to identify overbought and oversold conditions, potential trend reversals, and volatility breakouts.
5.Components: The indicator consists of three main components: the upper band, lower band, and centerline (usually a simple moving average). These components are calculated based on standard deviations from the moving average.
6.Parameters: Traders can adjust the parameters of the Bollinger Bands, such as the period length and standard deviation multiplier, to customize the indicator based on their trading strategy and preferences.
7.Signals: Bollinger Bands generate signals when prices move outside the bands, indicating potential trading opportunities. For example, a price breakout above the upper band may signal a bullish trend continuation, while a breakout below the lower band may indicate a bearish trend continuation.
8.Confirmation: Traders often use other technical indicators or price action analysis to confirm signals generated by Bollinger Bands, enhancing the reliability of their trading decisions.
9.Education: Publishing Bollinger Band indicators can serve an educational purpose, helping traders learn about technical analysis concepts and how to apply them in real-world trading scenarios.
10.Risk Management: Traders should exercise proper risk management when using Bollinger Bands, as false signals and market volatility can lead to losses. Publishing educational content alongside the indicator can help users understand the importance of risk management in trading.
VWAP:
1.Calculation: VWAP is calculated by dividing the cumulative sum of price times volume traded for every transaction (price * volume) by the total volume traded.
2.Time Frame: VWAP is typically calculated for a specific time frame, such as a trading day or a session.
3.Intraday Trading: It's commonly used by intraday traders to assess the fair value of a security and to determine if the current price is above or below the average price traded during the day.
4.Execution: Institutional traders often use VWAP as a benchmark for executing large orders, aiming to buy at prices below VWAP and sell at prices above VWAP.
5.Benchmark: It serves as a benchmark for traders to evaluate their trading performance. Trades executed below VWAP are considered good buys, while those above are considered less favorable.
6.Sensitivity: VWAP is more sensitive to price and volume changes during periods of high trading activity and less sensitive during periods of low trading activity.
7.Day's End: VWAP resets at the end of each trading day, providing a new reference point for the following trading session.
8.Volume Weighting: The weighting by volume means that prices with higher trading volumes have a greater impact on VWAP than those with lower volumes.
9.Popular with Algorithmic Traders: Algorithmic trading systems often incorporate VWAP strategies to execute trades efficiently and minimize market impact.
10.Limitations: While VWAP is a useful indicator, it's not foolproof. It may lag behind rapidly changing market conditions and may not be suitable for all trading strategies or market conditions. Additionally, it's more effective in liquid markets where there is significant trading volume.

Day Open Line + SMA 8/3 Crossover + BollingerHow Users Can Make Profit Using This Script:
DAYS OPEN LINE:
1.Purpose: Publishing a "Days Open Line" indicator serves to inform customers about the operational schedule of a business or service.
2.Visibility: It ensures that the information regarding the days of operation is easily accessible to current and potential customers.
3.Transparency: By making the operational schedule public, businesses demonstrate transparency and reliability to their customers.
4.Accessibility: The indicator should be published on various platforms such as the business website, social media channels, and physical locations to ensure accessibility to a wide audience.
5.Clarity: The information should be presented in a clear and concise manner, specifying the days of the week the business is open and the corresponding operating hours.
6.Updates: It's important to regularly update the "Days Open Line" indicator to reflect any changes in the operational schedule, such as holidays or special events.
7.Customer Convenience: Providing this information helps customers plan their visits accordingly, reducing inconvenience and frustration due to unexpected closures.
8.Expectation Management: Setting clear expectations regarding the business hours helps manage customer expectations and reduces the likelihood of disappointment or complaints.
9.Customer Service: Publishing the "Days Open Line" indicator demonstrates a commitment to customer service by ensuring that customers have the information they need to engage with the business.
10.Brand Image: Consistently .maintaining and updating the indicator contributes to a positive brand image, as it reflects professionalism, reliability, and a customer-centric approach.
SMA CROSS:
1.This indicator generates buy and sell signals based on the crossover of two Simple Moving Averages (SMA): a shorter 3-day SMA and a longer 8-day SMA.
When the 3-day SMA crosses above the 8-day SMA, it generates a buy signal indicating a potential upward trend.
Conversely, when the 3-day SMA crosses below the 8-day SMA, it generates a sell signal indicating a potential downward trend.
Signal Interpretation:
2.Buy Signal: Generated when the 3-day SMA crosses above the 8-day SMA.
Sell Signal: Generated when the 3-day SMA crosses below the 8-day SMA.
Usage:
3.Traders can use this indicator to identify potential entry and exit points in the market.
Buy signals suggest a bullish trend, indicating a favorable time to enter or hold a long position.
4.Sell signals suggest a bearish trend, indicating a potential opportunity to exit or take a short position.
Parameters:
5.Periods: 3-day SMA and 8-day SMA.
Price: Closing price is commonly used, but users can choose other price types (open, high, low) for calculation.
Confirmation:
6.It's recommended to use additional technical analysis tools or confirmatory indicators to validate signals and minimize false signals.
Risk Management:
7.Implement proper risk management strategies, such as setting stop-loss orders, to mitigate losses in case of adverse price movements.
Backtesting:
8.Before using the indicator in live trading, conduct thorough backtesting to evaluate its effectiveness under various market conditions.
Considerations:
9.While SMA crossovers can provide valuable insights, they may generate false signals during ranging or choppy markets.
Combine this indicator with other technical analysis techniques for comprehensive market analysis.
Continuous Optimization:
10.Monitor the performance of the indicator and adjust parameters or incorporate additional filters as needed to enhance accuracy over time.
BOLLINGER BAND:
1.Definition: A Bollinger Band indicator is a technical analysis tool that consists of a centerline (typically a moving average) and two bands plotted above and below it. These bands represent volatility around the moving average.
2.Purpose: Publishing a Bollinger Band indicator serves to provide traders and investors with insights into the volatility and potential price movements of a financial instrument.
3.Visualization: The indicator is typically displayed on price charts, allowing users to visualize the relationship between price movements and volatility levels.
4.Interpretation: Traders use Bollinger Bands to identify overbought and oversold conditions, potential trend reversals, and volatility breakouts.
5.Components: The indicator consists of three main components: the upper band, lower band, and centerline (usually a simple moving average). These components are calculated based on standard deviations from the moving average.
6.Parameters: Traders can adjust the parameters of the Bollinger Bands, such as the period length and standard deviation multiplier, to customize the indicator based on their trading strategy and preferences.
7.Signals: Bollinger Bands generate signals when prices move outside the bands, indicating potential trading opportunities. For example, a price breakout above the upper band may signal a bullish trend continuation, while a breakout below the lower band may indicate a bearish trend continuation.
8.Confirmation: Traders often use other technical indicators or price action analysis to confirm signals generated by Bollinger Bands, enhancing the reliability of their trading decisions.
9.Education: Publishing Bollinger Band indicators can serve an educational purpose, helping traders learn about technical analysis concepts and how to apply them in real-world trading scenarios.
10.Risk Management: Traders should exercise proper risk management when using Bollinger Bands, as false signals and market volatility can lead to losses. Publishing educational content alongside the indicator can help users understand the importance of risk management in trading.
VWAP:
1.Calculation: VWAP is calculated by dividing the cumulative sum of price times volume traded for every transaction (price * volume) by the total volume traded.
2.Time Frame: VWAP is typically calculated for a specific time frame, such as a trading day or a session.
3.Intraday Trading: It's commonly used by intraday traders to assess the fair value of a security and to determine if the current price is above or below the average price traded during the day.
4.Execution: Institutional traders often use VWAP as a benchmark for executing large orders, aiming to buy at prices below VWAP and sell at prices above VWAP.
5.Benchmark: It serves as a benchmark for traders to evaluate their trading performance. Trades executed below VWAP are considered good buys, while those above are considered less favorable.
6.Sensitivity: VWAP is more sensitive to price and volume changes during periods of high trading activity and less sensitive during periods of low trading activity.
7.Day's End: VWAP resets at the end of each trading day, providing a new reference point for the following trading session.
8.Volume Weighting: The weighting by volume means that prices with higher trading volumes have a greater impact on VWAP than those with lower volumes.
9.Popular with Algorithmic Traders: Algorithmic trading systems often incorporate VWAP strategies to execute trades efficiently and minimize market impact.
10.Limitations: While VWAP is a useful indicator, it's not foolproof. It may lag behind rapidly changing market conditions and may not be suitable for all trading strategies or market conditions. Additionally, it's more effective in liquid markets where there is significant trading volume.
How the Script Works:
1.Utilizes Day Open Line for accurate market entry points.
2.Identifies bullish trends with SMA 3 crossover SMA 8.
3.Signals potential sell opportunities with SMA 8 crossunder SMA 3.
4.Bollinger Bands indicate overbought and oversold conditions.
5.VWAP offers insights into average price levels weighted by volume.
6.Combination of indicators enhances trade confirmation.
7.Facilitates precise timing for buy and sell decisions.
8.Enables traders to capitalize on market volatility.
9.Empowers users to navigate dynamic market conditions.
10.Supports profitable trading strategies with comprehensive analysis.
11.It is known when the market is sideways.

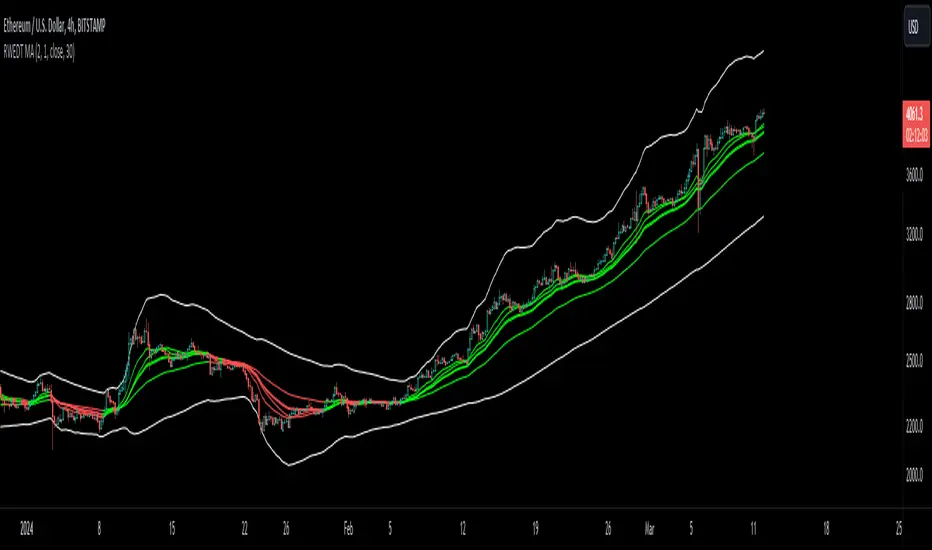
RWEDT Weighted Moving Average Overview:
The RWEDT MA, which is short for rolling, weighted, exponential, double exponential, and triple exponential, is a group of moving averages that were subjected to a log transformation to deal with the skewness of price, and the weight of each of these moving averages was also used for calculating the standard deviations from the mean.
Clearing a misunderstanding on Standard Deviation Bands and Moving Averages
Bands, such as standard deviation bands, are frequently misinterpreted as indicators of support and resistance levels or as "mean-reverting" indicators." However, this is not their intended purpose. Bands are statistical tools that provide ranges within which price (in this case) movements are expected to occur based on historical data. Deviations beyond these bands suggest a decrease in confidence in the model rather than a reversal back to a moving average or a "support/resistance level."
Example : Assuming you correctly applied a log transformation to your standard deviation bands to remove the right skew, and assuming your data closely resembles a normal distribution or some other type of symmetrical distribution, then the probability of a value being in the 2 standard deviation range is around 95%. This does not mean it will reject or go up, or mean revert. The price won't bounce from -2 STDEV 95% of the time; that is incorrect. It just tells you that around 95% of the values will be within the 2 SD range.
Moving averages, including the ones in this indicator, are often misinterpreted as signals of trend reversals or levels of "bouncing." What moving averages actually tell you is what the expected value is. It does not show where you expect the price to be in the future; it tells you that based on the lookback, the expected value is in the center, and the confidence you have in the estimate is the confidence interval or the standard deviation range.
Example: Let's say you enter a trade with a positive expected value (expecting the price to drift up), and we have the limits set at 95%. What it tells you is that as long as the price stays within the limits, you can be 95% certain the model isn't completely random. As the price moves further away from the average, or expected value, it tells you that the model is less likely to be correct.
RWEDT MA
This indicator comes with 5 moving averages, each log transformed to reduce the skewness and asymmetry of price as much as possible
Rolling
Weighted
Exponential
Double Exponential
Triple Exponential
The band standard deviation can be adjusted, and the standard deviations have the weight of all of the moving averages that are present in the indicator. The weight is not customizable.
Why this indicator is useful:
This indicator can tell you what the expected value is. Above the moving average signifies a positive expected value, and below the moving average signifies a negative expected value. As previously stated above, the price moving further from the expected value lets you know that you should have less confidence that the model is "correct," and you could see this as taking profits as the price deviates further from the expected value.
The importance of log-transforming prices for standard deviations and moving averages.
Symmetry: Logarithmic transformations can help achieve symmetry in the distribution of price data. Stock prices, for example, exhibit some type of right-skewed distribution, where large positive price movements are more common than large negative movements. Price also can't go below 0 but can go towards positive infinity, so having a right-skew makes sense; all the outliers will be towards infinity, while all the average occurrences are "near" 0.
Stabilizing Variance: Price data typically exhibit heteroscedasticity, meaning that the variance of price movements changes over time. Log transformations can stabilize the variance and make it more consistent across different price levels. This is important for ensuring that the variability in price moves is not disproportionately influenced by extreme values.
Statistical Assumptions: Many retail indicators like Bollinger Bands use the standard deviation and moving average models of a normal distribution to attempt to model price, whose distribution more closely resembles some type of right-skew distribution. Even with the log-transformation, it still won't always resemble a perfect symmetrical distribution, and you still should not use it for mean reversion. You can still use it to understand the expected value and whether or not you should have confidence in your model.
Bollinger OTT SpreadBollinger OTT Spread (BOOTS) is a development combining Bollinger Bands with Optimized Trend Tracker (OTT) Indicator by Anıl Özekşi.
Bollinger Bands have originally 3 lines: Simple Moving Average (Middle Line), Upper Band and Lower Band.
BOOTS concentrates on the upper and lower Bollinger band lines.
First, it calculates the OTT using the UPPER and LOWER Bollinger Bands in a period of time (default lengths are 2) instead of closing prices.
After that, Upper and lower bands have more constant values.
There are 2 lines in BOOTS:
-The top (cyan) line is originally an OTT of the Upper Bollinger Band. (BOOTShigh)
-The bottom line (purple) is also an OTT line but conversely uses Lower Bollinger Band in the same period. (BOOTSlow)
Default values:
Bollinger Bands Moving AveragePeriod: 2 Bars
OTT Length: 2 Bars
OTT Optimizing coefficient (percent): %10
Bollinger Bands Standart Deviation Multiplier: 2 (not adjustable)
These values are designed for daily time frame, so they have to be optimized in other timeframes by the user. (Ex: Higher values can be considered in lower time frames)
Originally, Bollinger Bands used a Simple Moving Average in their calculation, but this time, Anıl Özekşi prefers VIDYA (Variable Dynamic Moving Average = VAR) instead of a Simple Moving Average.
Bollinger Bands cannot create significant BUY & SELL signals considering their original logic, but the primary purpose of BOOTS is to have substantial trading signals:
BUY when the price crosses above the BOOTSLower line (purple line)
STOP when the price crosses back below the BOOTSLower line (purple line)
SELL when the price crosses below the BOOTSUpper line (cyan line)
STOP when the price crosses back above the BOOTSUpper line (cyan line)
The price zone between the two lines is the flat zone; traders don't consider taking new positions in that area between the two lines.
Developer Anıl Özekşi advises that traders may have more accurate signals when using a short-period moving average instead of closing prices. So, I added a moving average with the same default length of 2 , which was used in Bollinger Bands calculation. You can check the "SHOW MOVING AVERAGE?" box on the settings tab of the indicator.

MoonFlag BTC Daily Swing PredictorThis script mainly works on BTC on the daily timeframe. Other coins also show similar usefulness with this script however, BTC on the daily timeframe is the main design for this script.
(Please note this is not trading advice this is just comments about how this indicator works.)
This script is predictive. It colors the background yellow when the script calculates a large BTC swing is potentially about to happen. It does not predict in which direction the swing will occur but it leads the price action so can be useful for leveraged trades. When the background gets colored with vertical yellow lines - this shows that a largish price swing is probably going to occur.
The scripts also shades bands around the price action that are used to estimate an acceptable volatility at any given time. If the bands are wide that means price action is volatile and large swings are not easily predicted. Over time, with reducing volatility, these price action bands narrow and then at a set point or percentage (%) which can be set in the script settings, the background gets colored yellow. This indicates present price action is not volatile and a large price swing is potentially going to happen in the near future. When price action breaks through the narrowing bands, the background is no longer presented because this is seen as an increase in volatility and a considerable portion of the time, a large sudden drop in price action or momentous gain in price is realized.
This indicator leads price action. It predicts that a swing is possibly going to happen in the near future. As the indicator works on the BTC daily, this means on a day-to-day basis if the bands continually narrow - a breakout is more likely to happen. In order to see how well this indicator works, have a look at the results on the screenshot provided. Note the regions where vertical yellow lines are present on the price action - and then look after these to see if a sizeable swing in price has occurred.
To use this indicator - wait until yellow vertical lines are presented on the BTC daily. Then use your experience to determine which way the price action might swing and consider entering a trade or leveraged trade in this direction. Alternatively wait a while to see in which direction the break-out occurs and considering and attempt to trade with this. Sometimes swings can be unexpected and breakout in one direction before then swinging much larger in the other. Its important to remember/consider that this indicator works on the BTC daily timeframe, so any consideration of entering a trade should be expected to cover a duration over many days or weeks, or possibly months. A large swing is only estimated every several plus months.
Most indicators are based on moving averages. A moving average is not predictive in the sense in that it lags price actions. This indicator creates bands that are based on the momentum of the price action. A change in momentum of price action therefore causes the bands to widen. When the bands narrow this means that the momentum of the price action is steady and price action volatility has converged/reduced over time. With BTC this generally means that a large swing in price action is going to occur as momentum in price action then pick-up again in one direction or another. Trying to view this using moving averages is not easy as a moving average lags price action which means that it is difficult to predict any sudden movements in price action ahead of when they might occur. Although, moving averages will converge over time in a similar manner as the bands calculated by this script. This script however, uses the price action momentum in a predictive manner to estimate where the price action might go based on present price momentum. This script therefore reacts to reduced volatility in price action much faster than a set of moving averages over various timescales can achieve.
MoonFlag

Scalp Tool
This script is primarily intended as a scalping tool.
The theory of the tool is based on the fact that the price always returns to its mean.
Elements used:
1. VWMA as a moving average. VWMA is calculated once based on source close and once based on source open.
2. the bands are not calculated like the Bollinger Band, but only a settlement is calculated for the lower bands based on the Lows and for the upper bands based on the Highs. Thus the bands do not become thicker or thinner, but remain in the same measure to the mean value above or below the price.
3. a volume filter on simple calculation of a MA with deviation. Therefore, it can be identified if a volume breakout has occurred.
4. support and resistance zones which are calculated based on the highs and lows over a certain length.
5. RSI to determine oversold and overbought zones. It also tries to capture the momentum by using a moving average (variable selectable) to filter the signals. The theory is that in an uptrend the RSI does not go below 50 and in a downtrend it does not go above 50.
However, this can be very different depending on the financial instrument.
Explanation of the signals:
The main signal in this indicator Serves for pure short-term trading and is generated purely on the basis of the bands and the RSI.
Only the first bands are taken into account.
Buy signal is generated when the price opens below the lower band 1 and closes above the lower band 1 or the RSI crosses a value of 25 from bottom to top.
Sell signal is generated when the price opens above the Upper Band 1 and closes below the Upper Band 1 or the RSI crosses a value of 75 from top to bottom.
The position should be closed when the price hits the opposite band. Alternatively, it can also be closed at the mean.
Other side signals:
1. breakouts:
The indicator includes 2 support and resistance zones, which differ only in length. For the breakout signals, the short version of the R/S is used. A signal is generated when the price breaks through the zones with increased volume. It is then assumed that the price will continue to follow the breakout.
The values of the S/R are adjustable and marked with "BK".
The value under Threshold 2 defines the volume breakout. 4 is considered as the highest value. The smaller the value, the smaller the volume must be during a breakout.
2. bounce
If the price hits a S/R (here the long variant is used with the designation "Support" or "Resistance") and makes a wick with small volume, the script assumes a bounce and generates a Sell or Buy signal accordingly.
The volume can be defined under "Threshold".
The S/R according to the designation as well.
Combined signals:
If the value of the S/R BK and the S/R is the same and the bounce logic of the S/R BK applies and an RSI signal is also generated, a signal is also plotted.
Here the idea was to get very strong signals for possible swing entries.
4. RSI Signals
The script contains two RSI.
RSI 1:
Bullish signal is generated when the set value is crossed from the bottom to the top.
Bearish signal is generated when the set value is crossed from the top to the bottom.
RSI 2:
Bullish signal is generated when the set value is crossed from the top to the bottom.
Bearish signal is generated when the set value is crossed from bottom to top.
For RSI 2 the theory is taken into account according to the description under Used elements point 5
Optical trend filter:
Also an optical trend filter was generated which fills the bands accordingly.
For this the VWMA is used and the two average values of the band.
Color definition:
Gray = Neutral
Red = Bearish
Green = Bullish
If the mean value is above the VWMA and the mean value based on the closing price is above the mean value based on the open price, the band is colored green. It is a bullish trend
If the mean value is below the VWMA and the mean value based on the closing price is below the mean value based on the open price, the band is colored red.
The band is colored gray if the mean value is correspondingly opposite. A sideways phase is assumed.
The script was developed on the basis of the pair BTCUSD in the 15 minute chart and the settings were defined accordingly on it. The display of S/R for forex pairs does not work correctly and should be hidden. The logic works anyway.
When using the script, all options should first be set accordingly to the asset and tested before trading afterwards. It applies of course also here that there is no 100% guarantee.
Also, a strong breakout leads to false signals and overheating of the indicator.

Ultimate Trend ChannelThe "Ultimate Trend Channel" indicator is a comprehensive trend analysis tool that calculates and displays a series of upper and lower bands based on user-defined input lengths. It uses linear regression and standard deviation to determine these bands for each of the 21 different group lengths. The indicator then computes the averages of these upper and lower bands, as well as the average of all the bands combined.
The visualization on the chart includes the plotting of the average upper and lower bands, with the space between these bands shaded for easy visualization of the overall trend. Additionally, the average of all the bands, referred to as the "Ultimate Trend Line," is also plotted on the chart.
This indicator provides a robust way of assessing market trends and volatility over varying periods, which can be extremely useful for both short-term and long-term trading strategies.

Kairos QX Indicator [v1.7]What’s New in v1.7?
Streak Analytics (Dashboard Expansion):
The dashboard now tracks Winning and Losing Streaks.
Max Consec. (TP / SL): Displays the highest number of wins and losses that occurred in a row (e.g., 5 / 3).
Avg Consec. (TP / SL): Calculates the average length of your winning and losing streaks (e.g., 2.4 / 1.8).
Updated Default "settings" for MNQ 5 MIN Candles
Full Script Description
This script is a professional-grade Mean Reversion & Trend Following Engine designed for automated execution. It acts as a bridge between discretionary chart analysis and algorithmic trading, allowing you to backtest complex ideas visually and then automate them via alerts without writing code.
1. Core Logic: The "Flip Switch" Strategy
Standard Mode (Mean Reversion):
The script identifies "exhaustion" points where price pierces the Bollinger Bands.
It bets on a reversal (e.g., Price > Upper Band = Short).
Inverse Mode (Trend Following - Default):
With the "Inverse Trades" box checked, the logic flips.
It identifies "breakout" points where price pierces the bands.
It bets on continuation (e.g., Price > Upper Band = Long).
2. Advanced Automation & Safety Features
This system is built to drive trading bots (like TradersPost or 3Commas) safely:
State-Aware Execution: It tracks its own trades (in_trade state). It will never fire a duplicate "Open" signal if a trade is already active, preventing accidental pyramiding.
No Trade Zone (Force Close): You can define a specific time window (default 15:10–17:00). If a trade is open when this time hits, the script immediately triggers a Close Alert, preventing overnight holds.
Signal Cooldown: Configurable "Signals to Skip" allows you to force a cooldown period after a trade closes to avoid over-trading in choppy conditions.
3. Real-Time Analytics Dashboard
The on-chart table provides a transparent, real-time backtest of your settings:
Equity Calculator: You can set a dollar value per point (e.g., $2 for MNQ). The dashboard calculates your estimated Net Profit/Loss based on the total points gained.
Streak Analysis: Shows both the Maximum and Average number of consecutive wins and losses, helping you understand the psychological difficulty of trading the strategy.
Data Integrity: It automatically detects "N/A" trades (candles that hit both SL and TP) and excludes them from the Win Rate calculation to ensure realistic statistics.
4. Modular "Recipe" Building
The strategy is highly customizable via the settings menu (no coding required). You can filter the Bollinger Band trigger with 10 different indicators:
Supported Filters: RSI, Stochastic, CCI, Williams %R, MFI, CMO, Fisher Transform, Ultimate Oscillator, and ROC.
Logic: All selected filters must agree with the main trigger for a trade to fire.
5. Visual Projection Engine
Glowing Outcomes: The script draws exact TP (Green) and SL (Red) boxes for past trades. These boxes glow to indicate the result, allowing for rapid visual verification of the strategy's performance.
Force Close Markers: Special gray markers appear on the chart where a trade was forced to close due to the "No Trade Zone" time limit.

IDLP – Intraday Daily Levels Pro [FXSMARTLAB]🔥 IDLP – Intraday Daily Levels Pro
IDLP – Intraday Daily Levels Pro is a precision toolkit for intraday traders who rely on objective daily structure instead of repainting indicators and noisy signals.
Every level plotted by IDLP is derived from one simple rule:
Today’s trading decisions must be based on completed market data only.
That means:
✅ No use of the current day’s unfinished data for levels
✅ No lookahead
✅ No hidden repaint behavior
IDLP reconstructs the previous trading day from the intraday chart and then projects that structure forward onto the current session, giving you a stable, institutional-style intraday map.
🧱 1. Previous Daily Levels (Core Structure)
IDLP extracts and displays the full previous daily structure, which you can toggle on/off individually via the inputs:
Previous Daily High (PDH)
Previous Daily Low (PDL)
Previous Daily Open
Previous Daily Close,
Previous Daily Mid (50% of the range)
Previous Daily Q1 (25% of the range)
Previous Daily Q3 (75% of the range)
All of these come from the day that just closed and are then locked for the entire current session.
What these levels tell you:
PDH / PDL – true extremes of yesterday’s price action (liquidity zones, breakout/reversal points).
Previous Daily Open / Close – how the market positioned itself between session start and end
Mid (50%) – equilibrium level of the previous day’s auction.
Q1 / Q3 (25% / 75%) internal structure of the previous day’s range, dividing it into four equal zones and helping you see if price is trading in the lower, middle, or upper quarter of yesterday’s range.
All these levels are non-repaint: once the day is completed, they are fixed and never change when you scroll, replay, or backtest.
🎯 2. Previous Day Pivot System (P, S1, S2, R1, R2)
IDLP includes a classic floor-trader pivot grid, but critically:
It is calculated only from the previous day’s high, low, and close.
So for the current session, the following are fixed:
Pivot P – central reference level of the previous day.
Support 1 (S1) and Support 2 (S2)
Resistance 1 (R1) and Resistance 2 (R2)
These levels are widely used by institutional desks and algos to structure:
mean-reversion plays, breakout zones, intraday targets, and risk placement.
Everything in this section is non-repaint because it only uses the previous day’s fully closed OHLC.
📏 3. 1-Day ADR Bands Around Previous Daily Open
Instead of a multi-day ADR, IDLP uses a pure 1-Day ADR logic:
ADR = Range of the previous day
ADR = PDH − PDL
From that, IDLP builds two clean bands centered around the previous daily Open:
ADR Upper Band = Previous Day Open + (ADR × Multiplier)
ADR Lower Band = Previous Day Open − (ADR × Multiplier)
The multiplier is user-controlled in the inputs:
ADR Multiplier (default: 0.8)
This lets you choose how “tight” or “wide” you want the ADR envelope to be around the previous day’s open.
Typical use cases:
Identify realistic intraday extension targets, Spot exhaustion moves beyond ADR bands, Frame reversals after reaching volatility extremes, Align trades with or against volatility expansion
Again, since ADR is calculated only from the completed previous day, these bands are totally non-repaint during the current session.
🔒 4. True Non-Repaint Architecture
The internal logic of IDLP is built to guarantee non-repaint behavior:
It reconstructs each day using time("D") and tracks:
dayOpen, dayHigh, dayLow, dayClose for the current day
prevDayOpen, prevDayHigh, prevDayLow, prevDayClose for the previous day
At the moment a new day starts:
The “current day” gets “frozen” into prevDay*
These prevDay* values then drive: Previous Daily Levels, Pivots, ADR.
During the current day:
All these “previous day” values stay fixed, no matter what happens.
They do not move in real time, they do not shift in replay.
This means:
What you see in the past is exactly what you would have seen live.
No fake backtests.
No illusion of perfection from repainting behavior.
🎯 5. Designed For Intraday Traders
IDLP – Intraday Daily Levels Pro is made for:
- Day traders and scalpers
- Index and FX traders
- Prop firm challenge trading
- Traders using ICT/SMC-style levels, liquidity, and range logic
- Anyone who wants a clean, institutional-style daily framework without noise
You get:
Previous Day OHLC
Mid / Q1 / Q3 of the previous range
Previous-Day Pivots (P, S1, S2, R1, R2)
1-Day ADR Bands around Previous Day Open
All calculated only from closed data, updated once per day, and then locked.

VWAP + Volume Spikes See Where Smart Money ExhaustsVolume tells the truth. VWAP tells the bias. This script shows both — live.
If you trade intraday momentum, reversals, or liquidity sweeps, this indicator is built for you.
It shows where volume spikes hit extreme levels, anchored around VWAP and its dynamic bands, so you can instantly spot capitulation or hidden absorption.
🎯 What This Indicator Does
✅ Plots VWAP — session-anchored, updates automatically
✅ Adds dynamic VWAP bands — standard deviation envelopes showing volatility context
✅ Highlights volume spikes — colored candles + background for abnormal prints
✅ Includes alerts — “Volume Spike”, “VWAP Cross”, or a combined alert with direction
✅ Clean visual design — instantly readable in fast markets
It’s your visual orderflow radar — whether you’re trading gold, indices, or small caps.
🔍 Why It Works
Institutions build and unwind positions around VWAP.
Retail often chases volume… this script shows you when that volume becomes too extreme.
A spike above VWAP near resistance? → Likely distribution.
A spike below VWAP near support? → Likely capitulation.
Combine volume exhaustion + VWAP context, and you’ll see market turning points form before most indicators react.
⚙️ Inputs You Can Tune
Bands lookback: adjusts how reactive the VWAP bands are
Band width (σ): set how tight or wide your deviation envelope is
Volume baseline length: controls how “abnormal” a spike must be
Spike threshold: multiplier vs. average volume
Toggle color-coding, bands, and labels
Default settings work well across 1m–15m intraday charts and 1h–4h swing frames.
💡 How Traders Use It
1️⃣ Fade Parabolics:
When a green spike candle pierces upper VWAP band on high volume → smart money unloading.
Look for rejection and short into VWAP.
2️⃣ Catch Capitulations:
When a red spike candle dumps below lower VWAP band → panic selling.
Watch for stabilization and long back to VWAP.
3️⃣ VWAP Rotation Plays:
Alerts for price crossing VWAP help you spot shift in intraday control.
Above VWAP = buyers in charge.
Below VWAP = sellers in charge.
🧠 Best Practices
Pair it with Volume Profile or Delta/Flow tools to confirm exhaustion.
Don’t chase — wait for spike confirmation + reversal candle.
Use it on liquid tickers (NASDAQ, SPY, GOLD, BTC, etc.).
Great for Dux-style small-cap shorts or index pullbacks.
🔔 Alerts Ready
Choose from:
Volume Spike (single-bar explosion)
VWAP Cross Up/Down (trend shift confirmation)
One Combined Alert (any signal, includes ticker, price, and volume)
Set once — get real-time push notifications, Telegram, or webhook signals.
📊 My Favorite Setups
US100 / NASDAQ: fade rallies above VWAP + spike
Gold / Silver: trade reversals from VWAP bands
Small caps: short back-side after volume climax
ES, DAX, Oil: scalp VWAP rotation with confluence
❤️ Support This Work
I release free and premium scripts weekly — combining smart money concepts, VWAP tools, and volume analytics.
👉 Follow me on TradingView for more indicators and setups.
👉 Comment “🔥” if you want me to post the multi-timeframe VWAP + Volume Pressure version next.
👉 Share this with your team — it helps the community grow.

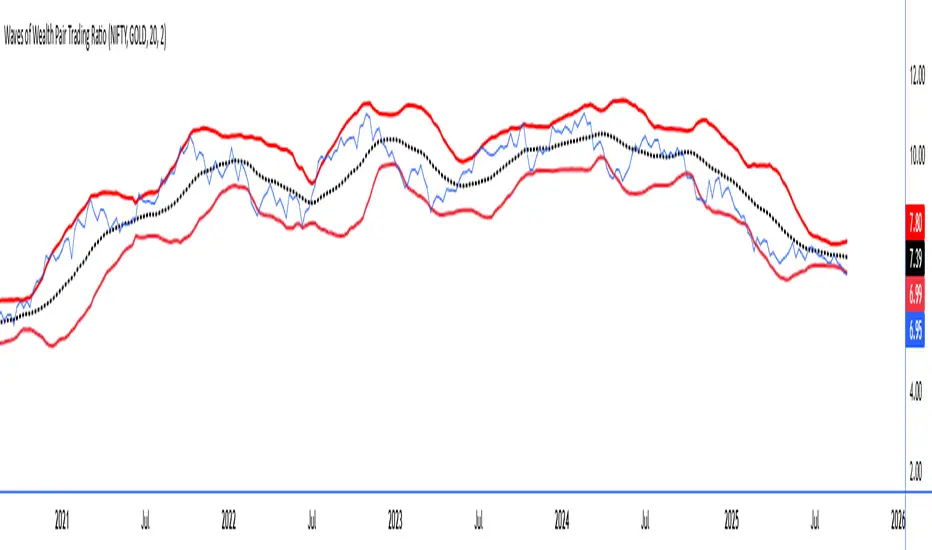
Waves of Wealth Pair Trading RatioThis versatile indicator dynamically plots the ratio between two user-selected instruments, helping traders visualize relative performance and detect potential mean-reversion or trend continuation opportunities.
Features include:
User inputs for selecting any two instrument symbols for comparison.
Adjustable moving average period to track the average ratio over time.
Customizable standard deviation multiplier to define statistical bands for overbought and oversold conditions.
Visual display of the ratio line alongside upper and lower bands for clear trading signals.
Ideal for pair traders and market analysts seeking a flexible tool to monitor inter-asset relationships and exploit deviations from historical norms.
Simply set your preferred symbols and parameters to tailor the indicator to your trading style and assets of interest.
How to Use the Custom Pair Trading Ratio Indicator
Select symbols: Use the indicator inputs to set any two instruments you want to compare—stocks, commodities, ETFs, or indices. No coding needed, just type or select from the dropdown.
Adjust parameters: Customize the moving average length to suit your trading timeframe and style. The standard deviation multiplier lets you control sensitivity—higher values mean wider bands, capturing only larger deviations.
Interpret the chart:
The ratio line shows relative strength between the two instruments.
The middle line represents the average ratio (mean).
The upper and lower bands indicate statistical extremes where price action is usually overextended.
Trading signals:
Look to enter pair trades when the ratio moves outside the bands—expecting a return to the mean.
Use the bands and mean to set stop-loss and profit targets.
Combine with other analysis or fundamental insight for best results.
EMA Percentile Rank [SS]Hello!
Excited to release my EMA percentile Rank indicator!
What this indicator does
Plots an EMA and colors it by short-term trend.
When price crosses the EMA (up or down) and remains on that side for three subsequent bars, the cross is “confirmed.”
At the moment of the most recent cross, it anchors a reference price to the crossover point to ensure static price targets.
It measures the historical distance between price and the EMA over a lookback window, separately for bars above and below the EMA.
It computes percentile distances (25%, 50%, 85%, 95%, 99%) and draws target bands above/below the anchor.
Essentially what this indicator does, is it converts the raw “distance from EMA” behavior into probabilistic bands and historical hit rates you can use for targets, stop placement, or mean-reversion/continuation decisions.
Indicator Inputs
EMA length: Default is 21 but you can use any EMA you prefer.
Lookback: Default window is 500, this is length that the percentiles are calculated. You can increase or decrease it according to your preference and performance.
Show Accumulation Table: This allows you to see the table that shows the hits/price accumulation of each of the percentile ranges. UCL means upper confidence and LCL means lower confidence (so upper and lower targets).
About Percentiles
A percentile is a way of expressing the position of a value within a dataset relative to all the other values.
It tells you what percentage of the data points fall at or below that value.
For example:
The 25th percentile means 25% of the values are less than or equal to it.
The 50th percentile (also called the median) means half the values are below it and half are above.
The 99th percentile means only 1% of the values are higher.
Percentiles are useful because they turn raw measurements into context — showing how “extreme” or “typical” a value is compared to historical behavior.
In the EMA Percentile Rank indicator, this concept is applied to the distance between price and the EMA. By calculating percentile distances, the script can mark levels that have historically been reached often (low percentiles) or rarely (high percentiles), helping traders gauge whether current price action is stretched or within normal bounds.
Use Cases
The EMA Percentile Rank indicator is best suited for traders who want to quantify how far price has historically moved away from its EMA and use that context to guide decision-making.
One strong use case is target setting after trend shifts: when a confirmed crossover occurs, the percentile bands (25%, 50%, 85%, 95%, 99%) provide statistically grounded levels for scaling out profits or placing stops, based on how often price has historically reached those distances. This makes it valuable for traders who prefer data-driven risk/reward planning instead of arbitrary point targets. Another use case is identifying stretched conditions — if price rapidly tags the 95% or 99% band after a cross, that’s an unusually large move relative to history, which could signal exhaustion and prompt mean-reversion trades or protective actions.
Conversely, if the accumulation table shows price frequently resides in upper bands after bullish crosses, traders may anticipate continuation and hold positions longer . The indicator is also effective as a trend filter when combined with its EMA color-coding : only taking trades in the trend’s direction and using the bands as dynamic profit zones.
Additionally, it can support multi-timeframe confluence (if you align your chart to the timeframes of interest), where higher-timeframe trend direction aligns with lower-timeframe percentile behavior for higher-probability setups. Swing traders can use it to frame pullbacks — entering near lower percentile bands during an uptrend — while intraday traders might use it to fade extremes or ride breakouts past the median band. Because the anchor price resets only on EMA crosses, the indicator preserves a consistent reference for ongoing trades, which is especially helpful for managing swing positions through noise .
Overall, its strength lies in transforming raw EMA distance data into actionable, probability-weighted levels that adapt to the instrument’s own volatility and tendencies .
Summary
This indicator transforms a simple EMA into a distribution-aware framework: it learns how far price tends to travel relative to the EMA on either side, and turns those excursions into percentile bands and historical hit rates anchored to the most recent cross. That makes it a flexible tool for targets, stops, and regime filtering, and a transparent way to reason about “how stretched is stretched?”—with context from your chosen market and timeframe.
I hope you all enjoy!
And as always, safe trades!

Shock!The Shock Indicator is a volatility-banding model that forecasts price ranges with a dynamically widening/shrinking system. Fundamentally, it uses an exponentially weighted moving average of returns, adjusting for time-of-day patterns, to estimate a baseline volatility (i.e. The ‘prior’ in Bayesian theory). It detects jumps by comparing realized variance with “bipower variation”, temporarily widening the bands when shocks occur, and decaying the width of the bands as the shock subsides. In order to keep the coverage as calibrated and honest as possible, it continuously checks how often each bar’s closing prices stay inside the predicted bands, and adapts tail multipliers using a “scoring” system, avoiding the “cheat” of inflating bands everywhere to include as many candles as possible. It also uses a simple decaying mechanism to shrink bands exponentially faster when realized ranges are calm, preventing long periods of unjustified overshooting. In practice, this design keeps the empirical coverage probability close to a user-selected target. By default, the target is set to 95%. Across various 5 minute, 10 minute, 15 minute, and 30 minute timeframes on assets such as USDJPY, ES and NQ Futures, QQQ, NVDA, TSLA, BTCUSD, the empirical coverage consistently stays within -10%/+4% of the default 95% target coverage, while staying extremely responsive to shocks.
At the open of each candle, the range is drawn. The range is “frozen” the moment it is drawn, meaning it cannot utilize “cheating” methods such as repainting or future-looking to artificially inflate the accuracy and calibration. The indicator then tracks how accurate and well-calibrated it was for that given candle, optimizing the bands for future bars.
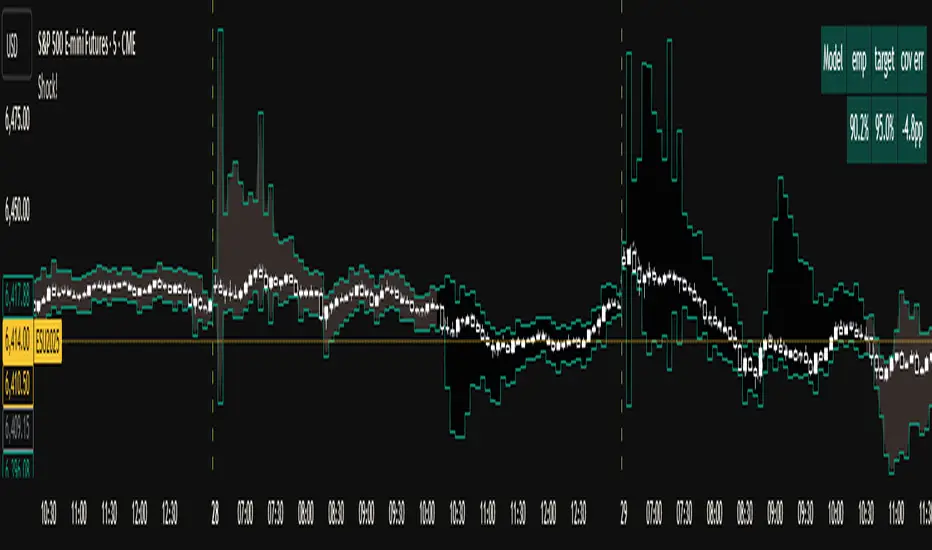
IU Market Rhythm WaveDESCRIPTION:
The IU Market Rhythm Wave is a multi-dimensional indicator designed to reveal the underlying rhythm and energy of the market. By analyzing price momentum, harmonic oscillations, volume behavior, and market breadth, it helps traders identify high-quality long and short wave signals. It also visualizes rhythm bands, wave strength zones, and harmonic levels to provide comprehensive context for decision-making.
This tool is best used on trending instruments where rhythm cycles and volume patterns create clear wave-based opportunities.
USER INPUTS:
Rhythm Cycle Length
Controls the main lookback period used to calculate price waves, harmonic oscillation, volume rhythm, and breath. A longer cycle smooths signals, while a shorter cycle makes them more responsive. Recommended range: 8 to 35.
Wave Signal Strength
Multiplies the standard deviation of rhythm to define dynamic breakout thresholds. A higher value results in fewer but stronger signals, filtering out minor fluctuations.
Harmonic Filter
Applies a sensitivity filter to the harmonic mean and standard deviation. It helps eliminate weak or noisy signals and ensures rhythm-based signals align with harmonic structure.
Show Wave Energy Zones
Toggles background color shading based on current rhythm conditions. Greenish zones indicate strong upward rhythm, red for strong downward rhythm, yellow for positive bias, and gray for weak or neutral zones.
Show Rhythm Bands
Enables the display of upper and lower rhythm bands derived from ATR and rhythm volatility. These bands act as dynamic price envelopes and potential support/resistance zones.
Wave Zone Opacity
Adjusts the transparency of background energy zones, allowing users to control how prominent these zones appear on the chart. Range: 60 to 90 for optimal visibility.
INDICATOR LOGIC:
The indicator combines multiple rhythmic components into a composite rhythm score:
1. Price Wave – Based on momentum (rate of price change) smoothed by a moving average.
2. Harmonic Oscillation – Measures how far price has deviated from a central harmonic average (HLC3).
3. Volume Rhythm – Uses volume’s deviation from its mean, standardized by its volatility.
4. Market Breath – Captures range expansion and closing strength relative to range.
These elements form the Raw Rhythm, which is further smoothed to produce the Market Rhythm. When the rhythm exceeds statistically calculated thresholds and other conditions like volume confirmation and harmonic proximity are met, wave signals are triggered.
Harmonic Fibonacci levels (0.236, 0.382, 0.618, 0.764) are also calculated every rhythm cycle to identify nearby structural price zones. Signals occurring near these levels are considered more reliable.
The Rhythm Bands use ATR and rhythm strength to define dynamic boundaries above and below price. Visual zones and arrows mark rhythm shifts and highlight the underlying energy of the market.
WHY IT IS UNIQUE:
This indicator goes beyond traditional oscillators or volume indicators by blending multiple market dimensions into one rhythmic framework. It adapts to volatility, applies harmonic structure awareness, and filters signals based on real-time market conditions. It offers:
* A unique rhythm-based view of price, volume, and volatility
* Dynamic, adaptive signal generation and zone coloring
* Visual analytics and contextual data in a summary table
* Signal filtering using harmonic alignment and market breath
Its real-time responsiveness and multi-layered logic make it suitable for intraday, swing, and positional traders.
HOW USER CAN BENEFIT FROM IT:
* Spot high-conviction long or short entries when rhythm, volume, and structure align
* Avoid low-quality trades during weak or noisy rhythm periods
* Use visual wave zones to gauge trend strength and rhythm direction
* Monitor harmonic proximity to enter or exit near key structural levels
* Apply rhythm bands for dynamic stop-loss and target setting
* Use rhythm direction arrows and analytics table to gain deeper market insight
DISCLAIMER:
This indicator is created for educational and informational purposes only. It does not constitute financial advice or a recommendation to buy or sell any asset. All trading involves risk, and users should conduct their own analysis or consult with a qualified financial advisor before making any trading decisions. The creator is not responsible for any losses incurred through the use of this tool. Use at your own discretion.
Bollinger Volatility AnalyzerThe Bollinger Volatility Analyzer (BVA) is a powerful enhancement of the traditional Bollinger Bands indicator, tailored to help traders identify volatility cycles and catch potential breakouts with better precision and timing. It builds upon the foundational concept of Bollinger Bands—using a moving average and standard deviation bands—but adds crucial insights into market contraction and expansion, which can be instrumental in timing entries and exits.
Here's how it works and why it's useful
At its core, the indicator calculates a moving average (called the "basis") and plots two bands—one above and one below—based on a multiple of standard deviation. These bands expand during volatile periods and contract during quiet ones. The width between these bands, normalized as a percentage of the basis, gives us a sense of how compressed or expanded the market currently is. When the band width drops below a user-defined threshold (like 2%), the script highlights this with an orange triangle below the bar. This is the "squeeze" condition, signaling a potential buildup of market energy—a kind of calm before the storm.
What makes this version of Bollinger Bands particularly powerful is that it not only detects squeezes, but also tells you when price breaks out of that squeeze range. If price closes above the upper band after a squeeze, a green "Breakout ↑" label is shown; if it closes below the lower band, a red "Breakout ↓" appears. These breakout labels act as entry signals, suggesting that volatility is returning and a directional move has begun.
This indicator is especially useful in markets that tend to alternate between consolidation and breakout phases, such as forex, crypto, and even individual stocks. Traders who look for early signs of momentum—whether for swing trading, scalping, or position building—can benefit from this tool. During a quiet market phase, the indicator warns you that a move might be coming; when the move starts, it tells you the direction.
In fast-moving markets, BVA helps filter out noise by focusing only on high-probability conditions: quiet consolidation followed by a strong breakout. It’s not a complete system by itself—it works best when paired with volume confirmation or oscillators like RSI—but as a volatility trigger and directional guide, it’s a reliable component of a trading workflow.

Momentum Volatility Ratio | AlphaNattMomentum Volatility Ratio | AlphaNatt
The Momentum Volatility Ratio (MVR) is a sophisticated indicator that measures price impulses relative to an asset's inherent volatility. Unlike standard momentum indicators, MVR adapts to changing market conditions by normalizing momentum against historical volatility patterns, helping traders identify truly significant price movements.
Key Features:
• Adapts automatically to each asset's volatility profile
• Distinguishes between normal market noise and significant impulses
• Beautiful gradient visualization with modern Quantra-inspired aesthetics
• Responsive and clear signals with minimal lag
• Customizable sensitivity and appearance settings
How It Works:
The MVR calculates normalized price momentum and adjusts it by recent volatility metrics. This volatility-adjustment ensures the indicator remains consistent across different market environments and timeframes. When price momentum exceeds what would be expected given the asset's normal volatility, the indicator shows a significant impulse that traders can act upon.
Indicator Components:
• Cyan Histogram/Background - Represents positive momentum impulses
• Magenta Histogram/Background - Represents negative momentum impulses
• Neutral Bands - Define the transition between normal and significant impulses
• Gradient Background - Provides visual context for impulse strength
• Smooth Histogram - Shows the main impulse signal with a beautiful glow effect
Trading Signals:
1. Strong Positive Impulse - When cyan histogram bars grow significantly above the zero line
2. Strong Negative Impulse - When magenta histogram bars extend significantly below the zero line
3. Impulse Weakening - When histogram bars begin to shrink toward the zero line
4. Momentum Shift - When the histogram changes color, indicating a potential trend change
Customizable Parameters:
• Length - Base calculation period for momentum (default: 6)
• Volatility Lookback - Historical period for volatility calculation (default: 100)
• Neutral Bands Length - Smoothing period for neutral bands (default: 15)
• Neutral Bands Multiplier - Controls width of neutral bands (default: 0.5)
• Standard Deviation Lookback - Period for standard deviation calculation (default: 150)
• Standard Deviation Multiplier - Controls sensitivity of extreme bands (default: 2.5)
• Style - Choose between Classic, Modern, and Signal visualization modes
Best Practices:
• Use MVR alongside price action for confirmation
• Watch for extreme readings followed by momentum shifts
• Pay attention to divergences between price and MVR
• Consider longer-term trends when interpreting signals
• Use shorter settings for more frequent signals, longer settings for less noise
About the Opus Series:
The MVR indicator is part of the Opus series of premium-quality technical indicators designed with both functional excellence and aesthetic beauty. Opus indicators feature smooth gradients, crisp visualization, and powerful analytical capabilities to enhance your trading experience.
For questions, feedback, or custom indicator requests, please feel free to leave a comment or contact me directly.
Happy Trading!
Not financial Advice
