Moving Average StackTwo groups of moving averages.
Each group can have up to 3 three different moving averages.
You can choose between SMA, EMA, WMA, VWMA, or HMA for each group.
Integrated time locked capabilities so you can have long term moving averages shown on short timeframes.
Enjoy :)
Pesquisar nos scripts por "averages"

crypto futures hourly scalping with ma & rsi - ogcheckershi to all lovable traders,
hereby i want to share a combination of trade ideas for scalping
i've chosen hourly timeframe
indicators used: moving averages and rsi
moving averages:
ema 3, ema 5, ema 7
sma 3, sma 5, sma 7
daily_ema_3, daily_ema_5
daily_ema_5, daily_sma_5
rsi:
rsi 7, rsi 14, rsi 26
daily_rsi_7, daily_rsi_14, daily_rsi_26
as per the analysis over moving average behavioral patterns & rsi movements, useful points are given below which will be helpful while choosing good entry points & exit points,
strategical points for LONG:
* when ema3 crosses above sma3 - green candles start to form
* it's followed by ema5 > sma5 and ema7 > sma7
* when ema3 crosses down sma3 - it's considered as an indication of exit
* if rsi supports then can wait for ema5 crossing down sma5
* as similar, when daily_ema_3 crosses above daily_sma_3, its an higher timeframe bullish indication, so the lower timeframe entries inside this higher timeframe is a sure shot confident entry
* for LONG always take entries when rsi_14 < 30 or 25 else check rsi_7 < 25 or below
* as along the above, bullish CANDLE patterns like bullish engulfing , morning star is been used for entry at lower levels
* so here i've used OPEN as rsi_source in majority
* exit points also indicated at high_rsi and moving average crossunders or reverse crossovers
* for SHORTING, the above said ideas can be used in viceversa
* inputs in the indicator were tailored for users needs so that you will enjoy the magics of customization
if i am wrong in anyways regarding the above indicator strategy, please forgive me and help me improve in this aspect by commenting.
after few more studies and analysis and mainly QUERIES & COMMENTS, i'm planning to backtest these strategies here in tradingview.
also if these strategies are coded in python, we can link it to Binance Futures Algo or Bot Trading.
thankyou for this opportunity,
thanks to tradingview and pinecoders
thanks to Pranab (for 365MA)
thanks to Gandalf (for inspiring)
Special Thanks & Love to Chartbank for Everything

trend_vol_stopThe description below is copied from the script's comments. Because TradingView does not allow me to edit this description, please refer to the script's comments section, as well as the release notes, for the most up-to-date information.
----------
Usage:
The inputs define the trend and the volatility stop.
Trend:
The trend is defined by a moving average crossover. When the short
(or fast) moving average is above the long (slow) moving average, the
trend is up. Otherwise, the trend is down. The inputs are:
long: the number of periods in the long/slow moving average.
short: the number of periods in the short/fast moving average.
The slow moving average is shown in various colors (see explanation
below. The fast moving average is a faint blue.
Volatility stop:
The volatility stop has two modes, percentage and rank. The percentage
stop is given in terms of annualized volatility. The rank stop is given
in terms of percentile.
stop_pct and stop_rank are initialized with "-1". You need to set one of
these to the values you want after adding the indicator to your chart.
This is the only setting that requires your input.
mode: choose "rank" for a rank stop, "percentage" for a percentage stop.
vol_window: the number of periods in the historical volatility
calculation. e.g. "30" means the volatility will be a weighted
average of the previous 30 periods. applies to both types of stop.
stop_pct: the volatility limit, annualized. for example, "50" means
that the trend will not be followed when historical volatility rises
above 50%.
stop_rank: the trend will not be followed when the volatility is in the
N-th percentile. for example, "75" means the trend will not be
followed when the current historical volatility is greater than 75%
of previous volatilities.
rank_window: the number of periods in the rank percentile calculation.
for example, if rank_window is "252" and "stop_rank" is "80", the
trend will not be followed when current historical volatility is
greater than 80% of the previous 252 historical volatilities.
Outputs:
The outputs include moving averages, to visually identify the trend,
a volatility table, and a performance table.
Moving averages:
The slow moving average is colored green in an uptrend, red in a
downtrend, and black when the volatility stop is in place.
Volatility table:
The volatility table gives the current historical volatility, annualized
and expressed as a whole number percentage. E.g. "65" means the
instrument's one standard deviation annual move is 65% of its price.
The current rank is expressed, also as a whole number percentage. E.g.
"15" means the current volatility is greater than 15% of previous
volatilities. For convenience, the volatilities corresponding to the
0, 25, 50, 75, and 100th percentiles are also shown.
Performance table:
The performance table shows the current strategy's performance versus
buy-and-hold. If the trend is up, the instrument's return for that
period is added to the strategy's return, because the strategy is long.
If the trend is down, the negative return is added, because the strategy
is short. If the volatility stop is in (the slow moving average is
black), that period's return is excluded from the strategy returns.
Every period's return is added to the buy-and-hold returns.
The table shows the average return, the standard deviation of returns,
and the sharpe ratio (average return / standard deviation of returns).
All figures are expressed as per-period, whole number percentages.
For exmaple, "0.1" in the mean column on a daily chart means a
0.1% daily return.
The number of periods (samples) for each strategy is also shown.

+ BB %B: MA selection, bar coloring, multi-timeframe, and alerts+ %B is, at its simplest, the classic Bollinger Bands %B indicator with a few added bells and whistles.
However, the right combination of bells and whistles will often improve and make a more adaptable indicator.
Classically, Bollinger Bands %B is an indicator that measures volatility, and the momentum and strength of a trend, and/or price movements.
It shows "overbought" and "oversold" spots on a chart, and is also useful for identifying divergences between price and trend (similar to RSI).
With + %B I've added the options to select one or two moving averages, candle coloring, and a host of others.
Let's start with the moving averages:
There are options for two: one faster and one slower. Or combine them how you will, or omit one or both of them entirely.
Here you will find options for SMA, EMA (as well as double and triple), Hull MA, Jurik MA, Least Squares MA, Triangular MA, Volatility Adjusted MA, and Weighted MA.
A moving average essentially helps to define trend by smoothing the noise of movements of the underlying asset, or, in this case, the output of the indicator.
All of these MAs available track this in a different way, and it's up to the trader to figure out which makes most sense to him/her.
MA's, in my opinion, improve the basic %B by providing a clearer picture of what the indicator is actually "seeing", and may be useful for providing entries and exits.
Next up is candle coloring:
I've added the option for this indicator to color candles on the chart based on where the %B is in relation to its upper and lower bounds, and median line.
If the %B is above the median but below the upper bound, candles will be green (showing bullish market structure). If %B is below the median but above the lower bound, candles will be red (denoting bearish market structure).
Overbought and oversold candles will also be colored on the chart, so that a quick glance will tell you whether price action is bullish/bearish or "oversold"/"overbought".
I've also added functionality that enables candles to be colored based on if the %B has crossed up or crossed down the primary moving average.
One example as a way to potentially use these features is if the candles are showing oversold coloration followed by the %B crossing up your moving average coloration. You might consider a long there (or exit a short position if you are short).
And the last couple of tweaks:
You may set the timeframe to whatever you wish, so maybe you're trading on the hourly, but you want to know where the %B is on the 4h chart. You can do that.
The background fill for the indicator is split into bullish and bearish halves. Obviously you may turn the background off, or make it all one color as well.
I've also added alerts, so you may set alerts for "overbought" and "oversold" conditions.
You may also set alerts for %B crossing over or under the primary moving average, or for crossing the median line.
All of these things may be turned on and off. You can pretty much customize this to your heart's delight. I see no reason why anyone would use the standard %B after playing with this.
I am no coder. I had this idea in my head, though, and I made it happen through referencing another indicator I was familiar with, and watching tutorials on YouTube.
Credits:
Firstly, thanks to www.tradingview.com for his brilliant, free tutorials on YouTube.
Secondly, thanks to www.tradingview.com for his beautiful SSL Hybrid indicator (and his clean code) from which I obtained the MAs.
Please enjoy this indicator, and I hope that it serves you well. :)

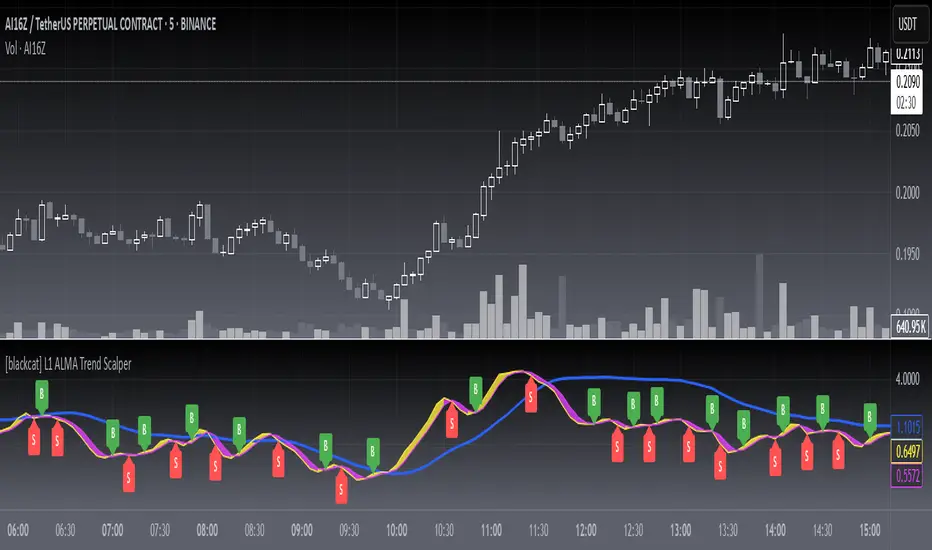
[blackcat] L1 ALMA Trend ScalperLevel: 1
Background
The Arnaud Legoux Moving Average (ALMA) indicator was recently added to the family of moving averages. It was developed in 2009 by Arnaud Legous and Dimitrios Kouzis Loukas. Since then, this indicator has gained huge popularity among traders.
ALMA works like any moving average work. However, the calculation of the ALMA is more perfect compared to the moving average. This indicator has minimal lag which makes it a leading indicator in the market. While the SMA, MA, EMA and SMMA signal line is often delayed. The ALMA was designed to address the two critical disadvantages of traditional moving averages, responsiveness and smoothness.
Function
L1 ALMA Trend Scalper is simple but powerful. This indicator makes full use of ALMA's rapid response advantage to provide buying and selling points by winding and crossing two short-term moving averages. A mid-term moving average can provide relatively effective support and pressure. Finally, the function of whale pump detection is simply realized through the characteristics of the moving average.
Key Signal
trendline --> mid term moving average for support and resistance
tradingline ---> basic element for fast line and slow line
fastline ---> fast line for short term
slowline --> slow line for short term
pumpstart ---> simple whale pump zone detection
Pros and Cons
Pros:
1. Simple but clear to see the trend reversals
2. Aux middle term moving average help just whether it is a true or fake breakout
Cons:
1. No advanced trading skill is incorporated
2. Need improvements on sideways.
Remarks
Just be simple but powerful
Readme
In real life, I am a prolific inventor. I have successfully applied for more than 60 international and regional patents in the past 12 years. But in the past two years or so, I have tried to transfer my creativity to the development of trading strategies. Tradingview is the ideal platform for me. I am selecting and contributing some of the hundreds of scripts to publish in Tradingview community. Welcome everyone to interact with me to discuss these interesting pine scripts.
The scripts posted are categorized into 5 levels according to my efforts or manhours put into these works.
Level 1 : interesting script snippets or distinctive improvement from classic indicators or strategy. Level 1 scripts can usually appear in more complex indicators as a function module or element.
Level 2 : composite indicator/strategy. By selecting or combining several independent or dependent functions or sub indicators in proper way, the composite script exhibits a resonance phenomenon which can filter out noise or fake trading signal to enhance trading confidence level.
Level 3 : comprehensive indicator/strategy. They are simple trading systems based on my strategies. They are commonly containing several or all of entry signal, close signal, stop loss, take profit, re-entry, risk management, and position sizing techniques. Even some interesting fundamental and mass psychological aspects are incorporated.
Level 4 : script snippets or functions that do not disclose source code. Interesting element that can reveal market laws and work as raw material for indicators and strategies. If you find Level 1~2 scripts are helpful, Level 4 is a private version that took me far more efforts to develop.
Level 5 : indicator/strategy that do not disclose source code. private version of Level 3 script with my accumulated script processing skills or a large number of custom functions. I had a private function library built in past two years. Level 5 scripts use many of them to achieve private trading strategy.
21/55 EMA Cloud w/ Optional RibbonThis indicator behaves like a traditional EMA ribbon by using the 21, 25, 30, 35, 40, 45, 50, and 55 bar exponential moving averages. In this particular indicator, the traditional EMA ribbon lines are turned off by default leaving only a filled in area between the 21 and 55 bar averages. The filled in area is green when the 21 bar average is greater than the 55 and red otherwise. Additionally, the 9, 100, and 200 exponential moving averages are available for reference.

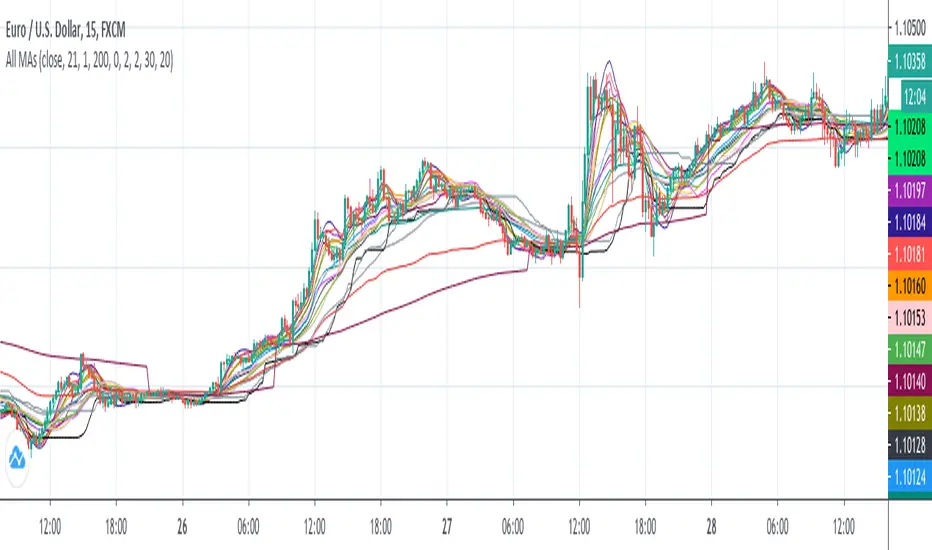
All MAs displayedThis is a collection of moving averages.
Thanks to everget and other pinecoders to pubblish their codes in tradingview.
I just collect a lot of moving averages in one script and transform them in stand alone functions, so you can copy and paste in your script the MA that best fit your needs.
Furthermore, the chart shows which moving average has more smooth and which one has less lag and so on: in this way it is easy to graphically compare moving averages.
Phicube EMASAR ( EMA Support and Resistance )Indicator based on the Concept created by Bo Williams. But unlike the original that uses MIMAs, EMAs are used here.
Exponential moving averages will be shown according to fractal alignment, in order to show the important support and resistance levels ( SAR ).
When the fractals are aligned to become support,
we will have the EMA in the graph with a bright color.
When the fractals are aligned to become resistance, we will have EMA in the graph with a matte color.
Available exponential moving averages: 17,34,72,144,305,610,1292 and 2584
____________________________________________________//_____________________________________________________________________
Indicador baseado no Conceito criado pelo Bo Williams. Mas diferente do original que utiliza MIMAs, aqui é utilizado EMAs.
As médias móveis exponenciais serão mostradas de acordo com o alinhamento dos fractais, com objetivo de mostrar os níveis importantes
de suporte e resistência( SAR ).
Quando estiver com os fractais alinhados virando suporte, teremos no gráfico a EMA com uma cor em tom brilhante.
Quando estiver com os fractais alinhados virando resistência, teremos no gráfico a EMA com uma cor em tom fosco.
Médias móveis exponenciais disponíveis: 17,34,72,144,305,610,1292 e 2584

Bundle of various indicators, All-in-oneThis scripts compiles many indicators into one. It comes from many sources and i added all sources i used. If i forgot one, don't hesitate to message me.
This is useful if you need to setup your chart layout fast. The menu makes it easy to configure it.
You can configure and display:
- Various types of moving averages: RMA, SMA , EMA , WMA , VWMA , SMMA , HullMA, LSMA , DEMA , TEMA
- Stochastic RSI crosses from multi-timeframes directly on candle's close (1h, 4h, D, W)
- Bollinger bands with primary and secondary deviation
- SAR
- Color background using difference between Stochastic RSI K and D
- Support and resistance
- Open high low close from higher timeframes (D, W, M)
- Auto fibonacci levels (still a work in progress, i will add logarithmic fibonacci levels too later)
- "Alt season" for crypto users: if BTC dominance cross his SMA , display a pictogram on every chart
Stil working on:
- Auto fibonacci levels: i will add logarithmic fibonacci levels
- Stochastic crosses
- Alt season: use others types of moving averages
If you have any suggestions / improvements, feel free to message me or write it in the comments below.

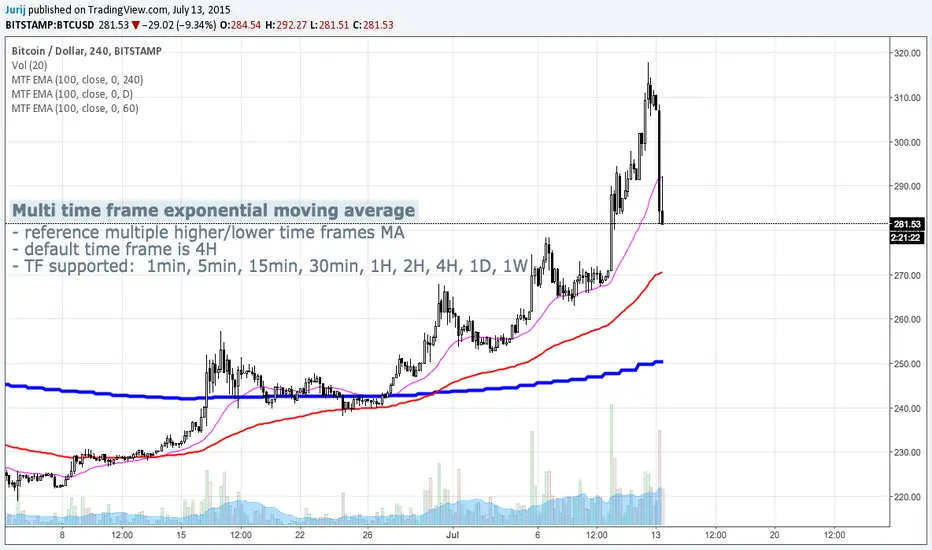
Multi Time Frame Exponential Moving AverageThis indicator allows you to reference exponential moving averages from other time frames
Same indicator for simple moving averages:
TEWMA - [JTCAPITAL]Triple Exponential Weighted Moving Average is a modified way to use Weighted Triple Moving Averages for Trend-Following
The indicator works by calculating in the following steps:
1. The length gets multiplied by the multi to get the second length.
2. The Triple Exponential Moving Average gets calculated using the Weighted Moving Average as input.
3. This calculation is done over the first and the second length.
4. The average from both calculations is taken and used for buy and sell conditions.
--Buy and sell conditions--
-The buy and sell conditions are defined by the average of both indicators having a higher value than the previous bar.
-Average higher than the previous average = Long
-Average lower than the previous average = Short
--Features and Parameters--
-Allows the usage of different sources
-Allows the changing of the calculation length
-Allows the changing of the multiplier to determine the second length
-Allows the use of alerts for signal changes
--Details--
This script uses the result of the calculation of the Weighted Moving Averages as inputs for the Triple Moving averages. The usage of 2 separate calculations and using the average of them for trend determination is to allow for faster entries and exits while limiting potential false signals.
Enjoy!

Adaptive Convergence Divergence### Adaptive Convergence Divergence (ACD)
By Gurjit Singh
The Adaptive Convergence Divergence (ACD) reimagines the classic MACD by replacing fixed moving averages with adaptive moving averages. Instead of a static smoothing factor, it dynamically adjusts sensitivity based on price momentum, relative strength, volatility, fractal roughness, or volume pressure. This makes the oscillator more responsive in trending markets while filtering noise in choppy ranges.
#### 📌 Key Features
1. Dual Adaptive Structure: The oscillator uses two adaptive moving averages to form its convergence-divergence line, with EMA/RMA as signal line:
* Primary Adaptive (MA): Fast line, reacts quickly to changes.
* Following Adaptive (FAMA): Slow line, with half-alpha smoothing for confirmation.
2. Adaptive MA Types
* ACMO: Adaptive CMO (momentum)
* ARSI: Adaptive RSI (relative strength)
* FRMA: Fractal Roughness (volatility + fractal dimension)
* VOLA: Volume adaptive (volume pressure)
3. PPO Option: Switch between classic MACD or Percentage Price Oscillator (PPO) style calculation.
4. Signal Smoothing: Choose between EMA or Wilder’s RMA.
5. Visuals: Colored oscillator, signal line, histogram with adaptive transparency.
6. Alerts: Bullish/Bearish crossovers built-in.
#### 🔑 How to Use
1. Add to chart: Works on any timeframe and asset.
2. Choose MA Type: Experiment with ACMO, ARSI, FRMA, or VOLA depending on market regime.
3. Crossovers:
* Bullish (🐂): Oscillator crosses above signal → potential long entry.
* Bearish (🐻): Oscillator crosses below signal → potential short entry.
4. Histogram: expansion = strengthening trend; contraction = weakening trend.
5. Divergences:
* Bullish (hidden strength): Price pushes lower, but ACD turns higher = potential upward reversal.
* Bearish (hidden weakness): Price pushes higher, but ACD turns lower = potential downward reversal.
6. Customize: Adjust lengths, smoothing type, and PPO/MACD mode to match your style.
7. Set Alerts:
* Enable Bullish or Bearish crossover alerts to catch momentum shifts in real time.
#### 💡 Tips
* PPO mode normalizes values across assets, useful for cross-asset analysis.
* Wilder’s smoothing is gentler than EMA, reducing whipsaws in sideways conditions.
* Adaptive smoothing helps reduce false divergence signals by filtering noise in choppy ranges.

LMAsLibrary "LMAs"
Credits
Thank you to @QuantraSystems for dynamic calculations.
Introduction
This lightweight library offers dynamic implementations of popular moving averages that adapt their length automatically as new bars are added to the chart.
Each function is built on a dynamic length formula:
len = math.min(maxLength, bar_index + 1)
This approach ensures that calculations begin as early as the first bar, allowing for smoother initialization and more consistent behavior across all timeframes. It’s especially useful in custom scripts that run from bar 0 or when historical data is limited.
Usage
You can use this library as a drop-in replacement for standard moving averages. It provides more flexibility and stability in live or backtesting environments where fixed-length indicators may delay or fail to initialize properly.
Why Use This?
• Works from the very first bar
• Avoids na values during early bars
• Great for real-time indicators, strategies, and bar-replay
• Clean and efficient code with dynamic behavior
How to Use
Import the library into your script and call any of the included functions just like you would with their native counterparts.
Summary
A lightweight Pine Script™ library offering dynamic moving averages that work seamlessly from the very first bar. Ideal for strategies and indicators requiring robust initialization and adaptive behavior.
SMA(sourceData, maxLength)
Dynamic SMA
Parameters:
sourceData (float)
maxLength (int)
EMA(src, length)
Dynamic EMA
Parameters:
src (float)
length (int)
DEMA(src, length)
Dynamic DEMA
Parameters:
src (float)
length (int)
TEMA(src, length)
Dynamic TEMA
Parameters:
src (float)
length (int)
WMA(src, length)
Dynamic WMA
Parameters:
src (float)
length (int)
HMA(src, length)
Dynamic HMA
Parameters:
src (float)
length (int)
VWMA(src, volsrc, length)
Dynamic VWMA
Parameters:
src (float)
volsrc (float)
length (int)
SMMA(src, length)
Dynamic SMMA
Parameters:
src (float)
length (int)
LSMA(src, length, offset)
Dynamic LSMA
Parameters:
src (float)
length (int)
offset (int)
RMA(src, length)
Dynamic RMA
Parameters:
src (float)
length (int)
ALMA(src, length, offset_sigma, sigma)
Dynamic ALMA
Parameters:
src (float)
length (int)
offset_sigma (float)
sigma (float)
ZLSMA(src, length)
Dynamic ZLSMA
Parameters:
src (float)
length (int)
FRAMA(src, length)
Parameters:
src (float)
length (int)
KAMA(src, length)
Dynamic KAMA
Parameters:
src (float)
length (int)
JMA(src, length, phase)
Dynamic JMA
Parameters:
src (float)
length (int)
phase (float)
T3(src, length, volumeFactor)
Dynamic T3
Parameters:
src (float)
length (int)
volumeFactor (float)

Supertrend - SSL Strategy with Toggle [AlPashaTrader]📈 Overview of the Supertrend - SSL Strategy with Toggle Indicator
This strategy combines two powerful technical tools—Supertrend and SSL Channel—to deliver precise and reliable trading signals, designed for traders who value confirmation and risk management. 🎯
⚙️ How This Indicator Was Created
The strategy was meticulously crafted to harness the complementary strengths of:
Supertrend Indicator: A trend-following tool based on Average True Range (ATR) and a multiplier factor, it detects bullish or bearish trends by calculating dynamic support and resistance levels. 📊
SSL Channel: A channel indicator built using two Simple Moving Averages (SMA) of the highs and lows over a set period. It cleverly determines trend direction by comparing price action relative to these moving averages. 🔄
These two indicators are merged into one cohesive strategy with an optional toggle feature allowing the trader to choose whether to require confirmation from both indicators before taking a position or to act on signals from either. 🎚️
The script includes user-friendly controls for:
Defining a custom trading date range 📅, useful for backtesting or restricting trading to specific market conditions.
Setting the ATR length and multiplier for Supertrend sensitivity ⚙️.
Adjusting the SSL channel period for responsiveness to price changes ⏱️.
Choosing whether to require dual confirmation (both Supertrend and SSL signals) for more conservative trading or a single indicator trigger for a more aggressive approach 🛡️ vs ⚔️.
🔍 How This Indicator Works
Signal Generation:
Supertrend analyzes market volatility and trend direction, signaling a potential buy when the trend turns bullish 📈 and a sell when bearish 📉.
SSL Channel tracks price relative to its high and low moving averages to identify uptrends and downtrends. A crossover of the SSL Up and SSL Down lines generates buy or sell signals 🔔.
Confirmation Logic:
When confirmation is enabled, the strategy waits for agreement between both indicators before entering a trade ✅, reducing false signals.
When confirmation is disabled, it trades based on signals from either indicator ⚡, allowing more frequent entries but potentially higher risk.
Entry and Exit Rules:
Entry occurs when the indicator(s) signal a new trend direction 🚀 for long, or decline for short.
Exit happens when opposing signals appear 🛑, closing existing positions to lock in profits or cut losses.
Visual Aids:
The SSL Channel lines are plotted directly on the chart with distinct colors to intuitively show trend shifts 🎨.
The system respects the specified date range ⏳, ensuring trades only occur within user-defined periods.
🎯 How to Use This Strategy Effectively
Set Your Preferences: Adjust ATR length, factor, and SSL period to your style. More sensitive? Decrease lengths. Smoother? Increase them ⚙️.
Choose Confirmation Mode: Use the toggle depending on your risk appetite:
Confirmation ON ✅: For conservative traders wanting high-probability setups.
Confirmation OFF ⚡: For aggressive traders who want more signals.
Apply Date Filters: Focus your trading or backtesting on specific periods 📅.
Monitor Entry/Exit Signals: Watch crossovers and Supertrend changes closely 👀.
Risk Management: The strategy uses position sizing as a percentage of equity (default 15%) 💰. Adjust accordingly.
Combine with Other Tools: Enhance results by combining this with volume, price action, or fundamentals 🔧.
📝 Summary
This Supertrend - SSL Strategy with Toggle is a dynamic and flexible trading tool blending volatility-based trend detection with moving-average channel insights. It empowers traders to customize confirmation strictness, control trading periods, and efficiently capture trending opportunities while managing risk smartly.
By integrating proven indicators in a user-friendly, visually intuitive package, this strategy stands as a sophisticated tool suitable for various markets and trading styles. 🚀📊

Multi Moving Average with CustomizationCore Functionality
The indicator allows you to display up to 5 different moving averages on your chart simultaneously.
Each moving average can be fully customized with its own settings.
You can choose between
1. Simple Moving Average (SMA),
2. Exponential Moving Average (EMA)
3. Weighted Moving Average (WMA) types
Multi-Timeframe Support
One standout feature is the ability to display higher timeframe moving averages on lower timeframe charts.
For example, you can show a 200 EMA from the daily chart while viewing a 15-minute chart.
Advanced Visualization Features
The indicator includes several visualization enhancements:
1. MA Cloud - Creates a filled area between any two selected moving averages. The cloud automatically changes color based on which MA is on top - typically green when the faster MA is above (bullish) and red when below (bearish).
2. Golden/Death Cross Detection - Automatically detects and marks important MA crossover events:
* Golden Cross: When a shorter-term MA crosses above a longer-term MA (bullish signal)
* Death Cross: When a shorter-term MA crosses below a longer-term MA (bearish signal)
3. Trend Background - Colors the entire chart background based on whether price is above or below a specified MA, giving a clear visual indicator of the overall trend.
Alert System
The indicator can generate alerts when price crosses above or below any selected moving average. This feature is useful for automated trading signals or notifications, and can be configured to trigger once per bar.
Flexible Architecture
The code uses several programming techniques to maximize flexibility:
* Switch statements for selecting MA types and cloud values
* Conditional logic throughout the code
* Function abstraction for calculating MAs and handling multi-timeframe display
* String identifiers to select which MAs to use for cloud visualization
Unique Technical Aspects
1. The multi-timeframe plotting function solves the common problem of higher timeframe MAs looking distorted on lower timeframe charts.
2. The cloud feature uses string identifiers to select which MAs to use, allowing for any combination.
3. The indicator employs smart conditional logic to handle complex decision trees efficiently.
4. Every visual aspect (colors, line widths, display conditions) is customizable through the settings.
This indicator combines multiple technical analysis tools into a single, highly configurable package that can adapt to different trading styles and timeframes.
Its ability to correctly display higher timeframe MAs on lower timeframe charts makes it particularly valuable for traders who analyze multiple timeframes simultaneously.
[blackcat] L3 Twin Range Filter ProOVERVIEW
The L3 Twin Range Filter Pro indicator enhances trading strategies by filtering out market noise through a sophisticated dual-range approach. Unlike previous versions, this script not only provides clear visual indications of buy/sell signals but also incorporates a dynamic trend range filter line. By averaging two smoothed exponential moving averages—one fast and one slow—the indicator generates upper and lower range boundaries that adapt to changing market conditions. Traders can easily spot buy/sell opportunities when the closing price crosses these boundaries, supported by configurable alerts for real-time notifications.
FEATURES
Dual-Range Calculation: Combines fast and slow moving averages to create adaptive range boundaries.
Customizable Parameters:
Periods: Adjustable lengths for fast (default 9 bars) and slow (default 34 bars) moving averages.
Multipliers: Coefficients to modify the distance of the trailing lines from the price.
Dynamic Trend Range Filter Line: Visually displays buy/sell signals directly on the chart.
Trailing Stop Loss Logic: Automatically follows price movements to act as a trailing stop loss indicator.
Trade Signals: Clearly indicates buy/sell points with labeled signals.
Alerts: Configurable notifications for buy/sell signals to keep traders informed.
Visual Enhancements: Colored fills and dynamic boundary lines for easy interpretation.
HOW TO USE
Add the L3 Twin Range Filter Pro indicator to your TradingView chart.
Customize the input parameters:
Price Source: Choose the desired price source (e.g., Close).
Show Trade Signals: Toggle on/off for displaying buy/sell labels.
Fast Period: Set the period for the fast moving average (default 9 bars).
Slow Period: Set the period for the slow moving average (default 34 bars).
Fast Range Multiplier: Adjust the multiplier for the fast moving average.
Slow Range Multiplier: Adjust the multiplier for the slow moving average.
Monitor the plotted trend range filter and dynamic boundaries on the chart.
Identify buy/sell signals based on the crossing of price and range boundaries.
Configure alerts for real-time notifications when signals are triggered.
TRADE LOGIC
BUY Signal: Triggered when the price is higher than or equal to the upper range level. The indicator line will trail just below the price, acting as a trailing stop loss.
SELL Signal: Triggered when the price is lower than or equal to the lower range level. The indicator line will trail just above the price, serving as a trailing stop loss.
LIMITATIONS
The performance of this indicator relies on the selected periods and multipliers.
Market volatility can impact the accuracy of the signals.
Always complement this indicator with other analytical tools for robust decision-making.
NOTES
Experiment with different parameter settings to optimize the indicator for various market conditions.
Thoroughly backtest the indicator using historical data to ensure its compatibility with your trading strategy.
THANKS
A big thank you to Colin McKee for his foundational work on the Twin Range Filter! Your contributions have paved the way for enhanced trading tools. 🙏📈🔍

Multi-Timeframe Anchored VWAP Valuation# Multi-Timeframe Anchored VWAP Valuation
## Overview
This indicator provides a unique perspective on potential price valuation by comparing the current price to the Volume Weighted Average Price (VWAP) anchored to the start of multiple timeframes: Weekly, Monthly, Quarterly, and Yearly. It synthesizes these comparisons into a single oscillator value, helping traders gauge if the current price is potentially extended relative to significant volume-weighted levels.
## Core Concept & Calculation
1. **Anchored VWAP:** The script calculates the VWAP separately for the current Week, Month, Quarter (3 Months), and Year (12 Months), starting the calculation from the first bar of each period.
2. **Price Deviation:** It measures how far the current `close` price is from each of these anchored VWAPs. This distance is measured in terms of standard deviations calculated *within* that specific anchor period (e.g., how many weekly standard deviations the price is away from the weekly VWAP).
3. **Deviation Score (Multiplier):** Based on this standard deviation distance, a score is assigned. The further the price is from the VWAP (in terms of standard deviations), the higher the absolute score. The indicator uses linear interpolation to determine scores between the standard deviation levels (defaulted at 1, 2, and 3 standard deviations corresponding to scores of +/-2, +/-3, +/-4, with a score of 1 at the VWAP).
4. **Timeframe Weighting:** Longer timeframes are considered more significant. The deviation scores are multiplied by fixed scalars: Weekly (x1), Monthly (x2), Quarterly (x3), Yearly (x4).
5. **Final Valuation Metric:** The weighted scores from all four timeframes are summed up to produce the final oscillator value plotted in the indicator pane.
## How to Interpret and Use
* **Histogram (Indicator Pane):**
* The main output is the histogram representing the `Final Valuation Metric`.
* **Positive Values:** Suggest the price is generally trading above its volume-weighted averages across the timeframes, potentially indicating strength or relative "overvaluation."
* **Negative Values:** Suggest the price is generally trading below its volume-weighted averages, potentially indicating weakness or relative "undervaluation."
* **Values Near Zero:** Indicate the price is relatively close to its volume-weighted averages.
* **Histogram Color:**
* The color of the histogram bars provides context based on the metric's *own recent history*.
* **Green (Positive Color):** The metric is currently *above* its recent average plus a standard deviation band (dynamic upper threshold). This highlights potentially significant "overvalued" readings relative to its normal range.
* **Red (Negative Color):** The metric is currently *below* its recent average minus a standard deviation band (dynamic lower threshold). This highlights potentially significant "undervalued" readings relative to its normal range.
* **Gray (Neutral Color):** The metric is within its typical recent range (between the dynamic upper and lower thresholds).
* **Orange Line:** Plots the moving average of the `Final Valuation Metric` itself (based on the "Threshold Lookback Period"), serving as the centerline for the dynamic thresholds.
* **On-Chart Table:**
* Provides a detailed breakdown for transparency.
* Shows the calculated VWAP, the raw deviation multiplier score, and the final weighted (adjusted) metric for each individual timeframe (W, M, Q, Y).
* Displays the current price, the final combined metric value, and a textual interpretation ("Overvalued", "Undervalued", "Neutral") based on the dynamic thresholds.
## Potential Use Cases
* Identifying potential exhaustion points when the indicator reaches statistically high (green) or low (red) levels relative to its recent history.
* Assessing whether price trends are supported by underlying volume-weighted average prices across multiple timeframes.
* Can be used alongside other technical analysis tools for confirmation.
## Settings
* **Calculation Settings:**
* `STDEV Level 1`: Adjusts the 1st standard deviation level (default 1.0).
* `STDEV Level 2`: Adjusts the 2nd standard deviation level (default 2.0).
* `STDEV Level 3`: Adjusts the 3rd standard deviation level (default 3.0).
* **Interpretation Settings:**
* `Threshold Lookback Period`: Defines the number of bars used to calculate the average and standard deviation of the final metric for dynamic thresholds (default 200).
* `Threshold StDev Multiplier`: Controls how many standard deviations above/below the metric's average are used to set the "Overvalued"/"Undervalued" thresholds (default 1.0).
* **Table Settings:** Customize the position and colors of the data table displayed on the chart.
## Important Considerations
* This indicator measures price deviation relative to *anchored* VWAPs and its *own historical range*. It is not a standalone trading system.
* The interpretation of "Overvalued" and "Undervalued" is relative to the indicator's logic and calculations; it does not guarantee future price movement.
* Like all indicators, past performance is not indicative of future results. Use this tool as part of a comprehensive analysis and risk management strategy.
* The anchored VWAP and Standard Deviation values reset at the beginning of each respective period (Week, Month, Quarter, Year).

NasyI## NasyI - Multi-Timeframe Technical Analysis Toolkit
### English Description
**NasyI** is a comprehensive technical analysis indicator designed to provide traders with a complete view of market dynamics across multiple timeframes. This indicator combines the power of Exponential Moving Averages (EMAs), Simple Moving Averages (MAs), Volume Weighted Average Price (VWAP), and key support/resistance levels to help traders identify trend direction, potential reversal points, and optimal entry/exit opportunities.
#### Key Features
1. **Multi-Timeframe Analysis System**
- 2-minute EMAs (13, 48) for ultra-short-term trend identification
- 5-minute EMAs (9, 13, 21, 48, 200) for short-term trend confirmation
- Daily EMAs (5, 13, 21, 48, 100, 200) and MAs (20, 50, 100, 200) for longer-term perspective
- Color-coded bands between key EMAs to visually identify trend strength and direction
2. **Advanced VWAP Integration**
- Daily VWAP for intraday support/resistance
- Weekly VWAP for medium-term price reference
- Monthly VWAP for long-term institutional price levels
- All VWAPs properly reset at their respective time period boundaries
3. **Critical Price Level Identification**
- Previous day high/low lines for identifying key breakout and breakdown levels
- Pre-market high/low tracking to identify potential intraday support/resistance zones
- All levels displayed with distinct line styles for easy identification
4. **Dynamic Trend Analysis**
- Color-coded bands between EMAs display trend strength and direction:
- Green bands indicate uptrend conditions (9 EMA > 21 EMA > 48 EMA)
- Red bands indicate downtrend conditions (9 EMA < 21 EMA < 48 EMA)
- Yellow bands indicate neutral/confused market conditions
- Visual representation makes trend changes immediately apparent
5. **Comprehensive Customization Options**
- Fully customizable colors for all indicators and bands
- Adjustable transparency settings for visual clarity
- Optional price labels with customizable placement and appearance
- Ability to show/hide specific components based on trading preferences
#### Trading Applications
This indicator is particularly valuable for:
1. **Day Trading & Scalping**: The 2-minute and 5-minute EMAs with color bands provide clear short-term trend direction and potential reversal signals.
2. **Swing Trading**: Daily EMAs and MAs offer perspective on the larger trend, helping to align short-term trades with the broader market direction.
3. **Gap Trading**: Previous day and pre-market levels help identify potential gap fill scenarios and breakout/breakdown opportunities.
4. **VWAP Trading Strategies**: Multiple timeframe VWAPs allow for identifying institutional participation levels and potential reversal zones.
5. **EMA Cross Systems**: The various EMAs can be used to identify golden crosses and death crosses across multiple timeframes.
#### How the Components Work Together
The power of NasyI comes from the integration of these different technical elements:
1. The short-timeframe EMAs (2m, 5m) provide immediate trend information, while the daily EMAs/MAs provide context about the larger market structure.
2. The color bands between EMAs offer instant visual confirmation of trend alignment or divergence across timeframes.
3. Previous day and pre-market levels add horizontal support/resistance zones to complement the dynamic moving averages.
4. Multiple timeframe VWAPs provide additional confirmation of institutional activity levels and potential reversal points.
By combining these elements, traders can develop a comprehensive market view that integrates price action, trend direction, and key support/resistance levels all in one indicator.
#### Usage Instructions
1. Apply the NasyI indicator to your chart (works best on intraday timeframes from 1-minute to 30-minute).
2. Observe the relationship between price and the various EMAs:
- Price above the 2m/5m EMAs with green bands indicates bullish short-term conditions
- Price below the 2m/5m EMAs with red bands indicates bearish short-term conditions
3. Use the daily EMAs/MAs and VWAPs as targets for potential price movements and reversal zones.
4. Previous day and pre-market high/low lines provide key levels to watch for breakouts or breakdowns.
5. Customize the appearance according to your preferences using the extensive settings options.
This indicator represents a unique approach to technical analysis by combining multiple timeframe perspectives into a single, visually intuitive display that helps traders make more informed decisions based on a comprehensive view of market conditions.
### 中文描述
**NasyI** 是一个全面的技术分析指标,旨在为交易者提供跨多个时间周期的完整市场动态视图。该指标结合了指数移动平均线(EMA)、简单移动平均线(MA)、成交量加权平均价格(VWAP)和关键支撑/阻力水平的力量,帮助交易者识别趋势方向、潜在反转点和最佳进出场机会。
#### 主要特点
1. **多时间周期分析系统**
- 2分钟EMAs(13,48)用于超短期趋势识别
- 5分钟EMAs(9,13,21,48,200)用于短期趋势确认
- 日线EMAs(5,13,21,48,100,200)和MAs(20,50,100,200)用于更长期的视角
- 关键EMAs之间的彩色带状区域直观显示趋势强度和方向
2. **高级VWAP整合**
- 日内VWAP作为日内支撑/阻力
- 周内VWAP作为中期价格参考
- 月内VWAP作为长期机构价格水平
- 所有VWAP在各自的时间周期边界正确重置
3. **关键价格水平识别**
- 前一交易日高点/低点线用于识别关键突破和跌破水平
- 盘前高点/低点跟踪用于识别潜在的日内支撑/阻力区域
- 所有水平以不同的线条样式显示,便于识别
4. **动态趋势分析**
- EMAs之间的彩色带状区域显示趋势强度和方向:
- 绿色带状区域表示上升趋势(9 EMA > 21 EMA > 48 EMA)
- 红色带状区域表示下降趋势(9 EMA < 21 EMA < 48 EMA)
- 黄色带状区域表示中性/混乱市场条件
- 视觉表示使趋势变化立即显现
5. **全面的自定义选项**
- 所有指标和带状区域的颜色完全可定制
- 可调节的透明度设置,提高视觉清晰度
- 可选的价格标签,带有可定制的位置和外观
- 能够根据交易偏好显示/隐藏特定组件
#### 交易应用
此指标对以下方面特别有价值:
1. **日内交易和短线交易**:2分钟和5分钟EMAs与色带提供清晰的短期趋势方向和潜在反转信号。
2. **摇摆交易**:日线EMAs和MAs提供对更大趋势的视角,帮助将短期交易与更广泛的市场方向对齐。
3. **缺口交易**:前一日和盘前水平帮助识别潜在的缺口填充情况和突破/跌破机会。
4. **VWAP交易策略**:多时间周期VWAP允许识别机构参与水平和潜在反转区域。
5. **EMA交叉系统**:各种EMAs可用于识别跨多个时间周期的黄金交叉和死亡交叉。
#### 组件如何协同工作
NasyI的强大之处在于这些不同技术元素的集成:
1. 短时间周期EMAs(2m,5m)提供即时趋势信息,而日线EMAs/MAs提供关于更大市场结构的背景。
2. EMAs之间的色带提供趋势对齐或跨时间周期分歧的即时视觉确认。
3. 前一日和盘前水平添加水平支撑/阻力区域,补充动态移动平均线。
4. 多时间周期VWAP提供机构活动水平和潜在反转点的额外确认。
通过结合这些元素,交易者可以发展出全面的市场视图,整合价格行动、趋势方向和关键支撑/阻力水平于一个指标中。
#### 使用说明
1. 将NasyI指标应用到您的图表上(最适合1分钟至30分钟的日内时间周期)。
2. 观察价格与各种EMAs之间的关系:
- 价格位于2m/5m EMAs之上,带有绿色带状区域,表示看涨的短期条件
- 价格位于2m/5m EMAs之下,带有红色带状区域,表示看跌的短期条件
3. 使用日线EMAs/MAs和VWAPs作为潜在价格移动和反转区域的目标。
4. 前一日和盘前高点/低点线提供需要关注的突破或跌破的关键水平。
5. 使用广泛的设置选项根据您的偏好自定义外观。
这个指标代表了一种独特的技术分析方法,将多个时间周期的视角结合到一个单一的、视觉直观的显示中,帮助交易者基于对市场条件的全面视图做出更明智的决策。

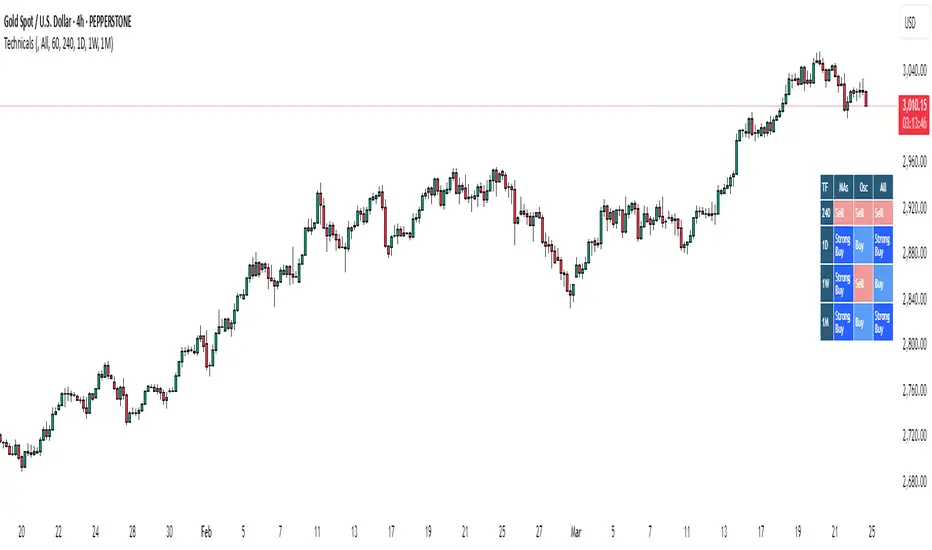
Bias TableOverview
The Bias Table Indicator is a multi-timeframe analysis tool designed to provide a quick sentiment overview across multiple timeframes. It combines signals from Moving Averages (MAs) and Oscillators to determine market bias, helping traders make more informed decisions.
Key Features
✔ Multi-Timeframe Analysis (MTF) – Displays market bias across up to five timeframes.
✔ Customizable Signals – Choose whether bias is based on Moving Averages (MAs), Oscillators, or a combination of both.
✔ Visual Table Format – The indicator presents the bias as a color-coded table in the bottom-right corner of the chart for quick reference.
✔ Adjustable Colors & Display Settings – Users can customize colors for different sentiment states (Strong Buy, Buy, Neutral, Sell, Strong Sell).
How It Works
Bias Calculation: The indicator evaluates market conditions using preset values (which can be replaced with actual logic) to determine sentiment for each timeframe.
Multi-Timeframe Support: The table can display bias from hourly to monthly timeframes, giving traders a broader view of market conditions.
Customizable Signals: Users can filter the table to show bias based only on MAs, Oscillators, or a combination of both.
Interpreting the Table
📊 Timeframes: The leftmost column shows selected timeframes (e.g., 1H, 4H, 1D, 1W, 1M).
📈 Signal Columns:
MAs – Bias based on Moving Averages.
Oscillators – Bias based on momentum indicators like RSI, Stochastics, etc.
All – A combined bias based on both MAs & Oscillators.
🚦 Color-Coded Ratings:
🔵 Strong Buy – High bullish strength.
🔹 Buy – Moderate bullish sentiment.
⚪ Neutral – No clear trend.
🔸 Sell – Moderate bearish sentiment.
🔴 Strong Sell – High bearish strength.
Best Used For:
📈 Trend Confirmation: Validate signals from your primary strategy.
⏳ Multi-Timeframe Analysis: See whether short-term and long-term trends align.
⚡ Quick Sentiment Check: Get a high-level view of market conditions without analyzing multiple indicators separately.
Customization Options:
Select which timeframes to include in the table.
Choose whether to base bias on MAs, Oscillators, or both.
Adjust colors for each signal type.
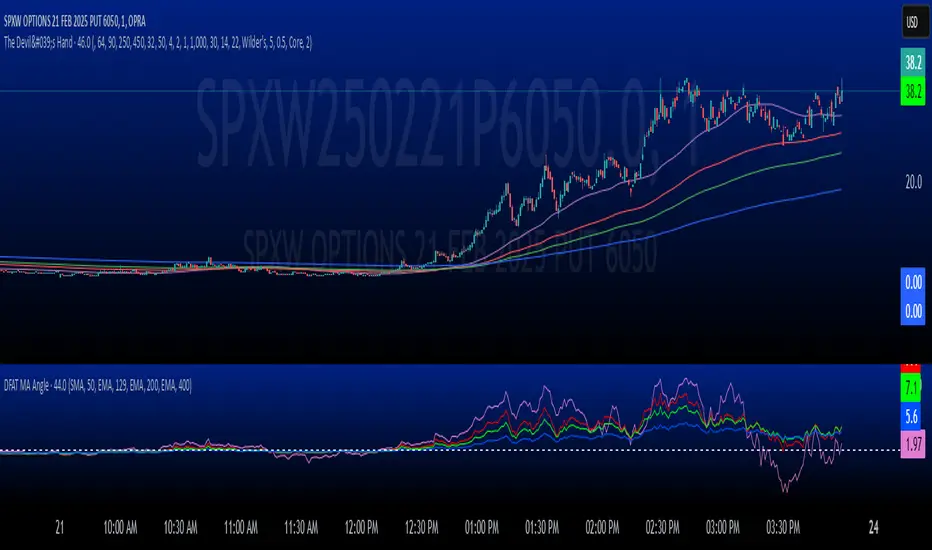
Ronnie's DikFat Attack - Moving Average Angle/Slope PositionRonnie's DikFat Attack - True Moving Average Angle/Slope Position
Overview
This TradingView indicator, written in Pine Script version 5, injects energy into your chart analysis by calculating and displaying the angles of four moving averages (MAs). It empowers you to customize each MA—choosing both type and length—to suit your trading strategy perfectly.
How It Works
1. User Inputs:
Under the “MA Settings” group, the script offers an intuitive interface where you can define four different moving averages. Each MA can be set to one of several types (SMA, EMA, SMMA, VWMA, Hull, WMA, or TEMA) and assigned a specific length (number of bars).
2. Dynamic Moving Average Calculation:
A dedicated function ( getMA ) selects and computes the appropriate moving average using TradingView’s built-in functions (like ta.ema , ta.sma , etc.). This yields four customized MA series based on your inputs.
3. Calculating the Angle of Momentum:
The script employs a robust function ( calcAngle ) that measures the change between consecutive values of each MA to determine its slope. This slope is then converted into an angle in degrees using the arctangent function, providing a clear and vivid depiction of trend strength and direction.
4. Visualizing the Angles:
Each moving average’s angle is plotted with its own distinct color, enhancing visual clarity. A horizontal line at 0° acts as a reference point, marking the divide between upward and downward momentum.
Potential Uses
Trend Analysis:
The angle measurement offers a dynamic perspective on trend strength. Steep positive angles suggest vigorous upward movement, while steep negative angles indicate strong downward trends.
Signal Confirmation:
By comparing the angles of multiple moving averages, you can quickly spot momentum shifts and crossover points, which may serve as powerful entry or exit signals.
Tailored Strategy Customization:
The flexibility to choose various MA types and lengths allows this tool to adapt seamlessly to different timeframes and trading styles, enhancing its usefulness in diverse market conditions.
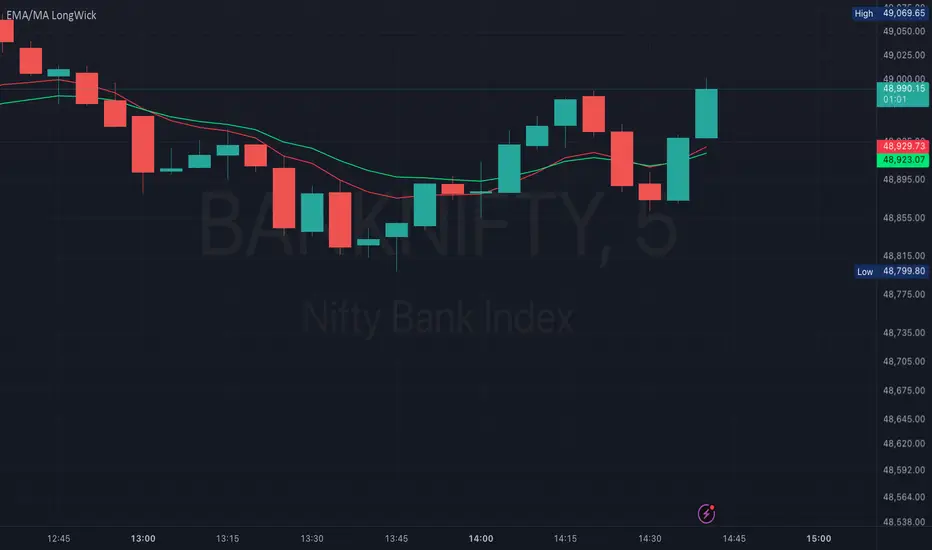
EMA/MA with OHCL Candle and Long Wick – A Comprehensive Trading
Dear Traders,
I am excited to introduce EMA/MA with OHCL Candle and Long Wick, a powerful trading indicator designed to enhance market analysis by combining Exponential Moving Averages (EMA), Simple Moving Averages (MA), OHCL candle patterns, and long wick detection into a single tool.
Key Features:
✅ Customizable Wick Size & Timeframe – Adapt the indicator to different market conditions by adjusting wick size and analyzing price action over any timeframe.
✅ EMA & MA for Trend Analysis – Includes multiple EMAs and MAs (5, 9, 15, 20, 50, 100, 200) to help identify trends and potential reversals.
✅ Long Wick Signal Detection – Identifies strong Buy and Sell opportunities based on wick size, signaling potential market turning points.
✅ OHCL Candle Analysis – Highlights OHCL patterns to provide additional insights into price action.
✅ User-Friendly & Lightweight – Efficiently coded for seamless performance on TradingView.
This indicator is perfect for traders looking to refine their entry and exit strategies by leveraging price action and moving averages. Whether you're a scalper, day trader, or swing trader, this tool provides valuable insights to enhance your decision-making.
Give it a try, and let me know your feedback! 🚀
Best regards,
Purnendu Singh
Put/Call RatioPut/Call Ratio Indicator
This indicator visualizes the Put/Call Ratio for various market symbols, helping traders assess market sentiment and potential reversals. It offers a dropdown menu to select from a range of Put/Call Ratios, including broad equities (CBOE), major indices (SPX, QQQ, IWM, VIX), and individual stocks (TSLA, GOOG, META, AMZN, MSFT, INTC).
The indicator plots the Put/Call Ratio with adjustable moving averages and standard deviation bands to highlight overbought or oversold conditions. A short-term moving average (default: 10 periods) is displayed with trend-based coloring, while longer-term moving averages (defaults: 30 and 200 periods) are calculated but hidden by default. Bands at 1, 1.5, and 2 standard deviations provide context for extreme readings.
Key Overbought/Oversold Signals:
Short-Term Extremes: The 10-day moving average moves beyond 1 standard deviation from the 200-day moving average, signaling potential overbought (above) or oversold (below) conditions. This will be highlighted by red or green background color.
Ratio Extremes: The Put/Call Ratio line itself crosses outside 2 standard deviations from the 200-day moving average, indicating stronger overbought or oversold zones.
Conditional coloring of the ratio line reflects its position relative to the bands, and background shading highlights when the short-term moving average crosses key levels.
Key Features:
Selectable Put/Call Ratio symbols.
Trend-colored moving averages.
Standard deviation bands for volatility analysis.
Dynamic line and background coloring for quick insights.
Usage:
Use this indicator to gauge market sentiment—high ratios may suggest bearish sentiment or oversold conditions, while low ratios may indicate bullish sentiment or overbought conditions. Combine with price action or other tools for confirmation.

[3Commas] HA & MAHA & MA
🔷What it does: This tool is designed to test a trend-following strategy using Heikin Ashi candles and moving averages. It enters trades after pullbacks, aiming to let profits run once the risk-to-reward ratio reaches 1:1 while securing the position.
🔷Who is it for: It is ideal for traders looking to compare final results using fixed versus dynamic take profits by adjusting parameters and trade direction—a concept applicable to most trading strategies.
🔷How does it work: We use moving averages to define the market trend, then wait for opposite Heikin Ashi candles to form against it. Once these candles reverse in favor of the trend, we enter the trade, using the last swing created by the pullback as the stop loss. By applying the breakeven ratio, we protect the trade and let it run, using the slower moving average as a trailing stop.
A buy signal is generated when:
The previous candle is bearish (ha_bear ), indicating a pullback.
The fast moving average (ma1) is above the slow moving average (ma2), confirming an uptrend.
The current candle is bullish (ha_bull), showing trend continuation.
The Heikin Ashi close is above the fast moving average (ma1), reinforcing the bullish bias.
The real price close is above the open (close > open), ensuring bullish momentum in actual price data.
The signal is confirmed on the closed candle (barstate.isconfirmed) to avoid premature signals.
dir is undefined (na(dir)), preventing repeated signals in the same direction.
A sell signal is generated when:
The previous candle is bullish (ha_bull ), indicating a temporary upward move before a potential reversal.
The fast moving average (ma1) is below the slow moving average (ma2), confirming a downtrend.
The current candle is bearish (ha_bear), showing trend continuation to the downside.
The Heikin Ashi close is below the fast moving average (ma1), reinforcing bearish pressure.
The real price close is below the open (close < open), confirming bearish momentum in actual price data.
The signal is confirmed after the candle closes (barstate.isconfirmed), avoiding premature entries.
dir is undefined (na(dir)), preventing consecutive signals in the same direction.
In simple terms, this setup looks for trend continuation after a pullback, confirming entries with both Heikin Ashi and real price action, supported by moving average alignment to avoid false signals.
If the price reaches a 1:1 risk-to-reward ratio, the stop will be moved to the entry point. However, if the slow moving average surpasses this level, it will become the new exit point, acting as a trailing stop
🔷Why It’s Unique
Easily visualizes the benefits of using risk-to-reward ratios when trading instead of fixed percentages.
Provides a simple and straightforward approach to trading, embracing the "keep it simple" concept.
Offers clear visualization of DCA Bot entry and exit points based on user preferences.
Includes an option to review the message format before sending signals to bots, with compatibility for multi-pair and futures contract pairs.
🔷 Considerations Before Using the Indicator
⚠️Very important: The indicator must be used on charts with real price data, such as Japanese candlesticks, line charts, etc. Do not use it on Heikin Ashi charts, as this may lead to unrealistic results.
🔸Since this is a trend-following strategy, use it on timeframes above 4 hours, where market noise is reduced and trends are clearer. Also, carefully review the statistics before using it, focusing on pairs that tend to have long periods of well-defined trends.
🔸Disadvantages:
False Signals in Ranges: Consolidating markets can generate unreliable signals.
Lagging Indicator: Being based on moving averages, it may react late to sudden price movements.
🔸Advantages:
Trend Focused: Simplifies the identification of trending markets.
Noise Reduction: Uses Heikin Ashi candles to identify trend continuation after pullbacks.
Broad Applicability: Suitable for forex, crypto, stocks, and commodities.
🔸The strategy provides a systematic way to analyze markets but does not guarantee successful outcomes. Use it as an additional tool rather than relying solely on an automated system.
Trading results depend on various factors, including market conditions, trader discipline, and risk management. Past performance does not ensure future success, so always approach the market cautiously.
🔸Risk Management: Define stop-loss levels, position sizes, and profit targets before entering any trade. Be prepared for potential losses and ensure your approach aligns with your overall trading plan.
🔷 STRATEGY PROPERTIES
Symbol: BINANCE:BTCUSDT (Spot).
Timeframe: 4h.
Test Period: All historical data available.
Initial Capital: 10000 USDT.
Order Size per Trade: 1% of Capital, you can use a higher value e.g. 5%, be cautious that the Max Drawdown does not exceed 10%, as it would indicate a very risky trading approach.
Commission: Binance commission 0.1%, adjust according to the exchange being used, lower numbers will generate unrealistic results. By using low values e.g. 5%, it allows us to adapt over time and check the functioning of the strategy.
Slippage: 5 ticks, for pairs with low liquidity or very large orders, this number should be increased as the order may not be filled at the desired level.
Margin for Long and Short Positions: 100%.
Indicator Settings: Default Configuration.
MA1 Length: 9.
MA2 Length: 18.
MA Calculations: EMA.
Take Profit Ratio: Disable. Ratio 1:4.
Breakeven Ratio: Enable, Ratio 1:1.
Strategy: Long & Short.
🔷 STRATEGY RESULTS
⚠️Remember, past results do not guarantee future performance.
Net Profit: +324.88 USDT (+3.25%).
Max Drawdown: -81.18 USDT (-0.78%).
Total Closed Trades: 672.
Percent Profitable: 35.57%.
Profit Factor: 1.347.
Average Trade: +0.48 USDT (+0.48%).
Average # Bars in Trades: 13.
🔷 HOW TO USE
🔸 Adjust Settings:
The default values—MA1 (9) and MA2 (18) with EMA calculation—generally work well. However, you can increase these values, such as 20 and 40, to better identify stronger trends.
🔸 Choose a Symbol that Typically Trends:
Select an asset that tends to form clear trends. Keep in mind that the Strategy Tester results may show poor performance for certain assets, making them less suitable for sending signals to bots.
🔸 Experiment with Ratios:
Test different take profit and breakeven ratios to compare various scenarios—especially to observe how the strategy performs when only the trade is protected.
🔸This is an example of how protecting the trade works: once the price moves in favor of the position with a 1:1 risk-to-reward ratio, the stop loss is moved to the entry price. If the Slow MA surpasses this level, it will act as a trailing stop, aiming to follow the trend and maximize potential gains.
🔸In contrast, in this example, for the same trade, if we set a take profit at a 1:3 risk-to-reward ratio—which is generally considered a good risk-reward relationship—we can see how a significant portion of the upward move is left on the table.
🔸Results Review:
It is important to check the Max Drawdown. This value should ideally not exceed 10% of your capital. Consider adjusting the trade size to ensure this threshold is not surpassed.
Remember to include the correct values for commission and slippage according to the symbol and exchange where you are conducting the tests. Otherwise, the results will not be realistic.
If you are satisfied with the results, you may consider automating your trades. However, it is strongly recommended to use a small amount of capital or a demo account to test proper execution before committing real funds.
🔸Create alerts to trigger the DCA Bot:
Verify Messages: Ensure the message matches the one specified by the DCA Bot.
Multi-Pair Configuration: For multi-pair setups, enable the option to add the symbol in the correct format.
Signal Settings: Enable whether you want to receive long or short signals (Entry | TP | SL), copy and paste the the messages for the DCA Bots configured.
Alert Setup:
When creating an alert, set the condition to the indicator and choose "alert() function call only.
Enter any desired Alert Name.
Open the Notifications tab, enable Webhook URL, and paste the Webhook URL.
For more details, refer to the section: "How to use TradingView Custom Signals".
Finalize Alerts: Click Create, you're done! Alerts will now be sent automatically in the correct format.
🔷 INDICATOR SETTINGS
MA 1: Fast MA Length
MA 2: Slow MA Length
MA Calc: MA's Calculations (SMA,EMA, RMA,WMA)
TP Ratio: This is the take profit ratio relative to the stop loss, where the trade will be closed in profit.
BE Ratio: This is the breakeven ratio relative to the stop loss, where the stop loss will be updated to breakeven or if the MA2 is greater than this level.
Strategy: Order Type direction in which trades are executed.
Use Custom Test Period: When enabled signals only works in the selected time window. If disabled it will use all historical data available on the chart.
Test Start and End: Once the Custom Test Period is enabled, here you select the start and end date that you want to analyze.
Check Messages: Enable the table to review the messages to be sent to the bot.
Entry | TP | SL: Enable this options to send Buy Entry, Take Profit (TP), and Stop Loss (SL) signals.
Deal Entry and Deal Exit : Copy and paste the message for the deal start signal and close order at Market Price of the DCA Bot. This is the message that will be sent with the alert to the Bot, you must verify that it is the same as the bot so that it can process properly so that it executes and starts the trade.
DCA Bot Multi-Pair: You must activate it if you want to use the signals in a DCA Bot Multi-pair in the text box you must enter (using the correct format) the symbol in which you are creating the alert, you can check the format of each symbol when you create the bot.
👨🏻💻💭 We hope this tool helps enhance your trading. Your feedback is invaluable, so feel free to share any suggestions for improvements or new features you'd like to see implemented.
__
The information and publications within the 3Commas TradingView account are not meant to be and do not constitute financial, investment, trading, or other types of advice or recommendations supplied or endorsed by 3Commas and any of the parties acting on behalf of 3Commas, including its employees, contractors, ambassadors, etc.
