MENTFX AVERAGES MULTI TIMEFRAMEThe MENTFX AVERAGES MULTIME TIMEFRAME indicator is designed to provide traders with the ability to visualize multiple moving averages (MAs) from higher timeframes on their current chart, regardless of the chart's timeframe. It combines the power of exponential moving averages (EMAs) to help traders identify trends, spot potential reversal points, and make more informed trading decisions.
Key Features:
Multi-Timeframe Moving Averages: This indicator plots moving averages from daily timeframes directly on your chart, helping you keep track of higher timeframe trends while trading in any timeframe.
Customizable Moving Averages: You can adjust the length and visibility of up to three EMAs (default settings are 5, 10, and 20-period EMAs) to suit your trading style.
Overlay on Price: The indicator is designed to be overlaid on your price chart, seamlessly integrating with your existing analysis.
Simple but Effective: By offering a clear visual guide to where price is trading relative to important higher timeframe levels, this indicator helps traders avoid trading against major trends.
Why It’s Unique:
Validation Timeframe Flexibility: Unlike traditional moving average indicators that only work within the same chart's timeframe, the MENTFX AVERAGES M indicator allows you to pull moving averages from higher timeframes (default: Daily) and overlay them on any chart you're currently viewing, whether it's intraday (minutes) or even weekly. This cross-timeframe visibility is critical in determining the true market trend, adding context to your trades.
Customizability: Although the default settings focus on daily EMAs (5, 10, and 20 periods), traders can modify the parameters, including the type of moving average (Simple, Weighted, etc.), making it adaptable for any strategy. Whether you want shorter-term or longer-term averages, this indicator covers your needs.
Trend Confirmation Tool: The use of multiple EMAs helps traders confirm trend direction and potential price breakouts or reversals. For example, when the shorter-term 5 EMA crosses above the 20 EMA, it can signal a potential bullish trend, while the opposite could indicate bearish pressure.
How This Indicator Helps:
Identify Key Support and Resistance Levels: Higher timeframe moving averages often act as dynamic support and resistance. This indicator helps you stay aware of those critical levels, even when trading lower timeframes.
Trend Identification: Knowing where the market is relative to the 5, 10, and 20 EMAs from a higher timeframe gives you a clearer picture of whether you're trading with or against the prevailing trend.
Improved Decision Making: By aligning your trades with the direction of higher timeframe trends, you can increase your confidence in trade entries and exits, avoiding low-probability setups.
Multi-Market Use: This indicator works well across various asset classes—stocks, forex, crypto, and commodities—making it versatile for any trader.
How to Use:
Intraday Trading: Use the daily EMAs as a guide to see if intraday price movements align with longer-term trends.
Swing Trading: Plot daily EMAs to track the strength of a larger trend, using pullbacks to the moving averages as potential entry points.
Trend Trading: Monitor crossovers between the moving averages to signal potential changes in trend direction.
Default Settings:
5 EMA (Daily) – Blue Line
10 EMA (Daily) – Black Line
20 EMA (Daily) – Red Line
These lines will plot on your chart with a subtle opacity (33%) to ensure they don’t obstruct price action, while still providing crucial visual guidance on market trends.
This indicator is perfect for traders who want to blend technical analysis with multi-timeframe insights, helping you stay in sync with broader market movements while executing trades on any timeframe.
Pesquisar nos scripts por "averages"

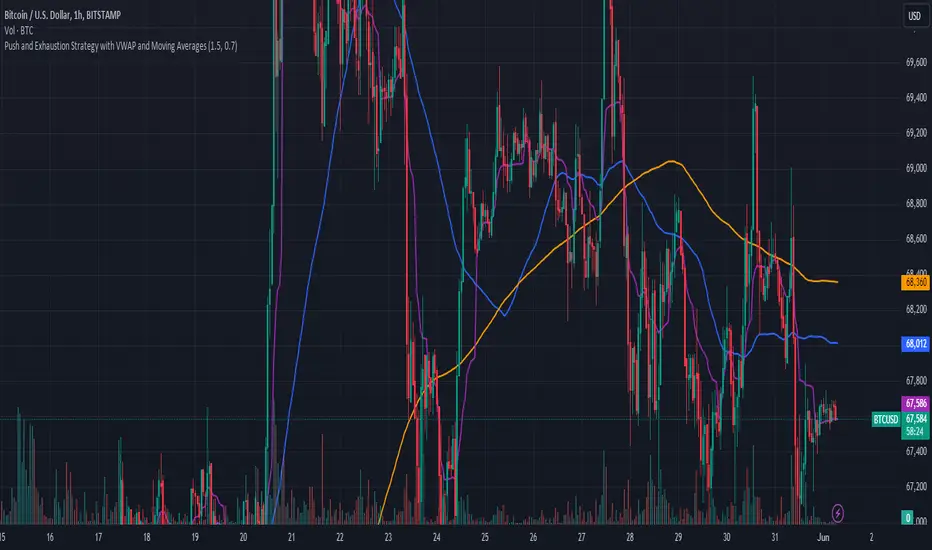
Push and Exhaustion Strategy with VWAP and Moving AveragesOverview:
The Push and Exhaustion Strategy Indicator is a custom technical analysis tool designed to help traders identify potential market turning points by highlighting significant price movements (pushes) and subsequent periods of reduced momentum (exhaustion). This indicator also incorporates key moving averages (50-period and 200-period) and the Volume Weighted Average Price (VWAP) to provide additional context for trading decisions.
Components:
Push and Exhaustion Thresholds:
Push Threshold: Set at 1.5 by default. This means the price must increase by 50% or more compared to the previous close to signal a push.
Exhaustion Threshold: Set at 0.7 by default. This means the price must decrease by 30% or more compared to the previous close to signal exhaustion.
VWAP (Volume Weighted Average Price):
VWAP is plotted on the chart to provide an average price weighted by volume, giving insight into the true average price paid for an asset.
Moving Averages:
50-period Moving Average (MA): Plotted in blue, it helps identify the short-to-mid-term trend direction.
200-period Moving Average (MA): Plotted in orange, it helps identify the long-term trend direction.
How It Works:
Push Condition:
A push signal is generated when the current closing price is at least 1.5 times the previous closing price (pushThreshold).
Additionally, the closing price must be above the VWAP, indicating strong upward momentum.
When these conditions are met, a green triangle is plotted above the price bar.
Exhaustion Condition:
An exhaustion signal is generated when the current closing price is at most 0.7 times the previous closing price (exhaustionThreshold).
Additionally, the closing price must be below the VWAP, indicating weakened momentum and potential reversal.
When these conditions are met, a red triangle is plotted below the price bar.
Visualization:
The indicator plots green triangles above bars to indicate a push signal and red triangles below bars to indicate an exhaustion signal.
It also plots the 50-period and 200-period moving averages as blue and orange lines, respectively.
The VWAP is plotted as a purple line, showing the average price considering the trading volume.
Alerts:
The indicator includes optional alerts that notify the trader when a push or exhaustion signal is detected.
Usage:
Push Signals: Traders might use push signals to enter trades in the direction of strong momentum, typically buying in an uptrend.
Exhaustion Signals: Traders might use exhaustion signals to anticipate potential reversals, considering exiting positions or entering counter-trend trades.
Moving Averages: The 50-period and 200-period moving averages help provide context to the overall trend, aiding in decision-making.
VWAP: Being above or below the VWAP helps validate the strength of the price movement.
This indicator provides a comprehensive view of market momentum, aiding traders in making informed decisions by highlighting significant price moves and potential reversals within the context of prevailing trends.
PClose Levels 2.0This script plots the levels generated via a combination of SPX 2Y Quartiles for everyday, red days, and green days. It is intended for use solely with SPX.
These quartiles are also sorted by VIX averages into bands that expand and contract with VIX.
It gives us an idea of what levels to potentially expect resistance/support fairly well, but is designed to be used in conjunction with other indicators and macroeconomic information.
Green Dashed is your Expected Max Range (EMR+) based on Green Day averages.
Green Dotted is your Expected Range (ER+) based on full dataset averages.
Green solid lines are POS2 and POS1, based on Green Day averages.
White Dotted is your Expected Move (EM), based on full dataset averages.
Red solid lines are NEG1 and NEG2, based on Red Day averages.
Red Dotted is your Expected Range (ER-) based on full dataset averages.
Red Dashed is your Expected Max Range (EMR-) based on Red Day averages.

Krown Moving Averages & Crossover LevelsIntroducing Krown Moving Averages with Crossover levels.
This indicator
Plots 5 Ema's and 3 SMA's ( Default Krown Periods )
It calculates the price levels at which each pair of moving averages would be equal .
That means that if price closes the other side of that level the pair of moving will cross also.
These levels can therefore be considered as " crossover levels....( the price level where each pair of moving averages will cross)
It can give crossover levels for
SMA crossing SMA
EMA crossing EMA
EMA crossing SMA
Plots optional Labels for all crossover levels....(off by default needs to be turned on in the settings)
Plots optional crossover levels as lines and dots colored as the 2 colors of the pair of moving averages.....(off by default needs to be turned on in the settings)
This indicator is aimed at traders who use simple and exponential moving average crossovers as part of their trading plan or edge.
It takes the guesswork out of knowing at what price level a pair of moving averages will cross which helps to improve entries and risk management.
There is an optional "Cutoff" function and user adjustable "limit factor" which cuts the plots off once they are too far below or above the current price to prevent chart auto focus issues.
There is a decimal place truncation option to set the decimal places depending on the asset type and price accuracy required.
Inspired by a request from a community member after one of my recent reverse engineered indicator publications.
I am publishing this open source in the hopes that some newer coders will find the functions interesting and useful.

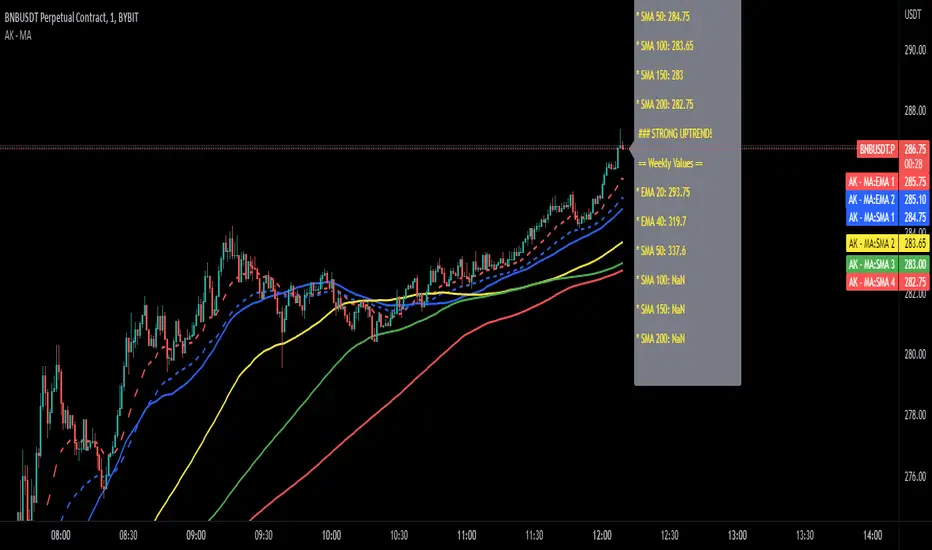
Adam Khoo Moving AveragesThis indicator will plot the simple and exponential moving averages Adam Khoo is also looking at for buying opportunities.
The best timeframe to use this indicator is the daily chart . The weekly moving averages are hard coded and don't change on any other timeframe. The other moving averages will show the values of your current timeframe.
In the settings you have the option to change the values of the moving averages and to show or not show the current timeframe moving averages or the weekly moving averages.
A label will also show the current value of all moving averages. To hide this label, go into the settings and click on 'Style' and at the bottom uncheck 'Labels'.
Happy trading ;-)
Quarterly Sine Wave with Moving Averages - AYNETDescription
Sine Wave:
The sine wave oscillates with a frequency determined by frequency.
Its amplitude (amplitude) and vertical offset (offset) are adjustable.
Moving Averages:
Includes options for different types of moving averages:
SMA (Simple Moving Average).
EMA (Exponential Moving Average).
WMA (Weighted Moving Average).
HMA (Hull Moving Average).
The user can choose the type (ma_type) and the length (ma_length) via inputs.
Horizontal Lines:
highest_hype and lowest_hype are horizontal levels drawn at the user-specified values.
Quarter Markers:
Vertical lines and labels (Q1, Q2, etc.) are drawn at the start of each quarter.
Customization Options
Moving Average Type:
Switch between SMA, EMA, WMA, and HMA using the dropdown menu.
Sine Wave Frequency:
Adjust the number of oscillations per year.
Amplitude and Offset:
Control the height and center position of the sine wave.
Moving Average Length:
Change the length for any selected moving average.
Output
This indicator plots:
A sine wave that oscillates smoothly over the year, divided into quarters.
A customizable moving average calculated based on the chosen price (e.g., close).
Horizontal lines for the highest and lowest hype levels.
Vertical lines and labels marking the start of each quarter.
Let me know if you need additional features! 😊

Combined Moving Averages + Squeeze & Volume Spike SignalsThis is a set of 4 combined moving averages. Each moving average is a combination of an EMA, SMA, HMA, RMA, WMA and VWMA with the same length as set in your input settings. All 6 of them are added together and then divided by 6 for an average of all of them. This is based on the theory that most traders use their own preference of moving averages, so combining them all should give us a better idea of where price should actually react since we are using the average of what most traders are using on their charts. It also smooths the moving averages out as well so you get a much easier to read moving average than any of them on their own which should help you hold positions longer and time your entries better.
The default lengths used for this indicator are as follows: 10, 50, 100 and 500. These lengths can be updated in the settings. The 10 and 500 will change colors when the individual moving average is less than or greater than its previous value. Price above or below the moving average does not affect the colors. The 50 and 100 are colored based on whether the 50 is greater/less than the 100.
The two middle length moving averages by default are the 50 and 100. This has been turned into a cloud because it is the area where price typically bounces, since tons of traders use the 50 and 100 moving averages. This should be your long/short zone when price is trending.
Each moving average can be set to use a different source such as close, open, high, low, ohlc4, etc. You can also adjust the length of each moving average. Default settings work well, but feel free to customize them to your liking. You can also change the colors of the lines in the settings.
Beware that changing the lengths of MA #2 and MA #3 will change the signals, squeezes and the cloud.
VOLUME SPIKES
The cloud will change to a brighter color when a volume spike is detected. When a major volume spike is detected, it will turn very bright colored green/red according to the direction of the cloud. This notifies you of volume spikes so you have a better idea of how strong the trend is. If the cloud is a dark green/red then that means that volume is less than or equal to the recent median volume.
SIGNALS
There are also signals that will be given when the current candle is in the cloud, the candle is going in the same direction as the cloud, the MA #2 and MA #3 is going in the same direction and a volume spike is detected. These help you identify good entries when markets are trending. Be cautious of these signals when the trend is sideways and not clearly moving in one direction. The signals can be turned on or off in the settings.
SQUEEZE
Many times when moving averages squeeze together, a big move happens shortly after. Because of this I added a yellow background color when a squeeze is detected. It looks at the median value difference of the MA #2 and MA #3 and if the current value difference is less than the median multiplied by the multiplier in the settings then it will change the background color to notify you. The default value of the multiplier is .6, meaning the squeeze signal will only show if the current value difference of the cloud is less than .6 of the median difference. The multiplier can be adjusted in the settings to suit your preferences. Lower values will only show tighter squeezes.
MARKETS
This indicator can be used on all markets including stocks, crypto, futures and forex.
TIMEFRAMES
This indicator can be used on all timeframes.
PAIRINGS
We recommend pairing this combined moving average with Trend Friend Swing Trade And Scalp Signals for extra confluence. Look for price to bounce in the cloud with good volume and a confirming signal from Trend Friend for highly probable moves.
SB Multiple Moving Averages (Simple)This script contains 7 simple moving averages. You can use 1-7 moving averages on the chart. Also you can display in the table this moving averages. If the box on the chart is green , close price is above the moving average but if box is red, close price is below the moving average. And this feature is very useful because if you do not want to see the complex moving averages on the chart, you can just look the table and remove the averages on the chart.

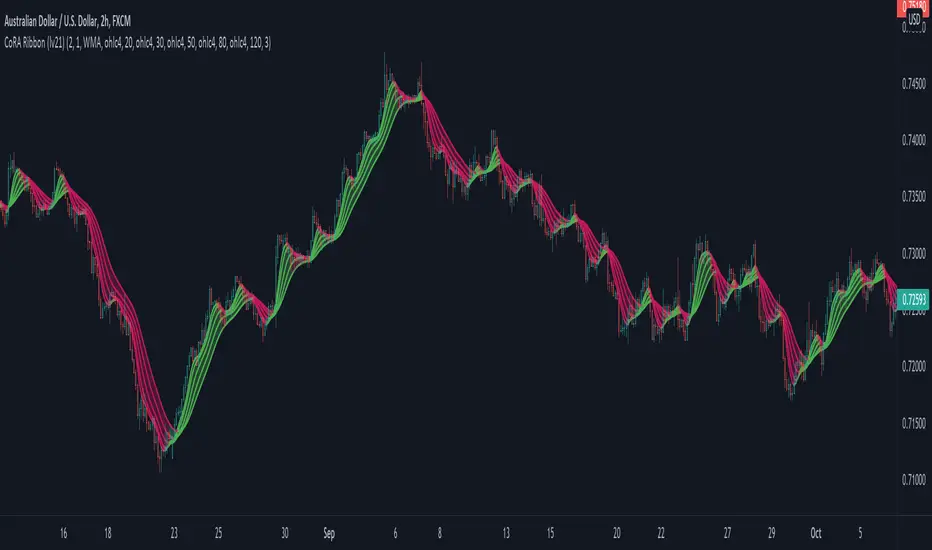
CoRA Ribbon - Multiple Compound Ratio Weighted Moving AveragesWhat distinguishes this indicator?
A Compound Ratio Weighted Moving Average ("CoRA") is a Moving Average that, regardless of its length, has very little lag and that can be relied on to accurately track price movements and fluctuations - compared to other types of Moving Averages.
By combining multiple Compound Ratio Weighted Moving Averages you can identify the trend better and more reliably . This is where "CoRA Ribbon" comes in.
The original study, which supported one CoRA Wave, comes from RedKTrader and was introduced as "RedK Compound Ratio Moving Average (CoRa_Wave)” . Thanks to him for the great work!
What was improved or added to this version of the indicator?
With this version of the indicator, up to 5 waves of Compound Ratio Moving Averages with different lengths can be combined and output to one "CoRA Ribbon".
Alerts were implemented. You can be notified e.g. in the event of
changes in direction of each single CoRA Wave
a trend change, which is determined on the basis of all 5 CoRA Waves
A CoRA Wave compared to other Moving Averages - CoRa Waves are less lagging behind
A suggestion for interpretation of “CoRA Ribbon”:
Since CoRA Ribbon can help you to identify the trend better and more reliably, this indicator provides a good baseline for your strategy, but should always be used in conjunction with other indicators or market analysis.
By adjusting the length of each individual wave, you can adapt "CoRA Ribbon" to your trading style - whether it is more aggressive or more cautious.
The following general rules can be formulated:
If the Ribbon changes its color to green, this can be interpreted as a buy signal.
If the Ribbon changes its color to red, this can be interpreted as a sell signal.
Good to know: The default settings have been selected for timeframe lower than 15 minutes. Adjust them and the indicator will do a great job on higher timeframes too. Please remember to test carefully after every change before the changes are applied to your live trading.
Background “Compound Ratio Weighted Average” - provided by "RedKTrader"
A Compound Ratio Weighted Average is a moving average where the weights increase in a "logarithmically linear" way - from the furthest point in the data to the current point.
The formula to calculate these weights work in a similar way to how "compound ratio" works: you start with an initial amount, then add a consistent "ratio of the cumulative prior sum" each period until you reach the end amount. The result is the "step ratio" between the weights is consistent - This is not the case with linear-weighted “Moving Average Weighted” (WMA) or “Exponential Moving Average” (EMA)
For example, if you consider a Weighted Moving Average ( WMA ) of length 5, the weights will be (from the furthest point towards the most current) 1, 2, 3, 4, 5 -- we can see that the ratio between these weights are inconsistent. in fact, the ratio between the 2 furthest points is 2:1, but the ratio between the most recent points is 5:4. the ratio is inconsistent, and in fact, more recent points are not getting the best weights they should get to counter-act the lag effect. Using the Compound Ratio approach addresses that point.
A key advantage here is that we can significantly reduce the "tail weight" - which is "relatively" large in other Moving Averages.
A Compound Ratio Weighted Moving Average is a moving average that has very little lag and that can be relied on to accurately track price movements and fluctuations.
Use or modify the code, invite us for a coffee, ... most importantly: have a lot of fun and success with this indicator
The code is commented - please don't hesitate to use it as needed or customize it further ... and if you are satisfied and even successful with this indicator, maybe buy us a coffee ;-)
The original developer ( RedKTrader ) and I ( consilus ) are curious to see how our indicators will develop through further ideas - so please keep us updated.
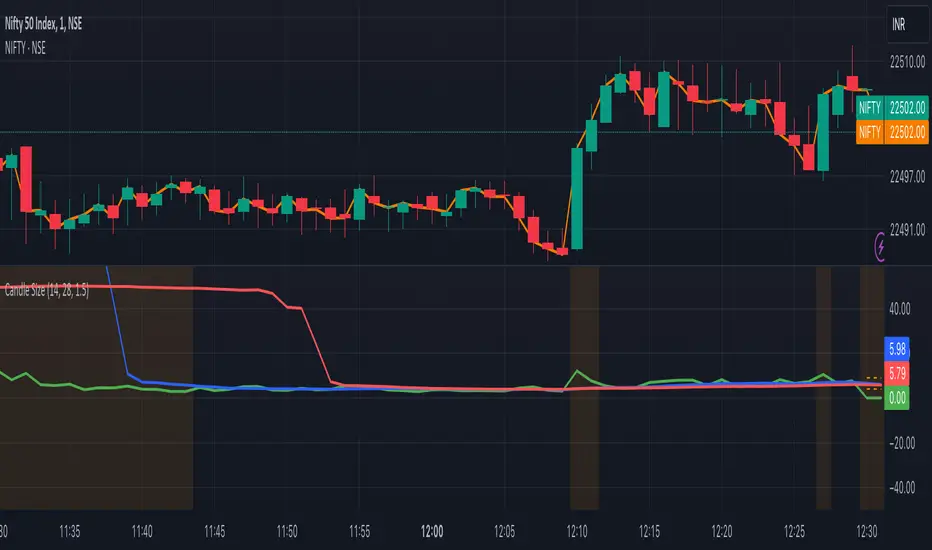
Candle Size with Moving Averages and AlertsOverview
The "Candle Size with Moving Averages and Alerts" indicator is designed to provide traders with a visual representation of the size of each candle. This is useful for identifying periods of high volatility or significant price movements. The indicator also offers moving averages of the candle sizes and customizable alert thresholds to notify traders of unusually large or small candles.
Key Features
Candle Size Plot: Displays the size of each candle on a separate panel.
Moving Averages: Optionally plot moving averages of the candle sizes with customizable lengths and colors.
Alert Thresholds: Define thresholds to get alerted when candle sizes are unusually large or small.
Customizable Colors: Choose colors for different elements of the indicator.
Alerts: Visual and background color alerts for significant candle sizes.
How to Use the Indicator
Adding the Indicator to Your Chart
Open TradingView and navigate to your chart.
Click on the "Indicators" button at the top of the chart.
Search for "Candle Size with Moving Averages and Alerts."
Click on the indicator to add it to your chart.
Customizing the Indicator
Once the indicator is added to your chart, click on the settings icon (gear icon) next to the indicator's name in the chart legend.
This will open the settings panel where you can customize various parameters of the indicator.
Settings and Parameters
Show Moving Averages
Checkbox: Enable or disable the display of moving averages on the candle size plot.
MA Length 1
Input: Set the length of the first moving average (default is 14).
MA Length 2
Input: Set the length of the second moving average (default is 28).
Alert Threshold
Input: Define the threshold for alerts as a multiple of the average candle size (default is 1.5).
MA Color 1
Color Picker: Choose the color for the first moving average (default is blue).
MA Color 2
Color Picker: Choose the color for the second moving average (default is red).
Candle Size Color
Color Picker: Choose the color for the candle size plot (default is green).
Alert Threshold Color
Color Picker: Choose the color for the alert thresholds (default is orange).
Understanding the Plots
Candle Size Plot
The main plot shows the size of each candle (high minus low) in green by default.
This helps you visualize the volatility and identify significant price movements.
Moving Averages
If enabled, two moving averages are plotted on the candle size chart to help you understand the average candle size over different periods.
MA 1 (blue by default) and MA 2 (red by default) provide a smoothed view of the candle sizes.
Alert Thresholds
The upper and lower thresholds are plotted as dashed lines (orange by default).
The upper threshold indicates an unusually large candle size, while the lower threshold indicates an unusually small candle size.
Alerts and Background Colors
When the candle size exceeds the upper threshold, an alert is triggered, and the background color changes to a semi-transparent orange.
When the candle size falls below the lower threshold, an alert is triggered, and the background color changes to a semi-transparent orange.
These visual cues help you quickly identify significant candle sizes.
Example Settings
MA Length 1: 14
MA Length 2: 28
Alert Threshold: 1.5
MA Color 1: Blue
MA Color 2: Red
Candle Size Color: Green
Alert Threshold Color: Orange
SNL Popular Moving Averages MTFSNL△ Popular Moving Averages MTF
Short title: PopMAs
These are popular moving averages used by various traders and they are multi-timeframe, i.e. you can see
the 200 day SMA on a 15 minute chart.
Four moving averages are also included for the current timeframe (20, 50, 100 and 200 EMA).
Not all moving averages are enabled by default. You can turn individual moving averges on or off in the
"Style" tab of the indicator's settings.
The way I see moving averages is that they do not represent a magic mathematical truth, but are simply the
result of many people agreeing on the same parameters. I guess the origin were five working days in a week
and therefore a month would be four times five, i.e. a 20 day SMA. 200 days are probably an estimate of
the work days in a year and the 50 day SMA represents a quarter year.
There are many indicators on TradingView that offer various adjustable moving averages, including
combinations and multi-timeframe. But my interest was to have an indicator with the most popular moving
averages and it should be multi-timeframe capable. By design I did not want to make the periods adjustable,
but you could add this easily if you like.
Here are some examples of poplular moving averages:
20 unit EMA : support on 4h BTC chart, Carl the Moon
20, 50, 100, 200 day SMA : classic trading all charts, Benjamin Cowen, Tone Vays
20, 50, 100, 200 week SMA: Benjamin Cowen
21 week EMA: well known BTC support, Benjamin Cowen
800 hour EMA: Traders Reality -> not possible in TradingView, represented as 33 day EMA
Known problems:
- I have not found a way to turn off floating labels according to a plot's state chosen in the "Style"
tab. So you will still see the label floating around even if you have turned off the moving average's
line. But you can always turn of all the floating labels in the settings.
- I have observed unexpected differences on multi-timeframe values: For example, looking at the true 20
week SMA on a weekly BTC chart showed a present time value of 43821 USD, but the value was 43908 USD
for the result of this call used in this script: security(syminfo.tickerid, "W", sma(close, 20))
The difference went away when switching my chart to weekly and back to 15 minutes.
Please comment if you know of other moving averages that are often and successfully used or if you find
that one of the included moving averages is irrelevant and should be removed from this script.
And I would very much appreciate any input regarding the mentioned known problems.

MTF Signal XpertMTF Signal Xpert – Detailed Description
Overview:
MTF Signal Xpert is a proprietary, open‑source trading signal indicator that fuses multiple technical analysis methods into one cohesive strategy. Developed after rigorous backtesting and extensive research, this advanced tool is designed to deliver clear BUY and SELL signals by analyzing trend, momentum, and volatility across various timeframes. Its integrated approach not only enhances signal reliability but also incorporates dynamic risk management, helping traders protect their capital while navigating complex market conditions.
Detailed Explanation of How It Works:
Trend Detection via Moving Averages
Dual Moving Averages:
MTF Signal Xpert computes two moving averages—a fast MA and a slow MA—with the flexibility to choose from Simple (SMA), Exponential (EMA), or Hull (HMA) methods. This dual-MA system helps identify the prevailing market trend by contrasting short-term momentum with longer-term trends.
Crossover Logic:
A BUY signal is initiated when the fast MA crosses above the slow MA, coupled with the condition that the current price is above the lower Bollinger Band. This suggests that the market may be emerging from a lower price region. Conversely, a SELL signal is generated when the fast MA crosses below the slow MA and the price is below the upper Bollinger Band, indicating potential bearish pressure.
Recent Crossover Confirmation:
To ensure that signals reflect current market dynamics, the script tracks the number of bars since the moving average crossover event. Only crossovers that occur within a user-defined “candle confirmation” period are considered, which helps filter out outdated signals and improves overall signal accuracy.
Volatility and Price Extremes with Bollinger Bands
Calculation of Bands:
Bollinger Bands are calculated using a 20‑period simple moving average as the central basis, with the upper and lower bands derived from a standard deviation multiplier. This creates dynamic boundaries that adjust according to recent market volatility.
Signal Reinforcement:
For BUY signals, the condition that the price is above the lower Bollinger Band suggests an undervalued market condition, while for SELL signals, the price falling below the upper Bollinger Band reinforces the bearish bias. This volatility context adds depth to the moving average crossover signals.
Momentum Confirmation Using Multiple Oscillators
RSI (Relative Strength Index):
The RSI is computed over 14 periods to determine if the market is in an overbought or oversold state. Only readings within an optimal range (defined by user inputs) validate the signal, ensuring that entries are made during balanced conditions.
MACD (Moving Average Convergence Divergence):
The MACD line is compared with its signal line to assess momentum. A bullish scenario is confirmed when the MACD line is above the signal line, while a bearish scenario is indicated when it is below, thus adding another layer of confirmation.
Awesome Oscillator (AO):
The AO measures the difference between short-term and long-term simple moving averages of the median price. Positive AO values support BUY signals, while negative values back SELL signals, offering additional momentum insight.
ADX (Average Directional Index):
The ADX quantifies trend strength. MTF Signal Xpert only considers signals when the ADX value exceeds a specified threshold, ensuring that trades are taken in strongly trending markets.
Optional Stochastic Oscillator:
An optional stochastic oscillator filter can be enabled to further refine signals. It checks for overbought conditions (supporting SELL signals) or oversold conditions (supporting BUY signals), thus reducing ambiguity.
Multi-Timeframe Verification
Higher Timeframe Filter:
To align short-term signals with broader market trends, the script calculates an EMA on a higher timeframe as specified by the user. This multi-timeframe approach helps ensure that signals on the primary chart are consistent with the overall trend, thereby reducing false signals.
Dynamic Risk Management with ATR
ATR-Based Calculations:
The Average True Range (ATR) is used to measure current market volatility. This value is multiplied by a user-defined factor to dynamically determine stop loss (SL) and take profit (TP) levels, adapting to changing market conditions.
Visual SL/TP Markers:
The calculated SL and TP levels are plotted on the chart as distinct colored dots, enabling traders to quickly identify recommended exit points.
Optional Trailing Stop:
An optional trailing stop feature is available, which adjusts the stop loss as the trade moves favorably, helping to lock in profits while protecting against sudden reversals.
Risk/Reward Ratio Calculation:
MTF Signal Xpert computes a risk/reward ratio based on the dynamic SL and TP levels. This quantitative measure allows traders to assess whether the potential reward justifies the risk associated with a trade.
Condition Weighting and Signal Scoring
Binary Condition Checks:
Each technical condition—ranging from moving average crossovers, Bollinger Band positioning, and RSI range to MACD, AO, ADX, and volume filters—is assigned a binary score (1 if met, 0 if not).
Cumulative Scoring:
These individual scores are summed to generate cumulative bullish and bearish scores, quantifying the overall strength of the signal and providing traders with an objective measure of its viability.
Detailed Signal Explanation:
A comprehensive explanation string is generated, outlining which conditions contributed to the current BUY or SELL signal. This explanation is displayed on an on‑chart dashboard, offering transparency and clarity into the signal generation process.
On-Chart Visualizations and Debug Information
Chart Elements:
The indicator plots all key components—moving averages, Bollinger Bands, SL and TP markers—directly on the chart, providing a clear visual framework for understanding market conditions.
Combined Dashboard:
A dedicated dashboard displays key metrics such as RSI, ADX, and the bullish/bearish scores, alongside a detailed explanation of the current signal. This consolidated view allows traders to quickly grasp the underlying logic.
Debug Table (Optional):
For advanced users, an optional debug table is available. This table breaks down each individual condition, indicating which criteria were met or not met, thus aiding in further analysis and strategy refinement.
Mashup Justification and Originality
MTF Signal Xpert is more than just an aggregation of existing indicators—it is an original synthesis designed to address real-world trading complexities. Here’s how its components work together:
Integrated Trend, Volatility, and Momentum Analysis:
By combining moving averages, Bollinger Bands, and multiple oscillators (RSI, MACD, AO, ADX, and an optional stochastic), the indicator captures diverse market dynamics. Each component reinforces the others, reducing noise and filtering out false signals.
Multi-Timeframe Analysis:
The inclusion of a higher timeframe filter aligns short-term signals with longer-term trends, enhancing overall reliability and reducing the potential for contradictory signals.
Adaptive Risk Management:
Dynamic stop loss and take profit levels, determined using ATR, ensure that the risk management strategy adapts to current market conditions. The optional trailing stop further refines this approach, protecting profits as the market evolves.
Quantitative Signal Scoring:
The condition weighting system provides an objective measure of signal strength, giving traders clear insight into how each technical component contributes to the final decision.
How to Use MTF Signal Xpert:
Input Customization:
Adjust the moving average type and period settings, ATR multipliers, and oscillator thresholds to align with your trading style and the specific market conditions.
Enable or disable the optional stochastic oscillator and trailing stop based on your preference.
Interpreting the Signals:
When a BUY or SELL signal appears, refer to the on‑chart dashboard, which displays key metrics (e.g., RSI, ADX, bullish/bearish scores) along with a detailed breakdown of the conditions that triggered the signal.
Review the SL and TP markers on the chart to understand the associated risk/reward setup.
Risk Management:
Use the dynamically calculated stop loss and take profit levels as guidelines for setting your exit points.
Evaluate the provided risk/reward ratio to ensure that the potential reward justifies the risk before entering a trade.
Debugging and Verification:
Advanced users can enable the debug table to see a condition-by-condition breakdown of the signal generation process, helping refine the strategy and deepen understanding of market dynamics.
Disclaimer:
MTF Signal Xpert is intended for educational and analytical purposes only. Although it is based on robust technical analysis methods and has undergone extensive backtesting, past performance is not indicative of future results. Traders should employ proper risk management and adjust the settings to suit their financial circumstances and risk tolerance.
MTF Signal Xpert represents a comprehensive, original approach to trading signal generation. By blending trend detection, volatility assessment, momentum analysis, multi-timeframe alignment, and adaptive risk management into one integrated system, it provides traders with actionable signals and the transparency needed to understand the logic behind them.

4-Hour Moving AveragesTitle: 4-Hour Moving Averages Indicator
Description:
The "4-Hour Moving Averages" indicator is designed to help traders easily visualize key moving averages derived from the 4-hour timeframe, regardless of the chart interval they are using. This indicator plots four moving averages: a 15-period SMA (Short-Term), a 35-period SMA (Intermediate-Term), an 80-period SMA (Long-Term), and a 130-period SMA (Confirmation).
These moving averages provide a balanced approach for identifying short, medium, and long-term trends, as well as confirming significant market movements. Ideal for swing traders and those looking for clear trend signals, the indicator can be used for various markets, including stocks, forex, and cryptocurrencies.
The 4-hour moving averages overlay directly on the price chart, allowing for easy analysis of current price movements relative to important trend indicators. Use this script to enhance your trading decisions, identify opportunities, and avoid market traps by relying on consistent moving average trends.
Features:
- 15 SMA for Short-Term Trends (in red)
- 35 SMA for Intermediate-Term Trends (in orange)
- 80 SMA for Long-Term Trends (in green)
- 130 SMA for Confirmation (in blue)
Feel free to modify the settings to suit your specific strategy and market conditions.

ADV_RSIADV_RSI - Advanced Relative Strength Index
Description: The ADV_RSI indicator is an advanced and mutated version of the classic Relative Strength Index (RSI), enhanced with multiple moving averages and a dynamic color-coding system. It provides traders with deeper insights into market momentum and potential trend reversals by incorporating two different moving averages of the RSI (21, and 50 periods). The indicator helps to visualize overbought and oversold conditions more effectively and offers a clear, color-coded representation of the RSI value relative to key thresholds.
Features:
RSI Calculation: The core of the indicator is based on the traditional RSI, calculated over a customizable period.
Multiple Moving Averages: The script includes two RSI moving averages (21, and 50 periods) to help identify trend strength and potential reversal points.
Dynamic RSI Color Coding: The RSI line is color-coded based on its value, ranging from red for overbought conditions to aqua for oversold conditions. This makes it easier to interpret the market's momentum at a glance.
Threshold Bands: The indicator includes horizontal threshold lines at key RSI levels (20, 30, 40, 50, 60, 70, 80), with shaded areas between them, providing a visual aid to quickly identify overbought and oversold zones.
How to Use:
The RSI line fluctuates between 0 and 100, with traditional overbought and oversold levels set at 70 and 30, respectively.
When the RSI crosses above the 70 level, it may indicate overbought conditions, signaling a potential selling opportunity.
When the RSI falls below the 30 level, it may indicate oversold conditions, signaling a potential buying opportunity.
The included moving averages of the RSI can help confirm trend direction and potential reversals.
The color coding of the RSI line provides a quick visual cue for momentum changes.
Ideal For:
Traders looking for a more nuanced understanding of market momentum.
Those who prefer visual aids for quick decision-making in identifying overbought and oversold conditions.
Traders who utilize multiple timeframes and need a comprehensive RSI tool for better accuracy in their analysis.

Bayesian Trend Indicator [ChartPrime]Bayesian Trend Indicator
Overview:
In probability theory and statistics, Bayes' theorem (alternatively Bayes' law or Bayes' rule), named after Thomas Bayes, describes the probability of an event, based on prior knowledge of conditions that might be related to the event.
The "Bayesian Trend Indicator" is a sophisticated technical analysis tool designed to assess the direction of price trends in financial markets. It combines the principles of Bayesian probability theory with moving average analysis to provide traders with a comprehensive understanding of market sentiment and potential trend reversals.
At its core, the indicator utilizes multiple moving averages, including the Exponential Moving Average (EMA), Simple Moving Average (SMA), Double Exponential Moving Average (DEMA), and Volume Weighted Moving Average (VWMA) . These moving averages are calculated based on user-defined parameters such as length and gap length, allowing traders to customize the indicator to suit their trading strategies and preferences.
The indicator begins by calculating the trend for both fast and slow moving averages using a Smoothed Gradient Signal Function. This function assigns a numerical value to each data point based on its relationship with historical data, indicating the strength and direction of the trend.
// Smoothed Gradient Signal Function
sig(float src, gap)=>
ta.ema(source >= src ? 1 :
source >= src ? 0.9 :
source >= src ? 0.8 :
source >= src ? 0.7 :
source >= src ? 0.6 :
source >= src ? 0.5 :
source >= src ? 0.4 :
source >= src ? 0.3 :
source >= src ? 0.2 :
source >= src ? 0.1 :
0, 4)
Next, the indicator calculates prior probabilities using the trend information from the slow moving averages and likelihood probabilities using the trend information from the fast moving averages . These probabilities represent the likelihood of an uptrend or downtrend based on historical data.
// Define prior probabilities using moving averages
prior_up = (ema_trend + sma_trend + dema_trend + vwma_trend) / 4
prior_down = 1 - prior_up
// Define likelihoods using faster moving averages
likelihood_up = (ema_trend_fast + sma_trend_fast + dema_trend_fast + vwma_trend_fast) / 4
likelihood_down = 1 - likelihood_up
Using Bayes' theorem , the indicator then combines the prior and likelihood probabilities to calculate posterior probabilities, which reflect the updated probability of an uptrend or downtrend given the current market conditions. These posterior probabilities serve as a key signal for traders, informing them about the prevailing market sentiment and potential trend reversals.
// Calculate posterior probabilities using Bayes' theorem
posterior_up = prior_up * likelihood_up
/
(prior_up * likelihood_up + prior_down * likelihood_down)
Key Features:
◆ The trend direction:
To visually represent the trend direction , the indicator colors the bars on the chart based on the posterior probabilities. Bars are colored green to indicate an uptrend when the posterior probability is greater than 0.5 (>50%), while bars are colored red to indicate a downtrend when the posterior probability is less than 0.5 (<50%).
◆ Dashboard on the chart
Additionally, the indicator displays a dashboard on the chart , providing traders with detailed information about the probability of an uptrend , as well as the trends for each type of moving average. This dashboard serves as a valuable reference for traders to monitor trend strength and make informed trading decisions.
◆ Probability labels and signals:
Furthermore, the indicator includes probability labels and signals , which are displayed near the corresponding bars on the chart. These labels indicate the posterior probability of a trend, while small diamonds above or below bars indicate crossover or crossunder events when the posterior probability crosses the 0.5 threshold (50%).
The posterior probability of a trend
Crossover or Crossunder events
◆ User Inputs
Source:
Description: Defines the price source for the indicator's calculations. Users can select between different price values like close, open, high, low, etc.
MA's Length:
Description: Sets the length for the moving averages used in the trend calculations. A larger length will smooth out the moving averages, making the indicator less sensitive to short-term fluctuations.
Gap Length Between Fast and Slow MA's:
Description: Determines the difference in lengths between the slow and fast moving averages. A higher gap length will increase the difference, potentially identifying stronger trend signals.
Gap Signals:
Description: Defines the gap used for the smoothed gradient signal function. This parameter affects the sensitivity of the trend signals by setting the number of bars used in the signal calculations.
In summary, the "Bayesian Trend Indicator" is a powerful tool that leverages Bayesian probability theory and moving average analysis to help traders identify trend direction, assess market sentiment, and make informed trading decisions in various financial markets.

RAINBOW AVERAGES - INDICATOR - (AS) - 1/3
-INTRODUCTION:
This is the first of three scripts I intend to publish using rainbow indicators. This script serves as a groundwork for the other two. It is a RAINBOW MOVING AVERAGES indicator primarily designed for trend detection. The upcoming script will also be an indicator but with overlay=false (below the chart, not on it) and will utilize RAINBOW BANDS and RAINBOW OSCILLATOR. The third script will be a strategy combining all of them.
RAINBOW moving averages can be used in various ways, but this script is mainly intended for trend analysis. It is meant to be used with overlay=true, but if the user wishes, it can be viewed below the chart. To achieve this, you need to change the code from overlay=true to false and turn off the first switch that plots the rainbow on the chart (or simply move the indicator to a new pane below). By doing this, you will be able to see how all four conditions used to detect trends work on the chart. But let's not get ahead of ourselves.
-WHAT IS IT:
In its simplest form, this indicator uses 10 moving averages colored like a rainbow. The calculation is as follows:
MA0: This is the main moving average and can be defined with the type (SMA, EMA, RMA, WMA, SINE), length, and price source. However, the second moving average (MA1) is calculated using MA0 as its source, MA2 uses MA1 as the data source, and so on, until the last one, MA9. Hence, there are 10 moving averages. The first moving average is special as all the others derive from it. This indicator has many potential uses, such as entry/exit signals, volatility indication, and stop-loss placement, but for now, we will focus on trend detection.
-TREND DETECTION:
The indicator offers four different background color options based on the user's preference:
0-NONE: No background color is applied as no trend detection tools is being used (boring)
1-CHANGE: The background color is determined by summing the changes of all 10 moving averages (from two bars). If the sum is positive and not falling, the background color is GREEN. If the sum is negative and not rising, the background color is RED. From early testing, it works well for the beginning of a movement but not so much for a lasting trend.
2-RAINBW: The background color is green when all the moving averages are in ascending order, indicating a bullish trend. It is red when all the moving averages are in descending order, indicating a bearish trend. For example, if MA1>MA2>MA3>MA4..., the background color is green. If MA1 threshold, and red indicates width < -threshold.
4-DIRECT: The background color is determined by counting the number of moving averages that are either above or below the input source. If the specified number of moving averages is above the source, the background color is green. If the specified number of moving averages is below the source, the background color is red. If all ten MAs are below the price source, the indicator will show 10, and if all ten MAs are above, it will show -10. The specific value will be set later in the settings (same for 3-TSHOLD variant). This method works well for lasting trends.
Note: If the indicator is turned into a below-chart version, all four color options can be seen as separate indicators.
-PARAMETERS - SETTINGS:
The first line is an on/off switch to plot the skittles indicator (and some info in the tooltip). The second line has already been discussed, which is the background color and the selection of the source (only used for MA0!).
The line "MA1: TYP/LEN" is where we define the parameters of MA0 (important). We choose from the types of moving averages (SMA, EMA, RMA, WMA, SINE) and set the length.
Important Note: It says MA1, but it should be MA0!.
The next line defines whether we want to smooth MA1 (which is actually MA0) and the period for smoothing. When smoothing is turned on, MA0 will be smoothed using a 3-pole super smoother. It's worth noting that although this only applies to MA0, as the other MAs are derived from it, they will also be smoothed.
In the line below, we define the type and length of MAs for MA2 (and other MAs except MA0). The same type and length are used for MA1 to MA9. It's important to remember that these values should be smaller. For example, if we set 55, it means that MA1 is the average of 55 periods of MA0, MA2 will be 55 periods of MA1, and so on. I encourage trying different combinations of MA types as it can be easily adjusted for ur type of trading. RMA looks quirky.
Moving on to the last line, we define some inputs for the background color:
TSH: The threshold value when using 3-TSHOLD-BGC. It's a good idea to change the chart to a pane below for easier adjustment. The default values are based on EURUSD-5M.
BG_DIR: The value that must be crossed or equal to the MA score if using 4-DIRECT-BGC. There are 10 MAs, so the maximum value is also 10. For example, if you set it to 9, it means that at least 9 MAs must be below/above the price for the script to detect a trend. Higher values are recommended as most of the time, this indicator oscillates either around the maximum or minimum value.
-SUMMARY OF SETTINGS:
L1 - PLOT MAs and general info tooltip
L2 - Select the source for MA0 and type of trend detection.
L3 - Set the type and length of MA0 (important).
L4 - Turn smoothing on/off for MA0 and set the period for super smoothing.
L5 - Set the type and length for the rest of the MAs.
L6 - Set values if using 4-DIRECT or 3-TSHOLD for the trend detection.
-OTHERS:
To see trend indicators, you need to turn off the plotting of MAs (first line), and then choose the variant you want for the background color. This will plot it on the chart below.
Keep in mind that M1 int settings stands for MA0 and MA2 for all of the 9 MAs left.
Yes, it may seem more complicated than it actually is. In a nutshell, these are 10 MAs, and each one after MA0 uses the previous one as its source. Plus few conditions for range detection. rest is mainly plots and colors.
There are tooltips to help you with the parameters.
I hope this will be useful to someone. If you have any ideas, feedback, or spot errors in the code, LET ME KNOW.
Stay tuned for the remaining two scripts using skittles indicators and check out my other scripts.
-ALSO:
I'm always looking for ideas for interesting indicators and strategies that I could code, so if you don't know Pinescript, just message me, and I would be glad to write your own indicator/strategy for free, obviously.
-----May the force of the market be with you, and until we meet again,

Moving Averages + BB & R.VWAP StDev (multi-tf)█ Moving Averages + Bollinger Bands and Rolling Volume Weighted Average Price with Standard Deviation Bands (Multi Timeframe)
Multiple moving averages can be independently applied.
The length , type and timeframe of each moving average are configurable .
The lines and colors are customizable too.
This script can display:
Moving Averages
Bollinger Bands
Rolling VWAP and Standard Deviation Bands
Types of Moving Averages:
Simple Moving Average (SMA)
Exponential Moving Average (EMA)
Smoothed Moving Average (SMMA)
Weighted Moving Average (WMA)
Volume Weighted Moving Average (VWMA)
Least Squares Moving Average (LSMA)
Hull Moving Average (HMA)
Arnaud Legoux Moving Average (ALMA)
█ Moving Average
Moving Averages are price based, lagging (or reactive) indicators that display the average price of a security over a set period of time.
A Moving Average is a good way to gauge momentum as well as to confirm trends, and define areas of support and resistance.
█ Bollinger Bands
Bollinger Bands consist of a band of three lines which are plotted in relation to security prices.
The line in the middle is usually a Simple Moving Average (SMA) set to a period of 20 days (the type of trend line and period can be changed by the trader, a 20 day moving average is by far the most popular).
The SMA then serves as a base for the Upper and Lower Bands which are used as a way to measure volatility by observing the relationship between the Bands and price.
█ Rolling VWAP
The typical VWAP is designed to be used on intraday charts, as it resets at the beginning of the day.
Such VWAPs cannot be used on daily, weekly or monthly charts. Instead, this rolling VWAP uses a time period that automatically adjusts to the chart's timeframe.
You can thus use the rolling VWAP on any chart that includes volume information in its data feed.
Because the rolling VWAP uses a moving window, it does not exhibit the jumpiness of VWAP plots that reset.
Based on the previous script :

10yr, 20yr, 30yr Averages: Month/Month % Change; SeasonalityCalculates 10yr, 20yr and 30yr averages for month/month % change
~shows seasonal tendencies in assets (best in commodities). In above chart: August is a seasonally bullish month for Gold: All the averages agree. And January is the most seasonally bullish month.
~averages represent current month/previous month. i.e. Jan22 average % change represents whole of jan22 / whole of dec21
~designed for daily timeframe only: I found calling monthly data too buggy to work with, and I thought weekly basis may be less precise (though it would certainly reduce calculation time!)
~choose input year, and see the previous 10yrs of monthly % change readings, and previous 10yrs Average, 20yr Average, 30yr Average for the respective month. Labels table is always anchored to input year.
~user inputs: colors | label sizes | decimal places | source expression for averages | year | show/hide various sections
~multi-yr averges always print, i.e if only 10yrs history => 10yr Av = 20yr Av = 30yr Av. 'History Available' label helps here.
Based on my previously publised script: "Month/Month Percentage % Change, Historical; Seasonal Tendency"
Publishing this as seperate indicator because:
~significantly slower to load (around 13 seconds)
~non-premium users may not have the historical bars available to use 20yr or 30yr averages =>> prefer the lite/speedier version
~~tips~~
~after loading, touch the new right scale; then can drag the table as you like and seperate it from price chart
##Debugging/tweaking##
Comment-in the block at the end:
~test/verifify specific array elements elements.
~see the script calculation/load time
~~other ideas ~~
~could tweak the array.slice values in lines 313 - 355 to show the last 3 consecutive 10yr averages instead (i.e. change 0, 10 | 0,20 | 0, 30 to 0, 10 | 10, 20 | 20,30)
~add 40yr average by adding another block to each of the array functions, and tweaking the respective labels after line 313 (though this would likely add another 5 seconds to the load time)
~use alternative method for getting obtaining multi-year values from individual month elements. I used array.avg. You could try array.median, array.mode, array.variance, array.max, array.min (lines 313-355)

coates moving averages (cma)This indicator uses three moving averages:
2 period low simple ma
2 period high simple ma
9 period least squares ma
The trend is determined by the angle of the moving averages, current close relative the the 9 least squares ma (lsm) and the current close relative to the prior two periods high and low.
When there are consecutive closes inside the prior two candles high and low then a range is signaled:
In ranges the buy zone is between the lowest low and the lowest close of the current range. The sell zone is between the highest high and the highest close. The zones are adjusted as long as the new close is within the prior two candles range:
When price closes above the 2 high ma and the 9 lsm then a bull trend is signaled if all moving averages are angled upward (as seen at #4 in the chart above and #1 the chart below ). If the 9 lsm and / or the 2 low ma continue to angle downward, following a close above the 2 high ma and 9 lsm, then a prolonged range or reversal is expected (#2 in the chart below):
During a bull trend the buy zone is between the 2 low ma and the 9 lsm. The profit target is the 2 high ma:
During dip buying opportunities price should resist closing below the 9 lsm. If there is one close below the 9 lsm then it is a canary in the coalmine that tells us to proceed with caution. This will often signal a range, based on the conditions outlined above. To avoid a prolonged range, or reversal, price needs to immediately react in the direction of the prevailing trend:
If the moving averages are angled down and the most recent close is below the 2 low ma and 9 lsm then trend is fully bearish:
During a bear trend the short zone is between the 2 high ma and 9 lsm. The profit target is the 2 low ma:
When the 2 high ma angles down and the 2 low ma angles up while price closes inside both mas then it indicates a cma squeeze:
Volatility is expected in the direction of the breakout following the squeeze. In this situation traps / shakeouts are common. If there is a wick outside the cma, with a close inside, then it indicates a trap / shakeout. If there is a close outside the 2 high / low ma then it signals a breakout.
A trend is considered balanced when the 9 lsm is roughly equidistant from the 2 low and 2 high mas. If the 9 lsm crosses the 2 high or 2 low ma then it signals exhaustion / imbalance.
For a stop loss I use the prior three periods low, for bull trends, and the prior three periods high for bear trends. I would expect other reliable stops, such as the parabolic sar or bill williams fractal, to be effective as well. The default moving averages should be very effective on all timeframes and assets classes, however this indicator was developed for bitcoin with a focus on higher timeframes such as the 4h, daily and weekly.
As with any other technical indicator there will be bad signals. Proceed with caution and never risk more than you are willing to lose.

Awesome Moving AveragesThis script allows you to add up to four simple and exponential moving averages the the chart instead of adding 4 simple moving averages and 4 exponential moving averages individually.
The stronger lines are SMA's and the thinner lines are EMA's.
White - "1st SMA" and "1st EMA"
Green - "2nd SMA" and "2nd EMA"
Blue - "3rd SMA" and "3rd EMA"
Red - "4th SMA" and "4th EMA"
You can modify which moving averages are visible on the chart and also modify the period of the moving averages.
There are four periods which you can edit - each period applies to a pair of moving averages (a pair of SMA and EMA). For example: "1st MA Length" option applies to "1st SMA" and "1st EMA" etc.
ibb.co
In addition to that Awesome Moving Averages script allows you to keep the daily moving averages resolution on intraday charts.
For example - here we have only "1st SMA" and "1st EMA" enabled and we are viewing a daily chart:
Now if we have "Keep Daily MA Resolution On Intraday Periods" option enabled we would see the daily moving averages (SMA and EMA) on intraday periods. Here we are viewing a 4h chart:
If you disable this option you would see the moving averages on intraday charts with the intraday MA lengths as you expect:
"Visible MA's On Intraday Periods" option allows you to choose which MA's you would like to be visible on intraday charts if the "Keep Daily MA Resolution On Intraday Periods" option is enabled.
If you have any thoughts or ideas on how to improve the "Awesome Moving Averages" script then let me know!

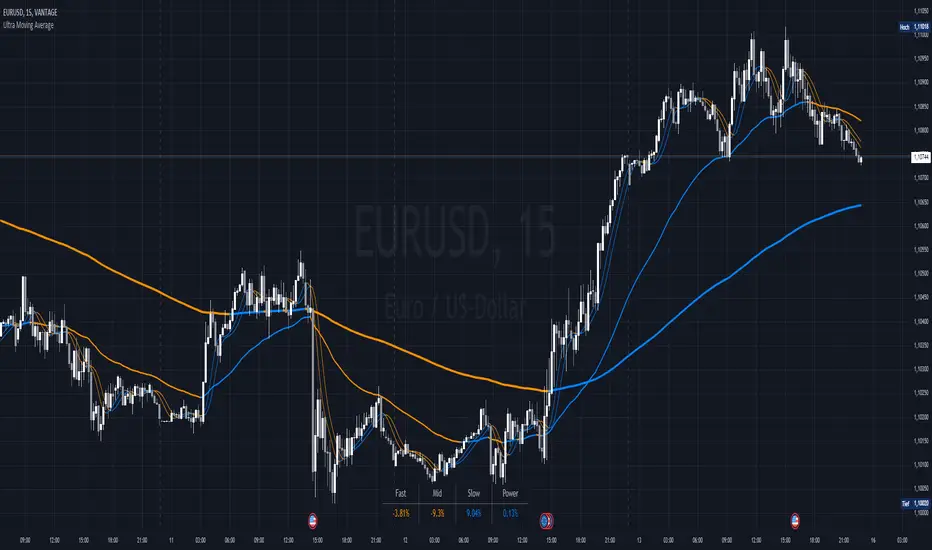
Ultra Moving AverageThe Ultra Moving Average is a versatile technical indicator that combines various types of moving averages to analyze trends, providing multi-timeframe insights for traders. It offers four customizable moving averages and a trend strength table for enhanced decision-making.
Introduction
The Ultra Moving Average indicator is a powerful tool designed to help traders track market trends by offering a combination of four distinct moving averages. With flexible customization options, users can apply different types of moving averages like SMA, EMA, TEMA, and many more, across various timeframes. Additionally, it provides trend strength analysis through an intuitive visual table, helping traders quickly identify market conditions.
Detailed Description
.........
Moving Averages
Each of the four moving averages is independently configurable. You can select the timeframe, type, length, color, and width to match your trading strategy.
The types of moving averages range from traditional ones like the Simple Moving Average (SMA) to advanced ones like the Double Expotential Moving Average (DEMA) or the Triple Exponential Moving Average (TEMA) or the Recursive Moving Average (RMA) or the Weigthend Moving Average (WMA) or the Volume Weigthend Moving Average (VWMA) or Hull Moving Average (HMA).
Very Special ones are the Triple Weigthend Moving Average (TWMA) wich created RedKTrader .
I created the Multi Weigthend Moving Average (MWMA) wich is a simple signal line to the TWMA.
.....
Trend Visualization
The indicator uses color-coding to visually represent whether the price is in an uptrend or downtrend. Bullish trends are highlighted in one color, while bearish trends appear in another, making it easy to interpret.
.....
Trend Strength Table
One of the unique features of the Ultra Moving Average is the trend strength table at the bottom of the chart. This table breaks down the strength of the fast, mid, and slow moving averages, displaying them as percentages. It also shows the overall "trend power," which helps assess how strong or weak the current trend is.
You have the option to calculate trends using live data or the previous bar's data, offering flexibility in how the indicator reacts to market changes. This can help traders make more responsive decisions based on real-time trends.
The table displays trend strength across three timeframes Fast, Mid, and Slow by calculating the percentage difference between the price and each of the moving averages (MA1, MA3, MA4).
The Power row shows the average of these percentages, representing overall trend strength.
The percentages are calculated relative to their maximum values in history (limited by TradingView subscription), providing insight into the trend's strength for each timeframe.
.........
Overall, the Ultra Moving Average indicator is a comprehensive tool that combines multiple moving average types and advanced trend analysis, helping traders identify market direction and strength at a glance. With its intuitive visualization and flexible settings, it's suited for both beginner and experienced traders.
Special Thanks
I use the TWMA-Function created from RedKTrader to smooth the values.
Special thanks to him for creating and sharing this function!
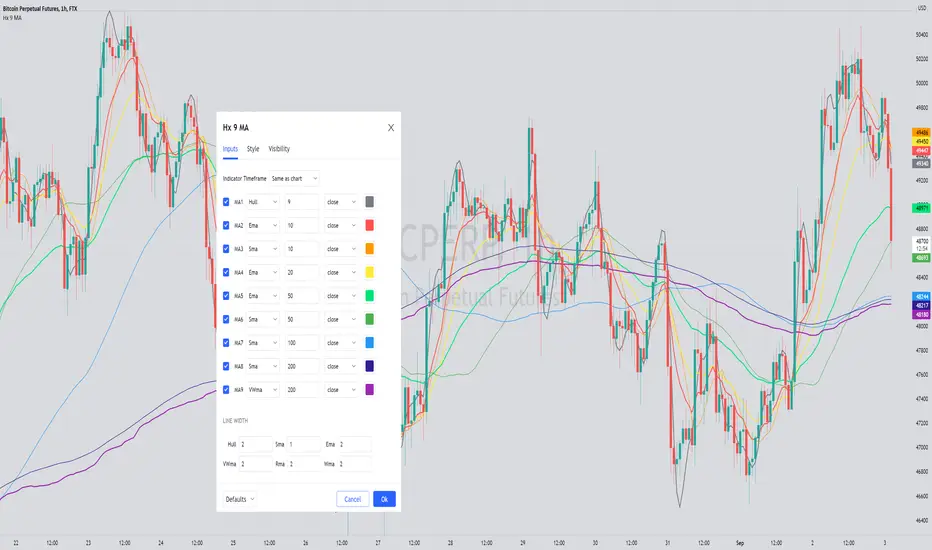
Hx 9 Moving AveragesThis script is designed to handle and provide quick and easy access to up to 9 different moving averages in one indicator and one tab.
Basically, it leverages the 'inline' and 'group' arguments of the 'input' function to provide you with a simple and straightforward way to:
- define your favorite moving averages by choosing type, length, source and color in the same tab and
- decide which moving averages to display in one click on a checkbox.
I do not like to have to select the color of an indicator in another tab. So, I put everything in the Inputs tab.
In addition, I like to "linewidth code" my moving averages so that a sma has a different thickness than an ema for example.
To do so, just define the line width that you want to associate with a moving average type in the "LINE WIDTH" section.
Once parameters are set to your liking, just check / uncheck the moving averages you want to display / hide (and save your settings as default).
This script handles 9 different moving averages and implements sma, wma, ema, vwma, rma (RSI) and hma (Hull).
It can easily be modified to change the number of available moving averages or include other types of moving averages.
The default settings provide an example of commonly used moving averages with associated colors ranked from Hot (more nervous) to Cold (less nervous) with the exception of Hull moving average displayed in gray.
These settings are just an example and are NOT meant to be used as a trading system! DYOR!
Hope it will be useful.
Enjoy and please let me know what you think in the comments.
My exponential moving averages - Suri's EMAs
It's not an indication of anything here, it's just part of my operating in a simple and summarized way, I hope it helps someone.
Suri's EMA's indicator is nothing more than a set of exponential moving averages (EMA). They are 12, 26, 50 and 200.
Attention to the use of the indicator, it is just an INDICATOR, it should not be taken as the main point of your entry, but to guide you in your entries in favor of the trend, whether intra-day or swing.
Created for clear, monochrome screens. Make your adjustments.
Color condition, candles turn green when their close is above EMA 12 and 26.
Color condition, candles turn red when their close is below EMA 12 and 26.
Condition for colors, MME12,26,50 and 200 will turn green with price working above it.
Condition for colors, MME12, 26, 50 and 200 will turn red with price working below it.
Indication for use in time-frames = 5m, 15m, 60m, 240m. (higher hit rates)
How to use the indicator, MME 12 and 26, are the most important and led you to more entries, but we should not only consider them, we have to analyze the whole context to then make a decision.
Indicator was nicknamed by me by "Pullback Pick", it works in a simple way:
In an uptrend or downtrend, the price usually tends to return in the averages or the averages go up to the price, that being said, it is easy to observe that where the price returns would be a pullback from the last movement, so when returning to the averages, the candle that shows strength in favor of this trend, in the EMA's region, becomes a possible entry, with its stop below or above this "pullback" formed, because the stop goes there, because usually when the price returns on the EMAs they tend to to hold and replay the price in favor of the trend.
My observations:
I like to enter when the price returns to the averages smoothly, without much movement, when it touches the average 12 or 26 it is an entry, but an entry without confirmation, the gain is greater, but the chance of being stopped is higher, I like it when the price is close to the 12 and 26 averages and leaves a small candle or doji on this pullback, my entry goes to the breakout of this candle and the stop behind the candle.
THERE IS NO MIRACLE, THERE IS NO 100% HIT RATE, SO USE STOP.
Aaaaaaaaaa I was forgetting.... and the target???
As it is a trend following setup, it is cool to leave a trailing stop or update the stop as new bottoms or tops are formed.
Targeting in 1v1 is good, setup pays a lot!
Targeting in 2x1 is too good, setup pays well!
Making a target in 3x1 is more than good, setup pays sometimes, then from now on, it depends on where you are entering this "PULLBACK", if it is in the first wave, in the second, if you are going to lateralize, the market is SOVEREIGN, put in the pocket that is no longer on the market, oh it's yours!
That's it, doubts, send it there, suggestion, opinion, whatever you want.
Added a symbol at the crossing of the 12 and 26 moving averages.
I am so sorry, but i dont speak english, use google translate.
Português.
Não se trata de indicação de nada aqui, é apenas parte do meu operacional de maneira simples e resumida, espero que ajude alguém.
Indicador Suri's EMA's, nada mais é do que um conjunto de médias móveis exponenciais(MME). São elas 12, 26, 50 e 200.
Atenção para o uso do indicador, ele é apenas um INDICADOR, não deve ser tomado como o ponto principal de sua entrada, mas sim de te balizar nas suas entradas a favor da tendência, seja ela intra-day ou swing.
Criado para telas claras e monocromáticas. Façam seus ajustes.
Condição para as cores, candles ficam verdes quando o fechamento dele é acima das MME 12 e 26.
Condição para as cores, candles ficam vermelhos quando o fechamento dele é abaixo das MME 12 e 26.
Condição para as cores, MME12,26,50 e 200 ficará verde com preço trabalhando acima dela.
Condição para as cores, MME12, 26, 50 e 200 ficará vermelho com preço trabalhando abaixo dela.
Indicação para uso nos time-frame = 5m, 15m, 60m, 240m.(taxas de acerto maior)
Como utilizar o indicador, MME 12 e 26, são as mais importantes e te levaram a mais entradas, porém não devemos levar apenas elas em consideração, temos que analisar todo o contexto para então tomar decisão.
Indicador foi apelidado por mim por " Pega Pullback", ele funciona de uma maneira simples:
Em tendência de alta ou de baixa, o preço geralmente tende a retornar nas médias ou as médias irem até o preço, dito isso é fácil de se observar que onde o preço retorna seria um pullback do último movimento, portanto ao retornar nas médias, o candle que mostra força a favor dessa tendência, na região das EMA's, se torna uma possível entrada, com o seu stop abaixo ou acima desse "pullback" formado, porque o stop vai nesse local, porque geralmente quando o preço retorna nas EMAs elas tendem a segurar e voltar a jogar o preço a favor da tendência.
Minhas observações:
Eu gosto de entrar quando o preço retorna nas médias de maneira suave, sem muito movimento, quando toca na média 12 ou 26 é uma entrada, porém uma entrada sem confirmação, o ganho é maior, porém a chance de ser stopado é mais alta, eu gosto quando o preço fica perto das médias 12 e 26 e deixa um candle pequeno ou doji nesse pullback, minha entrada vai no rompimento desse candle e o stop atrás do candle.
Não existe MILAGRE, NÃO EXISTE TAXA DE ACERTO DE 100%, POR ISSO USE STOP.
Aaaaaaaaaa ia me esquecendo.... e o alvo???
Por ser um setup seguidor de tendência, o legal é deixar um trailing stop ou ir atualizando o stop conforme novos fundos ou topos são formados.
Realizar alvo no 1x1 é bom, setup paga muito!
Realizar alvo no 2x1 é bom de mais, setup paga bem!
Realizar alvo no 3x1 é mais do que bom, setup paga as vezes, ai daqui pra frente, depende de onde você está entrando nesse "PULLBACK", se é na primeira onda, na segunda, se vai lateralizar, o mercado é SOBERANO, põe no bolso que não é mais do mercado, ai é teu!
É isso, dúvidas, manda ai, sugestão, opinião, o que quiser.
Adicionado um símbolo no cruzamento das médias móveis 12 e 26.
