Baseline Deviation Oscillator [Alpha Extract]A sophisticated normalized oscillator system that measures price deviation from a customizable moving average baseline using ATR-based scaling and dynamic threshold adaptation. Utilizing advanced HL median filtering and multi-timeframe threshold calculations, this indicator delivers institutional-grade overbought/oversold detection with automatic zone adjustment based on recent oscillator extremes. The system's flexible baseline architecture supports six different moving average types while maintaining consistent ATR normalization for reliable signal generation across varying market volatility conditions.
🔶 Advanced Baseline Construction Framework
Implements flexible moving average architecture supporting EMA, RMA, SMA, WMA, HMA, and TEMA calculations with configurable source selection for optimal baseline customization. The system applies HL median filtering to the raw baseline for exceptional smoothing and outlier resistance, creating ultra-stable trend reference levels suitable for precise deviation measurement.
// Flexible Baseline MA System
ma(src, length, type) =>
if type == "EMA"
ta.ema(src, length)
else if type == "TEMA"
ema1 = ta.ema(src, length)
ema2 = ta.ema(ema1, length)
ema3 = ta.ema(ema2, length)
3 * ema1 - 3 * ema2 + ema3
// Baseline with HL Median Smoothing
Baseline_Raw = ma(src, MA_Length, MA_Type)
Baseline = hlMedian(Baseline_Raw, HL_Filter_Length)
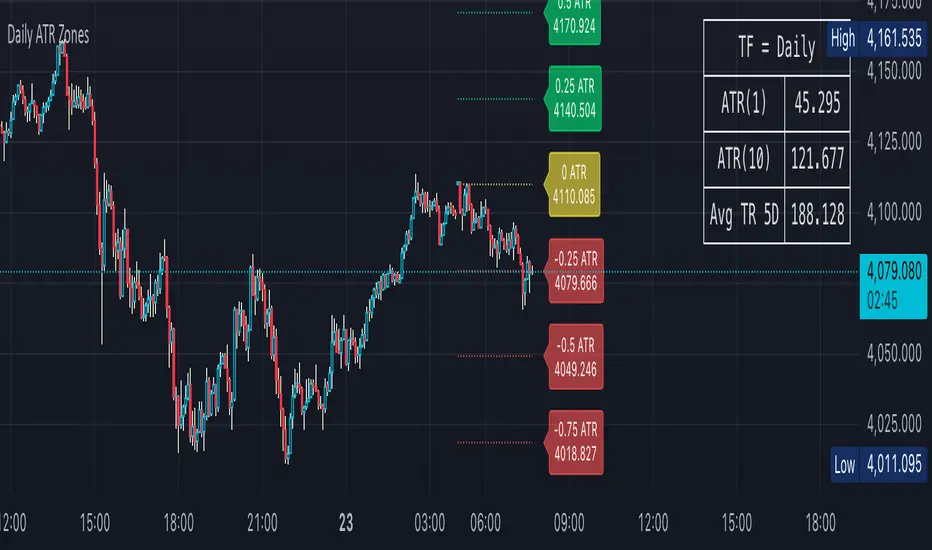
🔶 ATR Normalization Engine
Features sophisticated ATR-based scaling methodology that normalizes price deviations relative to current volatility conditions, ensuring consistent oscillator readings across different market regimes. The system calculates ATR bands around the baseline and uses half the band width as the normalization factor for volatility-adjusted deviation measurement.
🔶 Dynamic Threshold Adaptation System
Implements intelligent threshold calculation using rolling window analysis of oscillator extremes with configurable smoothing and expansion parameters. The system identifies peak and trough levels over dynamic windows, applies EMA smoothing, and adds expansion factors to create adaptive overbought/oversold zones that adjust to changing market conditions.
1D
3D
1W
🔶 Multi-Source Configuration Architecture
Provides comprehensive source selection including Close, Open, HL2, HLC3, and OHLC4 options for baseline calculation, enabling traders to optimize oscillator behavior for specific trading styles. The flexible source system allows adaptation to different market characteristics while maintaining consistent ATR normalization methodology.
🔶 Signal Generation Framework
Generates bounce signals when oscillator crosses back through dynamic thresholds and zero-line crossover signals for trend confirmation. The system identifies both standard threshold bounces and extreme zone bounces with distinct alert conditions for comprehensive reversal and continuation pattern detection.
Bull_Bounce = ta.crossover(OSC, -Active_Lower) or
ta.crossover(OSC, -Active_Lower_Extreme)
Bear_Bounce = ta.crossunder(OSC, Active_Upper) or
ta.crossunder(OSC, Active_Upper_Extreme)
// Zero Line Signals
Zero_Cross_Up = ta.crossover(OSC, 0)
Zero_Cross_Down = ta.crossunder(OSC, 0)
🔶 Enhanced Visual Architecture
Provides color-coded oscillator line with bullish/bearish dynamic coloring, signal line overlay for trend confirmation, and optional cloud fills between oscillator and signal. The system includes gradient zone fills for overbought/oversold regions with configurable transparency and threshold level visualization with automatic label generation.
snapshot
🔶 HL Median Filter Integration
Features advanced high-low median filtering identical to DEMA Flow for exceptional baseline smoothing without lag introduction. The system constructs rolling windows of baseline values, performs median extraction for both odd and even window lengths, and eliminates outliers for ultra-clean deviation measurement baseline.
🔶 Comprehensive Alert System
Implements multi-tier alert framework covering bullish bounces from oversold zones, bearish bounces from overbought zones, and zero-line crossovers in both directions. The system provides real-time notifications for critical oscillator events with customizable message templates for automated trading integration.
🔶 Performance Optimization Framework
Utilizes efficient calculation methods with optimized array management for median filtering and minimal computational overhead for real-time oscillator updates. The system includes intelligent null value handling and automatic scale factor protection to prevent division errors during extreme market conditions.
🔶 Why Choose Baseline Deviation Oscillator ?
This indicator delivers sophisticated normalized oscillator analysis through flexible baseline architecture and dynamic threshold adaptation. Unlike traditional oscillators with fixed levels, the BDO automatically adjusts overbought/oversold zones based on recent oscillator behavior while maintaining consistent ATR normalization for reliable cross-market and cross-timeframe comparison. The system's combination of multiple MA type support, HL median filtering, and intelligent zone expansion makes it essential for traders seeking adaptive momentum analysis with reduced false signals and comprehensive reversal detection across cryptocurrency, forex, and equity markets.
Indicador Pine Script®