ADW - Volatility MapThe ADW - Volatility Map script is a tool for traders to measure and visualize the volatility of a specific asset. It uses both the Average True Range (ATR) and True Range (TR) values in combination with the Commodity Channel Index (CCI) to provide a comprehensive map of the market's volatility.
Average True Range (ATR) : ATR is a measure of market volatility. It measures the average of true price ranges over a time period. In this script, we use it to calculate the ATR-CCI which gives us a more precise measure of volatility.
True Range (TR) : TR is the greatest distance the price moved during a period. It is used in this script to calculate the TR-CCI, adding another level of detail to our volatility measurement.
Commodity Channel Index (CCI) : CCI is a versatile indicator that can be used to identify a new trend or warn of extreme conditions. We use it to scale and compare the ATR and TR values, hence providing a relative measure of volatility.
The script interprets the CCI values and provides four different conditions for both ATR and TR:
Is Low (CCI < 0)
Is High (CCI > 0)
Is Extremely Low (CCI <= -100)
Is Extremely High (CCI >= 100)
The interpretation of these conditions is displayed on the chart using colour highlighting. When the ATR or TR are low, high, extremely low, or extremely high, the script fills the chart accordingly.
In addition, the script has an option `awaitBarConfirmation` set at the beginning. If this is true, the script will only display indicators for fully formed bars, ensuring that the indicators you see are based on confirmed information.
Note: The colours for different conditions can be customized at the beginning of the script, allowing you to personalize the visual output to match your preferences.
This script is designed to provide a visually clear and immediate understanding of the market's volatility. Use it to enhance your decision-making process and adapt your trading strategy to the current market conditions.
Pesquisar nos scripts por "atr"

TheATR™: Volatility Extremes (VolEx)Volatility is a crucial aspect of financial markets that is closely monitored by traders and investors alike. The traditional Average True Range (ATR) oscillator is a widely used technical indicator for measuring volatility in financial markets. However, there are limitations to the ATR oscillator, as it does not account for changing market conditions and may not adequately reflect extreme price movements. To address these limitations, TheATR has developed the VolEx indicator, which aims to identify extremes in the ATR oscillator by building dynamic thresholds using either a 'percentage' or 'standard deviation' based comparison with the value of the ATR.
The VolEx indicator utilizes a dynamic approach to measure volatility by considering the current level of the ATR oscillator relative to the dynamically generated thresholds. The dynamic thresholds are calculated based on the current ATR value and the chosen method of comparison (either 'percentage' or 'standard deviation'). If the ATR value exceeds the upper dynamic threshold, the market is experiencing high volatility, while a value below the lower dynamic threshold indicates low volatility.
The VolEx indicator offers several advantages over traditional volatility indicators, such as the ATR oscillator. First, it takes into account the changing market conditions and adjusts the thresholds accordingly. Second, it offers flexibility in the choice of the comparison method, allowing traders to tailor the indicator to their specific trading strategies. Finally, it provides clear signals for identifying extremes in volatility, which can be used to inform trading decisions.
In summary, the VolEx indicator developed by TheATR is a dynamic and flexible technical indicator that offers a robust approach to measuring volatility in financial markets. By utilizing dynamic thresholds and allowing for different comparison methods, the VolEx indicator provides a valuable tool for traders and investors seeking to identify extremes in market volatility..
NOTE: It is important to note that volatility, as measured by the VolEx indicator, does not provide any directional bias for the market movement. Rather, it simply indicates the degree to which the market is moving, regardless of direction. Traders and investors must use other technical or fundamental analysis tools to determine the direction of the market and make informed trading decisions based on their individual strategies and risk tolerance.

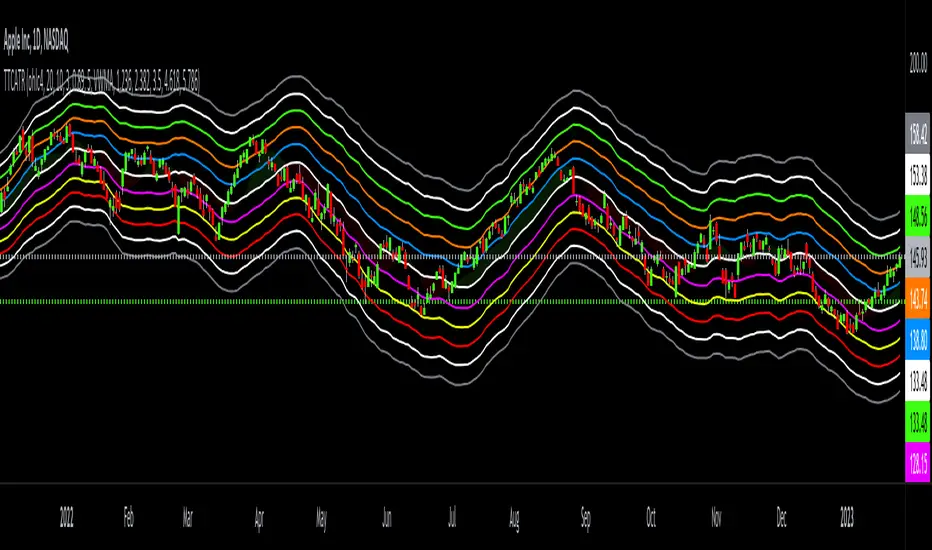
Triangular Trend Channel ATRTTCATR: Triangular Trend Channel ATR is a script to dynamically create a trend channel. It uses Moving Average & the Average True Range function to calculate support and resistance levels automatically.
The MA choices available are:
SMA = simple moving average
EMA = exponentially weighted moving average
RMA = moving average used in RSI
WMA = weighted moving average
VWMA = volume weighted moving average
VWAP = volume weighted average price
HMA = Hull moving average
SWMA = symmetrically weighted moving average
ALMA = Arnaud Legoux moving average
The default setting inputs are:
source = OHLC4
MA length = 20
MA signal = 10
ATR Multiply = 3
ALMA offset = 0.89
ALMA sigma = 5
Moving average type = VWMA
Level 1 ATR = 1.236
Level 2 ATR = 2.382
Level 3 ATR = 3.5
Level 4 ATR = 4.618
Level 5 ATR = 5.786
The default setting colors are:
Top = gray
R4 = white
R3 = green
R2 = orange
R1 = blue
pivot = white
(track pivot line = bullish is green, bearish is red)
S1 = purple
S2 = yellow
S3 = red
S4 = white
Bottom = gray
* This script uses altered pieces of code from my @Options360 TTC: Triangular Trend Channel and @TradingView "Intrabar Efficiency Ratio indicator". *
(JS) Checklist SignalsWhat if I told you that you could use over 10 indicators at once without having a single one of them on you chart? Enter the Checklist Signals. This is probably the most complex yet simple indicator I've ever done.
What you get is 6 rows (if you want them all) of labels that hover at the top of your screen with a ton of extremely useful information. I will go down the list of options in the indicator settings and explain how it all works.
So the label placement is based on ATR. You choose your X Axis and Y Axis starting point then adjust the lookback period. Default lookback is 600 bars. What that means is, the indicator finds the highest high in the last 600 bars, then begins to place the labels above that zone based on the ATR of the chart. Different timeframes require very different combinations so it's all customizable. Sometimes if labels overlap you need to adjust the X Axis starting point, or the spread on either axis.
The next set of options allows you to decide what you'd prefer to be set on or off. Let's start with ATR and VWAP. I have added bands for both of these. When price is below the mean (which is the 21 ema by default), then the labels show you the next 5 standard deviations of ATR going down. When under one of these levels the label turns red. The opposite is true when above the mean and in those instances the labels will be green. It is the same with the VWAP, though instead of using the mean we use the daily VWAP as the starting point. If you choose to have levels switched on then you can see the actual values of each standard deviation level. Down lower in the options you can change the resolution and source used for VWAP.
The next option is "Trending". This creates a moving average using the length of the Trending Lookback Period (default is 5) and then tells you using arrows in the label which direction the trend of the indicator is going.
The next area let's you specify the information you receive in the Squeeze labels. By default all options are one - and this tells you if there's a Squeeze, what type of Squeeze there is, and how many bars the Squeeze has been building up or since it fired. These labels are color coded to correspond with the Squeeze type as well.
Then we get to another one of my indicators, the Ballista. One of the main signals is the "Inverted Squeeze" where the short term momentum inverts against the long term momentum. Here I have the distance between the two oscillators in the first label, and then the second label tells you if there's an Inverted Squeeze signal, if there's potential entry, confirmed entry, or how many bars its been since the last entry signal.
The next feature is off by default, but it will add arrows to your chart based on a simple lower highs and higher lows signals. Turning arrows on will place them right on your chart above or below each bar.
The rest of it is customizable settings of all the other indicators that are shown. Now looking at the labels themselves, starting in the top left corner:
First Row-
ADX + DMI: These labels show the ADX, DI+, & DI- values in each label. Whenever the DI+ or DI- is above the other then their respective label will light up. Also, when the ADX is above 20 (confirming the trend) it lights up in the same color as well.
Squeeze: I described how this worked above, the labels tell you if there's a Squeeze, how long there's been one, and how long since it fired, all while also changing to color of the associated Squeeze type.
Second Row -
Stacked EMAs: The top label looks at the EMA values using the numbers of the Fibonacci sequence. It looks at the EMA 8, 21, 34, 55, 89, & 233 and tells you if they're all stacked in the same direction (Stacked Bear meaning they're all crossed down in order, Stacked Bull meaning they're all crossed up in order). If the EMAs are all stacked but 1 or 2 it will say Stacked -1 or Stacked -2. When they're all over the place it will say they aren't stacked at all.
BB%: This tells you the value of the Bollinger Band %. If this is negative then you know that price is currently below the lower Bollinger Band, and if it is above 100% it is above the upper Bollinger Band.
RSI: This tells you the value of the RSI and the label changes colors based on the value.
Stoch: This tells you the Stochastic value and changes colors based on the value, same as the RSI.
Third Row -
The Mean: This tells you the numerical value of whatever you have the mean set as (21 ema by default). The label changes colors based on price being above or below the mean.
One ATR: This was something I added for those looking to plan their trades out. This tells you the value of one ATR so you can have a better idea of how to plan your trades based on this distance.
VIX: This tells you the current value of the VIX, and color changes based on being green or red on the day.
Ballista: I explained this above, it tells you the distance between the two oscillators and changes colors based on the trend being above or below 0. When there's an Inverted Squeeze this label is gray.
Inverted Squeeze: This label tells you if there's an inverted squeeze as well as if it is showing an entry or how many bars since the last entry signal. This label turns fuchsia on a bear signal and lime on a bull signal.
Fourth Row -
ATR Bands: As I explained above, this plots each standard deviation using ATR and changes colors based on price's relationship to each one.
Fifth Row -
VWAP: The three labels here show the daily, weekly, and monthly VWAP values, and color changes based on price's relationship to each one.
Sixth Row -
VWAP Bands: These are the standard deviation levels of the VWAP resolution of your choosing (as explained above), and just as the others, colors change based on price's relationship to each one.
I thought this was a really cool indicator that could be used for people like me who like knowing the right information, but HATE having their charts clustered with a ton of stuff. Hope you all like it, enjoy!

Jeges JigsThis is a combination of all my old indicators, with an added feature for trend lines (inspiration for this came from Wedge Maker script thanks to veryfid, I hope he doesn't mind).
This script looks for a period with increased volatility , as measured by ATR ( Average True Range ), then it looks for a high or a low in that area.
When price is above EMA (400 is default, can be changed), it looks for the highs and adds multiples of ATR to the high. Default values for multipliers are 3,9 and 27, meaning that the script will show 3xATR level above the high, 9xATR above the high and 27xATR above the high.
When price is below EMA it looks for the lows and subtracts multiples of ATR from the low.The script will show 3xATR level below the low, 9xATR below the low and 27xATR below the low.
Multipliers values can be changed as well, making it a versatile tool that shows potential levels of suppport/resistance based on the volatility .
Possible use cases:
Breakout trading, when price crosses a certain level, it may show potential profit targets for trades opened at a breakout.
Stoploss helper. Many traders use ATR for their stoplosses, 1 ATR below the swing low for long trades and 1 ATR above the swing high for short trades are common values used by many traders. In this case, the Lookback value comes handy, if we want to look maybe at a more recent value for swing high/low point.
It highlights ATR peaks, it also displays Bollinger bands of SMA400 (or Ema), breakouts for upper/lower bands.
Another thing you get is Parabolic SAR and Zigzag based on SAR.
Baseline-C [ID: AC-P]The "AC-P" version of jiehonglim's NNFX Baseline script is my personal customized version of the NNFX Baseline concept as part of the NNFX Algorithm stack/structure for 1D Trend Trading for Forex. Everget's JMA implementation is used for the baseline smoothing method, with optional ATR bands at 1.0x and 1.5x from the baseline.
NNFX = No Nonsense Forex
Baseline = Component of the NNFX Algorithm that consists of a single moving average
Baseline ---> Meant to be used in conjunction with ATR/C1/C2/Vol Indicator/Exit Indicator as per NNFX Algorithm setup/structure. C1 is 1st Confirmation Indicator, C2 is 2nd Confirmation Indicator.
JMA (Jurik Moving Average) is used for the baseline and slow baseline.
A slow baseline option is included, but disabled by default.
The faint orange/purple lines are 1.0x/1.5x ATR from the Baseline, and are what I use as potential TP/SL targets or to evaluate when to stay out of a trade (chop/missed entry/exit/other/ATR breach), depending on the trade setup (in conjunction with C1/C2/Vol Indicator/Exit Indicator)
This script is heavily based upon jiehonglim's NNFX Baseline script for signaling, barcoloring, and ATR.
SSL Channel option included but disabled by default (Erwinbeckers SSL component)
POC (Point of Control) from Volume Profile is included/enabled by default for both the current timeframe and 12HR timeframe
03.freeman's InfoPanel Divergence Indicator was used a reference to replace the current/previous ATR information infopanel/info draw from jiehonglim's script. I'm not sure whether I like the previous way ATR info was displayed vs how I have it currently, but it's something that is completely optional:
Specifically: I am tuning this baseline/indicator for 1D trading as part of the NNFX system, for Forex.
DO NOT USE THIS INDICATOR WITHOUT PROPER TUNING/ADJUSTMENT for your timeframe and asset class.
Note about lack of alerts:
Alerts for baseline crosses (and other crosses) have been purposefully omitted for this version upon initial publication. While getting alerts for baseline crosses under certain conditions/filtered conditions that eliminate low-importance signals and crossover whipsaw would be great, it's something I'm still looking into.
SPECIFICALLY: There are entry, exit, take profit, and continuation signal components in relation to the Baseline to the rest of the NNFX Algorithm stack (ATR/C1/C2/Vol Indicator/Exit Indicator), including but limited to the "1 candle rule" and the "7 candle rule" as per NNFX.
Implementing alerts that are significant that also factor in these rules while reducing alert spam/false signals would be ideal, but it's also the HTF/Daily chart - visually, entry/exit/continuation signal alignment is easy to spot when trading 1D - alerts may be redundant/a pursuit in diminishing returns (for now).
//-------------------------------------------------------------------
// Acknowledgements/Reference:
// jiehonglim, NNFX Baseline Script - Moving Averages
//
// Fractured, Many Moving Averages
//
// everget, Jurik Moving Average/JMA
//
// 03.freeman, InfoPanel Divergence Indicator
//
// Ggqmna Volume stops
//
// Libertus RSI Divs
//
// ChrisMoody, CM_Price-Action-Bars-Price Patterns That Work
//
// Erwinbeckers SSL Channel
//

Manual Back Test LinesI created this indicator to primarily manually test other indicators in replay mode.
To use this indicator generally you will:
Select trade type: long or short
Enter your ATR (enter the actual ATR). The indicator will then calculate and plot your SL and targets based on your values
Default Stop Loss is ATR * 1.5
Default Target 1 is ATR * 1.5
Default Target 2 is ATR * 3
Using this indicator on Replay mode is great. What you do is go back in time. Hit play and as the indicator(s) you use provide signals pause.
Pull up options:
Select trade type
Update ATR value
Change date to entry date. Typically if you are trading off the daily timeframe you are going to wait for your current day candle to close to provide signal. That would mean your entry would be on the next day.
Click play and watch, track and record how trade unfolds.
Future updates:
I'd like to be able to have some way to click one button and have it fire that enter trade right now on chart. Also I'm working on figuring out how to calculate the ATR on the entry date so that isn't required to be entered.
Finally, I'd like to have some auto calculation on when targets and SL are hit. I have this partially done but it's more important that I use this indicator than spend time or funds to update it to do that. But I do plan on updating.

MDZ Strategy v4.2 - Multi-factor trend strategyWhat This Strategy Does
MDZ (Momentum Divergence Zones) v4.2 is a trend-following strategy that enters long positions when multiple momentum and trend indicators align. It's designed for swing trading on higher timeframes (2H-4H) and uses ATR-based position management.
The strategy waits for strong trend confirmation before entry, requiring agreement across five different filters. This reduces trade frequency but aims to improve signal quality.
Entry Logic
A long entry triggers when ALL of the following conditions are true:
1. EMA Stack (Trend Structure)
Price > EMA 20 > EMA 50 > EMA 200
This "stacked" alignment indicates a strong established uptrend
2. RSI Filter (Momentum Window)
RSI between 45-75 (default)
Confirms momentum without entering overbought territory
3. ADX Filter (Trend Strength)
ADX > 20 (default)
Ensures the trend has sufficient strength, not a ranging market
4. MACD Confirmation
MACD line above signal line
Histogram increasing (momentum accelerating)
5. Directional Movement
+DI > -DI
Confirms bullish directional pressure
Exit Logic
Positions are managed with ATR-based levels:
ParameterDefaultDescriptionStop Loss2.5 × ATRBelow entry priceTake Profit6.0 × ATRAbove entry priceTrailing Stop2.0 × ATROptional, activates after entry
The default configuration produces a 1:2.4 risk-reward ratio.
Presets
The strategy includes optimized presets based on historical testing:
PresetTimeframeNotes1H Standard1 HourMore frequent signals2H Low DD2 HourConservative settings3H Optimized3 HourBalanced approach4H Swing4 HourWider stops for swing tradesCustomAnyFull manual control
Select "Custom" to adjust all parameters manually.
Inputs Explained
EMAs
Fast EMA (20): Short-term trend
Slow EMA (50): Medium-term trend
Trend EMA (200): Long-term trend filter
RSI
Length: Lookback period (default 14)
Min/Max: Entry window to avoid extremes
ADX
Min ADX: Minimum trend strength threshold
Risk
Stop Loss ATR: Multiplier for stop distance
Take Profit ATR: Multiplier for target distance
Trail ATR: Trailing stop distance (if enabled)
Session (Optional)
Filter entries by time of day
Recommended OFF for 3H+ timeframes
What's Displayed
Info Panel (Top Right)
Current preset
Trend status (Strong/Wait)
ADX, RSI, MACD readings
Position status
Risk-reward ratio
Stats Panel (Top Left)
Net P&L %
Total trades
Win rate
Profit factor
Maximum drawdown
Chart
EMA lines (20 blue, 50 orange, 200 purple)
Green background during strong uptrend
Triangle markers on entry signals
Important Notes
⚠️ This is a long-only strategy. It does not take short positions.
⚠️ Historical results do not guarantee future performance. Backtests show what would have happened in the past under specific conditions. Markets change, and any strategy can experience drawdowns or extended losing periods.
⚠️ Risk management is your responsibility. The default settings risk 100% of equity per trade for backtesting purposes. In live trading, appropriate position sizing based on your risk tolerance is essential.
⚠️ Slippage and commissions matter. The backtest includes 0.02% commission and 1 tick slippage, but actual execution costs vary by broker and market conditions.
Best Practices
Test on your specific market — Results vary significantly across different instruments
Use appropriate position sizing — Never risk more than you can afford to lose
Combine with your own analysis — No indicator replaces understanding market context
Paper trade first — Validate the strategy matches your trading style before risking capital
Alerts
Two alerts are available:
MDZ Long Entry: Fires when all entry conditions are met
Uptrend Started: Fires when EMA stack first aligns bullish
Methodology
This strategy is based on the principle that trend continuation has better odds than reversal when multiple timeframe momentum indicators agree. By requiring five independent confirmations, it filters out weak setups at the cost of fewer total signals.
The ATR-based exits adapt to current volatility rather than using fixed pip/point targets, which helps the strategy adjust to different market conditions.
Questions? Leave a comment below.

VIOP Scalping - ATR SNIPERVIOP Scalping – ATR SNIPER is a momentum-based scalping strategy designed to capture short, high-probability moves while keeping risk strictly defined using ATR-based stop-loss and fixed risk/reward targets. The strategy trades only when trend direction, momentum, and strength are aligned.
This script is provided for educational and testing purposes only. It does not guarantee profitability and must be used with proper risk management.
Core Idea
Trade in the direction of the dominant trend, confirm momentum acceleration, and manage risk using ATR-based dynamic stops and targets.
How the Strategy Works
The main trend is defined using a Weighted Moving Average (WMA).
Momentum is measured by the distance and direction between a fast EMA and a slow EMA.
Trend strength is confirmed using ADX.
RSI is used as a filter to avoid weak or overextended market conditions.
Entries are blocked during a predefined no-trade time window to avoid high-noise periods.
Long Entry Conditions
Fast EMA is above Slow EMA and the EMA difference is greater than the minimum threshold.
EMA momentum is increasing compared to the previous bar.
RSI is within the user-defined long range.
Current close is higher than the previous close.
ADX is above the minimum strength threshold.
Price is above the WMA trend line.
The current bar is not inside the no-trade session.
Short Entry Conditions
Fast EMA is below Slow EMA and the EMA difference is below the negative threshold.
Bearish EMA momentum is increasing.
RSI is within the user-defined short range.
Current close is lower than the previous close.
ADX is above the minimum strength threshold.
Price is below the WMA trend line.
The current bar is not inside the no-trade session.
Risk Management – ATR Sniper Logic
Stop-loss distance is calculated as ATR multiplied by the ATR Multiplier.
Take-profit distance is calculated using the defined Risk/Reward ratio.
Stop-loss and take-profit levels are dynamically calculated per trade.
Only one position can be open at any given time.
What You See on the Chart
Weighted Moving Average (WMA) trend line.
Fast EMA and Slow EMA lines.
Dynamic stop-loss line during active trades.
Dynamic take-profit line during active trades.
Recommended Use
Intraday scalping on VİOP instruments.
Momentum-based short-term trading.
Traders who prefer rule-based systems with strict risk control.
Always backtest and forward-test on your own instruments and timeframes before using this strategy in live markets.

Shock Wave: EMA9 Slope / ATR (Normalized) for SPYShock Wave – EMA9 Slope Normalized by ATR (Fragility Gauge)
This indicator measures trend fragility, not direction.
Instead of relying on visual trendline angles (which change with zoom and chart scaling), this tool normalizes the slope of the 9-EMA by ATR, producing a scale-independent steepness metric that remains consistent across timeframes and zoom levels.
The goal is to identify late-stage acceleration and liquidity vulnerability — conditions where price is advancing faster than inventory can rebalance and the market becomes sensitive to forced liquidation.
What this indicator shows
Normalized EMA9 slope (ATR per bar)
An angle-like degree value derived from the normalized slope (for intuition only)
Background shading to highlight trend maturity / fragility
A compact table showing live readings on the chart
How to interpret
Green / low values (< ~0.30 ATR/bar): Healthy, sustainable trend
Orange / mid values (~0.30–0.40 ATR/bar): Late-stage acceleration
Red / high values (≥ ~0.45 ATR/bar): Fragile / liquidation-prone conditions
These thresholds are empirically derived from historical index behavior (e.g., SPY prior to 2018, 2020, 2022 volatility events).
Important notes
This is not a buy or sell signal
Red does not mean “short”
The indicator highlights risk asymmetry, not timing
Best used on higher timeframes (weekly) in conjunction with liquidity, inducement, and higher-timeframe structure analysis
Why use this
Markets often fail after strong trends, not because they are weak, but because they are crowded. This tool helps quantify when a trend has become structurally vulnerable, providing context for liquidity-based frameworks and macro risk management.

Daily ATR Dashboard - NIRALADaily ATR Dashboard: Volatility at a Glance
What is this?
The "Daily ATR Dashboard" is a simple, non-intrusive utility tool designed for intraday traders. It places a clean information table in the top-right corner of your chart, displaying the Daily Average True Range (DATR) for the current session and the previous two days.
Why is it useful?
Understanding daily volatility is crucial for setting realistic targets and stop-losses.
Know the Range: Instantly see how much the instrument typically moves in a day.
Context: Compare today's volatility with yesterday's and the day before to gauge if the market is expanding (becoming more volatile) or contracting (consolidating).
Clean Charts: Instead of plotting a messy ATR line indicator below your price action, this dashboard gives you the raw data you need without cluttering your workspace.
Features:
Real-Time Data: The "Today" row updates in real-time as the current daily candle develops.
Historical Context: Automatically fetches and displays the final DATR values for the previous two sessions ("Yesterday" and "Day Before").
Highlighted Current Day: The current day's data is highlighted in yellow for immediate visibility.
Customizable: You can adjust the ATR length (default is 14) and the text size to fit your screen perfectly.
How to Read It:
Today: The current volatility of the ongoing daily session.
Yesterday / Day Before: The finalized volatility of past sessions.
Tip: If "Today's" ATR is significantly lower than the previous days, expect potential expansion or a breakout soon. If it is significantly higher, the market may be overextended.
Settings:
DATR Length: The lookback period for the ATR calculation (Default: 14).
Text Size: Adjust the size of the table text (Tiny, Small, Normal, Large).

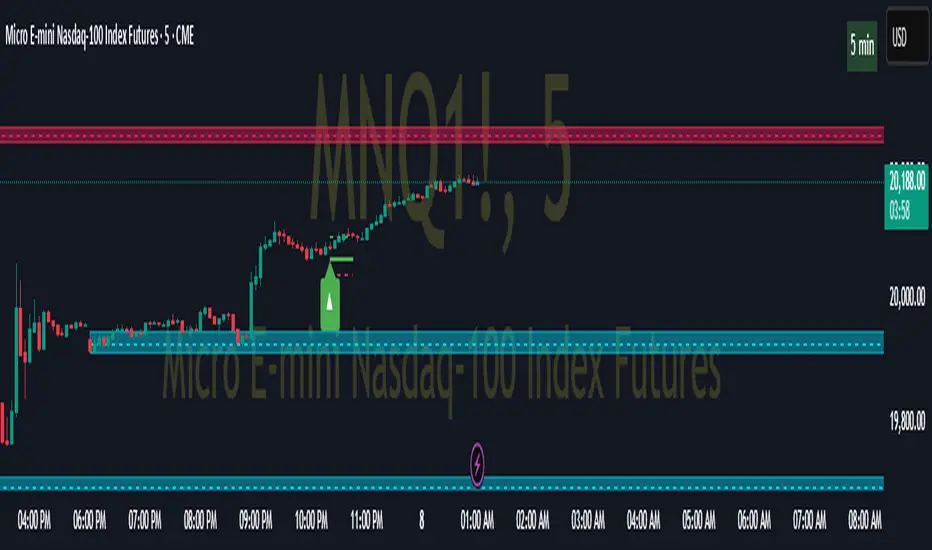
Position Sizing Calculator (Real-Time) - Futures Edition█ SUMMARY
The following indicator is a Position Sizing Calculator based on Average True Range (ATR), originally developed by market technician J. Welles Wilder Jr., intended for real-time trading.
This script utilizes the user's account size, acceptable risk percentage, and a stop-loss distance based on ATR to dynamically calculate the appropriate position size for each trade in real time.
█ BACKGROUND
Developed for use on the Micro E-mini Nasdaq-100 futures (MNQ), this script provides traders with continuously updated dynamic position sizes. It enables traders to instantly determine the exact number of contracts to use when entering a trade while staying within their acceptable risk tolerance.
This real-time position sizing tool helps traders make well-informed decisions when planning trade entries and calculating maximum stop-loss levels, ultimately enhancing risk management.
█ USER INPUTS
Trading Account Size: Total dollar value of the user's trading account.
Acceptable Risk (%): Maximum percentage of the trading account that the user is willing to risk per trade.
ATR Multiplier for Stop-Loss: Multiplier used to determine the distance of the stop-loss from the current price, based on the ATR value.
ATR Length: The length of the lookback period used to calculate the ATR value.
Show Target Risk Row: Toggle to hide/show the Target Risk Row
SL Levels Display: Option to see Both, Long Only, Short Only, or None of the Stop Loss Level Values.
Contract Point Value ($): Point value per contract. Tooltip highlights common values.
Tick Size: Minimum Price Movement (Default set to 0.25)
Minimum Contracts: Override the Minimum Contracts per trade to a user selected value.
(May Exceed User's Target Risk)

Uptrick: Volume Weighted BandsIntroduction
This indicator, Uptrick: Volume Weighted Bands, overlays dynamic, volume-informed trend channels directly on the chart. By fusing price and volume data through volume-weighted and exponential moving averages, the script forms a core trend line with adaptive bandwidth controlled by volatility. It is designed to help traders identify trend direction, breakout entries, and extended conditions that may warrant take-profits or pullback re-entries.
Overview
The Volume Weighted Bands system is built around a trend line calculated by averaging a Volume Weighted Moving Average (VWMA) and an Exponential Moving Average (EMA), both over a configurable lookback period. This hybrid trend baseline is then smoothed further and expanded into dynamic upper and lower bands using an Average True Range (ATR) multiplier. These bands adapt with market volatility and shift color based on prevailing price action, helping traders quickly identify bullish, bearish, or neutral conditions.
Originality and Unique Features
This script introduces originality by blending both price and volume in the core trend calculation, a technique that is more responsive than traditional moving average bands. Its multi-mode visualization (cloud, single-band, or line-only), combined with selective buy/sell signals, makes it flexible for discretionary and algorithmic strategies alike. Optional modules for take-profit signals based on z-score deviation and RSI slope, as well as buy-back detection logic with cooldown filters, offer practical tools for managing trades beyond simple entries.
Explanation of Inputs
Every user input in this script is included to give the trader control over behavior and visual presentation:
Trend Length (len): Defines the lookback window for both the VWMA and EMA, controlling the sensitivity of the core trend baseline. A lower value makes the bands more reactive, while a higher value smooths out short-term noise.
Extra Smoothing (smoothLen): Applies an additional EMA to the blended VWMA/EMA average. This second-level smoothing ensures the central trend line reacts gradually to shifts in price.
Band Width (ATR Multiplier) (bandMult): Multiplies the ATR to create the width of the upper and lower bands around the trend line. Larger values widen the bands, capturing more volatility, while smaller values narrow them.
ATR Length (atrLen): Sets the length of the ATR used in calculating band width and signal offsets. Longer values produce smoother band boundaries.
Show Buy/Sell Signals (showSignals): Toggles the primary crossover/crossunder entry signals, which are labeled when the close crosses the upper or lower band.
Visual Mode (visualMode): Allows selection between three display modes:
--> Cloud: Shows both bands and the central trend line with a shaded background.
--> Single Band: Displays only the active (upper or lower) band depending on trend state, with gradient fill to price.
--> Line Only: Shows only the trend line for a minimal visual profile.
Take Profit Signals (enableTP): Enables a z-score-based profit-taking signal system. Signals occur when price deviates significantly from the trend line and RSI confirms exhaustion.
TP Z-Score Threshold (tpThreshold): Sets the z-score deviation required to trigger a take-profit signal. Higher values reduce the frequency of signals, focusing on more extreme moves.
Re-Entries (enableBuyBack): Enables logic to signal when price reverts into the band after an initial breakout, suggesting a possible re-entry or pullback setup.
Buy Back Cooldown (bars) (buyBackCooldown): Defines a minimum bar count before a new buy-back signal is allowed, preventing rapid retriggering in choppy conditions.
Buy Offset and Sell Offset: Hidden inputs used to vertically adjust the placement of the Buy ("𝓤𝓹") and Sell ("𝓓𝓸𝔀𝓷") labels relative to the bands. These use ATR units to maintain proportionality across different instruments and timeframes.
Take-Profit Signal Module
The take-profit module uses a z-score of the distance between price and the trend line to detect extended conditions. In bullish trends, a signal appears when price is well above the band and RSI indicates exhaustion; the opposite applies for bearish conditions. A boolean flag is used to prevent retriggering until RSI resets. These signals are plotted with minimalist “X” markers near recent highs or lows, based on whether the market is extended upward or downward.
Re-Entry Logic
The re-entry system identifies instances where price momentarily dips or spikes into the opposite band but closes back inside, implying a continuation of the prevailing trend. This module can be particularly useful for traders managing entries after brief pullbacks. A built-in cooldown period helps filter out noise and prevents signal overloading during fast markets. Visual markers are shown as upward or downward arrows near the relevant candle wicks.
How to Use This Indicator
The basic usage of this indicator follows a directional, signal-driven approach. When a buy signal appears, it suggests entering a long position. The recommended stop loss placement is below the lower band, allowing for some breathing space to accommodate natural volatility. As the position progresses, take partial profits—typically 10% to 15% of the position—each time a take-profit signal (marked with an "X") is shown on the chart.
An optional feature is the buy-back signal, which can be used to re-enter after partial exits or missed entries. Utilizing this can help reduce losses during false breakouts or trend reversals by scaling in more gradually. However, it also means that in strong, clean trends, the full position may not be captured from the start, potentially reducing the total return. It is up to the trader to decide whether to enter fully on the initial signal or incrementally using buy-backs.
When a sell signal appears, the strategy advises fully exiting any long positions and immediately switching to a short position. The short trade follows the same logic: place your stop loss above the upper band with some margin, and again, take partial profits at each take-profit signal.
Visual Presentation and Signal Labels
All signals are plotted with clean, minimal labels that avoid clutter, and are color-coded using a custom palette designed to remain clear across light and dark chart themes. Bullish trends are marked in teal and bearish trends in magenta. Candles and wicks are also colored accordingly to align price action with the detected trend state. Buy and sell entries are marked with "𝓤𝓹" and "𝓓𝓸𝔀𝓷" labels.
Summary
In summary, the Uptrick: Volume Weighted Bands indicator provides a versatile, visually adaptive trend and volatility tool that can serve multiple styles of trading. Through its integration of price, volume, and volatility, along with modular take-profit and buy-back signaling, it aims to provide actionable structure across a range of market conditions.
Disclaimer
This indicator is for educational purposes only. Trading involves risk, and past performance does not guarantee future results. Always test strategies before applying them in live markets.

Ripster: DTR/ATR + SMA Div + RVOL🧭 Overview
The indicator combines three major analytical tools into one TradingView Pine v6 script — designed for clean, at-a-glance insight into range, divergence, and volume activity.
It shows:
DTR vs ATR Table – current Daily True Range compared to Average True Range.
SMA Price Divergence + EMA Signal – a histogram with color-coded momentum bands.
RVOL Table + Candle Coloring + Change Labels – relative-volume analysis with visual cues on the chart.
Short title: ripcombo
Runs on chart overlay (no separate pane).
📊 1. DTR vs ATR Table
Compares today’s price range (High-Low) to the average true range over a selectable length.
Supports multiple smoothing methods: EMA, RMA, SMA, WMA.
Table position and text size are configurable.
Color logic:
🟢 ≤ 70 % of ATR → low volatility
🟡 70–90 % → average
🔴 ≥ 90 % → expanded range
📈 2. SMA Divergence + EMA Signal
Computes fast (14 SMA) and slow (30 SMA) divergences of price.
Plots two histograms plus an EMA signal line of the slow divergence.
Visuals:
Columns shaded by transparency for clarity.
Rising EMA → lime line (up momentum).
Falling EMA → red line (down momentum).
Optional upper/lower bands and zero line provide quick overbought/oversold zones.
🔥 3. RVOL (Relative Volume)
Adds powerful volume-based context:
a. Table Display
Shows:
Candle Volume
RVOL (Now)
RVOL (Prev)
Δ RVOL (change Now − Prev)
Colors:
🔴 > 200 % (very high volume)
🟠 100–200 % (high volume)
🟡 < 100 % (normal/low volume)
Δ column is green ▲ for increase, red ▼ for decrease.
b. Candle Coloring (optional)
Colors price candles themselves by current RVOL threshold so high-volume candles visually stand out.
c. Last-Bar Label (optional)
Prints a compact label on the latest candle showing:
RVOL: ### % Δ: ▲/▼## %
so you can instantly see the current volume strength and how it changed from the previous bar.
⚙️ User Settings
All major elements are toggle-controlled:
Enable/disable ATR, Divergence, or RVOL sections.
Choose table positions (top/middle/bottom × left/center/right).
Select text sizes, smoothing types, color modes, and visual transparency.
Candle coloring + label visibility are optional.
🧠 At a Glance
Component Purpose Key Visuals
DTR vs ATR Measures volatility expansion One-cell colored table
SMA Divergence Detects price momentum shifts Columns + EMA line + bands
RVOL Analysis Highlights unusual trading volume Colored table + Δ column + candle colors + label
✅ Result
You get a single on-chart tool that:
Quantifies volatility, momentum, and volume context together.
Highlights strong activity days (ATR & RVOL) in color.
Shows whether current candle’s volume is rising or falling vs the previous.
Perfect for spotting breakouts, reversals, or exhaustion moves without switching indicators.

Twisted Forex's Doji + Area StrategyTitle
Twisted Forex’s Doji + Area Strategy
Description
What this strategy does
This strategy looks for doji candles forming inside or near supply/demand areas . Areas are built from swing pivots and sized with ATR, then tracked for retests (“confirmations”). When a doji prints close to an area and quality checks pass, the strategy places a trade with the stop beyond the doji and a configurable R:R target.
How areas (zones) are built
• Swings are detected with a user-set pivot length.
• Each swing spawns a horizontal area centered at the pivot price with half-height = zoneHalfATR × ATR .
• Duplicates are de-duplicated by center distance (ATR-scaled).
• Areas fade when broken beyond a buffer or after an optional age (expiry).
• Retests are recorded when price touches and then bounces away from the area; repeated reactions increase the zone’s “strength”.
Signal logic (summary)
Doji detection: strict or loose body criteria with optional minimum wick fractions and ATR-scaled minimum range.
Proximity: price must be inside/near a supply or demand area (proxATR × ATR).
Side resolution: overlap is resolved by (a) which side price penetrates more, (b) fast/slow EMA trend, or (c) nearest distance. Optional “previous candle flip” can bias long after a bearish candle and short after a bullish one.
Optional 1-bar confirmation: the bar after the doji must close away from the area by confirmATR × ATR .
Quality filter (Off/Soft/Strict): four checks—(i) wick rejection past the edge, (ii) doji closes in an edge “band” of the area, (iii) fresh touch (cooldown), (iv) approach impulse over a short lookback. In Strict , thresholds auto-tighten.
Orders & exits
• Long: stop below doji low minus buffer; Short: above doji high plus buffer.
• Target = rrMultiple × risk distance .
• Pyramiding is off by default.
Position sizing
You can size from the script or from Strategy Properties:
• Script-driven (default): set Position sizing = “Risk % of equity” and choose riskPercent (e.g., 1.0%). The script applies safe floors/rounding (FX micro-lots by default) so quantity never rounds to zero.
• Properties-driven : toggle Use TV Properties → Order size ON, then pick “Percent of equity” in Properties (e.g., 1%). The header includes safe defaults so trades still place.
Key inputs to explore
• Zone building : pivotLen, zoneHalfATR, minDepartureATR, expiryBars, breakATR, leftBars, dedupeATR.
• Doji & proximity : strictDoji, dojiBodyFrac, minWickFrac, minRangeATR, proxATR, minBarsBetween.
• Overlap resolution : usePenetration, useTrend (EMA 21/55), “previous candle flip”, needNextBarConf & confirmATR.
• Quality : qualityMode (Off/Soft/Strict), minQualPass/kStrict, wickPenATR, edgeBandFrac, approachLookback, approachMinATR, freshTouchBars.
• Zone strength gating : minStrengthSoft / minStrengthStrict.
• HTF confluence (optional) : useHTFTrend (HTF EMA 34/89) and/or useHTFZoneProx (HTF swing bands).
Tips to make it cleaner / higher quality
• Turn needNextBarConf ON and use confirmATR = 0.10–0.15 .
• Increase approachMinATR (e.g., 0.35–0.45) to require a stronger pre-touch impulse.
• Raise minStrengthSoft/Strict (e.g., 4–6) so only well-reacted zones can signal.
• Use signalsOnlyConfirmed ON if you prefer trades only from zones with retests (the script falls back gracefully when none exist yet).
• Nudge proxATR to 0.5–0.6 to demand tighter proximity to the level.
• Optional: enable useHTFTrend to filter counter-trend setups.
Default settings used in this publication
• Initial capital: 100,000 (illustrative).
• Slippage: 1 tick; Commission: 0% (you can raise commission if you prefer—spread is partly modeled by slippage).
• Sizing: Risk % of equity via inputs; riskPercent = 1.0% ; FX uses micro-lot floors by default.
• Quality: Off by default (Soft/Strict available).
• HTF trend gate: Off by default.
Backtesting notes
For a meaningful sample size, test on liquid symbols/timeframes that yield 100+ trades (e.g., majors on 5–15m over 1–2 years). Backtests are modelled and broker costs/spread vary—validate on your feed and forward-test.
How to read the chart
Shaded bands are supply (above) and demand (below). Brighter bands are the nearest K per side (visual aid). BUY/SELL labels mark entries; colored dots show entry/SL/TP levels. You can hide zones or unconfirmed zones for a cleaner view.
Disclaimer
This is educational material, not financial advice. Trading involves risk. Always test and size responsibly.

nATR*ATR Multiplication Indicator - Optimal Selection Tool forThis indicator is specifically designed as an analysis tool for investors using grid bot strategies. It displays both nATR (Normalized Average True Range) and ATR (Average True Range) values on a single chart screen, calculating the multiplication of these two critical volatility measurements.
Primary Purpose of the Indicator:
To facilitate the selection of the most optimal stock and time period for grid bot trading. The nATR*ATR multiplication provides a hybrid measurement that combines both percentage-based return potential (nATR) and absolute volatility magnitude (ATR).
Importance for Grid Bot Strategy:
High nATR: Greater percentage-based return potential
High ATR: Wider price range = Fewer grid levels = More budget allocation per grid
Formula: Price Range/ATR = Theoretical Grid Count
Usage Advantages:
Test different time periods to find the highest multiplication value
Make optimal stock and time frame selections for grid bot setup
Monitor both nATR and ATR values on a single screen
High multiplication values indicate ideal conditions for grid bots
Technical Features:
Adjustable calculation period (1-500 candles)
Visual alert system (high/low multiplication values)
Real-time value tracking table
SMA-based smoothed calculations
This serves as a reliable guide for grid bot investors in optimal timing and stock selection.

Pro Market Toolkit (TH) v2.4 — S/R + Zones + ATR Bands + Alertsรายละเอียด (ภาษาไทย):
อินดิเคเตอร์ชุดเครื่องมือครบวงจรสำหรับนักเทรด
คำนวณ แนวรับ–แนวต้าน (Support / Resistance) อัตโนมัติจากสวิง (Pivot High/Low)
สร้าง Supply/Demand Zones จาก ATR เพื่อหาพื้นที่กลับตัวสำคัญ
วาดเส้น Moving Average และ ATR Bands เพื่อประเมินแนวโน้มและความผันผวน
แสดงสัญญาณ Breakout และ Bounce/Reject อย่างชัดเจนบนกราฟ
รองรับ Alerts สำหรับ 4 เงื่อนไขสำคัญ: Breakout ขึ้น/ลง, Demand Bounce, Supply Reject
มีตารางแสดง Trend และค่า ATR ปัจจุบัน
เหมาะสำหรับผู้ที่ต้องการดูแนวโน้ม, หาจุดเข้า/ออก และรับการแจ้งเตือนอัตโนมัติ โดยไม่ต้องเฝ้ากราฟตลอดเวลา
Description (English):
A comprehensive trading toolkit indicator for professional traders.
Automatically detects Support/Resistance levels using swing pivots
Generates Supply/Demand Zones based on ATR to highlight potential reversal areas
Plots Moving Average and ATR Bands for trend and volatility analysis
Displays clear signal markers for Breakouts and Zone Bounces/Rejects
Provides Alerts for 4 key conditions: Breakout Up/Down, Demand Bounce, Supply Reject
Includes an on-chart table showing the current Trend and ATR value
Ideal for traders who want automatic key levels, zones, and signal alerts without the need to monitor the chart constantly.

Engulfing Candles (ATR-Based) with Volume SpikeOverview:
This script is designed to detect high-probability bullish and bearish engulfing patterns — but with a twist: it filters them through ATR-based volatility and confirms strength with volume spikes, all while offering optional trend filtering. It's built for traders who want more than just surface-level candle patterns — it's for those who want contextual confirmation before entering a trade.
What Makes It Different:
Most engulfing candle indicators simply match two candle shapes. This script goes deeper by:
Measuring candle body size relative to recent volatility (via ATR).
Checking for volume confirmation using a dynamic spike threshold.
Filtering based on trend context using SMA-based structure detection.
This tri-layered logic aims to avoid false positives and give traders cleaner, more actionable entries that align with momentum.
Core Concepts:
1. Trend Detection (Optional)
You can choose between two structural filters:
SMA50 only: Looks for price above or below the 50-period SMA to define trend direction.
SMA50 + SMA200 alignment: A stricter rule requiring both fast and slow SMAs to confirm a trend.
Or turn off trend filtering entirely (No detection).
This helps ensure engulfing setups appear in line with the broader trend, increasing the likelihood of continuation.
2. ATR-Filtered Candle Bodies
To eliminate noise:
A candle is only considered a valid engulfing candle if it has a body larger than 1.5× ATR(14).
The previous candle must be a small-bodied candle (less than 0.5× ATR), creating a clear visual engulfing structure.
This method dynamically adjusts for market volatility, so setups are meaningful even during periods of compression or expansion.
3. Volume Spike Confirmation
Not all engulfing candles lead to follow-through. That’s why this script includes a volume confirmation filter:
A 20-period moving average of volume is calculated.
A spike is flagged if the current bar’s volume exceeds 1.5× this average (adjustable).
Patterns with this confirmation are marked with a “*” label (e.g., BU* or BE*) to distinguish volume-backed setups from weaker ones.
Visuals & Alerts:
BU = Bullish engulfing without volume spike
BU* = Bullish engulfing with volume spike
BE = Bearish engulfing without volume spike
BE* = Bearish engulfing with volume spike
A white background highlight is shown behind candles with volume-confirmed engulfing patterns.
Alerts are available for BU* and BE* so you can automate your edge.
How to Use:
Add the indicator to any chart.
Choose your trend filter from the settings panel.
Watch for BU* and BE* labels — these are your highest-conviction signals.
Optional: Combine with support/resistance, Fibonacci zones, or MTF confirmation to refine entries.
Use the included alerts to receive real-time push/email notifications when patterns emerge.
Performance Note:
I’ve found this script to be fairly good when applied to the 1-hour charts of the companies in the US100. The combination of ATR-based filtering and volume confirmation appears to provide clear, high-quality setups with good follow-through potential.
By blending candle patterns, volatility filtering, volume confirmation, and trend context, this script aims to filter out weak signals and highlight the most statistically significant engulfing opportunities.

True Range eXpansion🕯️ TRX — True Range eXpansion
Clean Candle Bodies · Volatility Bands · Adaptive Range Envelope System
Not your grandfather’s candles. Not your brokerage’s bands.
----------------------------------------------------
TRX begins with a simple concept: visualize the true range of every candle, without the noise of flickering wicks.
From there, it grows into a fully adaptive price visualization framework.
What started as a candle-only visualizer evolved into a modular, user-controlled price engine.
From wickless candle clarity to dynamic volatility envelopes, TRX adapts to you.
There are plenty of band and channel indicators out there — Bollinger, Keltner, Donchian, Envelope, the whole crew.
But none of them are built on the true candle range, adaptive ATR shaping, and full user control like TRX.
This isn’t just another indicator — it’s a new framework.
Most bands and channels are based on close price and statistical deviation — useful, but limited.
TRX uses the full true range of each candle as its foundation, then applies customizable smoothing and directional ATR scaling to form a dynamic, volatility-reactive envelope.
The result? Bands that breathe with the market — not lag behind it.
----------------------------------------------------
🔧 Core Features:
🕯️ True Range Candles — Each candle is plotted from low to high, body-only, colored by open/close.
📈 Adjustable High/Low Moving Averages — Select your smoothing style: SMA, EMA, WMA, RMA, or HMA.
🌬️ ATR-Based Expansion — Bands dynamically breathe based on market volatility.
🔀 Per-Band Multipliers — Fine-tune expansion individually for the upper and lower bands.
⚖️ Basis Line — Optional centerline between bands for structure tracking and equilibrium zones.
🎛️ Full Visual Control — Width, transparency, color, on/off toggles for each element.
----------------------------------------------------
🧠 Default Use Case:
With the included default settings, TRX behaves like an evolved Bollinger Band system — based on True Range candle structure, not just close price and standard deviation.
----------------------------------------------------
🔄 How to Zero Out the Bands (for Minimalist Use):
Want just candles? A clean MA? Single band? You got it.
➤ Use TRX like a clean moving average:
• Set ATR Multiplier to 0
• Set both Band ATR Adjustments to 0
• Leave the Basis Line ON or OFF — your call
➤ Show only candles (no bands at all):
• Turn off "Show High/Low MAs"
• Turn off Basis Line
➤ Single-line ceiling or floor tracking:
• Set one band’s Transparency to 100
• Use the remaining band as a price envelope or support/resistance guide
----------------------------------------------------
🧬 Notes:
TRX can be made:
• Spiky or silky (via smoothing & ATR)
• Wide or tight (via multipliers)
• Subtle or aggressive (via color/transparency)
• Clean as a compass or dirty as a chaos meter
Built by accident. Tuned with intention.
Released to the world as one of the most adaptable and expressive visual overlays ever made.
Created by Sherlock_MacGyver

Range Filter Strategy with ATR TP/SLHow This Strategy Works:
Range Filter:
Calculates a smoothed average (SMA) of price
Creates upper and lower bands based on standard deviation
When price crosses above upper band, it signals a potential uptrend
When price crosses below lower band, it signals a potential downtrend
ATR-Based Risk Management:
Uses Average True Range (ATR) to set dynamic take profit and stop loss levels
Take profit is set at entry price + (ATR × multiplier) for long positions
Stop loss is set at entry price - (ATR × multiplier) for long positions
The opposite applies for short positions
Input Parameters:
Adjustable range filter length and multiplier
Customizable ATR length and TP/SL multipliers
All parameters can be optimized in TradingView's strategy tester
You can adjust the input parameters to fit your trading style and the specific market you're trading. The ATR-based exits help adapt to current market volatility.

Pivot ATR Zones [v6]🟩 Pivot ATR Zones
Overview:
The Pivot ATR Zones indicator plots dynamic support and resistance zones based on pivot highs and lows, combined with ATR (Average True Range) volatility levels. It helps traders visually identify potential long and short trade areas, along with realistic target and stop loss zones based on market conditions.
Features:
Automatically detects pivot highs and lows
Draws ATR-based entry zones on the chart
Plots dynamic take-profit and stop-loss levels using ATR multipliers
Color-coded long (green) and short (red) zones
Entry arrow markers for clearer trade visualization
Real-time alerts when new zones form
Best For:
Scalpers, intraday traders, and swing traders who want a visual, volatility-aware way to mark potential trade areas based on key pivot structures.
How to Use:
Look for newly formed green zones for long opportunities and red zones for short setups.
Use the dashed lines as dynamic take-profit and stop levels, tuned to the current ATR value.
Combine with other confirmation tools or indicators for optimal results.
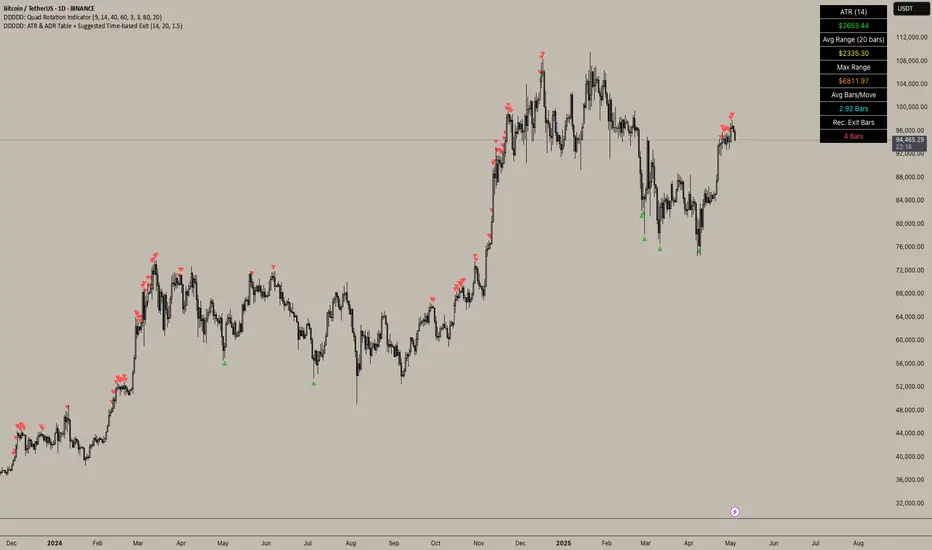
DDDDD: ATR & ADR Table + Suggested Time-based Exit📈 DDDDD: ATR & ADR Table + Suggested Time-based Exit
This indicator provides a simple yet powerful table displaying key volatility metrics for any timeframe you apply it to. It is designed for traders who want to assess the volatility of an asset, estimate the average time required for a potential move, and define a time-based exit strategy.
🔍 Features:
Displays ATR (Average True Range) for the selected length
Shows Average Range (High-Low) and Maximum Range over a configurable number of bars
Calculates Avg Bars/Move → average number of bars needed to achieve the maximum range
Calculates Recommended Exit Bars → suggested maximum holding period (in bars) before considering an exit if price hasn’t moved as expected
All values dynamically adjust based on the chart’s current timeframe
Outputs values directly in a table overlay on your main chart for quick reference
📝 How to interpret the table:
Field Meaning
ATR (14) Average True Range over the last 14 bars (volatility indicator)
Avg Range (20) Average High-Low range over the last 20 bars
Max Range Maximum High-Low range observed in the last 20 bars
Avg Bars/Move Average number of bars it takes to achieve a Max Range move
Rec. Exit Bars Suggested max holding period (bars) → consider exit if move hasn’t occurred
✅ How to use:
Apply this indicator to any chart (works on minutes, hourly, daily, weekly…)
It will automatically calculate based on the chart’s current timeframe
Use ATR & Avg Range to gauge volatility
Use Avg Bars/Move to estimate how long the market usually takes to achieve a big move
Use Rec. Exit Bars as a soft stop — if price hasn’t moved by this time, consider exiting due to declining probability of a breakout
⚠️ Notes:
All values are relative to your current chart timeframe. For example:
→ On a daily chart, ATR represents daily volatility
→ On a 1H chart, ATR represents hourly volatility
“Bars” refers to the bars of the current timeframe. Always interpret time accordingly.
Perfect for traders who want to:
Time their trades based on average volatility
Avoid overholding losing positions
Set time-based exit rules to complement price-based stoplosses
RSI + ADX + ATR Combo Indicator: RSI + ADX + ATR Combo Filter
This indicator is a confluence filter tool that combines RSI, ADX, and ATR into a single, easy-to-read chart overlay. It is designed to help traders identify low-volatility, non-trending zones with balanced momentum—ideal for strategies that rely on breakouts or reversals.
🔍 Core Components:
RSI (Relative Strength Index)
Standard RSI with custom upper and lower bounds (default: 60 and 40).
Filters out extreme overbought/oversold regions and focuses on price consolidation zones.
ADX (Average Directional Index)
Measures trend strength.
When ADX is below a custom threshold (default: 20), it indicates a weak or range-bound trend.
ATR (Average True Range)
Represents volatility.
Low ATR values (default threshold: 2.5) are used to filter out high-volatility environments, helping refine entries.
🟣 Signal Logic:
A signal is highlighted with a background color when all three conditions are met:
RSI is between lower and upper bounds (e.g., 40 < RSI < 60) ✅
ADX is below the trend threshold (e.g., ADX < 20) ✅
ATR is below the volatility threshold (e.g., ATR < 2.5) ✅
These combined conditions suggest a low-volatility, low-trend strength, and balanced momentum zone—perfect for anticipating breakouts or strong directional moves.
