ATR Mean Reversion Strategy V1**Long Only Strategy**
When Price drops below the ATR band below it will enter a buy on the next candle open
SL at current price minus ATR* ATR multiplier
TP at Mean EMA or if higher than Mean EMA and current candle low is below previous candle low or if price is above ATR
NB: I would highly recommend a low fee broker (I use ICmarkets raw spread account) due to the fact that this is a decently high frequency trading strategy you will rack up a lot of commission, if you use and exchange like Bybit or Binance the strategy will not be profitable due to the high commissions.
Pesquisar nos scripts por "atr"

ATR Trend Bands [Misu]█ This indicator shows an upper and lower band based on price action and ATR (Average True Range)
The average true range (ATR) is a market volatility indicator used in technical analysis.
█ Usages:
The purpose of this indicator is to identify changes in trends and price action.
It is mainly used to identify breaking points and trend reversals.
But it can also be used to show resistance or support levels.
█ Features:
> Buy & Sell Alerts
> Buy & Sell Labels
> Color Bars
> Show Bands
█ Parameters:
Length: Length is used to calculate ATR.
Atr Multiplier: A factor used to balance the impact of the ATR on the Trend Bands calculation.

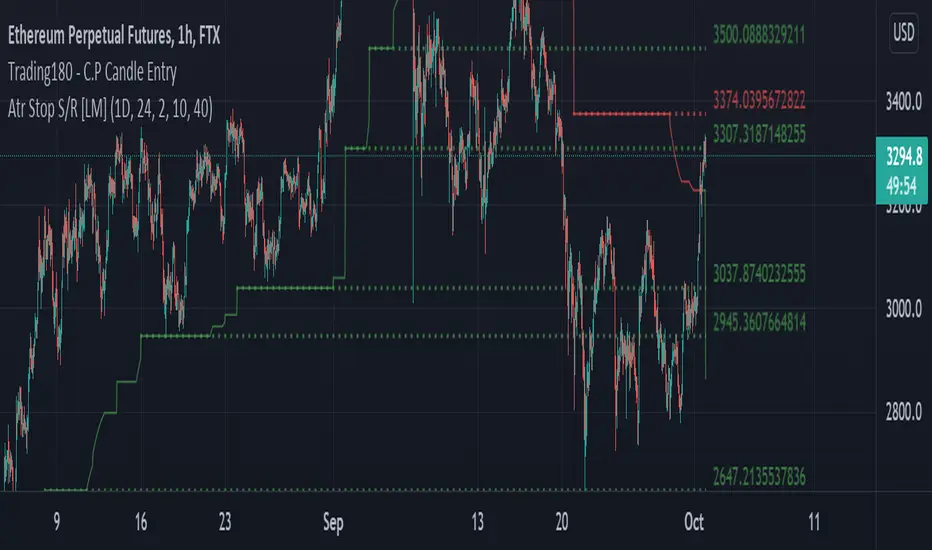
ATR Trailing Stops S/R [LM]Hello Traders,
I would like to introduce you ATR Trailing Stops S/R . The idea is to look for important levels that are identified by trailing stop line, where it usualy spents a lot of time without any move usualy turns out to be good level for bounces.
Script for atr trailing line is originaly taken from: script made by @dgmoon
It has various setting
Timeframe and atr settings
Show lines
Extend lines
Line count - how many lines will be rendered
Candle count - how many candles has to trailing line spend at the same level
Colors - controls color of plot and lines
I hope you will enjoy it, as I enjoyed to write it.
Lukas
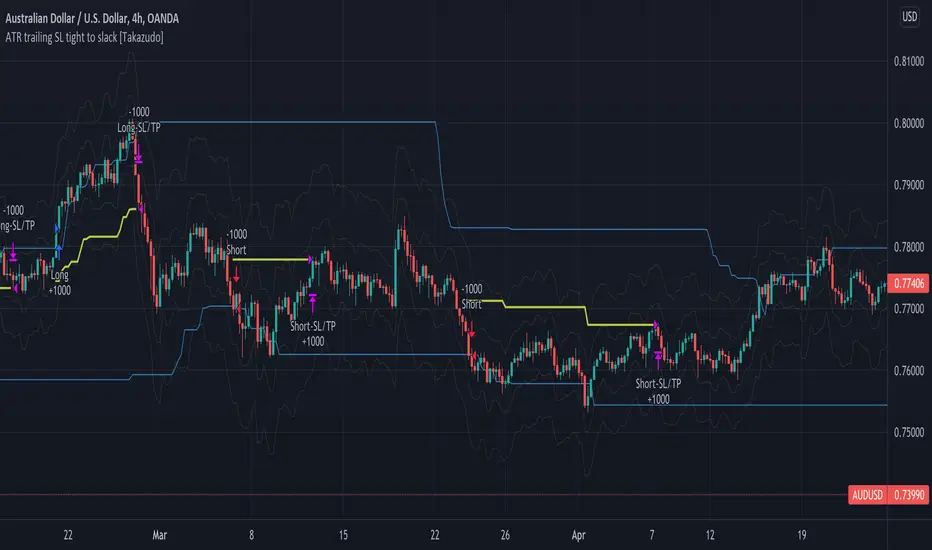
ATR trailing Stop Loss tight to slack [Takazudo]This is a demo of ATR based trailing Stop Loss.
This SL strategy uses 2 types of ATR based SL.
tight SL as initial (ATR * 1.5)
slack SL as trailing (ATR * 4)
When any entry singal occurs by the buy/sell conditions, this SL strategy uses the "tight SL" as the initial SL.
Then the SL will chase the price as trailing SL. However, this strategy uses the "slack SL" in this trailing phase.
So you can set the tight SL first.
Then SL will chase the price as the slack one.
Note: The entry strategy in this script is not intented to win. Check the result. Be careful. Just a module of my strategy.
ATR - ATR from Low, ATR from High LabelsChecks what the average true range is for the X amount of trading days. Then will also label the ATR from the low, and the ATR from the high of the current day.
A second label can be created dependent on current days RVOL %. If RVOL is not 0 or 1, then it will create the second label. Otherwise it will just leave it as the standard label.
The calculation for second label is RVOL * ATR.

ATR Percentage of PriceThis indicator takes the standard ATR and expresses it as a percentage of the OHLC4 price. This has the advantage of normalising the ATR value across the history of an asset. For example, an ATR of value 20 when the price is 2000 actually has a very different meaning when the price rises to 4000. The ATR may be the same value but actually the volatility it represents has halved.
I also add an SMA to the value and a histogram which shows the difference between the two. Positive values mean that volatility is expanding while negative values mean volatility is contracting.
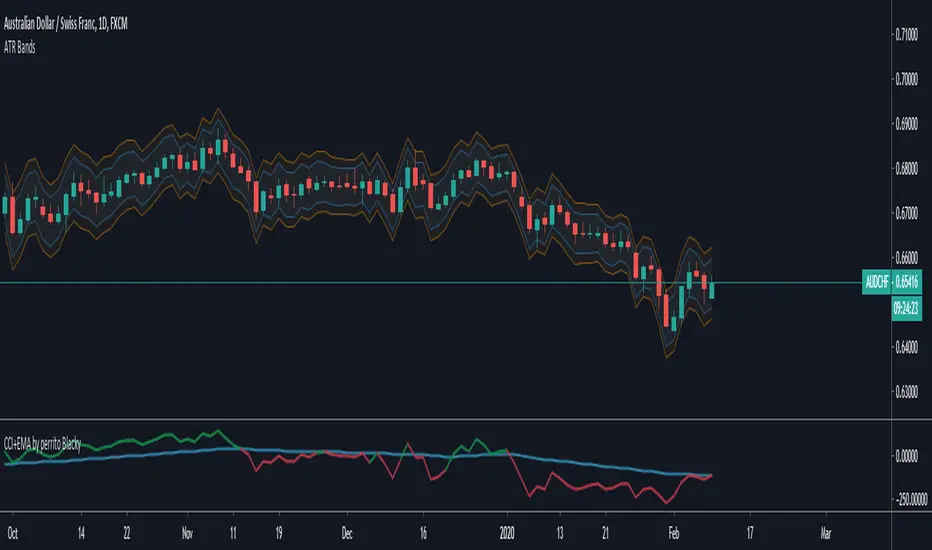
ATR BandsThe NNFX way
This indicator makes it easy to see the ATR values of the chart.
The red lines are at 1.5 ATR
The blue lines are at 1 ATR
Credits to www.tradingview.com for the code he published. I've extracted only the ATR to create this indicator. Many thanks ❤
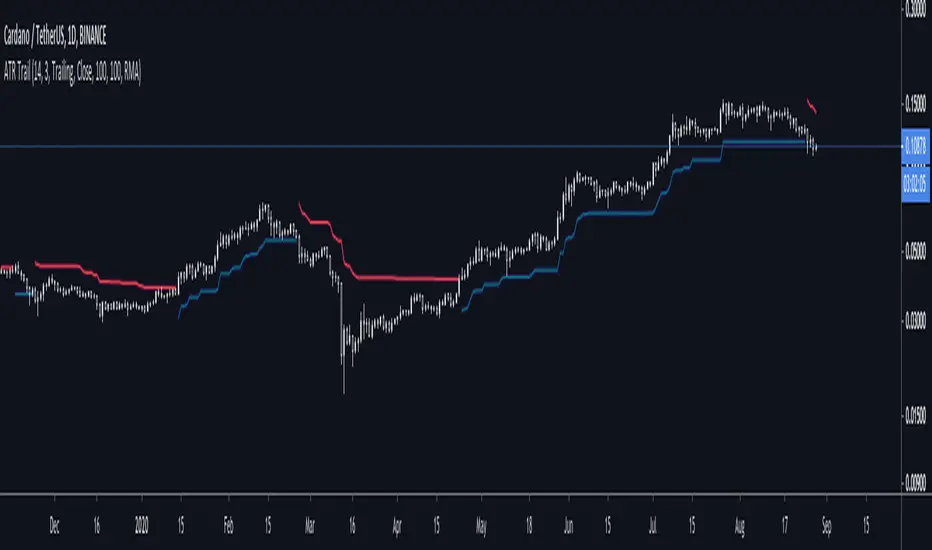
ATR + Trailing StopsSimple visualisation of Average True Range in Pinescript V4.
The script has two modes: Running and Trailing.
In Running mode, it continuously displays the ATR above and below the price. Specifically, it displays the High and Low price plus and minus the ATR times a user-supplied multiplier. This can be helpful for visualising volatility.
In Trailing mode, it displays the same ATR line, except the line trails until price crosses it. When price crosses it, it flips from long to short or vice-versa.
You could use trailing ATR as a stop loss. Adjust the multiplier and lookback period for your asset and preference.
ATR Squeeze Identifier + Last-Bar TR Stops1) Paints two lines based on previous bar's true range, has option for custom multiplier to make stop a factor of previous bar's TR. Used for quick identification of stop loss placement based on previous bar set-ups.
2) Identifies bar on close which has true range that is smaller than a period-chosen ATR criteria. Additionally, has an input for a raw "ATR Shave" which is used to narrow down bars with even smaller true range. Mostly used to identify potential entry zones where market is being squeezed, and expansion is likely to follow. Plots a character under the bar.
3) Identifies a close which includes and follows 5 consecutive closes which all exhibit smaller than average ATR. Includes customize-able ATR length and "ATR Shave" to narrow down tighter range's. Paints circle at bottom of chart. Mostly used to identify when market has been 'quiet' for some time and entries should be considered for likely expansion.

ATR Price ZoneThe ATR Price Zone is an indicator which takes the Daily Average True Range of a stock and shows how high and low the price of the stock could possibly go from the opening price.
Key features:
The ATR Price Zone is an indicator which takes the Daily Average True Range of a stock and shows how high and low the priced the stock could possibly go from the opening price.
Key features:
ATR Price Zone uses zones looking forward to help strategize possible movements in price.
This indicator is customizable with zones, horizontal lines, a quick reference chart and colors.
The indicator continues to move forward with the chart.
It references the Daily True Average Range regardless of which Time Frame you are using.
It also references the opening candle with a blue arrow when using less than daily time frames.
Create by BothwellTrader

ATR Volatility FilterA Basic Volatility Filter
3 Modes
1- Absolute ATR filter
2- Filter Based on ATR threshold relative percentage of the price
3- ATR Threshold relative to its moving average

ATR + Moving AverageThis indicator shows a manually calculated Average True Range (ATR) along with a moving average of the ATR.
The ATR measures current candle volatility.
The ATR Moving Average shows the average candle size over the selected period.
Both can use different smoothing types (RMA, SMA, EMA, WMA) for flexibility.
It’s useful for seeing when price is stretched, volatility is expanding or contracting, and for higher-timeframe mean-reversion analysis.

ATR Distance from 50 SMA By DanBobDanA simple indicator that measures the distance between current price and the 50 SMA
The average momentum swing trade might run 7 times the ATR before pulling back
Therefore, its recommended to not buy a stock that is beyond 4 times its ATR to the 50 SMA
This script will quickly and easily calculate the 50 SMA to ATR distance for you

ATR Stop Loss Finder (Strict Breakout Mode)Title: ATR Stop Loss Finder (Strict Breakout Mode)
Description:
Volatility-Based Risk Management: Generates dynamic trailing stop-loss lines for both Long (Lower Line) and Short (Upper Line) positions based on ATR volatility.
Strict Breakout Detection: Features a unique "Strict Breakout" logic that highlights trend acceleration. It visually marks whenever the Long SL breaks a historical high or the Short SL breaks a historical low over a user-defined lookback period (e.g., 50 bars).
Visual Signals: Automatically plots Red Circles for bullish SL breakouts (New Highs) and Blue Circles for bearish SL breakdowns (New Lows), making strong momentum shifts easy to spot.
Real-Time Dashboard: Includes an informative table displaying current ATR and SL price levels for quick reference.

ATR multiple from High & LowA simple numerical indicator measuring ATR multiple from recent 252 days high and low.
ATR multiples from high (and low) are used as a base in many systematic trading and trend following systems. As an example many systems buy after a 2.5–4 ATR multiple pullback in a strong stock if the regime allows it. This would then be paired with an entry tactic, for example buy as it recaptures the a pivot within the upper range, a MA or breaks out again after this mid term pullback/shakeout.
This indicator uses a function which captures the recent high and low no matter if we have 252 bars or not, which is not how standard high/low works in Tradingview. This means it also works with recent IPO:s.
I prefer to overlay the indicator in one of the lower panes, for example the volume pane and then right click on the indicator and select Pin to scale > No scale (fullscreen).

Daily ATR SL/TP Labels on ChartATR-Based Stop Loss & Take Profit Calculator
This script calculates 20% of the Average True Range (ATR) to determine optimal Stop Loss and Take Profit levels. Designed to assist traders in setting precise risk parameters when placing Buy/Sell orders based on daily market volatility.
Key Features:
Computes 20% of ATR value for proportional risk management
Provides dynamic SL/TP levels aligned to current market conditions
Optimised for Daily timeframe analysis to capture full trading day range
Recommended Usage:
Apply on Daily (1D) timeframe for most accurate results, as this captures the complete intraday price movement and provides reliable volatility measurements for position sizing and risk management decisions.

ATR Gauge - Audiophile StyleThe ATR Gauge - Audiophile Style indicator is a custom visualization tool. It's designed to give you a quick, retro-inspired snapshot of market volatility using the Average True Range (ATR) metric. Think of it as a dashboard widget styled like the VU meters on old-school audiophile equipment (e.g., vintage stereo amps from brands like McIntosh or Marantz)—simple, elegant, and functional. It sits in one of the corners of your chart and helps you gauge how "hot" or "cool" the current price action is compared to recent levels.
Why This Gauge?: Standard ATR plots as a line on your chart, but this turns it into a visual "meter" focused on the last 24 hours. It's like a speedometer for volatility—quick to read at a glance. Useful for day traders, scalpers, or anyone monitoring intraday risk without cluttering the main chart.

ATR % + Pump Detector📘 **ATR % + Pump Detector (Fixed 0.10%)**
This indicator combines two powerful volatility tools in one:
- **ATR % Display (Blue):**
Calculates the Average True Range as a percentage of price. Triggers an alert when ATR % exceeds **0.10%**, signaling rising volatility and potential breakout conditions.
- **Pump % Detector (Red):**
Measures the percentage change from **open to close** of the current candle. Triggers alerts when the move exceeds **+0.10%** (pump) or **–0.10%** (dump), helping you catch sudden price spikes in real time.
🔹 **Top-right display** shows both metrics in a clean table
🔹 Works on **any timeframe**
🔹 Ideal for **momentum trading, breakout entries**, or filtering low-vol setups
ATR & PTR TableThe ATR & PTR Table Indicator displays a dynamic table that provides Average True Range (measures market volatility over 1D, 1W, and 1M timeframes), Price trading range (difference between the high and low prices over the same periods) & percentage of the typical range that has been traded. This indicator will help traders identify potential breakout zones and assess volatility across multiple timeframes.
This had been optimized to show ATR and PTR on every time frame. The (1D) represents ATR on whatever timeframe you are currently on.

ATR Trend Reversal Zone indicatorThis indicator helps avoid taking reversal trades too close to the 21 EMA, which may fail since the market often continues its trend after retracing from the 21 EMA level. It does not generate a direct signal for reversal trades but rather indicates points where you can consider potential reversal trades based on your trading methodology
This script defines an indicator that calculates the 21 Exponential Moving Average (EMA) and the Average True Range (ATR) for a given period. It then computes the distance between the most recent closing price and the 21 EMA in terms of ATR units. If this distance is equal to or greater than 3 ATRs, a small green circle is plotted below the corresponding bar on the chart, indicating a potential reversal condition.
Remaining ATR [vnhilton]ATR levels can be used on a trading day to look for overextensions beyond the average, where you can look to take profits. Remaining ATR is calculated as the current day range subtracted by the previous day ATR. RATR is then plotted away from the high & low lines. All lines (except for the day open) are dynamic, so RATR lines will move according to how much RATR remains.
Note: This indicator only works on intraday timeframes
(FEATURES)
- Works on either RTH or ETH sessions
- Select Day ATR period, & 3 multipliers that will be applied to RATR values away from respective intraday high & low
- Extend current lines to the right
- Show recent lines only
- Change line style, colours within & out the intraday range, & thickness
- Change label offset, size, & colours within & out the intraday range
- Hide RATR lines & labels when within intraday range
- Plot fill between lines (note: RATR plot fills are from their lines to the intraday high & low, so there'll be overlapping)
To show more lines in the past, go to higher intraday timeframes.
Same chart & timeframe as above but on RTH session only.

ATR Trex [SHK] - Modified Some minor changes :
1. APR Removed Temporarily
2. Whole table moved to new pane ( not overlay )
3. % of changes added to numbers for better decision
4. Some plots added. ( thick green line : higher timeframe ATR, orange line: current timeframe atr, black line: one timeframe lower ATR, purple line: largest candle shadow ( up or down) )
Bugs:
There is no upper time frame for weekly timeframe
There is no lower time frame for 1m
....

ATR SLHi traders,
As you know, ATR trailing stop is very popular indicator. So I decided to make my own one.
The logic is simple.
If the price is above the RMA(src,len), then put a SL at OPEN - ATR value of that time period
otherwise, put a SL at OPEN + ATR value of that time period.
Stay safe ^^
