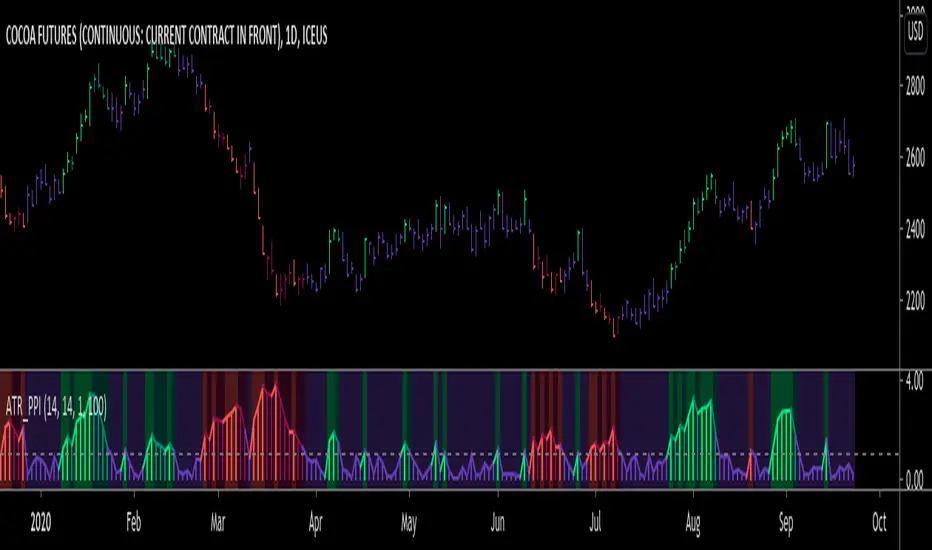
ATR Pivot Point Index [racer8]Description:
ATR Pivot Point Index (ATR_PPI) is based on the theory of mean reversion.
I was inspired to create this indicator after watching a particular YouTube video on the UKspreadbetting channel.
In this video, the trader being interviewed mentioned that he would exit when price is too far from the moving average.
In other words, he exits when he thinks price will revert back to the moving average (mean reversion).
I'm not sure what period moving average he used, so I set it to the standard 14 periods.
I wanted to quantify his strategy so that the user can consistently exit a trade at a fixed distance away from the moving average.
For this indicator, this distance is in ATR units.
This strategy of exiting is known as the mean reversion exit strategy.
Alternatively, if the user wishes to, this indicator can also be used as an entry indicator (Trend entry strategy).
---------------------------------------------------------------------------------------------------------------------------------------------------------------------------------
Parameters:
1. Sma Period - controls length of moving average (Affects histogram).
2. Atr Period - controls length of Atr, doesn't have much affect on indicator (Affects histogram).
3. Atr Pivot Point Level - controls horizontal line, it determines how far away in Atr units you want to exit/enter from the sma for every trade.
---------------------------------------------------------------------------------------------------------------------------------------------------------------------------------
Interpreting signals:
(Trend entry strategy) When histogram is...
Green - enter long
Red - enter short
Purple - No signal
(Mean reversion exit strategy) When histogram is...
Green - exit long
Red - exit short
Purple - No signal
---------------------------------------------------------------------------------------------------------------------------------------------------------------------------------
Calculation:
Distance = Absolute value of (current close - moving average(14))
ATR_units = Distance / ATR(14) ...........Plot as histogram.
Add horizontal line set at (2)*ATR .......Plot line.
Is histogram > line?
Yes, histogram color is green/red.
No, histogram color is purple.
Note: For mean reversion exit strategy, I recommend HIGHER Atr Pivot Point Level values. Vice versa for trend entry strategy.
Enjoy :)
Pesquisar nos scripts por "atr"
ATR Momentum StatusThis indicator measures whether volatility (ATR) is increasing or decreasing, and classifies momentum strength into four clear states:
- WEAK
- STRONG
- EXPANSION
- DECREASING
It helps traders avoid fake moves and only trade when real participation enters the market, especially when used together with FVG CE Acceptance (SMC).
ATR Momentum States (Very Important)
Status Meaning Market Condition
WEAK Small ATR increase Low participation
STRONG Healthy ATR increase Real buyers/sellers entering
EXPANSION Large ATR spike Aggressive momentum / breakout
DECREASING ATR falling Momentum dying / trap risk
What This Indicator Is NOT
❌ Not a buy/sell signal
❌ Not direction bias
❌ Not entry by itself
👉 It is a trade quality filter
✅ Best Use Case (SMC / FVG Traders)
This indicator shines when combined with:
- FVG
- CE (Consequent Encroachment)
- Liquidity Sweep
- Acceptance Candle
Important Risk Filter (Golden Rule):
ATR Status Trade Quality
EXPANSION + Acceptance ⭐⭐⭐⭐⭐ (Best)
STRONG + Acceptance ⭐⭐⭐⭐
WEAK + Acceptance ❌ Avoid
DECREASING ❌ No Trade
Why This Works (Conceptually):
- FVG CE acceptance = price is accepted
- ATR expansion = participation is real
- Together = institutional momentum, not retail noise

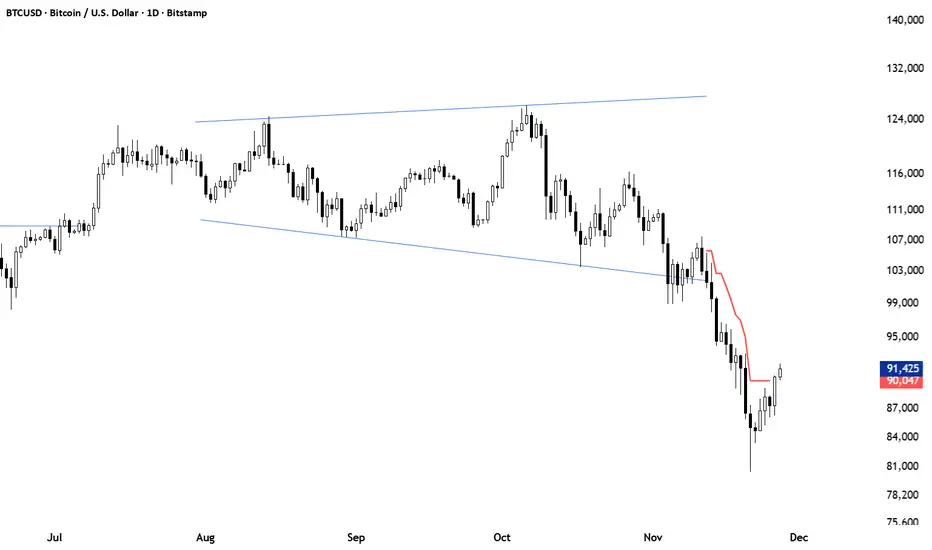
ATR Trailing Stop (Long or Short Selectable)The ATR Trailing Stop (Long or Short Selectable) will start calculating on a set date that you specify. This is great because you want to trail the price from the breakout day or even after exceeding specific price level (can be your breakeven level or even to capture more of the upside after the price target is met).
Entry price: If you act at the close of the day, you can leave this value as 0 and it will take the close of the day for the initial protective stop-loss calculation. You can choose to add a value such as the pattern boundary and in that case it will subtract the initial protective stop-loss from the pattern boundary and not the close of the day. If you use a scaling in tactic during the day (buying in tranches intraday as the breakout takes place) and your average purchase price is different than the close of the day, you can also plug that number in to calculate the initial protective stop-loss.
This is a modified version as many followers asked for ATR trailing for short setups. Now you can select the Long/Short trade setup from the drop down menu.
ATR period: You can select the ATR period. It can be 10 day, 14 day or 30 day or any ATR period of your choice.
ATR Multiplier for Stop-loss: This is the multiplier that you want to trail the price with. From the highest level price reached it will trail the price with a 3 x ATR () distance. The higher the number, the wider the trailing stop-loss. A multiplier of 1 will trail the price so close that and adverse movement can result in triggering the stop-loss.
Custom Value for First day Trailing Stop: This is my favorite part. For aggressive risk management, your initial protective stop can be smaller than what the ATR Trailing Stop will use in its calculation after entry day. In this case you can take 1xATR () or even with FX and Futures you can apply 0.5xATR() as the first day to calculate initial protective stop. The protective stop turns into a trailing stop after the first day.
ATR-limited Donchian ChannelThe ATR-limited Donchian Channel is a modified version of the classic Donchian Channel that adapts more quickly to changing market conditions.
While a traditional Donchian Channel is based only on the highest high and lowest low over a given lookback period, this version introduces an ATR-based constraint that prevents the channel lines from extending too far away from price. This makes the channel more responsive and reduces lag compared to the standard Donchian Channel.
How it works
The upper band is based on the highest high of the last N candles, but it cannot exceed a maximum distance of ATR × Factor above the current median price (midpoint of high and low).
The lower band is based on the lowest low of the last N candles, but it cannot drop more than ATR × Factor below the median price.
If the Donchian Channel would normally extend further than this ATR-limited boundary, the line is capped and marked in blue .
Otherwise, the upper band is drawn in red and the lower band in green .
A middle line is also plotted as the average of the modified upper and lower bands.
An optional offset allows you to shift the channel backward or forward in time for easier visual alignment.
Why use this version?
Faster reaction: By constraining the channel with ATR, the indicator adapts quicker to volatility changes and avoids long periods of overextended levels.
Noise control: ATR filtering prevents extreme spikes or outlier highs/lows from stretching the channel unnecessarily.
Visual clarity: Color-coding highlights when ATR filtering is active, making it easy to distinguish capped vs. natural Donchian levels.
Typical use cases
Trend-following breakout systems, but with volatility-aware limits.
Identifying dynamic support and resistance zones that adjust to market conditions.
Filtering false breakouts by monitoring when the Donchian channel is capped by ATR.
✅ This indicator is designed for traders who want the structure of a Donchian Channel but with an adaptive, volatility-sensitive adjustment that makes it react faster and more reliably than the classic version.

ATR-Multiple from 50SMAThis indicator provides a nuanced view of price extension by calculating the distance between the current price and its 50-period Simple Moving Average. This distance is not measured in simple percentage terms but is quantified in multiples of the Average True Range (ATR), offering a volatility-adjusted perspective on how far an asset has moved from its mean.
The primary goal is to help traders identify potentially overextended conditions, which can often precede price consolidation or reversals. As a general guideline, when an asset's price stretches to multiples of 7 ATRs or more above its 50-day SMA, it often enters a zone where significant profit-taking may occur. By visualizing this extension, the indicator can serve as a powerful tool for gauging when to consider taking profits on existing long positions. Furthermore, it can act as a cautionary signal, helping traders avoid initiating new long positions in assets that are already significantly stretched and may be poised for a pullback.
Features
Volatility-Adjusted Extension
Measures the distance from the 50 SMA in terms of ATR multiples, providing a more standardized way to compare extension across different assets and time periods.
Daily Timeframe Consistency
By default, the indicator uses the daily SMA and ATR for its calculations, regardless of the chart's current timeframe. This ensures a consistent and meaningful measure of extension rooted in the daily trend.
Histogram Visualization
Displays the result as a clear histogram in a separate pane, making it easy to track the extension level over time and identify historical extremes.
Dynamic Color-Coding
The histogram bars are color-coded to visually highlight different levels of extension. The colors shift as the price moves further from the mean, providing an intuitive at-a-glance reading.
Key Threshold Markers
Includes pre-set horizontal lines at the 7 and 10 ATR multiples to clearly mark the zones of potential profit-taking and extreme extension, respectively.
Built-in Alerts
Comes with configurable alert conditions that can notify you when the price reaches the "profit-taking" threshold (7 ATRs) or the "extreme extension" threshold (10 ATRs).
Customization Options
MA & ATR Periods
You can adjust the length for the Simple Moving Average (default 50) and the Average True Range (default 14) to suit your specific analytical needs.
Timeframe Source
A toggle allows you to switch between always calculating using daily data (the default and recommended setting) or using the data from the current chart's timeframe.
Color Display Style
You can choose between a smooth color gradient that transitions elegantly with the extension level or a distinct, step-based color display for a clearer visual separation of the defined zones.
Full Color Scheme Control
Every visual element is fully customizable. You can change the colors for the regular extension, the "get ready," "profit-taking," and "extreme" levels, as well as the horizontal reference lines.

ATRs in Days📌 ATR in Days
This script tracks how price moves in relation to ATR over multiple days, providing a powerful volatility framework for traders.
🔹 Key Features:
✅ 4 ATRs in 5 Days – Measures if a stock has moved 4x its ATR within the last 5 days, identifying extreme volatility zones.
✅ Daily ATR Calculation – Tracks average true range over time to gauge market conditions.
✅ Clear Table Display – Real-time ATR readings for quick decision-making.
✅ Intraday & Swing Trading Compatible – Works across multiple timeframes for day traders & swing traders.
📊 How to Use:
Look for stocks that exceed 4 ATRs in 5 days to spot extended moves.
Use ATR as a reversion or continuation signal depending on market structure.
🚀 Perfect for traders looking to quantify volatility & structure trades effectively!

ATR Adaptive EMA (AEMA)In the world of trading, it's essential to stay ahead of the curve and adapt to the ever-changing market conditions. One of the key aspects of successful trading is using the right tools to analyze and predict market trends. Traditional moving averages, such as the exponential moving average (EMA), have been a staple of technical analysis for decades. However, the limitations of fixed EMA lengths have prompted traders to look for more adaptable and dynamic alternatives. This is where our innovative Adaptive EMA Length Indicator, based on ATR, comes into play.
An Overview of the Adaptive EMA Length Indicator
Our Adaptive EMA Length Indicator is a powerful and versatile tool that utilizes the Average True Range (ATR) to dynamically determine the ideal EMA length based on current market conditions. This unique approach offers traders an edge by providing a more accurate representation of market trends, enabling them to make more informed trading decisions.
Key Features of the Adaptive EMA Length Indicator
Utilizing ATR for Enhanced Volatility Analysis: The Average True Range (ATR) is a well-established measure of market volatility. By incorporating ATR in our indicator, we ensure a more accurate representation of market conditions, allowing traders to better adapt their strategies to the prevailing volatility levels.
Customizable Parameters: Our Adaptive EMA Length Indicator allows traders to adjust key parameters, such as minimum and maximum EMA lengths, ATR length, outlier length, and outlier deviation level. This level of customization gives traders the ability to fine-tune the indicator according to their trading style and preferences.
Versatile Application Across Markets: The Adaptive EMA Length Indicator is designed to work with various financial markets, including stocks, commodities, and cryptocurrencies. Its versatility makes it a valuable addition to any trader's toolkit, regardless of their chosen market.
How to Use the Adaptive EMA Length Indicator
Set your preferred parameters: Begin by adjusting the minimum and maximum EMA lengths, ATR length, outlier length, and outlier deviation level to fit your trading style.
Apply the indicator to your chosen market: Add the Adaptive EMA Length Indicator to your chart and observe the dynamic EMA line adjusting based on current market conditions.
Use the dynamic EMA for trade entry and exit points: Monitor the EMA line in relation to the price action. When the price crosses the EMA line from below, consider it a potential buy signal. Conversely, when the price crosses the EMA line from above, it could indicate a sell signal. However, it's crucial to consider other technical analysis tools and market factors before making any trading decisions.
Continuously assess and adjust: As with any trading strategy, it's essential to keep monitoring market conditions and adjusting your parameters accordingly. Stay vigilant and be prepared to adapt your strategy as needed.
Our Adaptive EMA Length Indicator, based on ATR, offers a revolutionary approach to determining the ideal EMA length. By providing a more accurate representation of market trends, this innovative tool empowers traders to make better-informed decisions and stay ahead of the market. Try it out for yourself and see why it's a game-changer for traders seeking adaptable, dynamic, and effective trading strategies.

ATR Stop Loss and Take Profit FinderThe purpose of this tool is to help the trader determine a safe stop loss price and take profit which dynamically changes due to ATR (Average True Range)
This tool uses the concept of
ATR (Average True Range)
Risk Reward Ratio (Money Management method)
How is ATR Stop Loss and Take Profit Finder working
Step 1 ) Tool will calculate TR(True Range
Step 2) Then the TR will be used to find the Average value of X time frame, using 5 math models: RMA SMA EMA WMA and LSMA
Step 3) The value from Step 2 will be multiplied by the factor, and the result is ATR
After we got ATR Value, the Tool will find 2 lines: Upper Band and Lower Band which will function as a Stoploss value for both Short and Long trade
ATR Stop Loss and Take Profit Finder will be using Upper Band and Lower Band to calculate Take profit price. A trader can set their Target Risk Reward Ratio by setting
How to use ATR Stop Loss and Take Profit Finder
ATR Stop Loss and Take Profit Finder is not an indicator, it is only a tool to help the trader quickly find their stop loss/take profit price. t
For open long position, We comment trade to switch mode of 'Type of open Position to be long. Same as short which is need to be changed to short

ATR Daily Levels Band NakitxuAverage True Range
What Is the Average True Range (ATR)?
The average true range (ATR) is a technical analysis indicator, that measures market volatility by decomposing the entire range of an asset price for that period.
The true range indicator is taken as the greatest of the following: current high less the current low; the absolute value of the current high less the previous close; and the absolute value of the current low less the previous close.
The ATR is then a moving average, generally using 14 days, of the true ranges.
This script is an especial request of a TradingView user.
Shows 5 levels based on ATR daily, plotted in wherever timeframe you are using:
level 1: prv day ATR + prv day close
level 2: prv day ATR + prv day high
level 3: level 2 - prv day ATR
level 4: prv day close - prv day ATR
level 5: prv day low - prv day
Only show the levels if you are in a timeframe daily or lower than daily.

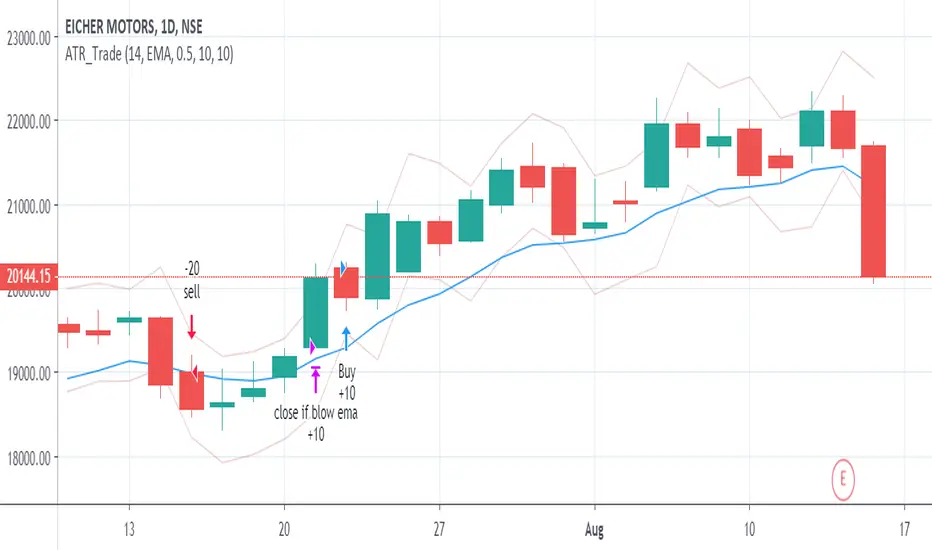
ATR_Trade_strategyATR Based Strategy
Identify the ATR range on Daily Chart.
ATR HIGH= Previous Close +ATR
ATR Low =Previous Close - ATR
Long when Close is above ATR High
Short when Close is below ATR Low
Exit when close moves below EMA(10) OR
a user-selected max loss
Average True Range Percentage (ATRP)ATR measures volatility, but you can't compare one instrument vs. another with it because the ATR value will be different depending on the price of the instrument. I went searching for something like ATR but with percentages, so you could compare one stock vs. another to find who is more volatile and found this .
It was exactly what I was looking for, so decided to re-create it in TradingView. Enjoy!
Description
Average True Range Percent (ATRP) expresses the Average True Range (ATR) indicator as a percentage of a bar’s closing price.
How this indicator works
ATRP is used to measure volatility just as the Average True Range (ATR) indicator is. ATRP allows securities to be compared, where ATR does not.
ATR measures volatility at an absolute level, meaning lower priced stock will have lower ATR values than higher price stocks. ATRP displays the indicator as a percentage, to allow for securities trading at different prices per share to be compared.
Calculation
ATRP = (Average True Range / Close) * 100

ka66: ATR Stop ChannelATR Stop Channel: Often used as a dynamic stop loss management tool, this indicator:
Calculates the ATR over a configurable period, default 14
Based on configurable multipliers, draws a channel of (close + atr-multiple, close - atr-multiple)
The reference point of close is also configurable to allow a different source, e.g. you can use an EMA if you wanted to make a Keltner channel.
The upper channel line can be used for short position stop management, while the bottom one is for long positions. Multipliers can also be configured separately for long vs. short, given that one common market anomaly is that short positions can often have more aggressive stops.
ATR is calculated as the Simple Moving Average of TRs, no fancy weighted averaging. The tradingview atr function uses RMA, an EMA variant used in RSI, I prefer simpler averaging. The lag can be a feature if used well. Additionally, it's easier to reason about.
Note: For a more dedicated and full-featured multi-ATR|Keltner channels however, see my: "ka66: Multi ATR Channels", which is likely better suited for price analysis and channel trading.

ATR ZigZag BreakoutATR ZigZag Breakout
This strategy uses my ATR ZigZag indicator (powered by the ZigZagCore library) to scalp breakouts at volatility-filtered highs and lows.
Everyone knows stops cluster around clear swing highs and lows. Breakout traders often pile in there, too. These levels are predictable areas where aggressive orders hit the tape. The idea here is simple:
→ Let ATR ZigZag define clean, volatility-filtered pivots
→ Arm a stop market order at those pivots
→ Join the breakout when the crowd hits the level
The key to greater success in this simple strategy lies in the ZigZag. Because the pivots are filtered by ATR instead of fixed bar counts or fractals, the levels tend to be more meaningful and less noisy.
This approach is especially suited for intraday trading on volatile instruments (e.g., NQ, GC, liquid crypto pairs).
How It Works
1. Pivot detection
The ATR ZigZag uses an ATR-based threshold to confirm swing highs and lows. Only when price has moved far enough in the opposite direction does a pivot become “official.”
2. Candidate breakout level
When a new swing direction is detected and the most recent high/low has not yet been broken in the current leg, the strategy arms a stop market order at that pivot.
• Long candidate → most recent swing high
• Short candidate → most recent swing low
These “candidate trades” are shown as dotted lines.
3. Entry, SL, and TP
If price breaks through the level, the stop order is filled and a bracket is placed:
• Stop loss = ATR × SL multiplier
• Take profit = SL distance × RR multiplier
Once a level has traded, it is not reused in the same swing leg.
4. Cancel & rotate
If the market reverses and forms a new swing in the opposite direction before the level is hit, the pending order is cancelled and a new candidate is considered in the new direction.
Additional Features
• Optional session filter for backtesting specific trading hours

ATR Money Line Bands V2The "ATR Money Line Bands V2" is a clever TradingView overlay designed for trend identification with volatility-aware bands, evolving from basic ATR envelopes.
Reasoning Behind Construction: The core idea is to blend a smoothed trend line with dynamic volatility bands for reliable signals in varying markets. The "Money Line" uses linear regression (ta.linreg) on closes over a length (default 16) instead of a moving average, as it fits data via least-squares for a cleaner, forward-projected trend without lag artifacts. ATR (default 12-period) powers the bands because it measures true range volatility better than std dev in gappy assets like crypto/stocks—bands offset from the Money Line by ATR * multiplier (default 1.5). A dynamic multiplier (boosts by ~33% on spikes > prior ATR * 1.3) prevents tight bands from false breakouts during surges. Trend detection checks slope against an ATR-scaled tolerance (default 0.15) to ignore noise, labeling bull/bear/neutral—avoiding whipsaws in flats.
Properties: It's an overlay with a colored Money Line (green bull, red bear, yellow neutral) and invisible bands (toggle to show gray lines) filled semi-transparently matching trend for visual pop. Dynamic adaptation makes bands widen/contract intelligently. An info table (positionable, e.g., top_right) displays real-time values: Money Line, bands, ATR, trend—great for quick scans. Limits history (2000 bars) and labels (500) for efficiency.
Tips for Usage: Apply to any timeframe/asset; defaults suit medium-term (e.g., daily stocks). Watch color flips: green for longs (enter on pullbacks to lower band), red for shorts (vice versa), yellow to sit out. Use bands as S/R—breakouts signal momentum, squeezes impending vol. Tweak length for sensitivity (shorter for intraday), multiplier for width (higher for trends), tolerance for fewer neutrals. Pair with volume/RSI for confirmation; backtest to optimize. In choppy markets, disable dynamic mult to avoid over-expansion. Overall, it's adaptive and visual—helps trend-follow without overcomplicating.

atr stop loss for double SMA v6Strategy Name
atr stop loss for double SMA v6
Credit: This v6 update is based on Daveatt’s “BEST ATR Stop Multiple Strategy.”
Core Logic
Entry: Go long when the 15-period SMA crosses above the 45-period SMA; go short on the inverse cross.
Stop-Loss: On entry, compute ATR(14)×2.0 and set a fixed stop at entry ± that amount. Stop remains static until hit.
Trend Tracking: Uses barssince() to ensure only one active long or short position; stop is only active while that trend persists.
Visualization
Plots fast/slow SMA lines in teal/orange.
On each entry bar, displays a label showing “ATR value” and “ATR×multiple” positioned at the 30-bar low (long) or high (short).
Draws an “×” at the stop-price level in green (long) or red (short) while the position is open.
Execution Settings
Initial Capital: $100 000, Size = 100 shares per trade.
Commission: 0.075% per trade.
Pyramiding: 1.
Calculations: Only on bar close (no intra-bar ticks).
Usage Notes
Static ATR stop adapts to volatility but does not trail.
Ideal for trending, liquid markets (stocks, futures, FX).
Adjust SMA lengths or ATR multiple for faster/slower signals.

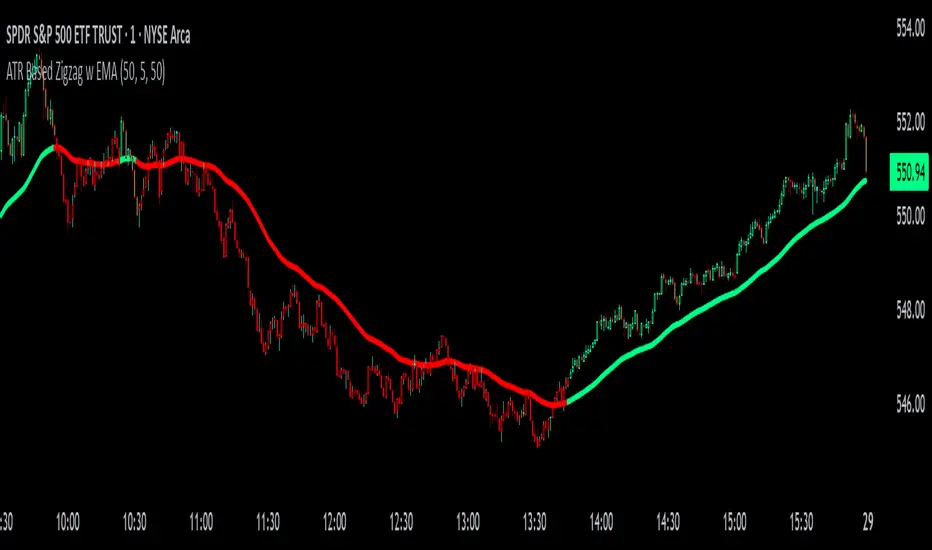
ATR Based Zigzag w EMAThe "ATR Based Zigzag with EMA" indicator is a refined trend-following tool designed for traders who demand clarity, precision, and robust trend detection. This script uses an ATR (Average True Range)-based breakout mechanism to dynamically determine the current market trend, while overlaying a clean, smoothed EMA (Exponential Moving Average) line to visually represent the active directional bias.
The indicator continuously tracks new swing highs and lows based on ATR volatility thresholds. When price moves sufficiently against the current trend — exceeding an ATR-multiplied distance — the trend is considered reversed. This adaptive method ensures that trend flips are based not on arbitrary price action, but on meaningful, volatility-adjusted movements.
Instead of plotting zigzag-style pivots which can create visual noise, the indicator draws a single, smooth EMA line calculated from the median price ((high + low) / 2). The color of the line shifts instantly based on the active trend: green (or your customized color) for uptrends, and red for downtrends. In addition, individual price bars are optionally colored to match the trend, further enhancing at-a-glance clarity without cluttering the chart.
Key user-defined inputs include the ATR length, ATR multiplier (sensitivity for trend flips), EMA smoothing length (responsiveness of the trend line), and full color customization for uptrend and downtrend states.
This indicator excels at providing a clear and immediate understanding of trend conditions, making it highly effective for:
Trend-following strategies
Reversal spotting based on volatility breaks
Entry/exit confirmation
Visual chart cleanliness and minimalism
Whether used standalone or alongside other tools, the "ATR Based Zigzag with EMA" offers a disciplined, volatility-sensitive view of market structure — engineered for traders who refuse to tolerate noise, hesitation, or ambiguity in their decision-making.
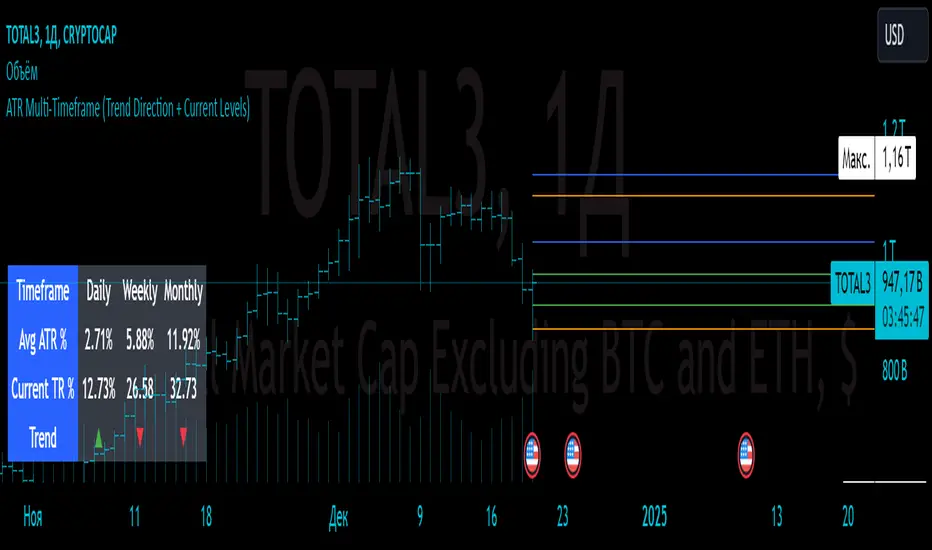
ATR Multi-Timeframe (Trend Direction + Current Levels) Indicator Name
ATR Multi-Timeframe (Trend Direction + Current Levels)
Description
This indicator helps you visualize support and resistance levels based on the Average True Range (ATR) and track the current trend direction across multiple timeframes (daily, weekly, and monthly). It is a valuable tool for traders looking to enhance decision-making and market volatility analysis.
Key Features
Multi-Timeframe ATR Analysis:
Calculates the Average True Range (ATR) and True Range (TR) for daily, weekly, and monthly timeframes.
Trend Direction Indicators:
Displays trend direction using arrows (▲ for uptrend, ▼ for downtrend) with color-coded labels (green for uptrend, red for downtrend).
Support and Resistance Levels:
Dynamically calculates trend levels (Open ± ATR) and opposite levels for each timeframe.
Persistent lines extend these levels into the future for better visualization.
Customizable Settings:
Toggle visibility of daily, weekly, and monthly levels.
Adjust line width and colors for each timeframe.
Summary Table:
Displays a compact table showing ATR percentages, TR percentages, and trend direction for all timeframes.
Why Use This Indicator?
Quickly identify key support and resistance levels across different timeframes.
Understand market volatility through ATR-based levels.
Spot trends and reversals with easy-to-read visual elements.
How to Use:
Add the indicator to your chart.
Enable or disable specific timeframes (Daily, Weekly, Monthly) in the settings.
Adjust line styles and colors to match your preferences.
Use the displayed levels to plan entry/exit points or manage risk.
This indicator is perfect for both swing and intraday traders who want a clear and dynamic view of volatility and trend across multiple timeframes.
ATR Stop LossThe ATR Stop Loss indicator is designed to assist traders in managing risk by calculating dynamic stop loss levels based on the Average True Range (ATR). By considering market volatility, this tool helps identify optimal stop loss placements for both long and short positions, making it easier for traders to protect their investments and avoid premature exits.
Features:
Customizable ATR period and multiplier to adapt to different trading strategies and market conditions.
Displays stop loss levels directly on the chart for quick decision-making.
Works across various timeframes and assets, offering flexible application in diverse trading scenarios.
How It Works: The indicator calculates the ATR over a specified period and multiplies it by a user-defined value to plot stop loss levels above or below the current closing price. For long positions, the stop loss level is set below the price, while for short positions, it is set above. These levels help traders set stops that account for current market volatility, reducing the likelihood of getting stopped out by minor fluctuations.
Usage: Add the ATR Stop Loss indicator to your chart, customize the ATR period and multiplier as needed, and use the visualized stop loss levels to manage your trades with greater precision and confidence.
Disclaimer: The ATR Stop Loss indicator is provided for educational and informational purposes only and should not be construed as financial or investment advice. Trading involves substantial risk and is not suitable for every investor. Users are solely responsible for any trading decisions they make based on the use of this indicator. Past performance is not indicative of future results. Always conduct your own analysis and consult with a qualified financial professional before making any trading decisions. EdgeLab and its creator bear no liability for any financial losses or other damages resulting from the use of this indicator.

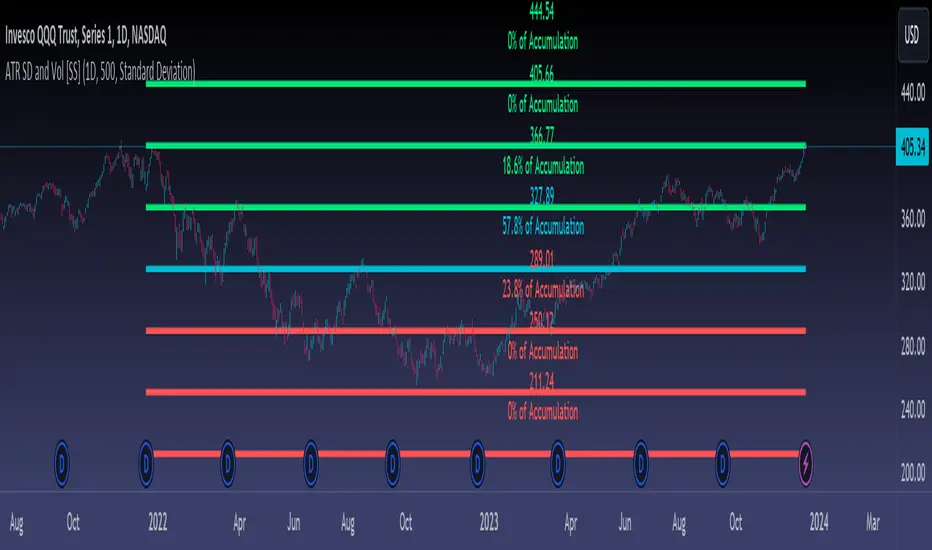
ATR Range Accumulation by Standard Deviation and Volume [SS]So, this is an indicator/premise I have been experimenting with, which mixes ATR with Z-Score and Volume metrics.
What does the indicator do?
The indicator, on the lower timeframes, uses an ATR approach to determine short-term ranges. It takes the average ATR range over a designated lookback period and plots out the levels like so:
It then calculates the Z-Score for these ATR targets (shown in the chart above) and calculates, over the designated lookback period, how often price accumulates at that standard deviation level.
The indicator is essentially a hybrid of my Z-Score Support and Resistance indicator and my frequency distribution indicator. It combines both concepts into one.
You also have the option of sorting by volume accumulation. This will display the accumulation of the ranges by volume accumulation, like so:
Larger Timeframes:
If you want to see the accumulation by volume or standard deviation on the larger timeframes, you can. Simply toggle on your preferred setting:
Show Total Accumulation Breakdown:
This will break down the levels, over the lookback period, by standard deviation. This is similar to the Z-Score support and resistance indicator. It will then show you how often price accumulates at these various standard deviation levels. Here is an example on the daily timeframe using the 1D chart settings:
Inversely, you can repeat this, with the Z-Score levels, but show accumulation by volume. This will print 5 boxes, which are between +3 Standard Deviations and -3 Standard Deviations, like so:
Here we can see that 61% of volume accumulation is between -1 and 1 standard deviation.
Using it to Trade:
For swing trading, I suggest using the larger timeframe information. However, for both swing and day traders, it is also helpful to use the ATR display. You can modify the ATR display to show the levels on any timeframe by selecting which timeframe you would like to see ATR ranges for. If you are trading on the 1 or 5-minute chart, I suggest leaving the levels at no shorter than a 60-minute timeframe.
You can also use these levels on the daily for the weekly levels, etc.
The accumulation being shown will be based on the current chart timeframe. This is a function of Pinescript, but in this case, it's actually advantageous because if you are trading on the shorter timeframe, and a level has 0% recent accumulation, it's unlikely we will see that level soon or overly quickly. Intraday retracements will generally happen to areas of high accumulation.
How this indicator is different:
The difference in this indicator comes from its focus on accumulation in relation to Standard Deviation. There is one thing that is consistent among retail traders, algorithms, market makers, and funds, and that is looking at the market in terms of standard deviation. Each person, market maker, and algorithm may be slightly nuanced in how it conceptualizes standard deviation (whether it be since the inception of the ticker (or IPO), or the previous 500 days, or the previous 100 days, etc.), but the premise remains consistent. Standard Deviation is a really important, if not the most important, metric to pay attention to. Another important metric is volume. Thus, the premise is that combining volume accumulation with standard deviation should, theoretically, be telling. We can see the extent of buying at various standard deviations and whether a stock is really a buy or not.
And that's the indicator! Hope you enjoy it. Leave your comments and questions below.
Safe trades!
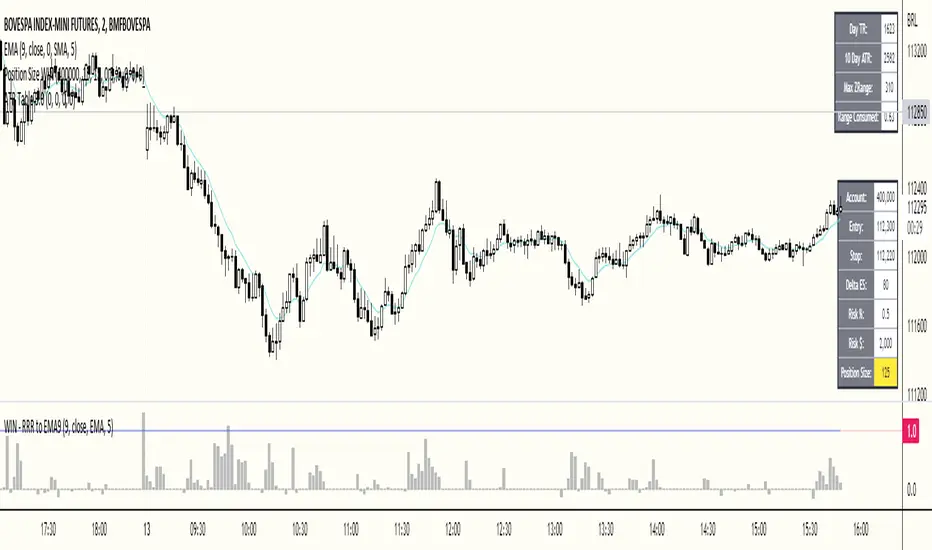
ATR Table 2.0ATR Table 2.0
This script was created in order to display a table that "calculates" how far the price can go on the current day .
The script is a table with 3 lines that calculates:
First Line - Day TR: The True Range of the current day ( - , including an Opening GAP if it exists);
Second Line - 10 Day ATR: The Average True Range of the asset (including Opening GAPs) for the last 10 days;
Third LIne - Range Consumed: How much of the 10 Day ATR it was consumed on the current day.
Example of how to use the information on the table and the understanding of it's purpose:
1) Supose you are day trading an asset that, during the last 10 days, have moved around $1.00 a day - This is the 10 Day ATR.
2) On this day, after 2 hours of the opening market, the price have already moved $0.50 (supose that it has moved $0.30 up and $0.35 down from the close of the prior day and the price is now near the close of the prior day).
3) In this situation, knowing that the price often moves around $1.00 a day, and knowing that it already moved $0.65 ($0.30 up and $0.35 down based on the close of the prior day), you may pay attention when the price breaksthrough the max or the min of the day, cause it can still move $0.35 in that direction ($1.00 - $0.65).
----------------------------------------------
ATR Table 2.0
Esse script foi criado para disponibilizar uma tabela que "calcula" quanto o preço pode andar ainda no dia em questão .
O script é uma tabela com 3 linhas que calcula:
Primeira Linha - TR do Dia: O Range Verdadeira do dia em questão ( - , incluindo GAP de Abertura se for o caso);
Segunda Linha - ATR de 10 Dias: A média do Range Verdadeira do ativo (incluindo GAPs de abertura) dos últimos 10 dias;
Terceira Linha - Range Consumido: O quanto do ATR de 10dias já foi consumido no dia em questão.
Exemplo de como usar essa informação na tabela e o entendimento do seu propósito:
1) Suponha que você está realizando day trade de um ativo que, durante os últimos 10 dias, se move em torno de $1.00 por dia. Esse é o ATR de 10 dias.
2) Nesse dia, após 2 horas da abertura do pregão, o preço já se moveu $.050 (suponhamos que ele tenha se moveu $0.30 para cima e $0.35 para baixo a partir do fechamento do dia anterior e agora o preço está próximo do fechamento do dia anterior).
3) Nessa situação, sabendo que o preço se move por volta de $1.00 por dia, e sabendo que ele já se moveu $0.65 ($0.30 pra cima e $0.35 pra baixo a partir do fechamento do dia anterior), você deve se atentar para quando o preço romper a máxima ou a mínima do dia, pois ele pode se mover ainda $.035 na direção do rompimento ($1.00 - $0.65).
ATR BandsIt has happened to everybody. You enter the market, the position gets a stop loss, then later the market goes in the direction you originally planned. Worse yet - you enter a position, the market goes in your favor, gets near the target, and then it reverses and you get stopped.
We brazilians call this a "violinado", or getting violinated. It happens either because:
1. You put the stop loss too close, or the target too far
2. You entered in the right direction, but at a wrong time
While the second point cannot be programmly adressed, the first can. One popular way of setting a stop loss is by using the average of the true range, it even has a built-in indicator in TV. The problem with it is that you can still get violinated, since as the trend develops, the stop loss only goes up, never down. So if you enter at the wrong time, one slip can still take you out of the market.
Since I got sick of losing money using a conventional stop loss, I made these ATR bands. When you add this indicator to your graph, 6 lines are going to show up, 3 above the price, 3 below it. These lines are calculated from the ATR of the last 20 periods (can be configurated). The upper lines are the high of the last candle + the ATR * the multiplicator factor, the lower lines are the low - ATR * multiplicator factor. There are three multiplicator factors: 1.0, 1.618 and 2.0, and you change them to be whatever you want.
The logic behind it is that theses bands represents the region in which the market is more likely to stay. So if you enter the market at 50.00, you can't expect it to reach 500.00 in the next hour if the ATR is 5.00. And if you set the stop loss at 49.99, it is very likely that the market is going to stop you. By using the ATR bands, you can get a more reasonable price range, so you would set the stop loss at 45.00 and the take profit level at 60.00.
There are two types os ATR you can use: the regular, calculated with RMA, and another using a custom WMA, which puts greater emphasis on large amplitudes. By default, the average uses the past 20 true ranges. You can also choose to use either the closing price or the extremes of the candle as a basis.
Another thing I've added is the violation statistics, which shows the percentages of the times that a band was violated in the next 5 candles (can be configurated). With this, you can get a broader view on the probability of the bands actually being reached.
You may have notice that the bands are lagged by 1 period. I did this so that there is no way you can use future data. You can disable it or increase it, but I recommend just letting it be 1. These bands are the range in which the price is most likely to stay in, if you change the lag you are essentially breaking it's whole purpose.

ATR Trailing Stop + HTF + Pivots (Non-Repainting📌 UT Bot PRO + HTF + Pivots + PP SuperTrend (Non-Repainting)
This indicator is a fully non-repainting trading system designed for intraday and swing traders.
It combines multiple high-probability confirmations into a single, clean signal engine.
🔍 What’s Inside
✔ ATR-based trailing stop (UT-Bot style logic)
✔ Heikin Ashi price smoothing
✔ Heikin Ashi VWAP trend confirmation
✔ Higher-Timeframe EMA filter (no lookahead)
✔ Volume strength confirmation
✔ Auto timeframe Standard Pivot Points (PP, R1, R2, S1, S2)
✔ Pivot Point SuperTrend for market direction
✔ ATR-based Stop Loss & Take Profit levels
🔒 Non-Repainting Guarantee
Signals trigger only on confirmed candle close
Higher timeframe data uses lookahead_off
Pivot calculations are confirmed (no future data)
Signals will not disappear or shift after printing
📈 Trading Logic
BUY Signal
Price crosses above ATR trailing stop
Pivot SuperTrend is bullish
Price above HA VWAP
HTF EMA trend is bullish
Volume above average
SELL Signal
Price crosses below ATR trailing stop
Pivot SuperTrend is bearish
Price below HA VWAP
HTF EMA trend is bearish
Volume above average
⚙️ Recommended Settings
Intraday (5m–15m): HTF = 15m
Scalping (1m–5m): HTF = 5m
Swing (15m–1H): HTF = 1H
SL: 1.5 × ATR
TP: 3 × ATR
🧠 Best Used For
Crypto
Forex
Indices
Stocks
Works best in trending markets. Avoid very low-volume or choppy sessions.
⚠️ Disclaimer
This indicator is for educational purposes only.
No trading strategy guarantees profits. Always use proper risk management and test before live trading.

Atr Target TP & Protecion Zone [Pinescriptlabs]This indicator provides an adaptive trailing stop system with dynamic price targets and protection zones, ideal for position management.
Main Features:
🚦 ADAPTIVE TRAILING STOP:
Automatically adjusts based on volatility (ATR) and volume
Two modes: "Modified" and "UnModified" for true range calculation
Displayed as a line with colored background (green for longs, red for shorts)
🎯 TARGET ZONES (T1 & T2):
Calculates two target zones (T1 and T2) based on:
Market strength (combination of RSI, volume, MFI, ADX, MACD)
Current volatility (ATR)
Distance from current price
Visualized with blue boxes (T1) and purple boxes (T2)
🛡️ PROTECTION ZONE:
Automatically activates in sideways markets
Provides an additional buffer to the trailing stop
Helps avoid premature exits in volatile markets
📊 INFORMATION PANELS:
Top Right Panel displays:
Current trend direction
Target status (T1 & T2)
Market strength
Current ATR
RSI level
Bottom Right Panel displays:
Trailing status (WIDE/NORMAL)
Volume impact
Directional strength
Protection zone status
Español:
Este indicador proporciona un sistema de trailing stop adaptativo con objetivos de precio dinámicos y zonas de protección, ideal para la gestión de posiciones.
**Características Principales**:
🚦 **TRAILING STOP ADAPTATIVO**:
- Se ajusta automáticamente según la volatilidad (ATR) y el volumen
- Dos modos: "Modified" y "UnModified" para el cálculo del rango verdadero
- Se visualiza como una línea con fondo coloreado (verde para largos, rojo para cortos)
🎯 **ZONAS OBJETIVO (T1 y T2)**:
- Calcula dos zonas objetivo (T1 y T2) basadas en:
- Fuerza del mercado (combinación de RSI, volumen, MFI, ADX, MACD)
- Volatilidad actual (ATR)
- Distancia al precio actual
- Visualización mediante cajas azules (T1) y moradas (T2)
🛡️ **ZONA DE PROTECCIÓN**:
- Se activa automáticamente en mercados laterales
- Proporciona un buffer adicional al trailing stop
- Ayuda a evitar salidas prematuras en mercados volátiles
📊 **PANELES INFORMATIVOS**:
*Panel Superior Derecho* muestra:
- Dirección de la tendencia actual
- Estado de los objetivos (T1 y T2)
- Fuerza del mercado
- ATR actual
- Nivel de RSI
*Panel Inferior Derecho* muestra:
- Estado del trailing (WIDE/NORMAL)
- Impacto del volumen
- Fuerza direccional
- Estado de la zona de protección
