Extreme Reversion Flag - EMA Spread + ATR Threshold (15s)Short Description
Visual indicator that flags extreme EMA divergence on the 15s chart. It plots the EMA20 − EMA4 spread, overlays a multiplied ATR threshold, and highlights bars where 20 > 9 > 4 (bear extreme) or 4 > 9 > 20 (bull extreme) and the spread ≥ mult × ATR.
Features
- Pane plot of the EMA20−EMA4 spread and the ATR‑based threshold.
- Histogram showing spread/ATR ratio for numeric tuning.
- Visual fill between spread and threshold when the extreme condition is met.
- Top/bottom markers for exact bars that meet the rule.
- Alert conditions for bull and bear extremes.
- User inputs for EMA lengths, ATR length, and multiplier for sensitivity.
Pesquisar nos scripts por "atr"

Opening Candle Zone with ATR Bands by nkChartsThis indicator highlights the opening range of each trading session and projects dynamic ATR-based zones around it.
Key Features
Plots high and low levels of the opening candle for each new daily session.
Extends these levels across the session, providing clear intraday support and resistance zones.
Adds ATR-based offset bands above and below the opening range for volatility-adjusted levels.
Customizable colors, ATR length, and multiplier for flexible use across markets and timeframes.
Adjustable session history limit to control how many past levels remain on the chart.
How to Use:
The opening range high/low often acts as strong intraday support or resistance.
The ATR bands give an adaptive volatility buffer, useful for breakout or mean-reversion strategies.
Works on any market with clear session opens.
This tool is designed for traders who want to combine session-based price action with volatility insights, helping identify potential breakouts, reversals, or consolidation areas throughout the day.
⚠️ Disclaimer: This indicator is for educational purposes only. It does not provide financial advice or guarantee profits. Always perform your own analysis before making trading decisions.

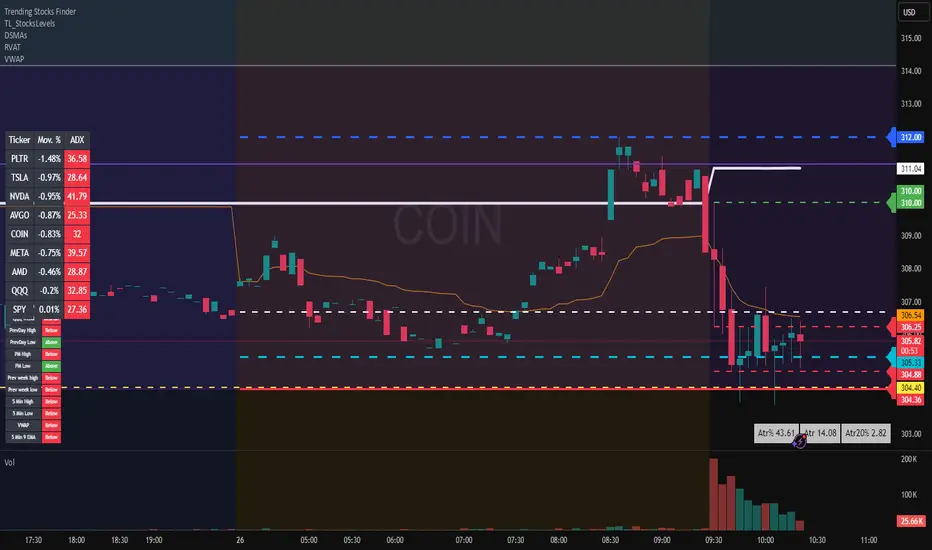
Daily ATR TrackerThis indicator calculates the daily ATR of the past 14 days. The ATR% indicates the range completed for the day. The ATR indicates the average daily range. The 20% ATR indicates the value of 20% of the daily ATR for retracement purposes.
ATR: Body % + Ranges and AnomaliesATR: Body % + Ranges and Anomalies
This indicator provides a dual analysis of price bars to help you better understand market dynamics and volatility. It combines two powerful concepts into one tool: a candle body percentage and a range analysis with an anomaly-excluding average.
Key Features:
1. Candle Body Percentage
This feature plots the size of the candle's body as a percentage of its total high-low range.
A high percentage (e.g., above the 50% gray line) indicates strong, directional movement. The more solid the body is relative to its wicks, the more conviction is behind that move.
The 100% red line marks "Marubozu" candles—bars with no wicks, showing absolute control by buyers or sellers.
2. Range Analysis with Anomalies
This is a unique part of the indicator that helps you identify and understand normal vs. abnormal volatility.
Custom SMA: It calculates an average range of the last N bars, but it smartly excludes "anomalous" bars (spikes or unusually small ranges) from the calculation. This gives you a more reliable baseline for normal volatility.
Anomaly Detection: Bars are colored differently based on their range:
Blue: Small anomalies (range less than 0.5 * ATR). These often occur during periods of low liquidity or indecision.
Red: Large anomalies (range greater than 1.8 * ATR). These can signal a sudden burst of volatility, breakout events, or capitulation.
ATR Range % Label: The label on the chart shows the current bar's range as a percentage of the custom SMA. This tells you how much larger or smaller the current bar's range is compared to a clean average.
How to Use:
Spotting Trends: Use the Body % to confirm the strength of a trend. A series of bars with high body percentages can indicate a strong, healthy trend.
Identifying Volatility: Use the Range Analysis to find areas of interest. A large red anomaly bar could signal a significant event, while a series of blue anomalies might suggest the market is in a tight consolidation before a breakout.
Contextual Analysis: The combination of these tools can provide powerful context. For example, a bar with a high Body % and a red anomaly color suggests a strong, volatile move that could be a turning point or the start of a major trend.
Experiment with the input settings to fine-tune the ATR and SMA periods for different timeframes and assets.

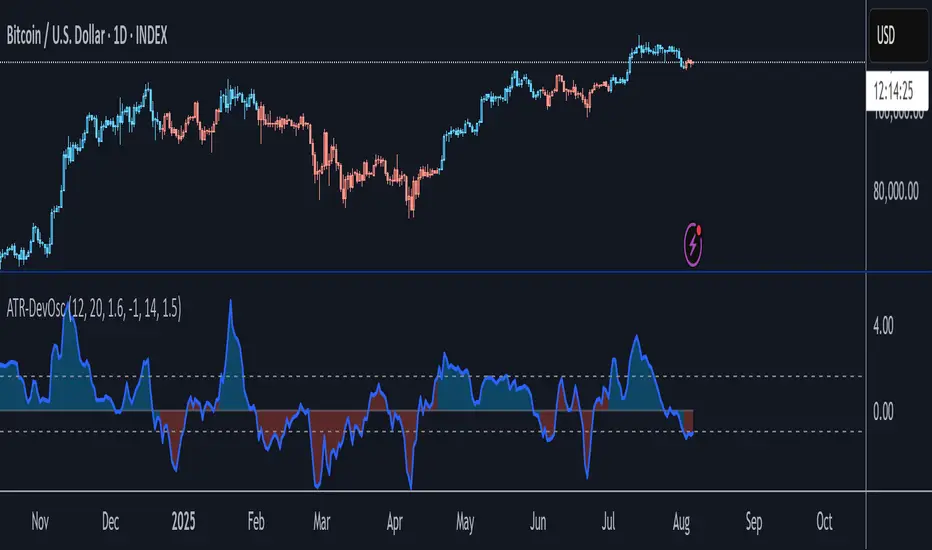
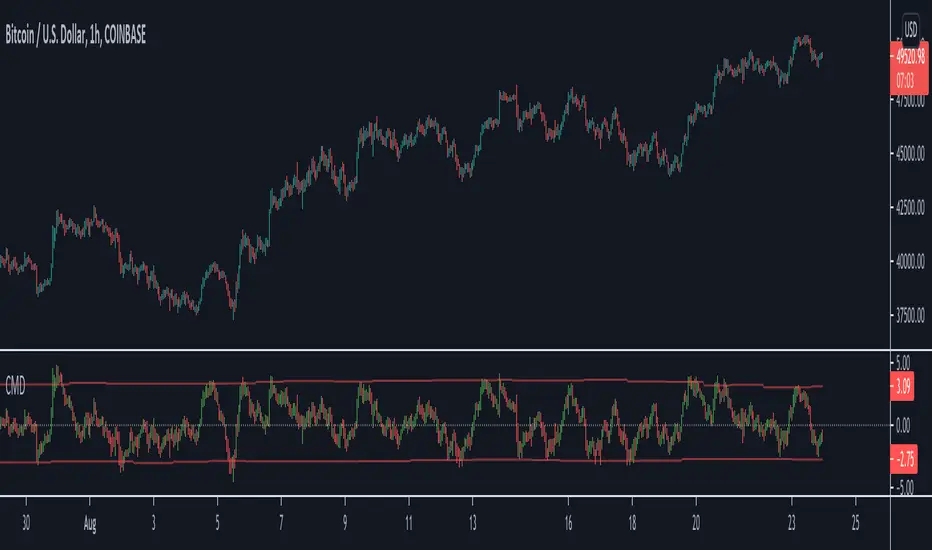
ATR-Scaled Deviation OscillatorATR-DevOsc is a custom momentum-and-volatility adaptive oscillator that scales N-bar price momentum by its rolling deviation and then reacts dynamically to sudden ATR spikes. By shrinking the deviation window when true volatility surges, it amplifies extreme moves—making medium-term trend shifts and deep drawdowns far more likely to breach your predefined thresholds.
Key features include:
• configurable momentum length and separate deviation length for precise control over look-back periods
• ATR Reaction Multiplier to tune how strongly sudden volatility spikes contract the deviation, boosting oscillator amplitude during extreme moves
• independent upper and lower threshold inputs for clear long/short signal definitions
• integrated candle-coloring overlay to immediately visualize trend state on your price chart
• built-in alert conditions for both oscillator-threshold crossovers and ATR-reactive triggers
This indicator is particularly useful for swing traders seeking medium-term entry and exit points in highly volatile markets like BTC. It combines normalized momentum readings with true volatility feedback, so large drawdowns or breakouts generate unmistakable signal events while routine noise stays filtered.
Note: ATR-DevOsc is provided “as is” without formal robustness or optimization testing. Past performance is not indicative of future results; use in live trading only after sufficient back-testing and validation.
ATR Stop-Loss & TargetsATR and Supertrend-based SL/TP & Trailing System
This indicator combines Average True Range (ATR) and Supertrend logic to help traders define precise stop-loss, first target, and trailing stop-loss (TSL) levels.
⚙️ Key Features:
📏 ATR-based Stop-Loss & Target Lines:
Uses ATR (default period: 5) based on the previous day's candle for more stable risk management.
Traders can choose the price source: Close, Open, or enter a manual price.
SL and first target are calculated using multipliers:
Multiplier 1 = Stop Loss
Multiplier 2 = First Target
📉 Supertrend for Trailing Stop:
Built-in Supertrend logic for trailing stop-loss management.
Uses ATR(10) with a multiplier of 2.1, based on HL2.
Supertrend can be toggled ON/OFF from the settings.

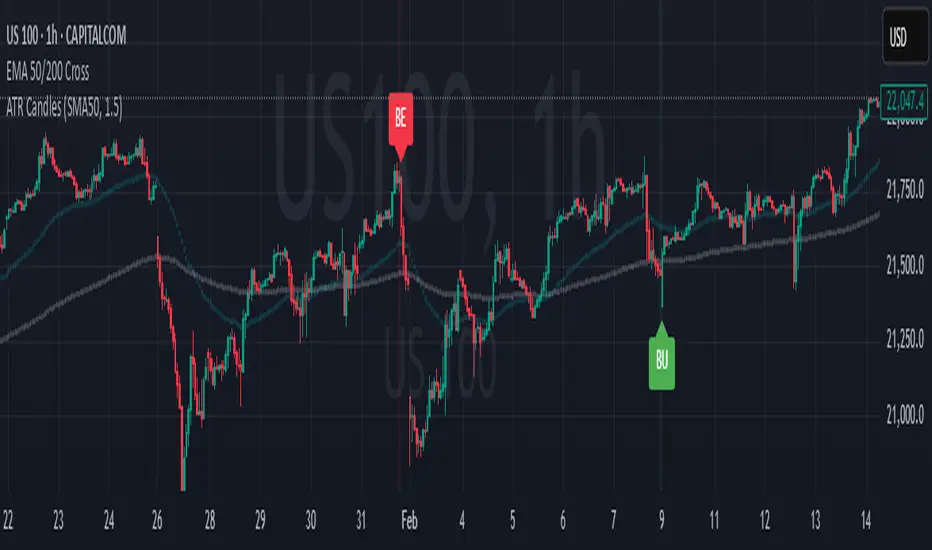
Engulfing Candles (ATR-Based)This indicator detects Engulfing Patterns with an ATR-based filtering mechanism and trend confirmation. Unlike a basic engulfing pattern indicator that only checks if a current candle engulfs the previous one, this script incorporates trend detection using either the 50-period SMA alone or a combination of 50 and 200-period SMAs to ensure that signals align with the broader trend. The indicator identifies Bullish Engulfing patterns when a strong bullish candle engulfs a smaller bearish candle in a downtrend and Bearish Engulfing patterns when a strong bearish candle engulfs a smaller bullish candle in an uptrend. It also generates alerts and visually marks these patterns with labels ("BU" for bullish and "BE" for bearish) while highlighting the background accordingly.
What sets this indicator apart from a normal engulfing indicator is its ATR-based filtering system, which ensures that only significant engulfing candles are considered. Instead of accepting any engulfing pattern, the script measures candle body size relative to 1.5x ATR (configurable) to filter out weak signals. It also differentiates between long-bodied and small-bodied candles to confirm that the engulfing pattern represents real momentum shifts. This approach reduces false signals caused by small, insignificant candles and ensures that traders focus on high-probability reversal patterns. By integrating trend-based filtering and ATR-based confirmation, this indicator provides more reliable and context-aware engulfing signals than a standard engulfing pattern detector.
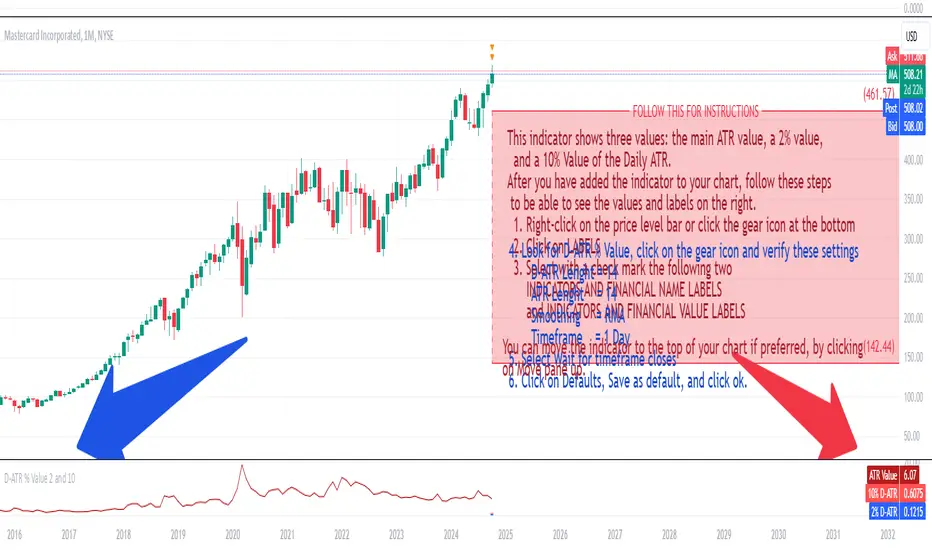
Daily ATR 2 and 10 Percent Value
This indicator shows three values: the main ATR value, a 2% value,
and a 10% Value of the Daily ATR.
After you have added the indicator to your chart, follow these steps
to be able to see the values and labels on the right.
1. Right-click on the price level bar or click the gear icon at the bottom
2. Click on LABELS
3. Select with a check mark the following two
INDICATORS AND FINANCIAL NAME LABELS
and INDICATORS AND FINANCIAL VALUE LABELS
4. Look for D-ATR % Value, click on the gear icon and verify these settings
- D-ATR Lenght = 14
- ATR Lenght = 14
- Smoothing = RMA
- Timeframe = 1 Day
5. Select Wait for timeframe closes
6. Click on Defaults, Save as default, and click ok.
You can move the indicator to the top of your chart if preferred, by clicking
on Move pane up.
Slightly modifications from other indicators.
Fetch ATR + MA StrategyA trend following indicator that allows traders/investors to enter trades for the long term, as it is mainly tested on the daily chart. The indicator fires off buy and sell signals. The sell signals can be turned off as trader can decide to use this indicator for long term buy signals. The buy signals are indicated by the green diamonds, and the red diamonds show the points on then chart where the asset can be sold.
The indicator uses a couple indicators in order to generate the buy signals:
- ADX
- ATR
- Moving Average of ATR
- 50 SMA
- 200 SMA
The buy signal is generated at the cross overs of the 50 and 200 SMA's while the ATR is lower than then Moving Average of the ATR. The buy signal is fired when these conditions are met and if the ADX is lower than 30.
The thought process is as follows:
When the ATR is lower than its moving average, the price should be in a low volatilty environment. An ADX between 25 and 50 signals a Strong trend. Every value below 25 is an absent or weak trend. So entering a trade when the volatilty is still low but increasing, you'll be entering a trade at the start of a new uptrend. This mechanism also filters out lots of false signals of the simple cross overs.
The sell signals are fired every time the 50 SMA drops below the 200 SMA.

Directional ATROANDA:EURUSD
TLDR: A custom volatility indicator that combines Average True Range with candle direction.
The Directional ATR (DATR) is an indicator that enhances the traditional Average True Range (ATR) by incorporating the direction of the candle (bullish or bearish).
This indicator is designed to help traders identify trend strength, potential trend reversals, and market volatility.
Key Features:
Trend Confirmation: Positive and increasing DATR values suggest a bullish trend, while negative and decreasing values indicate a bearish trend. A higher absolute DATR value signifies a stronger trend.
Trend Reversal: A change in the direction of the DATR from positive to negative or vice versa may signal a potential trend reversal.
Volatility: Like the standard ATR, the DATR can be used to gauge market volatility, with larger absolute values indicating higher volatility and smaller values suggesting lower volatility.
Divergence: Divergence between the price and the DATR could signal a potential weakening of the trend and an upcoming reversal.
Overbought/Oversold Levels: Extreme DATR values can be used to identify overbought or oversold market conditions, signaling potential reversals or corrections.
Please note that the Directional ATR is just an indicator, and the interpretations provided are based on its underlying logic.
It is essential to combine the DATR with other technical analysis tools and test the indicator on historical data before using it in your trading strategy. Additionally, consider other factors such as risk management, and your own trading style.
ER-Adaptive ATR Limit Channels w/ States [Loxx]As simple as it gets, channels based on high, low and ATR distances, Shows possible short term support / resistance or can be used as a take profit/stop-loss in some trading systems. It does this by comparing high/low values of price to multiplied by a multiple of ATR to determine when the trend changes. States are included to change the sensitivity to trend changes. 1 is very sensitive, 3 is least sensitive.
This uses Loxx's Expanded Source Types. You can read about them here:
What is ER Adaptive ATR?
Average True Range (ATR) is widely used indicator in many occasions for technical analysis . It is calculated as the RMA of true range. This version adds a "twist": it uses Perry Kaufman's Efficiency Ratio to calculate adaptive true range

Stop Loss With Average True Range (ATR)Stop Loss With Average True Range (ATR)
It simplifies the calculation of stop loss price for stop loss method using the average true range (ATR).
For example;
You want to stop loss below 3 ATR. Let's assume the price is 100, the average true range is 5. You will multiply the average true range by 3 and subtract from the price and enter a stop loss order at the 85 price you have reached. Instead of doing this calculation every time, you just need to use this script and set the multiplier to 3. A stop loss line will be drawn below the price candles.
You can set the method to be used when averaging the true range. Methods you can use to average: EMA (exponentially moving average), HMA (hull moving average), RMA (moving average used in RSI), SMA (simple moving average), SWMA (symmetrically weighted moving average), VWMA (volume-weighted moving average), WMA (weighted moving average).
You can set the length to be used when averaging the true range.
You can set the multiplier to be used when determining the stop loss price.
Turkish
Ortalama Gerçek Aralıkla (ATR) Zarar Durdurma
Gerçek aralığın ortalamasını kullanarak zarar durdurma yöntemi için zarar durdurma fiyatının hesaplanmasını kolaylaştırır.
Örneğin;
3 ATR kadar aşağıda zarar durdurmak istiyorsunuz. Fiyatın 100, ortalama gerçek aralığın 5 olduğunu varsayalım. Ortalama gerçek aralığı 3 ile çarparak fiyattan çıkaracaksınız ve ulaştığınız 85 fiyatına zarar durdurma emri gireceksiniz. Bu hesabı her seferinde yapmak yerine bu betiği kullanmanız ve çarpanı 3 olarak ayarlamanız yeterli. Bu sayede fiyat mumlarının altına zarar durdurma çizgisi çizilecektir.
Gerçek aralığın ortalaması alınırken kullanılacak yöntemi ayarlayabilirsiniz. Ortalama almak için seçebileceğiniz yöntemler: EMA (üstel hareketli ortalama), HMA (gövde hareketli ortalama), RMA (göreceli hareketli ortalama), SMA (basit hareketli ortalama), SWMA (simetrik ağırlıklı hareketli ortalama), VWMA (hacim ağırıklı hareketli ortalama), WMA (ağırlıklı hareketli ortalama).
Gerçek aralığın ortalaması alınırken kullanılacak periyot uzunluğunu ayarlayabilirsiniz.
Zarar durdurma fiyatını belirlerken kullanılacak çarpanı ayarlayabilirsiniz.

Average True Range (ATR) invisible price markers / linesThis script provides the ATR price when added to the top and bottom of the currently hovered candle.
The prices are shown top left next to the indicators' name.
This means you do not have to manually subtract or add ATR to price.
Line opacity allows you to show the lines where the ATR is, however, I recommend to keep this disabled.
Line type allows you to choose where ATR is calculated from (LowHigh or LowHighBody), the second ignoring the wicks, however LH is standard.
I also recommend to keep the other parameters as default.
I hope this indicator provides useful to you and your trading.

action zone - ATR stop reverse order strategy v0.1 by 9nckACTION ZONE-ATR MOD v0.1 DOCUMENTATION
Overview
This tradingview pine script strategy is mainly created to enrich my coding skill. It is a combination of “CDC-ACTIONZONE” and my personal studies of trading techniques in various sources e.g.book, course or blog. This strategy purposefully built to connect with my automatic trading bot. However, It will be very useful to aid your trading routine by diminishing mental distraction which possibly leads to bad trades.
How does it work?
This strategy will do a basic simple thing that most traders do by creating entry signals on both sides long/short and also set the stop loss. Furthermore, It will also reverse the order (from long to short and vice versa (if long/short conditions are met). Finally, it will recalculate the stop loss/take profit price in every complete bar to increase the chance of winning and limit our loss.
Entry rules(Long/Short)
If you have no open order, an order will be created when a fast EMA crosses(up(long)/down(short) the slow EMA(It’s as simple as that).
If you have an open order, the current order will be (sold if long, covered if short) and the opposite side order will be created.
Exit and Reverse rules(Long/Short)
If fast EMA cross (DOWN(long), UP(short)), the current order will be closed, THE OPPOSITE SIDE ORDER WILL ALSO BE CREATED.
Risk management
FLEX STOP PRICE : initial value will be set at the bar which order created. It is a fast ema (+/-) MIDDLE ATR value.
If MIDDLE ATR value rises, it will be our new stop price.
If MIDDLE ATR value falls, stop price unchanged
If Price OVERBOUGHT(long)/SOLD(short), LOW of that bar will be a new stop price.
Minimum position hold period
In order to eliminate risk of repeatedly open, close orders in sideway trends. Minimum hold period must be passed to start exit our position. However, It always respects stop loss prices. The value refers to the number of bars.
MUST READ!!!
This strategy uses only MARKET ORDER. If you trade with a bot, make sure you choose only enormous market cap tokens.
This strategy is bi-direction strategy. It will work best in the DERIVATIVE market.
It was initially designed to compete in the cryptocurrency market which has very high volume and volatility.
I only use this strategy in 1HR (acceptable change rate, optimum trade frequency)
How (should) we use it?
Choose crypto future pairs (recommend only top 10-15 market volume pairs in Binance, let’s say 1000M+ trade value)
Choose your time frame (1H is strongly recommended)
Setup your portfolio profile (Setting->Properties) such as Initial cap, order size, commission. DO NOT USE CAL ON EVERY TICK IT WILL CAUSE REPAINTING AND YOUR CAPITAL IS BLEEDING !!!
BACKTEST FIRST!! Back test is a combination of art, math and statis(and a bit of luck). You can apply to train and test methods or whatever you are familiar with. In my opinion, your test period should include UPTREND, SIDEWAY, DOWNTREND. Fine tune fast, slow ema first(my best ema length of 1H timeframe around 7-10, 17-22). Try to eliminate fault breakout trade and use other options only necessary. Hopefully we can use automatic optimization on Pine Script soon.
Don’t forget to turn off using a specific backtest date option to start your strategy.A
THIS IS NOT A PERFECT (OR EVEN PROFITABLE) STRATEGY. USE AT YOUR OWN RISK AND TRADE RESPONSIBLY. DYOR DUDE.

Study: Candle MA Distance (ATR)Simple script that plots price to MA distance (ATR) as a bar chart.
ATR is being used here instead of % because ATR keeps it relative to current volatility (1ATR move in either direction can have very different % for when price at 20cent and 2 dollars).
Upper/Lower band is calculated based on the average of previous peak/trough. Price approaching the band could signal overextended in the short term movement, expect price to consolidate/retrace to the MA.
Caution: if the indicator shows the price "pulled back" to MA, the actual price could still go up (or down), just a little slower then the MA
Adjustable Settings:
- Plot as bar or line
- MA Type and Length
- ATR Length
█ Disclaimer
Past performance is not an indicator of future results.
My opinions and research are my own and do not constitute financial advice in any way whatsoever.
Nothing published by me constitutes an investment recommendation, nor should any data or Content published by me be relied upon for any investment/trading activities.
I strongly recommends that you perform your own independent research and/or speak with a qualified investment professional before making any financial decisions.
BEST ATR Stop Multiple StrategyHello traders
Here we go again.... with another strategy snippet.
Reminder: it's an alternative of this Trailing Stop strategy script
Entry logic
The entry is based on a Simple Moving Averages (SMA) cross.
This part doesn't matter here - as I wanted to focus on the ATR multiple stop loss component.
ATR STOP
This strategy snippet uses an entry stop loss defined based on a multiple of the average true range value.
The soure code detects ATR value at entry price, applies the multiplier and will set a static (= non trailing) stop-loss to each position
A pinescript v4 label will appear for each new signal displaying the ATR*multiplier value at signal time
All the BEST
Dave

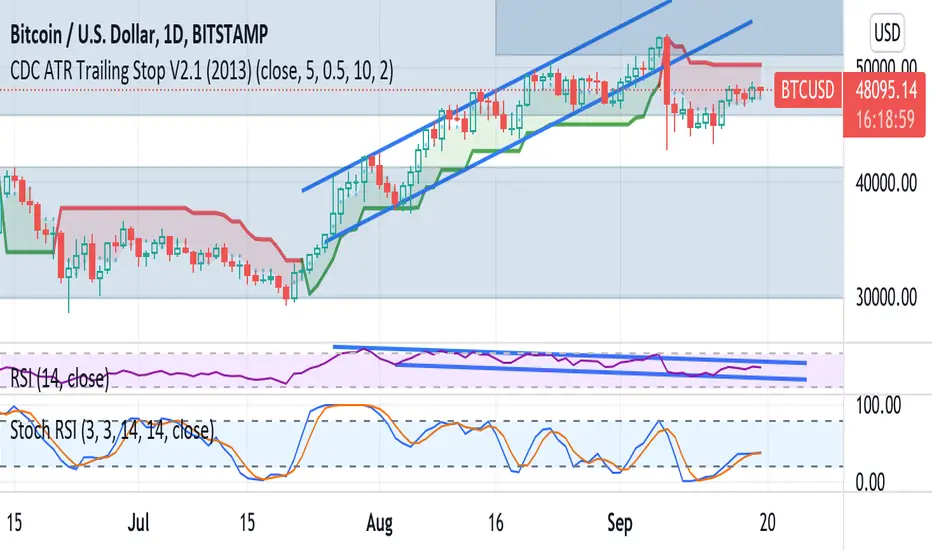
CDC ATR Trailing Stop V2.1 (2013)CDC ATR Trailing Stop V2.1
The indicator / system was developed a few years ago.
Contains two ATR trailing stop lines, fast and slow.
The slow ATR SL line is the same as the one in a normal ATR trailing stop loss indicator.
The fast one is created to generate buy/sell signals
To use the signals, activate them from the indicator's settings (gear icon next to the indicator's name on the chart) and enable buy / sell arrows.
The system works well in high volatility market.
I personally use this as the faster system in conhunction with my slower MA system to diversify portfolio performance.
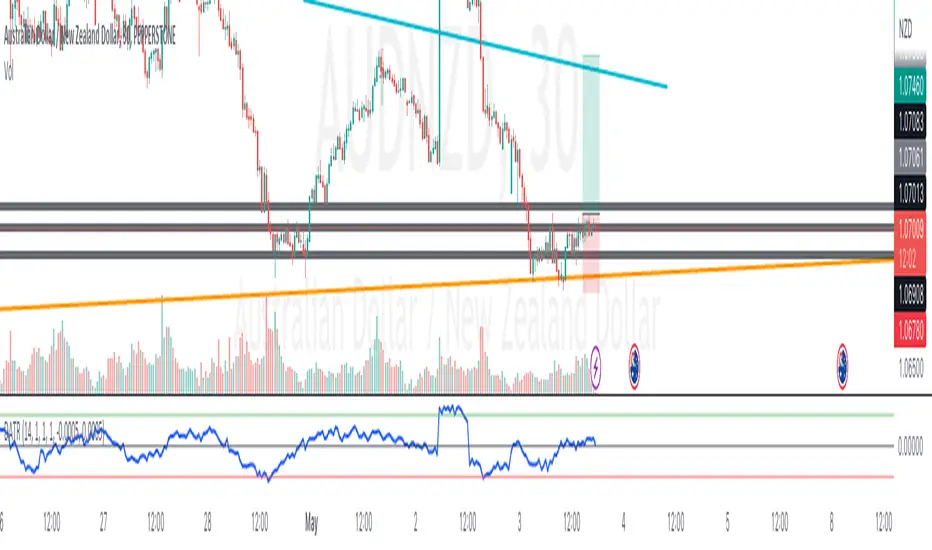
ATR-Reset Pivot Points ATR-Reset Pivot Points - Dynamic for London & NY Sessions
Standard daily pivots go stale fast after Asia — this version fixes that.
Key feature:
Instead of resetting on time (daily/4h/6h), pivots only update when price makes a REAL move.
How it works:
- Tracks 5m ATR(14) volatility (usually 200–400 pts on BTC)
- Resets pivots when price moves ≥ 1.7 × ATR (or min 300 pts) away from last reset high/low
- New P, R1–R5, S1–S5 are calculated from the exact candle where the big move happened
- Green triangle marks each reset
Why this matters for day trading:
- Asia: stays quiet, almost no resets → clean like standard pivots
- London open / NY killzone: auto-refreshes on real volume legs → levels always reflect current session structure
- No more sandwiching or fakeouts from 12-hour-old pivots
Best on BTCUSDT.P 5m
Recommended settings:
- ATR Multiplier: 1.7–2.0 (higher = fewer resets)
- Min Reset Points: 300–400 (safety net in chop)
- Pivot Type: Traditional or Fibonacci
Perfect for directional bias, Tokyo Protocol style, when real money flows in.
Prints fresh levels exactly when you need them most.
Enjoy the edge.

Opening Range candle percent of ATRIt takes the opening range of the first candle - 5, 10, 15 or whatever minute - and finds what percent of the ATR that is. So if the opening candle high is 15 and low is 14, its range is 1. If the ATR (daily or whatever you want) is 2, then the opening candle's range is 50% of the ATR.
The percentage is displayed on right in a blue box.
The indicator is used in reversal strategies, since opening candles that eat up a large amount of the daily ATR have a higher probability of reversing.
Indicator made with ChatGPT.

ATR SL/TP Precision Zones (Dots)ATR SL/TP Precision Zones (Dots) is a volatility-based tool designed to help traders set accurate Stop Loss and Take Profit levels based on real market volatility — not fixed pips or emotion.
This indicator uses ATR (Average True Range) multiplied by 1.2 to calculate dynamic distance bands.
Instead of drawing a ribbon or channel, it places simple dots above and below each candle:
Upper Dot (Green) → Suggested Take Profit / Price Stretch Zone
Lower Dot (Red) → Suggested Stop Loss Cushion / Support Expansion Zone
Because ATR measures market volatility, these dots expand during high volatility and tighten during slow markets, helping traders avoid stop-loss hunts and premature exits.
Why This Works
Most traders lose because:
They set SL too close → stopped out by noise
They set TP too far → price never reaches it
This tool calibrates those distances automatically based on real price movement behavior.
ATR = volatility
Volatility = market breathing room
This indicator ensures your trade has room to breathe, increasing win consistency.
Best Use Cases
Scalping
Swing trading
Trend continuation entries
Reversal confirmations with support/resistance
Works on Crypto / Forex / Stocks / Futures

PSAR with ATR Trailing Stop + SMA Filter📈 Strategy Overview: PSAR + 6×ATR Trailing Stop with SMA Filter
This strategy is built around the principle of “Cut the losers, let the winners run” — a disciplined, trend-following approach that combines the Parabolic SAR indicator with dynamic risk management and a Simple Moving Average (SMA) trend filter.
🔍 Strategy Logic
Trend Filter Trades are only taken in the direction of the prevailing trend, defined by a user-selected SMA (default: 100).
✅ Long trades only when price is above the SMA
✅ Short trades only when price is below the SMA
Entry Signal: A trade is triggered when the Parabolic SAR flips to the opposite side of the price bars, signaling a potential trend reversal.
Stop Loss: The stop loss is dynamically set at 6×ATR from the entry price. This adapts to market volatility and is recalculated every bar — effectively acting as a trailing stop.
Exit Logic: There is no fixed take profit. The trade remains open until the trailing stop is hit — allowing winners to run and losers to be cut quickly.
Risk Management: Each trade risks 0.5% of total equity, ensuring consistent position sizing and capital preservation.
📊 Visual Elements
PSAR dots mark trend direction changes
SMA line shows the broader trend filter
Trailing stop crosses (with 50% opacity) indicate the current stop level without cluttering the chart
⚙️ Customizable Inputs
PSAR parameters: Start, Increment, Maximum
ATR length and multiplier
SMA length
Risk percentage per trade
This strategy is ideal for traders who want to stay aligned with the trend, automate disciplined exits, and avoid emotional decision-making. Clean, simple, and powerful.
Wishing you calm and successful trades!

Vol-Pace Projected-ATR-ADX-Alert-MAThe VolSC indicator analyzes stock volume trends with a focus on the Pace metric, which projects today's volume as a percentage of the 30-day average, highlighting unusual activity (e.g., over 200% turns bright green with alerts). The phantom projection bar, a wide green histogram to the right of the last bar, visually represents this projected volume on daily charts only, aiding quick identification of potential volume surges without cluttering intraday or weekly views. Additional features include ADX strength, ATR averages, and customizable table display for comprehensive insights.
Key Features:
* Primary Indicator: Volume with ADX (Average Directional Index) text.
* Pacing and Alerts: Calculates the volume pace for the day. Features an unusual volume alert with an adjustable threshold (e.g., 200%).
* Volume Projection: Projects a visual "Phantom Volume" for the day, offset to the right of the actual volume bar.
* ATR Indicator: Displays the 2x ATR (Average True Range) value as text.
* Volume Average: Displays the ADV (Average Daily Volume) Moving Average as text.
* Customization: Most settings are adjustable.

MACD + RSI + EMA + BB + ATR Day Trading StrategyEntry Conditions and Signals
The strategy implements a multi-layered filtering approach to entry conditions, requiring alignment across technical indicators, timeframes, and market conditions .
Long Entry Requirements
Trend Filter: Fast EMA (9) must be above Slow EMA (21), price must be above Fast EMA, and higher timeframe must confirm uptrend
MACD Signal: MACD line crosses above signal line, indicating increasing bullish momentum
RSI Condition: RSI below 70 (not overbought) but above 40 (showing momentum)
Volume & Volatility: Current volume exceeds 1.2x 20-period average and ATR shows sufficient market movement
Time Filter: Trading occurs during optimal hours (9:30-11:30 AM ET) when market volatility is typically highest
Exit Strategies
The strategy employs multiple exit mechanisms to adapt to changing market conditions and protect profits :
Stop Loss Management
Initial Stop: Placed at 2.0x ATR from entry price, adapting to current market volatility
Trailing Stop: 1.5x ATR trailing stop that moves up (for longs) or down (for shorts) as price moves favorably
Time-Based Exits: All positions closed by end of trading day (4:00 PM ET) to avoid overnight risk
Best Practices for Implementation
Settings
Chart Setup: 5-minute timeframe for execution with 15-minute chart for trend confirmation
Session Times: Focus on 9:30-11:30 AM ET trading for highest volatility and opportunity
