FX Sniper: T3-CCI Strategy Backtest This simple indicator gives you a lot of useful information - when to enter, when to exit
and how to reduce risks by entering a trade on a double confirmed signal.
You can use in the xPrice any series: Open, High, Low, Close, HL2, HLC3, OHLC4 and ect...
You can change long to short in the Input Settings
Please, use it only for learning or paper trading. Do not for real trading.
Pesquisar nos scripts por "algo"

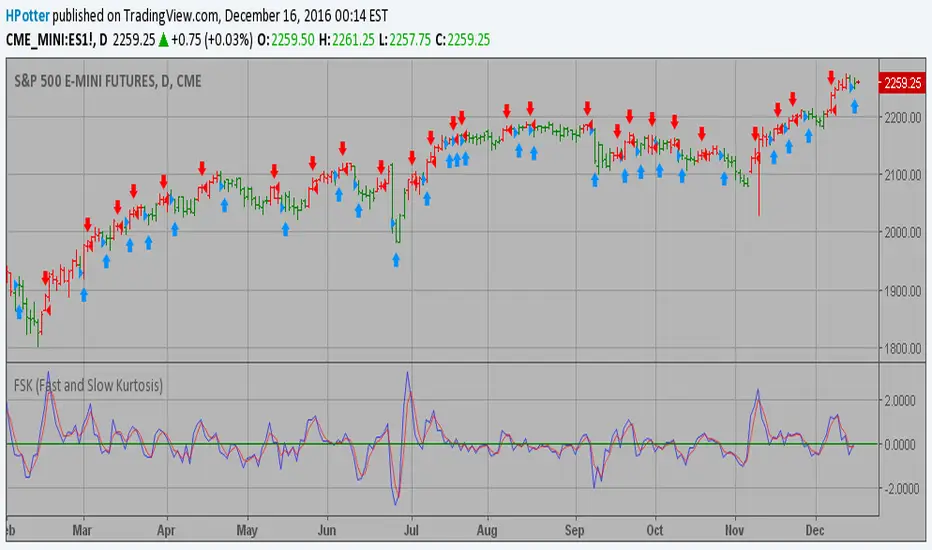
FSK (Fast and Slow Kurtosis) Backtest This indicator plots the Fast & Slow Kurtosis. The Kurtosis is a market
sentiment indicator. The Kurtosis is constructed from three different parts.
The Kurtosis, the Fast Kurtosis(FK), and the Fast/Slow Kurtosis(FSK).
You can change long to short in the Input Settings
Please, use it only for learning or paper trading. Do not for real trading.
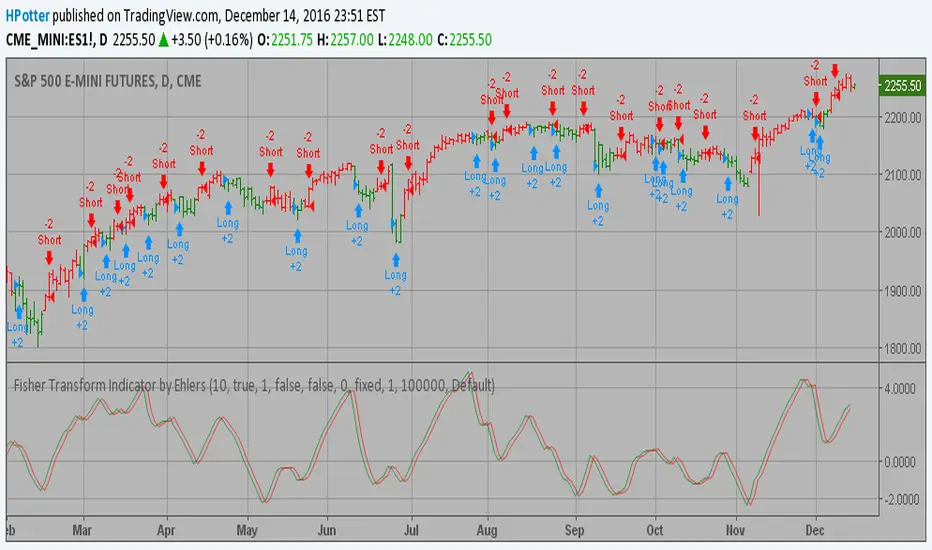
Fisher Transform Indicator by Ehlers Backtest Market prices do not have a Gaussian probability density function
as many traders think. Their probability curve is not bell-shaped.
But trader can create a nearly Gaussian PDF for prices by normalizing
them or creating a normalized indicator such as the relative strength
index and applying the Fisher transform. Such a transformed output
creates the peak swings as relatively rare events.
Fisher transform formula is: y = 0.5 * ln ((1+x)/(1-x))
The sharp turning points of these peak swings clearly and unambiguously
identify price reversals in a timely manner.
You can change long to short in the Input Settings
Please, use it only for learning or paper trading. Do not for real trading.
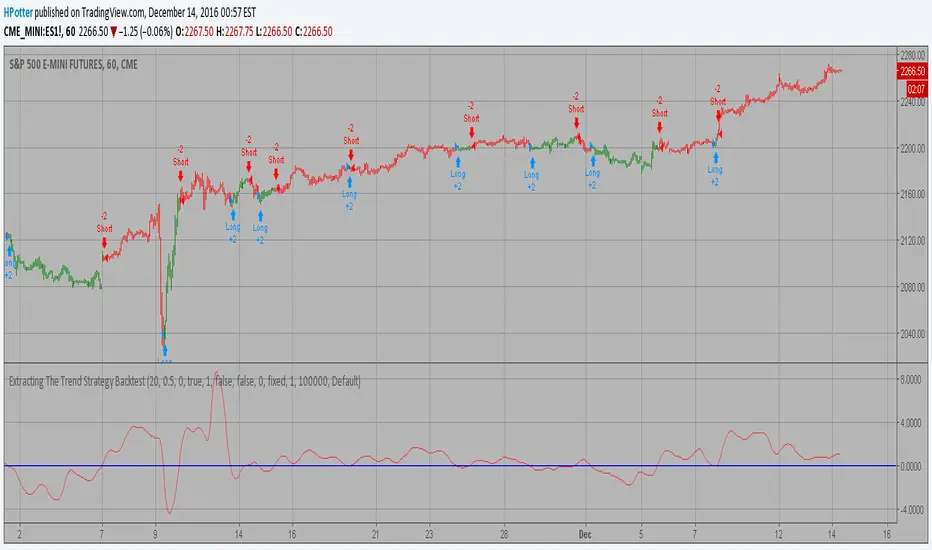
Extracting The Trend Strategy Backtest The related article is copyrighted material from Stocks & Commodities Mar 2010
You can use in the xPrice any series: Open, High, Low, Close, HL2, HLC3, OHLC4 and ect...
You can change long to short in the Input Settings
Please, use it only for learning or paper trading. Do not for real trading.
Ergotic TSI Strategy Backtest r - Length of first EMA smoothing of 1 day momentum 4
s - Length of second EMA smoothing of 1 day smoothing 8
u- Length of third EMA smoothing of 1 day momentum 6
Length of EMA signal line 3
Source of Ergotic TSI Close
This is one of the techniques described by William Blau in his book "Momentum,
Direction and Divergence" (1995). If you like to learn more, we advise you to
read this book. His book focuses on three key aspects of trading: momentum,
direction and divergence. Blau, who was an electrical engineer before becoming
a trader, thoroughly examines the relationship between price and momentum in
step-by-step examples. From this grounding, he then looks at the deficiencies
in other oscillators and introduces some innovative techniques, including a
fresh twist on Stochastics. On directional issues, he analyzes the intricacies
of ADX and offers a unique approach to help define trending and non-trending periods.
You can use in the xPrice any series: Open, High, Low, Close, HL2, HLC3, OHLC4 and ect...
You can change long to short in the Input Settings
Please, use it only for learning or paper trading. Do not for real trading.

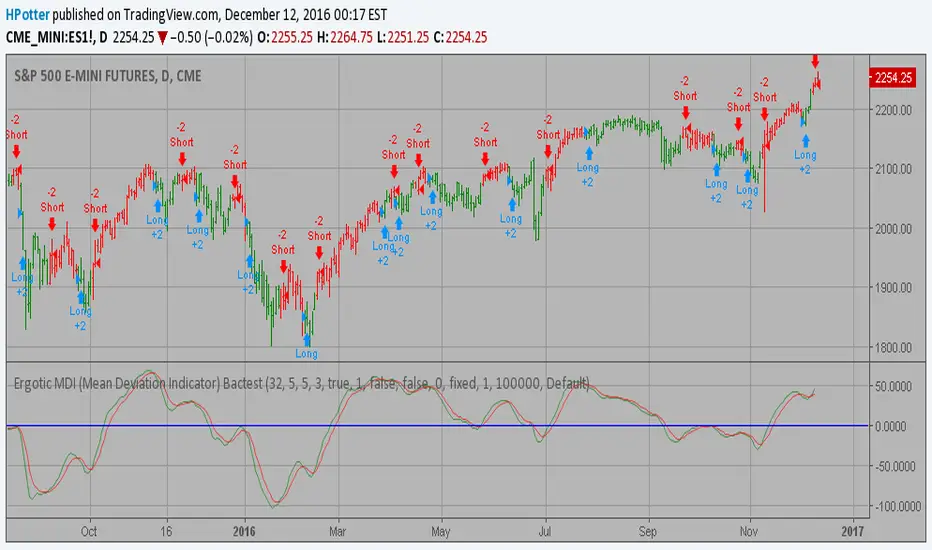
Ergotic MDI (Mean Deviation Indicator) Bactest This is one of the techniques described by William Blau in his book "Momentum,
Direction and Divergence" (1995). If you like to learn more, we advise you to
read this book. His book focuses on three key aspects of trading: momentum,
direction and divergence. Blau, who was an electrical engineer before becoming
a trader, thoroughly examines the relationship between price and momentum in
step-by-step examples. From this grounding, he then looks at the deficiencies
in other oscillators and introduces some innovative techniques, including a
fresh twist on Stochastics. On directional issues, he analyzes the intricacies
of ADX and offers a unique approach to help define trending and non-trending periods.
You can change long to short in the Input Settings
Please, use it only for learning or paper trading. Do not for real trading.
Ergotic MACD Strategy Backtest This is one of the techniques described by William Blau in his book
"Momentum, Direction and Divergence" (1995). If you like to learn more,
we advise you to read this book. His book focuses on three key aspects
of trading: momentum, direction and divergence. Blau, who was an electrical
engineer before becoming a trader, thoroughly examines the relationship
between price and momentum in step-by-step examples. From this grounding,
he then looks at the deficiencies in other oscillators and introduces some
innovative techniques, including a fresh twist on Stochastics. On directional
issues, he analyzes the intricacies of ADX and offers a unique approach to help
define trending and non-trending periods.
Blau`s indicator is like usual MACD, but it plots opposite of meaningof
stndard MACD indicator.
You can change long to short in the Input Settings
Please, use it only for learning or paper trading. Do not for real trading.

Elder Ray (Bull Power) Strategy Backtest Developed by Dr Alexander Elder, the Elder-ray indicator measures buying
and selling pressure in the market. The Elder-ray is often used as part
of the Triple Screen trading system but may also be used on its own.
Dr Elder uses a 13-day exponential moving average (EMA) to indicate the
market consensus of value. Bull Power measures the ability of buyers to
drive prices above the consensus of value. Bear Power reflects the ability
of sellers to drive prices below the average consensus of value.
Bull Power is calculated by subtracting the 13-day EMA from the day's High.
Bear power subtracts the 13-day EMA from the day's Low.
You can use in the xPrice any series: Open, High, Low, Close, HL2, HLC3, OHLC4 and ect...
You can change long to short in the Input Settings
Please, use it only for learning or paper trading. Do not for real trading.

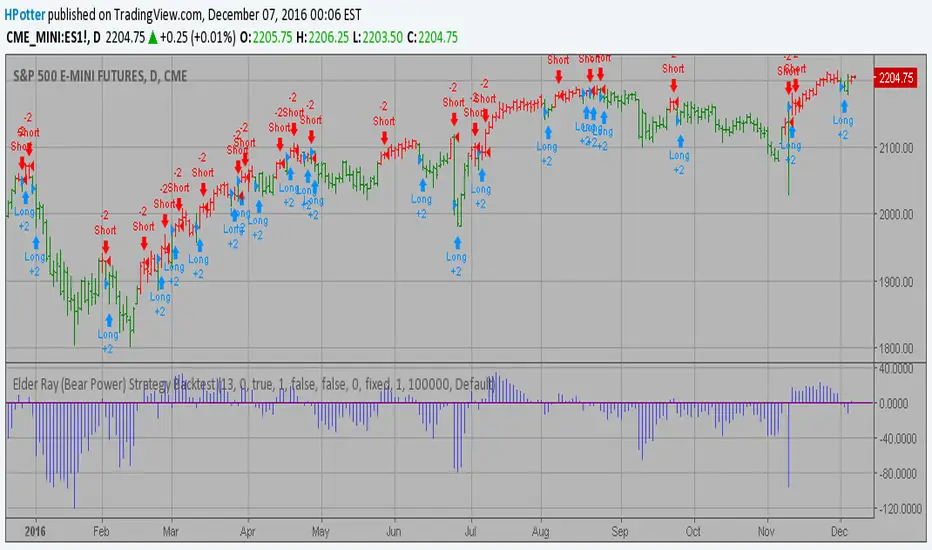
Elder Ray (Bear Power) Strategy Backtest Developed by Dr Alexander Elder, the Elder-ray indicator measures buying
and selling pressure in the market. The Elder-ray is often used as part
of the Triple Screen trading system but may also be used on its own.
Dr Elder uses a 13-day exponential moving average (EMA) to indicate the
market consensus of value. Bear Power measures the ability of sellers to
drive prices below the consensus of value. Bear Power reflects the ability
of sellers to drive prices below the average consensus of value.
Bull Power is calculated by subtracting the 13-day EMA from the day's High.
Bear power subtracts the 13-day EMA from the day's Low.
You can use in the xPrice any series: Open, High, Low, Close, HL2, HLC3, OHLC4 and ect...
You can change long to short in the Input Settings
Please, use it only for learning or paper trading. Do not for real trading.
ECO Strategy Backtest We call this one the ECO for short, but it will be listed on the indicator list
at W. Blau’s Ergodic Candlestick Oscillator. The ECO is a momentum indicator.
It is based on candlestick bars, and takes into account the size and direction
of the candlestick "body". We have found it to be a very good momentum indicator,
and especially smooth, because it is unaffected by gaps in price, unlike many other
momentum indicators.
We like to use this indicator as an additional trend confirmation tool, or as an
alternate trend definition tool, in place of a weekly indicator. The simplest way
of using the indicator is simply to define the trend based on which side of the "0"
line the indicator is located on. If the indicator is above "0", then the trend is up.
If the indicator is below "0" then the trend is down. You can add an additional
qualifier by noting the "slope" of the indicator, and the crossing points of the slow
and fast lines. Some like to use the slope alone to define trend direction. If the
lines are sloping upward, the trend is up. Alternately, if the lines are sloping
downward, the trend is down. In this view, the point where the lines "cross" is the
point where the trend changes.
When the ECO is below the "0" line, the trend is down, and we are qualified only to
sell on new short signals from the Hi-Lo Activator. In other words, when the ECO is
above 0, we are not allowed to take short signals, and when the ECO is below 0, we
are not allowed to take long signals.
You can change long to short in the Input Settings
Please, use it only for learning or paper trading. Do not for real trading.

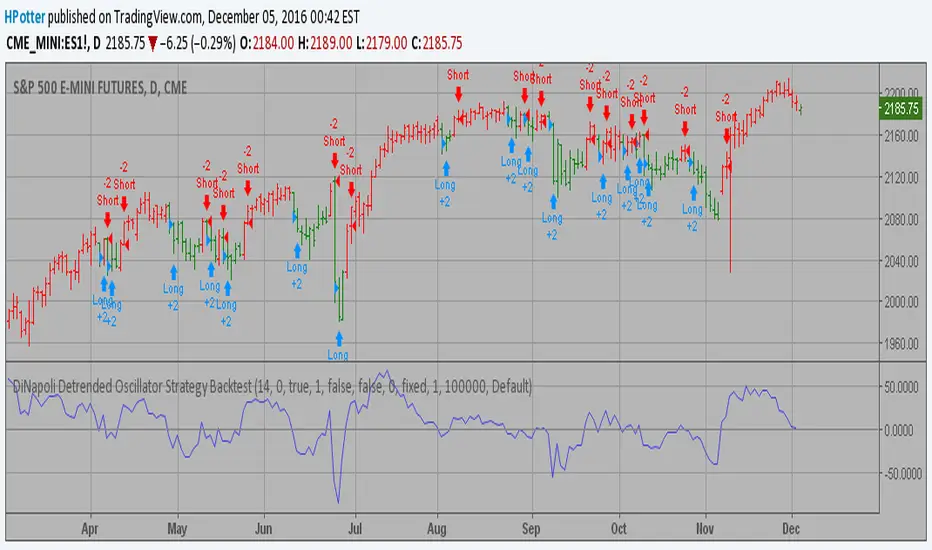
DiNapoli Detrended Oscillator Strategy Backtest DiNapoli Detrended Oscillator Strategy
You can change long to short in the Input Settings
Please, use it only for learning or paper trading. Do not for real trading.
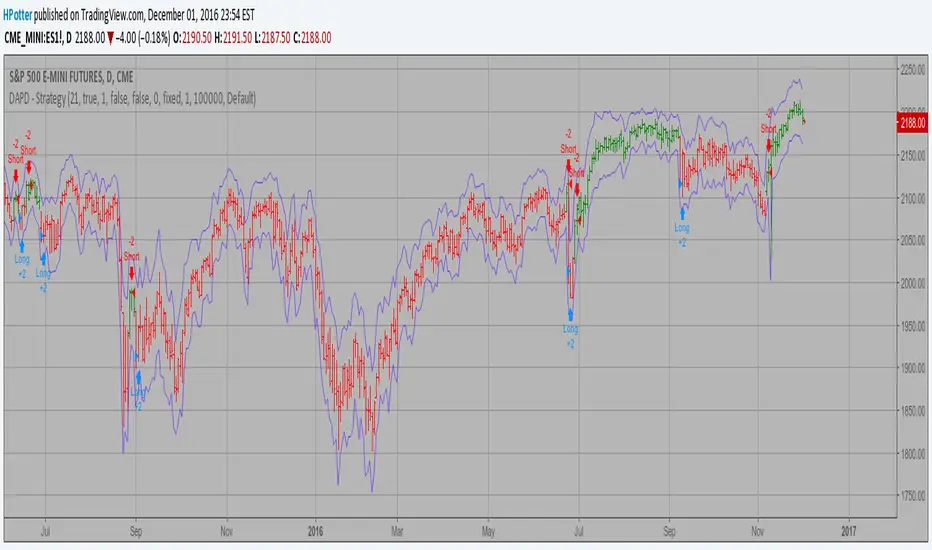
DAPD - Strategy Backtest This indicator is similar to Bollinger Bands. It based on DAPD - Daily
Average Price Delta. DAPD is based upon a summation for each of the
highs (hod) for the 21 days prior to today minus the summation for
each of the lows (lod) for the last 21 days prior to today. The result
of this calculation would then be divided by 21.
It will be buy when high above previos DAPD high and sell if low below previos DAPD low
You can change long to short in the Input Settings
Please, use it only for learning or paper trading. Do not for real trading.
Chaikin Volatility Strategy Backtest Chaikin's Volatility indicator compares the spread between a security's
high and low prices. It quantifies volatility as a widening of the range
between the high and the low price.
You can use in the xPrice1 and xPrice2 any series: Open, High, Low, Close, HL2,
HLC3, OHLC4 and ect...
You can change long to short in the Input Settings
Please, use it only for learning or paper trading. Do not for real trading.

CCI Strategy Reversed Backtest The Commodity Channel Index (CCI) is best used with markets that display cyclical or
seasonal characteristics, and is formulated to detect the beginning and ending of these
cycles by incorporating a moving average together with a divisor that reflects both possible
and actual trading ranges. The final index measures the deviation from normal, which indicates
major changes in market trend.
To put it simply, the Commodity Channel Index (CCI) value shows how the instrument is trading
relative to its mean (average) price. When the CCI value is high, it means that the prices are
high compared to the average price; when the CCI value is down, it means that the prices are low
compared to the average price. The CCI value usually does not fall outside the -300 to 300 range
and, in fact, is usually in the -100 to 100 range.
You can change long to short in the Input Settings
Please, use it only for learning or paper trading. Do not for real trading.

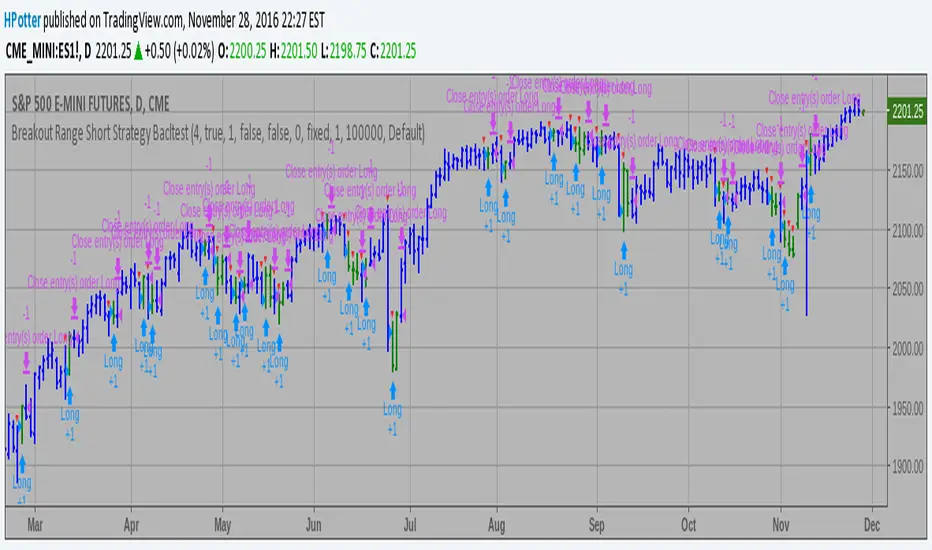
Breakout Range Short Strategy BacktestBreakout Range Short Strategy
You can change long to short in the Input Settings
Please, use it only for learning or paper trading. Do not for real trading.
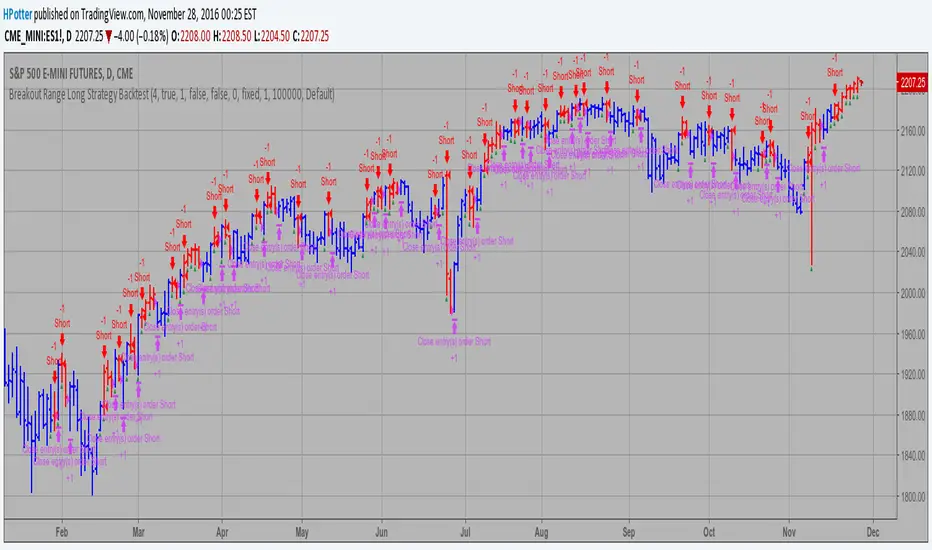
Breakout Range Long Strategy Backtest Breakout Range Long Strategy
You can change long to short in the Input Settings
Please, use it only for learning or paper trading. Do not for real trading.
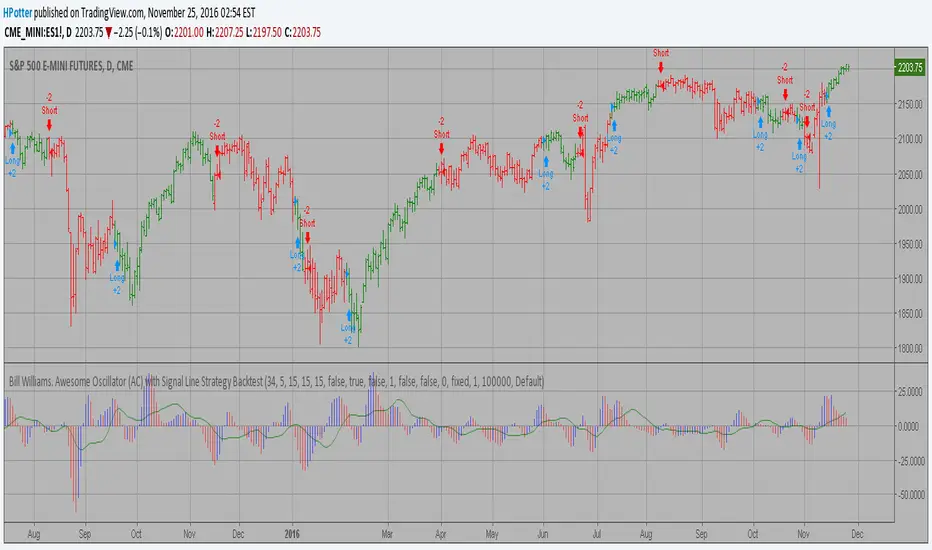
Bill Williams. Awesome Oscillator (AC) Strategy Backtest This indicator plots the oscillator as a histogram where blue denotes
periods suited for buying and red . for selling. If the current value
of AO (Awesome Oscillator) is above previous, the period is considered
suited for buying and the period is marked blue. If the AO value is not
above previous, the period is considered suited for selling and the
indicator marks it as red.
You can make changes in the property for set calculating strategy MA, EMA, WMA
Please, use it only for learning or paper trading. Do not for real trading.
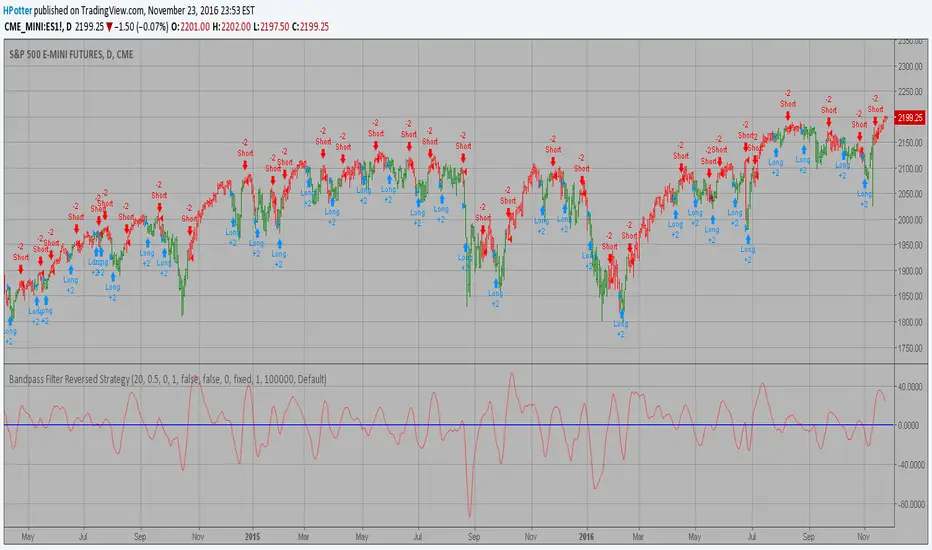
Bandpass Filter Reversed Strategy BacktestThe related article is copyrighted material from
Stocks & Commodities Mar 2010
You can use in the xPrice any series: Open, High, Low, Close, HL2, HLC3, OHLC4 and ect...
Please, use it only for learning or paper trading. Do not for real trading.
Average True Range Reversed Strategy Average True Range Trailing Stops Strategy, by Sylvain Vervoort
The related article is copyrighted material from Stocks & Commodities Jun 2009
Please, use it only for learning or paper trading. Do not for real trading.

3-Bar-Reversal-Pattern Strategy Backtest This startegy based on 3-day pattern reversal described in "Are Three-Bar
Patterns Reliable For Stocks" article by Thomas Bulkowski, presented in
January, 2000 issue of Stocks&Commodities magazine.
That pattern conforms to the following rules:
- It uses daily prices, not intraday or weekly prices;
- The middle day of the three-day pattern has the lowest low of the three days, with no ties allowed;
- The last day must have a close above the prior day's high, with no ties allowed;
- Each day must have a nonzero trading range.
Please, use it only for learning or paper trading. Do not for real trading.

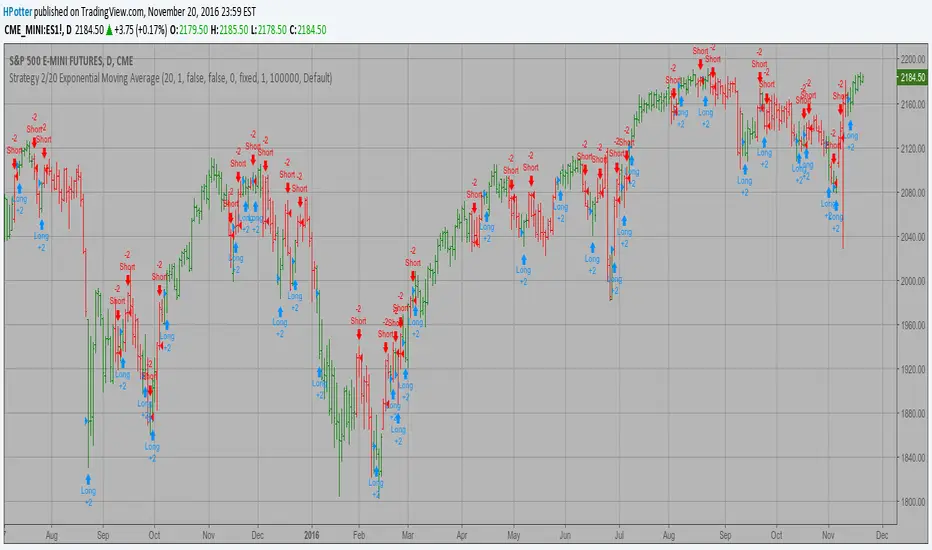
2/20 Exponential Moving Average StrategyThis indicator plots 2/20 exponential moving average. For the Mov
Avg X 2/20 Indicator, the EMA bar will be painted when the Alert criteria is met.
Please, use it only for learning or paper trading. Do not for real trading.
Everyday 0003 _ MAC Pullback I recently posted a Moving Averge Crossover strategy for my Everyday project - a project I've given myself where I try to create one strategy everyday in between 15 minutes and 2 hours.
In the comments of my last published idea, user SignalTradersUK was very kind and suggested I try the following in my next study:
"i think your next study should be, to workout what to do after the Moving Average cross! If you look just on the chart you have posted, Price would appear to always come back to the levels where the 2 MA's cross and then go back in the direction of the crossing of the MA's. It's a great pull back strategy."
I'm really just beginning to learn about coding strategies so I'm not 100% sure I correctly understood his suggestion.
I admit I had difficulties wrapping my head around how to do this.
Anyway, the result is a strategy which runs alongside the main Moving Average Crossover.
'The Algorithm'
When the fast and slow MA cross the strategy traces back 40 days to find a swing low.
This swing low and the price at the MA cross is used to calculate a fib 1.272 extension.
The price at this 1.272 extension is used to place a Pullback short order.
Since we're shorting a bull trend, a tight stop is used.
If the pullback reaches down to the fib 0.618 we take profit (close the short).
Like I said, I don't know if I correctly understood SignalTradersUK feedback, but I really appreciate the
feedback and advice!
As always I'm hoping to learn from the community, so all feedback, corrections and advice is very welcome!
Thanks!
/pbergden

Moving Average Crossover 0001The first strategy for my (also first) Everyday project. During the rest of 2016 I plan to create a new strategy everyday
and I give myself between 15 minutes and 2 hours to complete the idea.
The goal is to improve my knowledge of Pine Script, become a faster strategy coder, and experiment with different strategic trading ideas.
I'm new to strategies and algorithmic trading, and hoping to learn from the community, so any feedback, advice or corrections is very much welcome!
/pbergden
