AM Range Sniper [jmaxxx]AM Range Sniper
Overview
AM Range Sniper is a sophisticated morning session trading strategy designed for Micro E-mini Nasdaq-100 Index Futures (MNQ). This strategy capitalizes on the critical 8:30-9:30 AM EST range formation period, implementing precise entry and exit mechanics with advanced risk management.
Key Features
🕐 Time-Based Range Analysis
Range Definition: Automatically identifies and tracks the 8:30-9:30 AM EST range
Trading Window: Active trading from 9:30 AM to 11:00 AM EST (extended for second chance trades)
Session Management: Daily reset ensures clean state for each trading session
🎯 Multiple Entry Patterns
Breakthrough/Retest: Captures price breakthroughs above range with retest opportunities
Long/Short Opportunities: Comprehensive coverage of both directional moves
Breakdown: Identifies bearish breakdowns below range support
Break Up: Detects bullish breakups above range resistance
Range Sweeps: Monitors for range high/low sweeps with reversal entries
⚡ Advanced Risk Management
Configurable Stop Losses: Tick-based stop losses for each trade type
Take Profit Targets: Automatic target calculations based on range size
Hard Close Protection: Automatic position closure at 4 PM EST
Second Chance Feature: Optional second trade opportunity if first trade loses
🔧 Professional Features
Visual Stop Loss Lines: Real-time stop loss visualization on chart
Debug Information Panel: Comprehensive status monitoring
Alert Integration: Customizable alert messages for entries/exits
Flexible Time Settings: Adjustable for different timezones
Strategy Logic
Range Formation (8:30-9:30 AM)
The strategy monitors the first hour of trading to establish the day's range. This range serves as the foundation for all subsequent trading decisions.
Entry Conditions
Breakthrough: Price breaks above range high with retest rejection
Breakdown: Price breaks below range low with confirmed bearish momentum
Break Up: Price breaks above range high with strong bullish confirmation
Sweep Entries: Range high/low sweeps followed by reversal signals
Risk Management
Stop Loss: Configurable tick-based stops for each trade type
Take Profit: 1.5x range size targets for breakdown/breakup trades
Position Sizing: Percentage-based position sizing
Session Limits: Maximum 2 trades per session (with second chance feature)
Settings & Customization
Core Parameters
Enable/disable individual entry patterns
Configurable stop loss levels (1-500 ticks)
Second chance feature toggle
Previous day level integration
Visual Customization
Customizable stop loss colors and widths
Debug panel visibility
Range line styling
Alert Configuration
Custom entry/exit alert messages
***** Automate With *****
APEX
NinjaTrader
Crosstrade.io ( promo code JMAXXX )
Performance & Reliability
Precision Focused: Waits for high-probability setups
Risk-Aware: Comprehensive stop loss and position management
Session-Based: Clean daily resets prevent carryover issues
Professional Grade: Designed for serious traders
Ideal For
Day Traders: Morning session specialists
Futures Traders: MNQ and similar instruments
Range Traders: Traders who capitalize on range breakouts
Risk-Conscious Traders: Those who prioritize risk management
Disclaimer
This strategy is for educational and informational purposes. Past performance does not guarantee future results. Always test thoroughly on historical data and paper trading before live implementation. Risk management is crucial - never risk more than you can afford to lose.
Created by jmaxxx - Professional trading strategy developer
For questions, feedback, or customization requests, please leave a comment below.
Pesquisar nos scripts por "alert"

RSI Pro+ (Bear market, financial crisis and so on EditionIn markets defined by volatility, fear, and uncertainty – the battlegrounds of bear markets and financial crises – you need tools forged in resilience. Introducing RSI Pro+, a strategy built upon a legendary indicator born in 1978, yet engineered with modern visual clarity to remain devastatingly effective even in the chaotic financial landscapes of 3078.
This isn't about complex algorithms predicting the unpredictable. It's about harnessing the raw, time-tested power of the Relative Strength Index (RSI) to identify potential exhaustion points and capitalize on oversold conditions. RSI Pro+ cuts through the noise, providing clear, actionable signals when markets might be poised for a relief bounce or reversal.
Core Technology (The 1978 Engine):
RSI Crossover Entry: The strategy initiates a LONG position when the RSI (default period 11) crosses above a user-defined low threshold (default 30). This classic technique aims to enter when selling pressure may be waning, offering potential entry points during sharp downturns or periods of consolidation after a fall.
Modern Enhancements (The 3078 Cockpit):
RSI Pro+ isn't just about the signal; it's about providing a professional-grade visual experience directly on your chart:
Entry Bar Highlight: A subtle background flash on the chart signals the exact bar where the RSI crossover condition is met, alerting you to potential entry opportunities.
Trade Bar Coloring: Once a trade is active, the price bars are subtly colored, giving you immediate visual confirmation that the strategy is live in the market.
Entry Price Line: A clear, persistent line marks your exact average entry price for the duration of the trade, serving as a crucial visual anchor.
Take Profit Line: Your calculated Take Profit target is plotted as a distinct line, keeping your objective clearly in sight.
Custom Entry Marker: A precise shape (▲) appears below the bar where the trade entry was actually executed, pinpointing the start of the position.
On-Chart Info Table (HUD): A clean, customizable Heads-Up Display appears when a trade is active, showing vital information at a glance:
Entry Price: Your position's average cost basis.
TP Target: The calculated price level for your Take Profit exit.
Current PnL%: Real-time Profit/Loss percentage for the open trade.
Full Customization: Nearly every aspect is configurable via the settings menu:
RSI Period & Crossover Level
Take Profit Percentage
Toggle ALL visual enhancements on/off individually
Position the Info Table wherever you prefer on the chart.
How to Use RSI Pro+:
Add to Chart: Apply the "RSI Pro+ (Bear market...)" strategy to your TradingView chart. Ensure any previous versions are removed.
Access Settings: Click the cogwheel icon (⚙️) next to the strategy name on your chart.
Configure Inputs (Crucial Step):
RSI Crossover Level: This is key. The default (30) targets standard oversold conditions. In severe downturns, you might experiment with lower levels (e.g., 25, 20) or higher ones (e.g., 40) depending on the asset and timeframe. Observe where RSI(11) typically bottoms out on your chart.
Take Profit Percentage (%): Define your desired profit target per trade (e.g., enter 0.5 for 0.5%, 1.0 for 1%). The default is a very small 0.11%.
RSI Period: While default is 11, you can adjust this (e.g., the standard 14).
Visual Enhancements: Enable or disable the visual features (background highlights, bar coloring, lines, markers, table) according to your preference using the checkboxes. Adjust table position.
Observe & Backtest: Watch how the strategy behaves on your chosen asset and timeframe. Use TradingView's Strategy Tester to analyze historical performance based on your settings. No strategy works perfectly everywhere; testing is essential.
Important Considerations:
Risk Management: This specific script version focuses on a Take Profit exit. It does not include an explicit Stop Loss. You MUST manage risk through appropriate position sizing, potentially adding a Stop Loss manually, or by modifying the script.
Oversold ≠ Reversal: An RSI crossover is an indicator of potential exhaustion, not a guarantee of a price reversal.
Fixed TP: A fixed percentage TP ensures small wins but may exit before larger potential moves.
Backtesting Limitations: Past performance does not guarantee future results.
RSI Pro+ strips away complexity to focus on a robust, time-honored principle, enhanced with modern visuals for the discerning trader navigating today's (and tomorrow's) challenging markets

Keltner Channel StrategyOverview
The Keltner Channel Strategy is a powerful trend-following and mean-reversion system that leverages the Keltner Channels, EMA crossovers, and ATR-based stop-losses to optimize trade entries and exits. This strategy has proven to be highly effective, particularly when applied to Gold (XAUUSD) and other commodities with strong trend characteristics.
📈 How It Works
This strategy incorporates two trading approaches: 1️⃣ Keltner Channel Reversal Trades – Identifies overbought and oversold conditions when price touches the outer bands.
2️⃣ Trend Following Trades – Uses the 9 EMA & 21 EMA crossover, with confirmation from the 50 EMA, to enter trades in the direction of the trend.
🔍 Entry & Exit Criteria
📊 Keltner Channel Entries (Reversal Strategy)
✅ Long Entry: When the price crosses below the lower Keltner Band (potential reversal).
✅ Short Entry: When the price crosses above the upper Keltner Band (potential reversal).
⏳ Exit Conditions:
Long positions close when price crosses back above the mid-band (EMA-based).
Short positions close when price crosses back below the mid-band (EMA-based).
📈 Trend Following Entries (Momentum Strategy)
✅ Long Entry: When the 9 EMA crosses above the 21 EMA, and price is above the 50 EMA (bullish momentum).
✅ Short Entry: When the 9 EMA crosses below the 21 EMA, and price is below the 50 EMA (bearish momentum).
⏳ Exit Conditions:
Long positions close when the 9 EMA crosses back below the 21 EMA.
Short positions close when the 9 EMA crosses back above the 21 EMA.
📌 Risk Management & Profit Targeting
ATR-based Stop-Losses:
Long trades: Stop set at 1.5x ATR below entry price.
Short trades: Stop set at 1.5x ATR above entry price.
Take-Profit Levels:
Long trades: Profit target 2x ATR above entry price.
Short trades: Profit target 2x ATR below entry price.
🚀 Why Use This Strategy?
✅ Works exceptionally well on Gold (XAUUSD) due to high volatility.
✅ Combines reversal & trend strategies for improved adaptability.
✅ Uses ATR-based risk management for dynamic position sizing.
✅ Fully automated alerts for trade entries and exits.
🔔 Alerts
This script includes automated TradingView alerts for:
🔹 Keltner Band touches (Reversal signals).
🔹 EMA crossovers (Momentum trades).
🔹 Stop-loss & Take-profit activations.
📊 Ideal Markets & Timeframes
Best for: Gold (XAUUSD), NASDAQ (NQ), Crude Oil (CL), and trending assets.
Recommended Timeframes: 15m, 1H, 4H, Daily.
⚡️ How to Use
1️⃣ Add this script to your TradingView chart.
2️⃣ Select a 15m, 1H, or 4H timeframe for optimal results.
3️⃣ Enable alerts to receive trade notifications in real time.
4️⃣ Backtest and tweak ATR settings to fit your trading style.
🚀 Optimize your Gold trading with this Keltner Channel Strategy! Let me know how it performs for you. 💰📊

Supertrend pro+ (Adaptive ATR) Supertrend Pro+ (Adaptive ATR) - Param Approach
By SKP
Overview
This advanced Supertrend Pro+ strategy improves on the classic Supertrend indicator by integrating an Adaptive ATR, ensuring dynamic volatility adjustments for more accurate trend detection. This strategy filters out false signals using ADX trend strength validation and volume confirmation, making it a powerful tool for trend-following traders.
Key Features
✔ Adaptive ATR Calculation - Dynamically adjusts to market volatility for more reliable Supertrend signals.
✔ ADX Trend Filter - Ensures trades occur only in strong trending markets, avoiding false breakouts.
✔ Volume Confirmation - Prevents trading in low-liquidity conditions by verifying volume strength.
✔ Multi-Timeframe Analysis - Displays Supertrend trends from different timeframes for enhanced trade confidence.
✔ Trailing Stop & Take Profit Options - Allows flexible risk management with stop-loss and profit-targeting mechanisms.
✔ Custom Alerts for Trade Signals - Alerts trigger on confirmed Supertrend buy/sell signals and potential trend shifts.
✔ Max Drawdown Protection - Automatically closes trades if equity drops beyond a set percentage, preventing excessive losses.
How It Works
Adaptive ATR Calculation
Instead of using a fixed ATR, this strategy calculates an adaptive ATR based on a longer-term ATR baseline.
If volatility increases, the ATR expands dynamically, ensuring stop-losses and Supertrend calculations adjust accordingly.
Supertrend Confirmation
Uses an enhanced Supertrend algorithm with adaptive ATR to determine trend direction.
If price crosses above the trendline, it signals a bullish reversal (Buy Signal).
If price crosses below the trendline, it signals a bearish reversal (Sell Signal).
ADX Trend Strength Filter
Trades are only taken when ADX is above the threshold, ensuring entry in strong trending markets.
Volume Confirmation
Uses a relative volume filter to ensure sufficient liquidity before entering trades.
Helps avoid false breakouts in low-volume conditions.
Risk Management
Trailing Stop Loss - Automatically moves the stop as price moves in favor of the trade.
Manual Stop Loss & Take Profit - Allows precise percentage-based exit points.
Max Drawdown Protection - Closes all trades if equity falls below a set threshold, reducing risk.
Multi-Timeframe Supertrend Table
Displays Supertrend signals across different timeframes (1 min, 5 min, 15 min, 1 hour, Daily)
Helps traders align their entries with higher timeframe trends for better accuracy.
Custom Alerts
Alerts notify when a new buy/sell signal appears.
Extra early warning alerts indicate potential trade setups before confirmation.
How to Use
📌 For trend-following traders:
Focus on entries in the direction of the higher timeframes.
Only enter when ADX is trending and volume confirms liquidity.
📌 For scalpers:
Use shorter timeframes (1m, 5m, 15m) for quick trades.
Adjust the ATR multiplier and Adaptive ATR sensitivity for tighter stops.
📌 For swing traders:
Use longer timeframes (1H, Daily) for more stable trends.
Enable trailing stop loss to lock in profits as the trend progresses.
Inputs & Customization
ATR Period & Adaptive ATR Sensitivity
Supertrend Multiplier
ADX Filter & Threshold
Volume Confirmation Settings
Stop Loss & Take Profit Options
Multi-Timeframe Supertrend Display
Custom Alerts

TradeShields Strategy Builder🛡 WHAT IS TRADESHIELDS?
This no-code strategy builder is designed for traders on TradingView, offering an intuitive platform to create, backtest, and automate trading strategies. While identifying signals is often straightforward, the real challenge in trading lies in managing risk and knowing when not to trade. It equips users with advanced tools to address this challenge, promoting disciplined decision-making and structured trading practices.
This is not just a collection of indicators but a comprehensive toolkit that helps identify high-quality opportunities while placing risk management at the core of every strategy. By integrating customizable filters, robust controls, and automation capabilities, it empowers traders to align their strategies with their unique objectives and risk tolerance.
_____________________________________
🛡 THE GOAL: SHIELD YOUR STRATEGY
The mission is simple: to shield your strategy from bad trades . Whether you're a seasoned trader or just starting, the hardest part of trading isn’t finding signals—it’s avoiding trades that can harm your account. This framework prioritizes quality over quantity , helping filter out suboptimal setups and encouraging disciplined execution.
With tools to manage risk, avoid overtrading, and adapt to changing market conditions, it protects your strategy against impulsive decisions and market volatility.
_____________________________________
🛡 HOW TO USE IT
1. Apply Higher Timeframe Filters
Begin by analyzing broader market trends using tools like the 200 EMA, Ichimoku Cloud, or Supertrend on higher timeframes (e.g., daily or 4-hour charts).
- Example: Ensure the price is above the 200 EMA on the daily chart for long trades or below it for short trades.
2. Identify the Appropriate Entry Signal
Choose an entry signal that aligns with your model and the asset you're trading. Options include:
Supertrend changes for trend reversals.
Bollinger Band touches for mean-reversion trades.
RSI strength/weakness for overbought or oversold conditions.
Breakouts of key levels (e.g., daily or weekly highs/lows) for momentum trades.
MACD and TSI flips.
3. Determine Take-Profit and Stop-Loss Levels
Set clear exit strategies to protect your capital and lock in profits:
Use single, dual, or triple take-profit levels based on percentages or price levels.
Choose a stop-loss type, such as fixed percentage, ATR-based, or trailing stops.
Optionally, set breakeven adjustments after hitting your first take-profit target.
4. Apply Risk Management Filters
Incorporate risk controls to ensure disciplined execution:
Limit the number of trades per day, week, or month to avoid overtrading.
Use time-based filters to trade during specific sessions or custom windows.
Avoid trading around high-impact news events with region-specific filters.
5. Automate and Execute
Leverage the advanced automation features to streamline execution. Alerts are tailored specifically for each supported platform, ensuring seamless integration with tools like PineConnector, 3Commas, Zapier, and more.
_____________________________________
🛡 CORE FOCUS: RISK MANAGEMENT, AUTOMATION, AND DISCIPLINED TRADING
This builder emphasizes quality over quantity, encouraging traders to approach markets with structure and control. Its innovative tools for risk management and automation help optimize performance while reducing effort, fostering consistency and long-term success.
_____________________________________
🛡 KEY FEATURES
General Settings
Theme Customization : Light and dark themes for a tailored interface.
Timezone Adjustment : Align session times and news schedules with your local timezone.
Position Sizing : Define lot sizes to manage risk effectively.
Directional Control : Choose between long-only, short-only, or both directions for trading.
Time Filters
Day-of-Week Selection : Enable or disable trading on specific days.
Session-Based Trading : Restrict trades to major market sessions (Asia, London, New York) or custom windows.
Custom Time Windows : Precisely control the timeframes for trade execution.
Risk Management Tools
Trade Limits : Maximum trades per day, week, or month to avoid overtrading.
Automatic Trade Closures : End-of-session, end-of-day, or end-of-week options.
Duration-Based Filters : Close trades if take-profit isn’t reached within a set timeframe or if they remain unprofitable beyond a specific duration.
Stop-Loss and Take-Profit Options : Fixed percentage or ATR-based stop-losses, single/dual/triple take-profit levels, and breakeven stop adjustments.
Economic News Filters
Region-Specific Filters : Exclude trades around major news events in regions like the USA, UK, Europe, Asia, or Oceania.
News Avoidance Windows : Pause trades before and after high-impact events or automatically close trades ahead of scheduled news releases.
Higher Timeframe Filters
Multi-Timeframe Tools : Leverage EMAs, Supertrend, or Ichimoku Cloud on higher timeframes (Daily, 4-hour, etc.) for trend alignment.
Chart Timeframe Filters
Precision Filtering : Apply EMA or ADX-based conditions to refine trade setups on current chart timeframes.
Entry Signals
Customizable Options : Choose from signals like Supertrend, Bollinger Bands, RSI, MACD, Ichimoku Cloud, or EMA pullbacks.
Indicator Parameter Overrides : Fine-tune default settings for specific signals.
Exit Settings
Flexible Take-Profit Targets : Single, dual, or triple targets. Exit at significant levels like daily/weekly highs or lows.
Stop-Loss Variability : Fixed, ATR-based, or trailing stop-loss options.
Alerts and Automation
Third-Party Integrations : Seamlessly connect with platforms like PineConnector, 3Commas, Zapier, and Capitalise.ai.
Precision-Formatted Alerts : Alerts are tailored specifically for each platform, ensuring seamless execution. For example:
- PineConnector alerts include risk-per-trade parameters.
- 3Commas alerts contain bot-specific configurations.
_____________________________________
🛡 PUBLISHED CHART SETTINGS: 15m COMEX:GC1!
Time Filters : Trades are enabled from Tuesday to Friday, as Mondays often lack sufficient data coming off the weekend, and weekends are excluded due to market closures. Custom time sessions are turned off by default, allowing trades throughout the day.
Risk Filters : Risk is tightly controlled by limiting trades to a maximum of 2 per day and enabling a mechanism to close trades if they remain open too long and are unprofitable. Weekly trade closures ensure that no positions are carried over unnecessarily.
Economic News Filters : By default, trades are allowed during economic news periods, giving traders flexibility to decide how to handle volatility manually. It is recommended to enable these filters if you are creating strategies on lower timeframes.
Higher Timeframe Filters : The setup incorporates confluence from higher timeframe indicators. For example, the 200 EMA on the daily timeframe is used to establish trend direction, while the Ichimoku cloud on the 30-minute timeframe adds additional confirmation.
Entry Signals : The strategy triggers trades based on changes in the Supertrend indicator.
Exit Settings : Trades are configured to take partial profits at three levels (1%, 2%, and 3%) and use a fixed stop loss of 2%. Stops are moved to breakeven after reaching the first take profit level.
_____________________________________
🛡 WHY CHOOSE THIS STRATEGY BUILDER?
This tool transforms trading from reactive to proactive, focusing on risk management and automation as the foundation of every strategy. By helping users avoid unnecessary trades, implement robust controls, and automate execution, it fosters disciplined trading.

Multi Timeframe RSI Buy Sell Strategy [TradeDots]The "Multi Timeframe RSI Buy/Sell Strategy" is a trading strategy that utilizes Relative Strength Index (RSI) indicators from multiple timeframes to provide buy and sell signals.
This strategy allows for extensive customization, supporting up to three distinct RSIs, each configurable with its own timeframe, length, and data source.
HOW DOES IT WORK
This strategy integrates up to three RSIs, each selectable from different timeframes and customizable in terms of length and source. Users have the flexibility to define the number of active RSIs. These selections visualize as plotted lines on the chart, enhancing interpretability.
Users can also manage the moving average of the selected RSI lines. When multiple RSIs are active, the moving average is calculated based on these active lines' average value.
The color intensity of the moving average line changes as it approaches predefined buying or selling thresholds, alerting users to potential signal generation.
A buy or sell signal is generated when all active RSI lines simultaneously cross their respective threshold lines. Concurrently, a label will appear on the chart to signify the order placement.
For those preferring not to display order information or activate the strategy, an "Enable backtest" option is provided in the settings for toggling activation.
APPLICATION
The strategy leverages multiple RSIs to detect extreme market conditions across various timeframes without the need for manual timeframe switching.
This feature is invaluable for identifying divergences across timeframes, such as detecting potential short-term reversals within broader trends, thereby aiding traders in making better trading decisions and potentially avoiding losses.
DEFAULT SETUP
Commission: 0.01%
Initial Capital: $10,000
Equity per Trade: 60%
RISK DISCLAIMER
Trading entails substantial risk, and most day traders incur losses. All content, tools, scripts, articles, and education provided by TradeDots serve purely informational and educational purposes. Past performances are not definitive predictors of future results.
TradeDots Stochastic Z-Score

5 ema strategyThis Strategy is based of Subhashish Pani's (power of stocks) 5 EMA Strategy.strategy used for sell in 5 minutes and for buy in 15 minutes ..
Rules for this strategy ..
Sell signal -
1) if price is above 5 Ema and not touching Ema use as alert candle..
2) if price break low of alert candle strategy open trade ..
3) if price move more upside low of alert candle keep change into next candle ..
4) input we can select number of trade per day .as rule should take only 4 signal should execute
5) stop loss is fixed highest high of last 2 candle and take profit is input multiply of stop loss
buy signal-
1) if price is below 5 Ema and not touching Ema use as alert candle..
2) if price break high of alert candle strategy open trade ..
3) if price move more downside high of alert candle keep change into next candle ..
4) input we can select number of trade per day .as rule should take only 4 signal should execute
5) stop loss is fixed lowest low of last 2 candle and take profit is input multiply of stop loss
notes -input can be selected which side should take signal either buy or sell side ...number of trade can be adjusted ..
Disclaimer -Traders can use this script as a starting point for further customization or as a reference for developing their own trading strategies. It's important to note that past performance is not indicative of future results, and thorough testing and validation are recommended before deploying any trading strategy.

DCA-Integrated Trend Continuation StrategyIntroducing the DCA-Integrated Trend Continuation Strategy 💼💰
The DCA-Integrated Trend Continuation Strategy represents a robust trading methodology that harnesses the potential of trend continuation opportunities while seamlessly incorporating the principles of Dollar Cost Averaging (DCA) as a risk management and backup mechanism. This strategy harmoniously blends these two concepts to potentially amplify profitability and optimize risk control across diverse market conditions.
This strategy is well-suited for both trending and ranging markets. During trending markets, it aims to capture and ride the momentum of the trend while optimizing entry points. In ranging markets or pullbacks, the DCA feature comes into play, allowing users to accumulate more assets at potentially lower prices and potentially increase profits when the market resumes its upward trend. This cohesive approach not only enhances the overall effectiveness of the strategy but also fosters a more resilient and adaptable trading approach in ever-changing market dynamics.
💎 How it Works:
▶️ The strategy incorporates a customizable entry signal based on candlestick patterns, enabling the identification of potential trend continuation opportunities. By focusing on consecutive bullish candles, it detects the presence of bullish momentum, indicating an optimal time to enter a long position.
To refine the precision of the signals, traders can set a specific percentage threshold for the closing price of the candle, ensuring it is above a certain percentage of its body. This condition verifies strong bullish momentum and confirms significant upward movement within the candle, thereby increasing the reliability of the signal.
In addition, the strategy offers further confirmation by examining the relationship between the closing price of the signal candle and its previous candles. If the closing price of the signal candle is higher than its preceding candles, it provides an additional layer of assurance before entering a position. This approach is particularly effective in detecting sharp movements and capturing significant price shifts, as it focuses on identifying instances where the closing price shows clear strength and outperforms the previous candle's price action. By prioritizing such occurrences, the strategy aims to capture robust trends and capitalize on notable market movements.
▶️ During market downturns, the strategy incorporates intelligent management of price drops, offering flexibility through fixed or customizable price drop percentages. This unique feature allows for additional entries at specified drop percentages, enabling traders to accumulate positions at more favorable prices.
By strategically adjusting the custom price drop percentages, you can optimize your entry points to potentially maximize profitability. Utilizing lower percentages for initial entries takes advantage of price fluctuations, potentially yielding higher returns. On the other hand, employing higher percentages for final entries adopts a more cautious approach during significant market downturns, emphasizing enhanced risk management. This adaptive approach ensures that the strategy effectively navigates challenging market conditions while seeking to optimize overall performance.
▶️ To enhance performance and mitigate risks, the strategy integrates average purchase price management. This feature dynamically adjusts the average buy price percentage decrease after each price drop, expediting the achievement of the target point even in challenging market conditions. By reducing recovery times and ensuring investment safety, this strategy optimizes outcomes for traders.
▶️ Risk management is at the core of this strategy, prioritizing the protection of capital. It incorporates an account balance validation mechanism that conducts automatic checks prior to each entry, ensuring alignment with available funds. This essential feature provides real-time insights into the affordability of price drops and the number of entries, enabling traders to make informed decisions and maintain optimal risk control.
▶️ Furthermore, the strategy offers take profit options, allowing traders to secure gains by setting fixed percentage profits from the average buy price or using a trailing target. Stop loss protection is also available, enabling traders to set a fixed percentage from the average purchase price to limit potential losses and preserve capital.
▶️ This strategy is fully compatible with third-party trading bots, allowing for easy connectivity to popular trading platforms. By leveraging the TradingView webhook functionality, you can effortlessly link the strategy to your preferred bot and receive accurate signals for position entry and exit. The strategy provides all the necessary alert message fields, ensuring a smooth and user-friendly trading experience. With this integration, you can automate the execution of trades, saving time and effort while enjoying the benefits of this powerful strategy.
🚀 How to Use:
To effectively utilize the DCA-Integrated Trend Continuation Strategy, follow these steps:
1. Choose your preferred DCA Mode - whether by quantity or by value - to determine how you want to size your positions.
2. Customize the entry conditions of the strategy to align with your trading preferences. Specify the number of consecutive bullish candles, set a desired percentage threshold for the close of the signal candle relative to its body, and determine the number of previous candles to compare with.
3. Adjust the pyramiding parameter to suit your risk tolerance and desired returns. Whether you prefer a more conservative approach with fewer pyramids or a more aggressive stance with multiple pyramids, this strategy offers flexibility.
4. Personalize the price drop percentages based on your risk appetite and trading strategy. Choose between fixed or custom percentages to optimize your entries in different market scenarios.
5. Configure the average purchase price management settings to control the percentage decrease in the average buy price after each price drop, ensuring it aligns with your risk tolerance and strategy.
6. Utilize the account balance validation feature to ensure the strategy's actions align with your available funds, enhancing risk management and preventing overexposure.
7. Set take profit options to secure your gains and implement stop loss protection to limit potential losses, providing an additional layer of risk management.
8. Use the date and time filtering feature to define the duration during which the strategy operates, allowing for specific backtesting periods or integration with a trading bot.
9. For automated trading, take advantage of the compatibility with third-party trading bots to seamlessly integrate the strategy with popular trading platforms.
By following these steps, traders can harness the power of the DCA-Integrated Trend Continuation Strategy to potentially maximize profitability and optimize their trading outcomes in both trending and ranging markets.
⚙️ User Settings:
To ensure the backtest result is representative of real-world trading conditions, particularly in the highly volatile Crypto market, the default strategy parameters have been carefully selected to produce realistic results with a conservative approach. However, you have the flexibility to customize these settings based on your risk tolerance and strategy preferences, whether you're focusing on short-term or long-term trading, allowing you to potentially achieve higher profits. The backtesting was conducted using the BTCUSDT pair in 15-minute timeframe on the Binance exchange. Users can configure the following options:
General Settings:
- Initial Capital (Default: $10,000)
- Currency (Default: USDT)
- Commission (Default: 0.1%)
- Slippage (Default: 5 ticks)
Order Size Management:
- DCA Mode (Default: Quantity)
- Order Size in Quantity (Default: 0.01)
- Order Size in Value (Default: $300)
Strategy's Entry Conditions:
- Number of Consecutive Bullish Candles (Default: 3)
- Close Over Candle Body % (Default: 50% - Disabled)
- Close Over Previous Candles Lookback (Default: 14 - Disabled)
- Pyramiding Number (Default: 30)
Price Drop Management:
- Enable Price Drop Calculations (Default: Enabled)
- Enable Current Balance Check (Default: Enabled)
- Price Drop Percentage Type (Default: Custom)
- Average Price Move Down Percentage % (Default: 50%)
- Fixed Price Drop Percentage % (Default: 0.5%)
- Custom Price Drop Percentage % (Defaults: 0.5, 0.5, 0.5, 1, 3, 5, 5, 10, 10, 10)
TP/SL:
- Take Profit % (Default: 3%)
- Stop Loss % (Default: 100%)
- Enable Trailing Target (Default: Enabled)
- Trailing Offset % (Default: 0.1%)
Backtest Table (Default: Enabled)
Date & Time:
- Date Range Filtering (Default: Disabled)
- Start Time
- End Time
Alert Message:
- Alert Message for Enter Long
- Alert Message for Exit Long
By providing these customizable settings, the strategy allows you to tailor it to your specific needs, enhancing the adaptability and effectiveness of your trading approach.
🔐 Source Code Protection:
The source code of the DCA-Integrated Trend Continuation Strategy is designed to be robust, reliable, and highly efficient. Its original and innovative implementation merits protecting the source code and limiting access, ensuring the exclusivity of this strategy. By safeguarding the code, the integrity and uniqueness of the strategy are preserved, giving users a competitive edge in their trading activities.

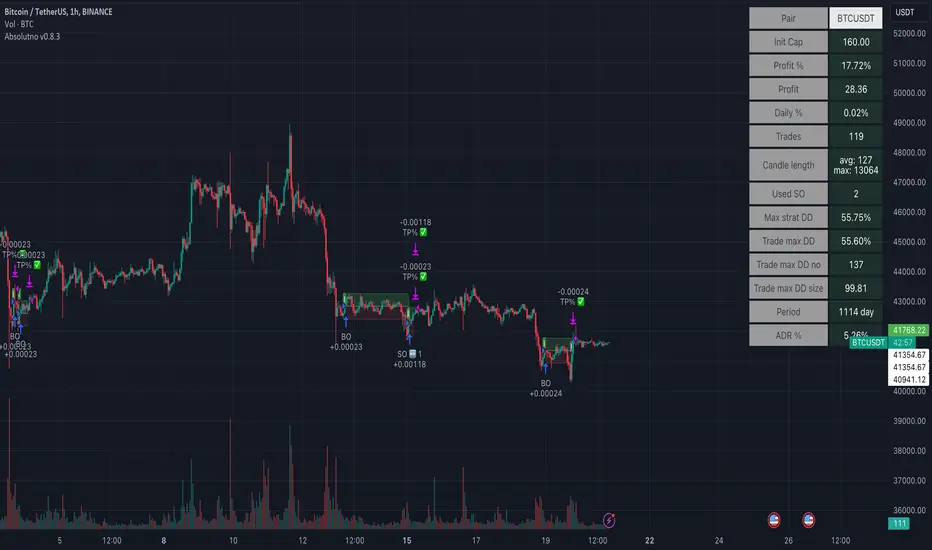
TTP AbsolutnoAbsolutno is a pine script strategy for backtesting DCA bots with a different approach for placing both safety orders and take profit levels.
Motivation
Using DCA bots with safety orders most of the time is great during bull markets but in bear markets and strong downtrends it can be really challenging to close your deals only relying on safety orders placed based on percentages: price scale and volume scale.
In the past we introduced a script called "add funds simulator" that people used for sending alerts to bots to add funds and help closing deals in red.
We want to cross the use of TA with the safety orders with the intention of getting better results than statically placed safety orders.
What does Absolutno do?
Absolutno uses TA for safety orders, both for opening new safety orders and also to define how low they should be placed based on the volatility of the asset.
Main features
- ATR SO mode: Safety orders can be placed dynamically based on the general volatility of the asset plus the current volatility.
- TA based SO entries: Safety orders are only placed when the deal start condition is true not only when the price pulls back below the next safety order price level. This acts like a hybrid between "add funds simulator" and a traditional DCA bot. Once a safety order is filled, the next SO level gets active waiting for a DSC to trigger below the new entry level.
- Take profit scale: Traditional DCA bots offer a percentage or TA based exit conditions. Absolutno offers a new mode when you can decide to increase or decrease the TP level with each SO getting filled. For example a value of 1.1 TP scale will cause that each SO getting filled makes the TP% grow 10%. A value of 0.9% will reduce each SO by 10%. The lower the price goes you can "lower your expectation", or if you are filling bullish you can actually increase it.
External signal
It comes with a built-in deal start condition that uses RSI cross over 30 which is used only for illustration purposes since Absolutno is designed to be used with external signals.
Use any external signal to enter a new deal and for adding new safety orders.
You can also activate external take profit signal.
When external TP is enabled, all TP features from the bot are disabled to only react to what the external signal instructs the bot.
Bot integration and alerts
Three type of alerts will be sent to the bot: open deal, add funds and close deal.
You will need to enter your bot id and email token in the settings.
Since this strategy uses add funds: you must be aware that the alerts sent from this strategy will contain the amount of funds to add and therefore the bot receiving these alerts will respect them EVEN if the bot was defined with different SO sizes.
Please make sure you fully understand this before using this signal.
The base order alerts don't contain funds information so the bot will always use the base order size as defined in its own settings.
APIBridge support and resistance strategy for NSE OptionsStrategy Premise:
The strategy works on the Support and Resistance . The user specifies the trigger price and the strategy will open trades as soon as the market closes after crossing the trigger price. The stoploss and target is compulsory and the trades will close if either the target or stoploss is hit or Intraday end session is reached in case of MIS (Intraday settings) or expiry is reached .
If the positional settings (NRML) has been chosen then the trades will close when either stoploss or target hits or expiry is reached
==========Consecutive trades==========
The strategy takes a long entry on call long put short setting and a short position on put long and call short settings so call long and put short entries can be taken one after another without the need of closing the one of them. Similarly put long and call short can be taken one after another.
But put long and call short can not be taken one after another with both the trades open because on tradingview closes the previous long or short when we take short or long respectively. Similarly call long and put short can not be taken one after another with both the trades open
Create Alert
Simply copy the text written in Alert Message field on the top of input section and replace everything in the message box of the alert with this text
Strategy Parameters
1. Alert Message : Copy the string in the input field and replace with the text in the message box of the alert to get the automated trades
2. Use Backtesting : Check this box to use the backtesting parameters . The backtesting parameters will only show trades between the specified intervals
3. Starting Date and Time : The strategy will only place trades after this time according to logic
4. Ending Date and Time : The strategy willonly place trades before this time according to logic
5. Segment Type : Choose the segment type . MIS is Intraday and NRML is normal cash and carry/Positional
6. Start Session : This is the session in which the strategy will take entry according to logic every day . This parameter works only with MIS and not NRML
7. Ending Session : This is the session which will square off all the open trades . This parameter works only with MIS and not NRML
8. Long : Check this box for Long/Buy Positions
9. Long Price : This is the trigger price , the strategy will Long/Buy when the price closes after crossing this line.
10. Call or Put on Long : Choose whether you want to Long/Buy Call or Put
11. Stoploss and Target type for Long : Choose from the given types
12. Long Target : specify the target
13. Stoploss Value for Long : Specify the stoploss value
14. Use TSL : Check this to use trailing stoploss
15. ATR settings : Set the atr settings to use atr based stoploss
16. Short : Check this to Short/Sell
17. Short Price : This is the trigger price , the strategy will Long/Buy when the price closes after crossing this line.
18. Call or Put on Short: Choose whether you want to Long/Buy Call or Put
19. Stoploss and Target type for Short: Choose from the given types
20. Short Target : specify the target
21. Stoploss Value for Short: Specify the stoploss value
22. Use TSL : Check this to use trailing stoploss
23. ATR settings : Set the atr settings to use atr based stoploss
24. Instrument Type : Choose the option type
25. Expiry Settings : Configure the expiry date . the strategy will not take entry after expiry
26. Symbol : Specify Symbol name if want to trade in symbol other than current chart symbol
27. Strike Type/Money Type : select the money type
28. Strike Difference : Enter the difference between the two consecutive strikes of the choosen asset
29. Strike Distance from ATM : Enter the distance of strike from ATM which you want to buy in any strike type/money type . If zero has been choosen in case of OTM/ ITM then the strike dif will used as default
30. Quantity : Specify the number of lots you want to trade
31. Strategy Tag : Specify the strategy tag you wan to use with APIBRIDGE . If left blank it will trade in the strategy tag fed in the APIBRIDGE

3Commas Bot DCA Backtester & Signals FREEThis is a DCA Strategy backtester + signals, built to emulate the 3Commas DCA bots. It uses your choice of 4 different buy signals, 2 of which can be adjusted in the settings. Everything is customizable so you can backtest specific settings with different buy signals and find the best performing strategy for your risk tolerance and capital. It can be used to backtest strategies on stocks as well, but just make sure your base order is larger than the share price for the entire backtesting range or it will not calculate properly.
You can use this template to code your own buy signals and then backtest them as a DCA strategy if you know some basic pine script.
The indicator shows all of your backtesting orders on the chart. The red line is your take profit level, the blue line is your average price level, the white line is your first order and the green lines are your average down orders. If you enable a stop loss in the settings your stop loss will be shown as an orange line once all of your average down orders have been hit, it will not be set until price has dipped below your covered trading range.
These levels update when things change during backtesting so you can visualize your strategy and how it would perform as well as see if your percentage deviation is large enough to cover dips. When backtesting trades are taken, the chart will show where they were taken(in backtesting) along with info on those trades such as the number each order is, the size of that order and the percentage deviation that order is from the initial buy.
SENDING SIGNALS TO 3COMMAS
Tradingview cannot sync this backtester to 3Commas and with the way alerts are setup for strategies on Tradingview, the best option for you to give signals to your bot would be to use this backtester to figure out what trigger you want to use and then setup that indicator separately to send alerts to your bot. All of the indicators used for signals in this backtester are available for free and can be configured to match this backtester and send alerts to 3Commas for you. Just make sure you set your alerts to once per bar close and don’t use less than a 15 second timeframe because then you could trigger the Tradingview threshold for alerts and get your alerts shut off.
You can also use this backtester with your own buy triggers if you know a little pine script. Just make copy of the script and code in your own buy signals and see how it backtests.
INFO PANEL FOR ANALYZING YOUR STRATEGY
The right hand side of the screen will show an info panel that shows a lot of different information so you can quickly see your bot settings and how it performed right on the screen.
In the top right corner you will see in purple your bot settings. These include your stoploss % if turned on, take profit %, average down order %, average down order % multiplier, volume multiplier, max number of orders allowed and size of your base order.
The top section of the first column “Current Trade” shows these stats: the open trade’s average price, the open trade’s take profit price, the open trade’s PNL, how far price is from your open tarde’s take profit level in percentage, your open position size and number of open orders.
The bottom section of the first column “Overall Performance” shows these stats: total number of trades taken during backtesting range, the largest amount of trades that were open at one time during backtesting, the max drawdown, the average number of bars per trade, gross profit, net profit, percent profit from your initial capital, current portfolio value and your initial capital.
CUSTOMIZABLE OPTIONS TO FIND THE PERFECT STRATEGY
Stoploss On/Off
This will turn your stoploss on or off. By default it is set to off and will not affect anything unless turned on.
Stoploss Percentage
This is the percentage below your final average down order price that will be set as a stoploss to keep your account from going too far in the red on big dips.
Take Profit Percentage - This is the percentage of profit you want the trade to hit before taking profit on your entire DCA trade. This level updates everytime you average down.
Average Down Percentage - This is the percentage that price has to drop from your initial order to initiate your first safety order. If the Average Down Percent Multiplier is set to 1 then this percentage will be the same for every average down order.
Average Down Percentage Multiplier - This multiplies your Average Down Percentage so each safety order needs a larger percentage deviation than the previous one. This keeps your buys closer together at the beginning and further apart when you hit more orders so you can extend your trading range but still be aggressive when price is going sideways.
Volume Multiplier Per New Order - This multiplies the size of each trade based on your base order. If you set it to a 2x multiplier then each average down order will be 2 times the size of the last one. So for example, a $100 base order with a 2x multiplier would have these values for the first 3 average down orders: 200, 400, 800.
Size Of Base Order - This is the size of your first position entry and will be used as a starting point for the volume multiplier. If your base order is $100 then it will buy $100 worth of whatever crypto you are backtesting this on. If you are looking at stock charts, you need to make sure your base order is higher than the share price across the entire backtesting range or it will not perform correctly.
Max Number Of Orders - This is the maximum number of orders the bot can take, including your base order. Adjust this to suit the amount of capital you are willing to allocate to your bot based on how much money it will require to run according to your bot settings.
TIPS ON HOW TO USE FOR BEST RESULTS
If you don’t have a lot of capital to work with, then use longer timeframes with a reasonable take profit percentage so that you don’t need a lot of average down orders. You can also try keeping the volume multiplier close to 1.
You can use the 3Commas dca bot settings page to see how much capital you will need for your strategy if you match it to the settings you have on this indicator. You can also check to see how much of a percentage deviation your bot is covering to make sure you have a reasonable range to trade in and orders to cover big dips. You can also check your coverage by seeing how far down the chart the green lines cover, which are your average down orders.
Make sure the initial capital in the properties tab of the settings has enough to cover all of your orders otherwise you will get unrealistic backtesting results. Also, make sure you leave the order size in the properties tab on contracts so it calculates your trades correctly. The only settings you need to touch in the properties tab is the initial capital. Unless you are trading somewhere that has lower commission fees, then you can change that to match, but leave all the other settings as is for it to function properly.
Increasing the volume multiplier will make your average price and take profit target follow the price action a lot closer as price falls, but it can also lead to having very large orders very quickly once you get into the 1.5-3x multiple range. Try using a high volume multiplier with less safety orders and you will get better results, however you need to have money on the sidelines to add on major dips to keep your bot turning a profit. Be very careful with this as greed and impatience will hurt your overall performance. This bot is meant to make money with lots of small wins so don’t get greedy and make sure you have enough money to cover large dips. If you are being aggressive with your bot, then I recommend only using 25% or less of your portfolio to trade aggressively and then use the smart trade feature on 3commas to add chunks of funds to your trades when price dips below your last safety order. Or if you want it to run without any supervision, then use lower volume multipliers and have lots of safety orders that can cover entire bear markets and still keep buying lower.
It’s a good idea to have some capital on the sidelines that you can add in when price dips quickly. This will help lower your average price and allow your bot to get out in profit quicker. 3Commas bot has a smart trade feature that will allow you to track your average price when adding extra funds and it will automatically update your other orders which is very convenient. Look at the longer timeframes when price dips and only add chunks at major areas where price is very likely to bounce. Or you can be aggressive when trading and add to your position when price dips and is at a likely bounce zone to maximize profits.
Only trade coins that have a good amount of liquidity as the larger your orders get, the harder it will be to sell if there isn’t much liquidity. Also, beware of how large your first order is as it will usually be a market order and can move the market if there is not much liquidity.
Since this bot takes a lot of trades and performs best when taking small profits consistently, you will need to factor in exchange fees. The bot is set to .5% commission(you can change this) on the buy and sell orders as most exchanges charge that amount. Some exchanges offer no fee trading on certain coins so be sure to look around for those so you can keep the commissions and maximize profits.
I strongly encourage you to try out a lot of different setting combinations across multiple different coins and do it across a few months to see how it would have performed under various market conditions. This will help you get a better idea of how much of a percentage deviation you’ll need to be able to cover to keep your bot running and making constant profits. You can also use the deep backtesting feature of the strategy panel to see how it would have done, but just beware that the info panel of the indicator will not reflect deep backtesting results, only the normal backtesting range.
MARKETS
This backtester can be used on any market including crypto, stocks, forex & futures. You just need to make sure your base order is larger than the share price when using this on things besides crypto.
TIMEFRAMES
This backtester can be used on all timeframes.

Strategy Myth-Busting #1 - UT Bot+STC+Hull [MYN]This is part of a new series we are calling "Strategy Myth-Busting" where we take open public manual trading strategies and automate them. The goal is to not only validate the authenticity of the claims but to provide an automated version for traders who wish to trade autonomously.
Our first one is an automated version of the " The ULTIMATE Scalping Trading Strategy for 2022 " strategy from " My Trading Journey " who claims to have achieved not only profits but a 98.3% win rate. As you can see from the backtest results below, I was unable to substantiate anything close to that that claim on the same symbol (NVDA), timeframe (5m) with identical instrument settings that " My Trading Journey " was demonstrating with. Strategy Busted.
If you know of or have a strategy you want to see myth-busted or just have an idea for one, please feel free to message me.
This strategy uses a combination of 3 open-source public indicators:
UT Bot Alerts by QuantNomad
STC Indicator - A Better MACD By shayankm
Basic Hull Ma Pack tinkered by InSilico
Trading Rules:
5 min candles
Long
New Buy Signal from UT Bot Alerts Strategy
STC is green and below 25 and rising
Hull Suite is green
Short
New Sell Signal from UT Bot Alerts Strategy
STC is red and above 75 and falling
Hull Suite is red

3C Crossover with TTP & TSLThis is not a set and forget strategy. It needs constant tweaking to maintain a high winrate. Also what works on one pair can be horrible on another.
This strategy works best on the 1 min or 5 min TF but also works well on the 15 min. Haven't done any testing in higher TF's as im only interested in scalping.
If enabled you can retrive data for the filters on any TF.
The strategy do not repaint.
You do not need a 3c subscription to run this strategy as the bot turns on and off the bot itself.
Instructions for the 3commas connector:
1. First, you need to prepare 3commas Long/Short bots that will only listen to custom TV signals.
2. Inputs for the 3commas bot can be found at the end of the user inputs.
3. Once you have entered the required details into the inputs, turn on 3commas comments. They should appear on the chart (looks messy).
4. Now you can add the alert where you should paste the 3commas Webhook URL: 3commas.io
5. For the alert message text insert the placeholder {{strategy.order.comment}} and delete the rest. 6. Once the alert is saved, you can turn off those 3commas comments to have a clearer chart.
7. With a new alert, the bot and trade should launch.
Long or Short trades are determined with a crossing of the fast MA over the slow MA for Long and the opposite for Short. By checking Close position on MA cross the deal will close on a crossover/under of the 2 MA's
You can select from various different MA's and of course lenghts. You can add both EMA filter on any lenght aswell as ATR to determine to go long or short.
Using the MA gap can help you to not enter trades in a low volatile ranging market.
The RSI filter, sets the maximum RSI threshold for a long position and the minimum for a short. By default and what i recomend is that you enter Longs when RSI is above 50 and shorts when RSI are below 50.
-You can set confirmation of the trade direction with RSI , i.e. for Long the RSI must rise a specified number of bars back, vice versa for Short.
Enabling the pullback filter is great to avoid Longing tops and Shorting bottoms.
Stop loss can be set be either a fixed percentage or by using ATR
Take profit can be set by using percentage, ATR or RiskReward ratio(RR). if you use ATR as a stoploss i recomend using RR as the TP.
Yu can choose to trail the TP with either Percentage or ATR
Whats ahead. I really want to incorporate RSI divergencies, but haven't figured out how yet. Any other ideas would be greatly appreciated.
Have a look at my other strategies. They are similar to this but works abit differently.

3C MACD & RSI Scalper no repaintThis is not a set and forget strategy. It needs constant tweaking to maintain a high winrate. Also what works on one pair can be horrible on another.
This strategy works best on the 1 min or 5 min TF but also works well on the 15 min. Haven't done any testing in higher TF's as im only interested in scalping.
If enabled you can retrive data on the MACD and RSI from any timeframe.
The strategy do not repaint.
You can filter on sessions as well as days. Often trading during say only the EU times and not trading during weekends yields better results. This is because weekeds and eg. the Asia Sessions are alot less volatile.
You do not need a 3c subscription to run this strategy as the bot turns on and off the bot itself.
Instructions for the 3commas connector:
1. First, you need to prepare 3commas Long/Short bots that will only listen to custom TV signals.
2. Inputs for the 3commas bot can be found at the end of the user inputs.
3. Once you have entered the required details into the inputs, turn on 3commas comments. They should appear on the chart (looks messy).
4. Now you can add the alert where you should paste the 3commas Webhook URL: 3commas.io
5. For the alert message text insert the placeholder {{strategy.order.comment}} and delete the rest. 6. Once the alert is saved, you can turn off those 3commas comments to have a clearer chart.
7. With a new alert, the bot and trade should launch.
Long or Short trades are determined with a crossing of the fast MA over the slow MA for Long and the opposite for Short. Trades should only happen close to the crossovers.
You can select from various different MA's and of course lenghts. I often find that using HEMA as the fast MA and DEMA as the slow give more trades while also maintaining a high winrate.
Then for Long we use the MACD indicator where we look for high peaks in negative values for Long and vice versa for Shorts. These should be significantly higher than other peaks (or if you will lower peaks for a Long).
The key is to detect high peaks on the histogram, which we will try to achieve by checking if the last 2 values were higher than X bars back. If you want to make it even more specific, then you can turn on the additional checkbox which compares the current value to the average value of X bars back, and if it is greater than, say, 72% the value of the average then it's ok to enter the trade.
The RSI filter, sets the maximum RSI threshold for a long position and the minimum for a short. By default and what i recomend is that you enter Longs when RSI is above 50 and shorts when RSI are below 50.
-You can set confirmation of the trade direction with RSI, i.e. for Long the RSI must rise a specified number of bars back, vice versa for Short.
Enabling the pullback filter is great to avoid Longing tops and Shorting bottoms.
Whats ahead. I really want to incorporate RSI divergencies, but haven't figured out how yet. Any other ideas would be greatly appreciated.
Have a look at my other strategies. They are similar to this but works abit differently.
The 3 strike line and the engulfing candles are not something that has an impact on the script yet, and might never be. But i do like to turn them on for a visual to see if the trade the strategy opened is a good one.

The Impossible TraderTHE IMPOSSIBLE TRADER
A simple, but effective High Freq Strategy script based on MACD or RSI trend, with extra customizable Alert Messages for Bots.
WHAT IT DOES
This script (works best at lower TimeFrames) just follow the trend of MACD or RSI on your asset.
Why it should work? Because in an upper trend, there are more chance of green candles than reds. And in dump trend there are more chance of red candles than greens.
While trend is positive, it will try to open Long orders as fast as possible at market price.
While trend is negative, it will try to open Short orders as fast as possible at market price.
HOW TO SETUP YOUR PREFERENCES
Capital : Insert a % of Margin you want to use for your positions (usually 30% is quite good)
Leverage : Choose leverage based on your plans
Trail Tick @ : This value (in Tick) tell the script "when" the "Trail Stop" order must be activated (from the Entry price)
Offset Tick @ : This is the price (in Tick) from the Trail Stop Price activated. Basically it is a Stop Loss that follow the price at a fixed distance.
SL Tick @ : Set a Stop Loss at amount Tick distance from the Entry Price. (Let's call it a Safety Stop Loss for bad decisions...)
TP Tick @ : Set a Take Profit at amount Tick distance from the Entry Price. Sometimes is better to exit in full Gain than keep positions.
Strategy : You can choose a Only Long, Only Short or Long+Short sametime strategy.
with MACD or RSI : You can try the strategy applied on MACD or applied on customizable RSI EMA
EMA : If you choosed RSI EMA, you can set any value for your testing (usually 80-120 works very nice)
Exit order after bars : Some Exchanges / Brokers apply fixed cost, and a strategy too fast could not be productive. This set will let you to delay the Exit Order on already Opened positions.
Keep Stop Loss active : If you are planning a delay for Exit Orders, sometime could be useful to keep activated Stop Loss.
Strategy Preset : Some preset I've found interesting, with good results.
BackTest Days : If there are too many results and script doesn't work, you can choose a closer range to show results.
EXTRA FEATURES
On Screen Display : OSD will show you some realtime stats about your strategy, like Asset Tick, Trading Period Range, Drawdown, Gains and not closed trade.
Alert Message : You can enter custom Long Entry/Exit and Short Entry/Exit message for your Bots (like AutoView, WunderBit, etc...). When alert is triggered, you can send custom message with {{strategy.order.comment}} in the text field
AutoView Alert Message : If you are user of AutoView, you can generate your calls. Those are tested only on Oanda with index like Sp500, US100, Us30.
TIPS ON USE
Some asset on TradingView require an higher initial capital. Go to this Script Settings -> Properties and rise Initial Capital.
Be aware of commissions and spread when evalutating a strategy. Go to this Script Settings -> Properties and set Commission and Slippage
Trail Stop and Ticks could be difficult to understand, but very profitable. Please take your time and study how it works.
Consider Tick like the minimum movement your asset can do. Ticks occurs "intra-bar", so some of your positions could be closed almost instantly.
Consider Trail Stop like a Stop Loss that keep always the same distance from your positions, but never came back . If you are in gain, say of 10 Ticks, and your Trail have 5 Ticks, this means for sure a close at minimum 5 Ticks from Entry Price.
On Screen Display will show you Ticks for your asset. This will help you on strategy settings, because not all asset responds on the same way.
ONLY LONG EXAMPLE
ONLY SHORT EXAMPLE

AlphaTrend For ProfitViewThis strategy is based on the AlphaTrend indicator by KivancOzbilgic A full description of this algorithm functionality may be found by clicking the linked image above.
Changes and/or additions:
It is now a backtestable strategy
Updated alert trigger logic
Easy integration with ProfitView to use this algorithm for automated trading
When you create an alert, and you are using ProfitView, select " alert() function calls only " as the condition option. If you would rather set your own custom alert message, select " Order fills only " instead.
There is a selectable setting in the options to trigger alert() function calls immediately, that you may use to see what text it will send.

5min Williams Fractals scalping (3commas)Another strategy I'm learning Pine Script on. It is inspired by a MoneyZG youtube strategy called "Easy 5 Minute Scalping Strategy (Simple to Follow Scalping Trading Strategy)".
Again this is a one order per trade strategy compatible with the 3commas bot (works also with the free 3commas subscription). This strategy is based on the signals from Williams Fractals, taking the signals in reverse - red triangle indicates a bottom and hence we go long. The green triangle indicates a top so we go short. By default these signals are only accepted if they occur between the two Emas. However, you can also turn this off and when a WF signal comes in, only the current price has to be between the Emas. Stop loss is set to the current Ema slow and the take profit is a multiple of the distance to the slow ema.
Like previously I have added different filters as well as the ability to view essential things like the WF signal and Emas. I hope the script will help you to be more successful and if so it would be great if you could share here your setups, or tips on what would be good to refine to make it an even a more profitable strategy. Kind of a community approach so that we help each other out :).
Instructions for the 3commas connector:
1. First, you need to prepare 3commas Long/Short bots that will only listen to custom TV signals.
2. Inputs for the 3commas bot can be found at the end of the user inputs.
3. Once you have entered the required details into the inputs, turn on 3commas comments. They should appear on the chart (looks messy).
4. Now you can add the alert where you should paste the 3commas Webhook URL: 3commas.io
5. For the alert message text insert the placeholder {{strategy.order.comment}} and delete the rest.
6. Once the alert is saved, you can turn off those 3commas comments to have a clearer chart.
7. With a new alert, the bot and trade should launch.
In the near future I would like to publish more scripts that will carry similar elements as the first two, incl. compatibility with 3commas (I don't have access to another bot system). I will choose some strategies myself, but I will also be glad for some tips on what strategy would be good to do and is still missing here on Tradingview (short youtube videos or brief strategy manuals would be great).
Thanks and keep it up
PS: My screen values starting at Long Target Profit and ending at Pullback NOT greater than: 1.5; 1.5; 0; ON; 1; 2; OFF; 17; 36; ON; 0.05; ON; Chart; 14; 46; 50; 48.5; 51; OFF; 1; ON; 4; 2.

Instrument-Z (3Commas Bot)Instrument-Z is what I am currently using as my 3Commas Bot.
It allows you to customize signals from 3 indicators; Crossing MA's, Stochastic RSI, and WaveTrend.
Better yet, it allows you to setup these signals separately depending on whether the Trend MA is going up or down.
So there are 2 sets of inputs for everything, Uptrend inputs and Downtrend inputs.
I have realized that we can't expect a strategy to work the same way in an uptrend vs downtrend, so the inputs should be separated too.
In my testing, separating increased the net profit by 60% on average.
You can select whether you are trading Long or Short.
You can choose your stop loss and take profit levels as well as trade expiration.
You can choose if you only want to trade with the trend (making the opposing signals irrelevant).
The trend is based on the Trend MA.
This script is specifically for cryptocurrencies.
I've noticed that MA crosses on other asset classes are unreliable because the fluctuations are not strong enough to push the MA's across each other in a meaningful way.
If you want to use this as a 3Commas Bot, then you will have to copy the code of the strategy and paste it into your own personal script.
Then you have to change the alert messages at the bottom of the script.
Make sure to change your alert message from this;
{"message_type": "bot", "bot_id": 0000000, "email_token": "0b000a0a-0aa0-00aa-0aa0-000a00000a0a", "delay_seconds": 0}
To this;
{\n\"message_type\": \"bot\",\n\"bot_id\": 0000000,\n\"email_token\": \"0a000a0a-0aa0-00aa-0aa0-000a00000a0a\",\n\"delay_seconds\": 0\n}
With \n after each new line and \ before each quotation.
In the Alert setup, select "alert() function calls only".
This indicator is like a middle ground of complexity between the Juicy Trend indicator and the Instrument-A indicator.
And because it does not feature my neural network project, I have made it open script.
Enjoy!

RSI Overbought Oversold Divergence Strategy w/ Buy/Sell SignalsThis indicator is a copy of my RSI Overbought/Oversold Divergence Indicator with-Alerts
Only difference is that the alerts are disabled, instead it uses tradingviews strategy tester signals
If you want alerts just use the other indicator

Dagger V1 strategyThe "Dagger V1 strategy" strategy is used for the backtest of the "Dagger V1 indicator & alerter" indicator. Their algorithm is identical. Further, all descriptions of the settings are the same for the strategy and the indicator.
Dagger is used for trading on the cryptocurrency spot market, but it can also be used for any other fairly volatile pairs.
Dagger shows the best results on the H1 timeframe, but you can experiment with other timeframes.
The logic of Dagger's work is based on the search for the optimal entry point into the market and the best moment to close a deal. Stochastic oscillator and exponential moving EMA are used for this. Also, the exit from the transaction can be optimized using several parameters.
The strategy can use trailing up to one or more red bars in order not to miss the sharp growth of the currency.

Ultimate Strategy TemplateHello Traders
As most of you know, I'm a member of the PineCoders community and I sometimes take freelance pine coding jobs for TradingView users.
Off the top of my head, users often want to:
- convert an indicator into a strategy, so as to get the backtesting statistics from TradingView
- add alerts to their indicator/strategy
- develop a generic strategy template which can be plugged into (almost) any indicator
My gift for the community today is my Ultimate Strategy Template
Step 1: Create your connector
Adapt your indicator with only 2 lines of code and then connect it to this strategy template.
For doing so:
1) Find in your indicator where are the conditions printing the long/buy and short/sell signals.
2) Create an additional plot as below
I'm giving an example with a Two moving averages cross.
Please replicate the same methodology for your indicator wether it's a MACD, ZigZag, Pivots, higher-highs, lower-lows or whatever indicator with clear buy and sell conditions
//@version=4
study(title='Moving Average Cross', shorttitle='Moving Average Cross', overlay=true, precision=6, max_labels_count=500, max_lines_count=500)
type_ma1 = input(title="MA1 type", defval="SMA", options= )
length_ma1 = input(10, title = " MA1 length", type=input.integer)
type_ma2 = input(title="MA2 type", defval="SMA", options= )
length_ma2 = input(100, title = " MA2 length", type=input.integer)
// MA
f_ma(smoothing, src, length) =>
iff(smoothing == "RMA", rma(src, length),
iff(smoothing == "SMA", sma(src, length),
iff(smoothing == "EMA", ema(src, length), src)))
MA1 = f_ma(type_ma1, close, length_ma1)
MA2 = f_ma(type_ma2, close, length_ma2)
// buy and sell conditions
buy = crossover(MA1, MA2)
sell = crossunder(MA1, MA2)
plot(MA1, color=color_ma1, title="Plot MA1", linewidth=3)
plot(MA2, color=color_ma2, title="Plot MA2", linewidth=3)
plotshape(buy, title='LONG SIGNAL', style=shape.circle, location=location.belowbar, color=color_ma1, size=size.normal)
plotshape(sell, title='SHORT SIGNAL', style=shape.circle, location=location.abovebar, color=color_ma2, size=size.normal)
/////////////////////////// SIGNAL FOR STRATEGY /////////////////////////
Signal = buy ? 1 : sell ? -1 : 0
plot(Signal, title="🔌Connector🔌", transp=100)
Basically, I identified my buy, sell conditions in the code and added this at the bottom of my indicator code
Signal = buy ? 1 : sell ? -1 : 0
plot(Signal, title="🔌Connector🔌", transp=100)
Important Notes
🔥 The Strategy Template expects the value to be exactly 1 for the bullish signal , and -1 for the bearish signal
Now you can connect your indicator to the Strategy Template using the method below or that one
Step 2: Connect the connector
1) Add your updated indicator to a TradingView chart
2) Add the Strategy Template as well to the SAME chart
3) Open the Strategy Template settings and in the Data Source field select your 🔌Connector🔌 (which comes from your indicator)
From then, you should start seeing the signals and plenty of other stuff on your chart
🔥 Note that whenever you'll update your indicator values, the strategy statistics and visual on your chart will update in real-time
Settings
- Color Candles : Color the candles based on the trade state (bullish, bearish, neutral)
- Close positions at market at the end of each session : useful for everything but cryptocurrencies
- Session time ranges : Take the signals from a starting time to an ending time
- Close Direction : Choose to close only the longs, shorts, or both
- Date Filter : Take the signals from a starting date to an ending date
- Set the maximum losing streak length with an input
- Set the maximum winning streak length with an input
- Set the maximum consecutive days with a loss
- Set the maximum drawdown (in % of strategy equity)
- Set the maximum intraday loss in percentage
- Limit the number of trades per day
- Limit the number of trades per week
- Stop-loss: None or Percentage or Trailing Stop Percentage or ATR
- Take-Profit: None or Percentage or ATR
- Risk-Reward based on ATR multiple for the Stop-Loss and Take-Profit
This script is open-source so feel free to use it, and optimize it as you want
Alerts
Maybe you didn't know it but alerts are available on strategy scripts.
I added them in this template - that's cool because:
- if you don't know how to code, now you can connect your indicator and get alerts
- you have now a cool template showing you how to create alerts for strategy scripts
Source: www.tradingview.com
I hope you'll like it, use it, optimize it and most importantly....make some optimizations to your indicators thanks to this Strategy template
Special Thanks
Special thanks to @JosKodify as I borrowed a few risk management snippets from his website: kodify.net
Additional features
I thought of plenty of extra filters that I'll add later on this week on this strategy template
Best
Dave

MARUSIA TRADING STRATEGIES [VCRYPTO]Description of MARUSIA TRADING STRATEGIES
«MARUSIA» is a compilation of several strategies.
You may choose the one which best suits your trading habit from options menu.
The strategies are based on indicator’s and bar’s closing level analysis on different timeframes.
At the time being there are 3 types of strategies for BTC on 1H and 3H tf.
+++ BTC 1H 90% Success +++ (Beginner)
Instrument - BTC, timeframe – 1H, exchange – Bitmex.
The advantage of the strategy is a high quantity of profitable trades (90% at the time of publishing).
The Trading View backtest results from 2019:
+ 303% net profit
+ 90% profitable trades
+ 6% drawback
+++ BTC 1H Mega Scalper +++ (Intermediate)
Instrument - BTC, timeframe – 1H, exchange – Bitmex.
The advantage of the strategy is more frequent trades with a good probability of success.
The Trading View backtest results from 2019:
+ 792% net profit
+ 64% profitable trades
+ 5% drawback
+++ BTC 3H Mega Scalper +++ (Expert)
Instrument - BTC, timeframe – 3H, exchange – Bitmex.
The advantage of the strategy is more frequent trades with a good probability of success.
The Trading View backtest results from 2018:
+ 1637% net profit
+ 79% profitable trades
+ 4,4% drawback
HOW TO USE
1. Choose the strategy from the strategy’s option menu on the chart. Pay attention to the instrument and timeframe you are using the selected strategy for.
2. Wait until you see green (above bar) or orange (below bar) label. To receive an alert when these labels (or signals) appear on the chart use ALERT INDICATOR for this strategy.
3. On the opening of the next bar enter the position if the label on the previous bar hasn’t disappeared. Green – for Buy, orange – for Sell. In this case you will see Buy/Sell signal on the chart.
4. Putting TRAILING STOPS
4.1. You should put a trailing stop when the price moves to profit up or down for 1% from your entry. For example, if you are long at 7255 USD and price moves up to 7328 USD (7255*1.01), put trailing stop with a trailing value 0,4% of your entry price, which is 29 USD (7255*0.004).
4.2. Every time when there is a long or short position, you may see a green info label with entry price, trail stop activation level and trail value. You may use this information instead of making a calculation by yourself. Only if your entry is the same as in the label.
5. Position closing maybe by reaching your trailing stop (in this case you may reenter the position on the next bar, if there is a signal label as per step 2 on the bar where your trailing stop is triggered) or when there is a signal for opposite direction.
6. If the signals appear differently than described as above, just refresh the website of Trading View. This happens because mostly take profits are shown only after the current bar is closed.
• The Buy/Sell signal label may move up or down on the bar with price’s movement. Don’t worry it doesn’t mean that your entry is changing.
• The lines on the chart are weekly price levels – the price levels of the previous week –
Green – open, Red – close, Blue – high, Brown – low, Black – hl2 (average of high and low). You may use them as support and resistance levels.
***
+ Trading View backtest results
+No repaint
+ Several strategies to choose which suits your trading habit
+Free testing
+Support with a call
Pm to get access to the strategy.
____________________________________________________________________________
Описание к стратегии "MARUSIA TRADING STRATEGIES "
Сборник нескольких стратегий серии "Marusia"
Выбор конкретной стратегии осуществляется из удобного меню
Основа наших стратегий - совмещение индикаторного анализа и анализа уровня закрытия свечей на разных временных интервалах (анализ уровней).
+++ BTC 1H 90% Success +++ (Beginner)
Стратегия работает на инструменте Bitcoin (BTC) по котировкам биржи BITMEX на 1 часовом таймфрейме (1H).
Основное преимущество данной стратегии - супервысокая успешность сделок (более 90% на момент публикации).
Данная стратегия представляет собой гибрид среднесрочных стратегий по частоте сделок (с 2019 по 12.04.2020 - 204 сделки, в среднем одна сделка раз в 2 дня) и элемент высокочастотных (скальп) стратегий - необходимо выставление использование скользящего стоп-приказа (trailing stop-loss), расчетные данные по которому появляются прямо на экране при открытии сделки.
Статистика по данной стратегии, подтвержденная бэктестом в Trading View
С 2019 года до момента публикации стратегии бектест показывает следующие данные:
+ 303% чистой прибыли
+ 90% успешных сделок
+ 6% макс. единовременная просадка
+++ BTC 1H Mega Scalper +++ (Intermediate)
Стратегия работает на инструменте Bitcoin (BTC) по котировкам биржи BITMEX на 1 часовом таймфрейме (1H)
Основное преимущество данной стратегии - высокочастотные сделки с хорошей вероятностью успеха.
С 2019 года до момента публикации стратегии бектест Trading View показывает следующие данные:
+ 792% чистой прибыли
+ 64% успешных сделок
+ 5% макс. единовременная просадка
+++ BTC 3H Mega Scalper +++ (Expert)
Стратегия работает на инструменте Bitcoin (BTC) по котировкам биржи BITMEX на 3 часовом таймфрейме (3H)
Основное преимущество данной стратегии - высокочастотные сделки с хорошей вероятностью успеха
С 2019 года до момента публикации стратегии бектест Trading View показывает следующие данные:
+ 1637% чистой прибыли
+ 79% успешных сделок
+ 4,4% макс. единовременная просадка
***
Инструкиция по использованию:
1. Вы открываете график с включенной стратегией. Обратите внимание на инструмент и таймфрейм стратегии.
2. Ожидаете появления на графике зеленого (снизу) или оранжевого (сверху) флажка.
Для получения уведомления появления значков (сигналов) используйте АЛЕРТНЫЙ ИНДИКАТОР для данной стратегии.
3. На открытии следующей свечи входите в сделку, если флажек из п.2 остался и не пропал (зеленый флажек - покупка, оранжевый - продажа)
4. Выставление trailing stop-loss
4.1 Trailing stop-loss выставляется, когда цена прошла 1% в профит от цены выхода в сделку (например: покупка 7255 и когда цена будет 7328 (7255*1,01) выставляется плавающий стоп-лосс (trailing stop-loss) в размере 0,4% от цены входа "29" (7255*0,004).
4.2. Как только будет закрыта свеча, на которой Вы вошли в сделку - вы увидете значения из п.4.1 на экране рядом с графиком (вы можете их использовать без самостоятельного расчета, но тогда есть риск, что если цена на свече входа достигнет значения из п. 4.1 - то сделка закроется, а вы это увидите только на следующей свече, когда значение цены может быть менее выгодное)
5. Выход из сделки осуществляется либо по trailing stop-loss (тогда вы можете перезайти в сделку на открытии следующей свечи, если на свече, на которой произошло закрытие по trailing stop-loss появились флажки из п.2), либо по появлению противоположного флажка, тогда вход в сделку, в соответствии с п. 2 и 3
7. Если Вы увидели, что сигналы отличаются от написанного в данной инструкции - просто обновите страницу с Trading View в браузере и все встанет на свои места.
* На свече захода в сделку сигнал "buy/sell" может "плавать" по свече, но если Вы выполнили п.1-3 Вам неочем беспокоиться. Не обращайте на него внимание.
***
Основные отличия от стратегий наших коллег:
+ Результаты бэктеста в платформе Trading View – прозрачная статистика по сделкам, которую вы можете посмотреть самостоятельно
+ Построен на принципах non-repaint basis – сигналы не исчезают (при правильном соблюдении инструкции по использованию)
+ Каждая стратегия серии построена на своем уникальном принципе - вы можете выбрать для себя оптимальный набор стратегий
+ Бесплатный тестовый период
+ Поддержка с возможностью организации телефонного звонка
Для предоставления доступа к данной стратегии - пожалуйста пишите в личные сообщения. Мы быстро с Вами свяжемся.
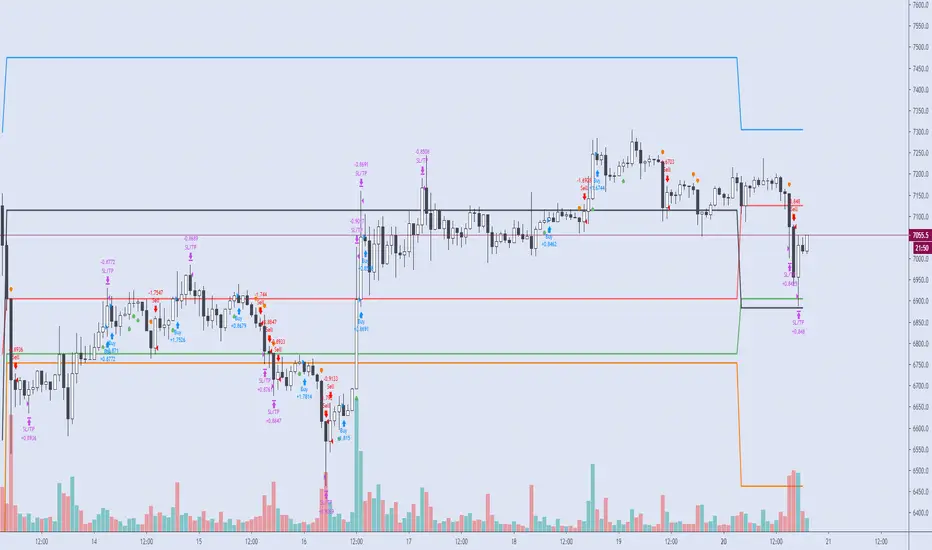
Full Candle Outside BB [Bishnu103]Bollinger band defines volatility range based on the current market condition. If a full candle is created outside BB then it is highly volatile and it may reverse to the mean, i.e. middle BB.
Buy - when a green candle is created below lower BB (alert candle) and price goes above high of it.
Buy SL - low of alert candle
Target 1 - middle band
Target 2- upper band
Sell - when a red candle is cerated above upper BB (alert candle) and price goes below low of it
Sell SL - high of alert candle
Target 1 - middle band
Target 2 - lower band
************************************************************************************************************************************************************************************
Disclaimer: This is in-progress strategy. I plan to work further and improve this. So please use this in the live market very carefully and based on your own risk factors.
************************************************************************************************************************************************************************************
