Pesquisar nos scripts por "adx"


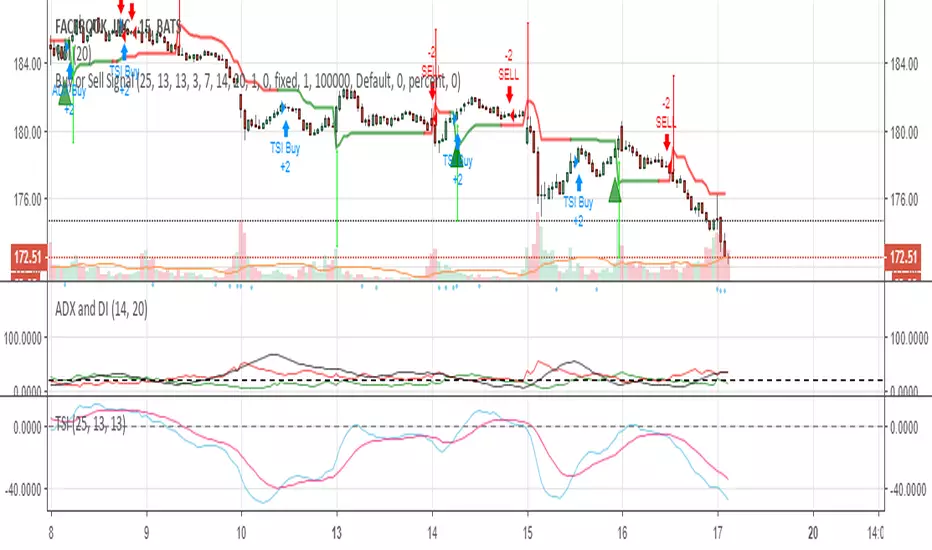
Buy or Sell Zone This Indicator Signals the Buy and Sells, there is no guessing just follow the alerts.


HLC3/Kaufman Strategy This is an upgrade of the old Heikin/Kaufman Strategy. This script DONT use Heikin value anymore, so I hope no more repaint. Try it and let me know. Use an ADX indicator can help to check the strenght of the trend.

Ergodic CSI Backtest This is one of the techniques described by William Blau in his book
"Momentum, Direction and Divergence" (1995). If you like to learn more,
we advise you to read this book. His book focuses on three key aspects
of trading: momentum, direction and divergence. Blau, who was an electrical
engineer before becoming a trader, thoroughly examines the relationship between
price and momentum in step-by-step examples. From this grounding, he then looks
at the deficiencies in other oscillators and introduces some innovative techniques,
including a fresh twist on Stochastics. On directional issues, he analyzes the
intricacies of ADX and offers a unique approach to help define trending and
non-trending periods.
This indicator plots Ergotic CSI and smoothed Ergotic CSI to filter out noise.
You can change long to short in the Input Settings
WARNING:
- For purpose educate only
- This script to change bars colors.

Linda Raschke's Holy GrailAnother script based on Linda Raschke's strategy with the same name from her book about swing trading.

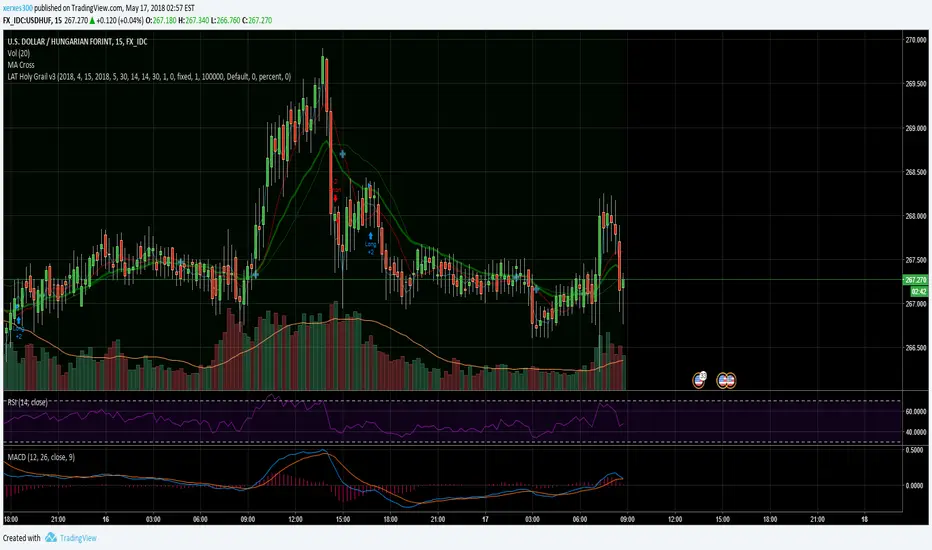
LAT Holy Grail v3The Holy Grail ADX and EMA20 crossovers.
do not trade with this strategy. it is not ready yet.

RSI and ADX TraderDevelopment version of 15 minute bitcoin indicator that is not available to the public.
For access to the actual indicator please go here:
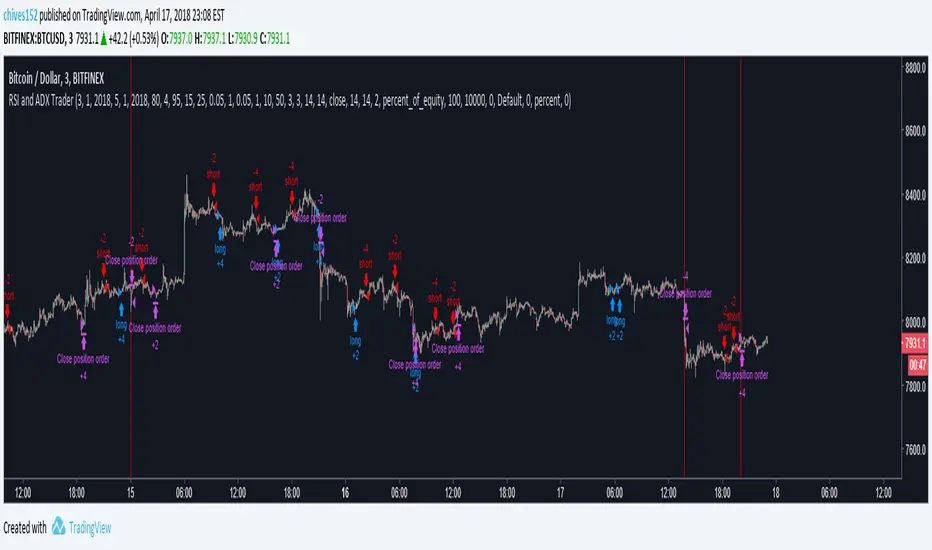
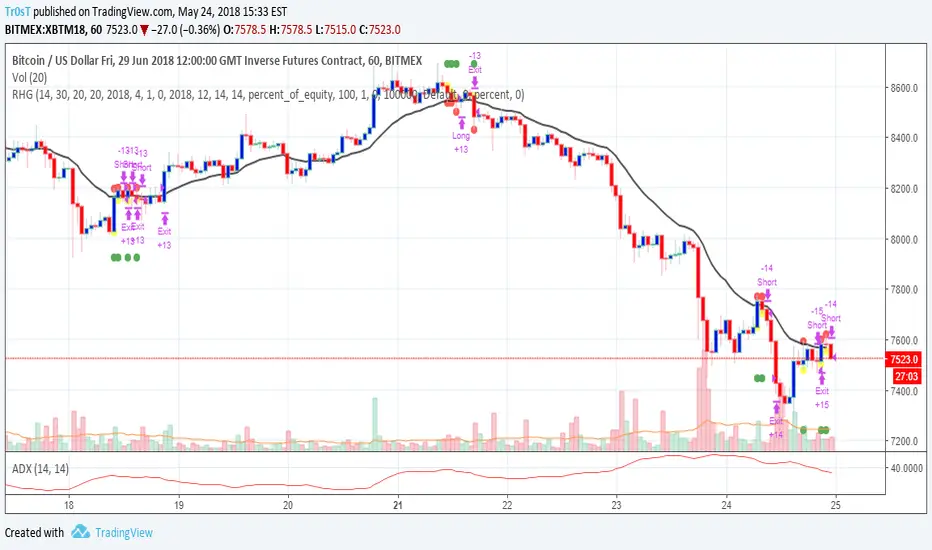
Long Term Swing Position Indicator Alpha VersionThis is a early version of a swing trading indicator I have been working on. It uses EMAs and ADX to find entries. This will eventually be integrated into my main trading indicator. The strategy is defaulted to start with 17,000 capital and trade with 100 percent of equity. You can test different ranges of dates by going into the settings and changing the end dates of the backtest. It is defaulted to test from 1/1/2018 to the current time. Keep in mind if you keep it set to use 100% equity it will not be able to enter positions if the initial capital is less than the price of 1 bitcoin -3.31% at the beginning of the test range. It currently has a pretty low success rate, but the average winning trade is significantly larger than the average losing trade so it still makes a significant profit. This has only been tested so far on the 15 minute and 30 minute charts for Bitfinex:BTCUSD.
The end goal for this indicator is to allow me to enter long term future positions to hold while I trade swaps on the short and medium term. This will allow me to increase profits.
This strategy will be changing significantly in the future as I test various ideas and setting configurations to maximize the effectiveness, but feel free to use it however you want.
My main indicator is currently in beta and will be finished before this one is completed, so if you want a solid indicator to trade with in the immediate future, I suggest checking that one out at
Please comment or direct message me if you have any questions of critiques, I will always respond within 24 hours. If you find out anything interesting while testing the strategy I would also appreciate it if you dropped me a message letting me know.

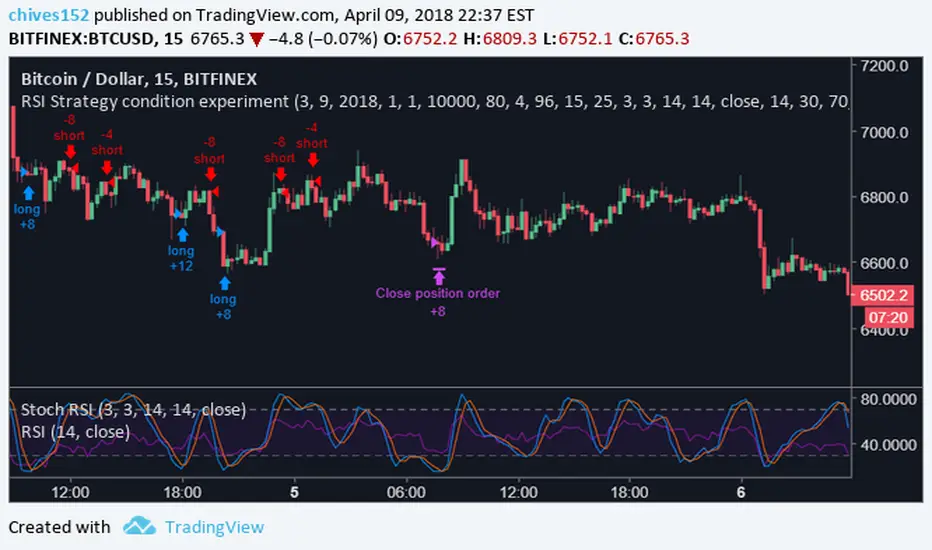
RSI Strategy condition experimentThis is a scalping indicator built for bitcoin on the 15m chart. It uses ADX and SRSI. A full indicator will be released very soon. Please comment with any questions or comments. The strategy ran below is the results if you started trading on 3/9/2018 with 10,000$ usd, and used 100% of your equity to enter positions. This is also designed to allow 2x leverage when certain conditions are met, which is the default. This feature can be turned off in settings.
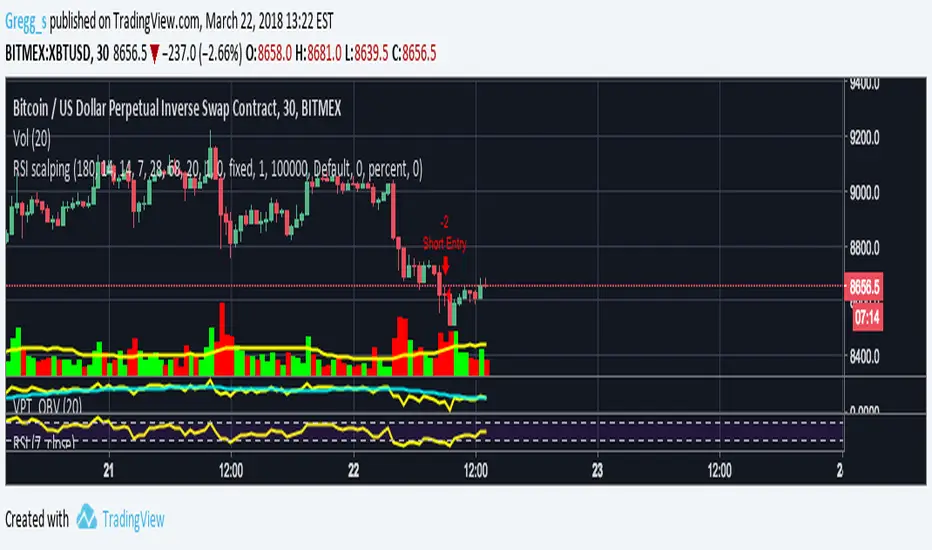
RSI scalpingLook for trending market on higher timeframe with ADX and SMA
Scalping with rsi shorter time frame
Range Action Verification Index (RAVI) Backtest The indicator represents the relative convergence/divergence of the moving
averages of the financial asset, increased a hundred times. It is based on
a different principle than the ADX. Chande suggests a 13-week SMA as the
basis for the indicator. It represents the quarterly (3 months = 65 working days)
sentiments of the market participants concerning prices. The short moving average
comprises 10% of the one and is rounded to seven.
You can change long to short in the Input Settings
WARNING:
- For purpose educate only
- This script to change bars colors.


Ergotic TSI Strategy Backtest r - Length of first EMA smoothing of 1 day momentum 4
s - Length of second EMA smoothing of 1 day smoothing 8
u- Length of third EMA smoothing of 1 day momentum 6
Length of EMA signal line 3
Source of Ergotic TSI Close
This is one of the techniques described by William Blau in his book "Momentum,
Direction and Divergence" (1995). If you like to learn more, we advise you to
read this book. His book focuses on three key aspects of trading: momentum,
direction and divergence. Blau, who was an electrical engineer before becoming
a trader, thoroughly examines the relationship between price and momentum in
step-by-step examples. From this grounding, he then looks at the deficiencies
in other oscillators and introduces some innovative techniques, including a
fresh twist on Stochastics. On directional issues, he analyzes the intricacies
of ADX and offers a unique approach to help define trending and non-trending periods.
You can use in the xPrice any series: Open, High, Low, Close, HL2, HLC3, OHLC4 and ect...
You can change long to short in the Input Settings
Please, use it only for learning or paper trading. Do not for real trading.

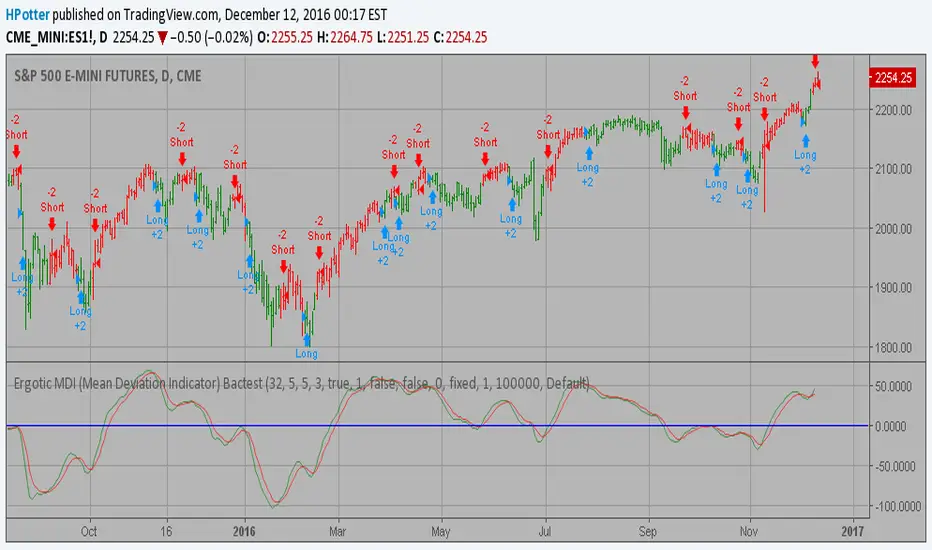
Ergotic MDI (Mean Deviation Indicator) Bactest This is one of the techniques described by William Blau in his book "Momentum,
Direction and Divergence" (1995). If you like to learn more, we advise you to
read this book. His book focuses on three key aspects of trading: momentum,
direction and divergence. Blau, who was an electrical engineer before becoming
a trader, thoroughly examines the relationship between price and momentum in
step-by-step examples. From this grounding, he then looks at the deficiencies
in other oscillators and introduces some innovative techniques, including a
fresh twist on Stochastics. On directional issues, he analyzes the intricacies
of ADX and offers a unique approach to help define trending and non-trending periods.
You can change long to short in the Input Settings
Please, use it only for learning or paper trading. Do not for real trading.
Ergotic MACD Strategy Backtest This is one of the techniques described by William Blau in his book
"Momentum, Direction and Divergence" (1995). If you like to learn more,
we advise you to read this book. His book focuses on three key aspects
of trading: momentum, direction and divergence. Blau, who was an electrical
engineer before becoming a trader, thoroughly examines the relationship
between price and momentum in step-by-step examples. From this grounding,
he then looks at the deficiencies in other oscillators and introduces some
innovative techniques, including a fresh twist on Stochastics. On directional
issues, he analyzes the intricacies of ADX and offers a unique approach to help
define trending and non-trending periods.
Blau`s indicator is like usual MACD, but it plots opposite of meaningof
stndard MACD indicator.
You can change long to short in the Input Settings
Please, use it only for learning or paper trading. Do not for real trading.

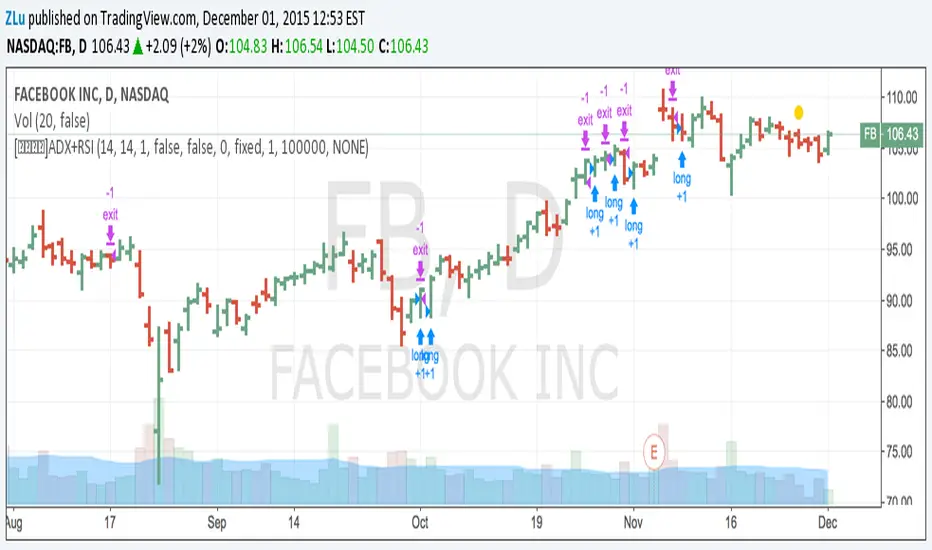
[ZL] ADX+RSI (Long Entries and Exits only)A popular strategy which combines Average Directional Index and RSI. In this version, we coded for only LONG entries and exits.
Created by Shanghai Reed Asset Management Co., Ltd.