NSDT HAMA Candles STRATThis is a STRATEGY based on our popular HAMA Candles Indicator.
It is an "Always On" strategy, meaning it will stay in a Long position until the Short criteria shows up, and then it will close the Long position and immediately enter a Short position.
Since this is a strategy, we added a few more components. The most notable one is the grid at the top right that shows the statistics of whatever the current settings are. The user can change the MA lengths and see the potential results update in real time.
Since this is Always On and uses Moving Averages, we added an ADX setting to help filter our trades in a ranging/choppy market.
The settings will need to be adjusted to find the best fit for your instrument, chart time, and risk management plan.
Pesquisar nos scripts por "adx"

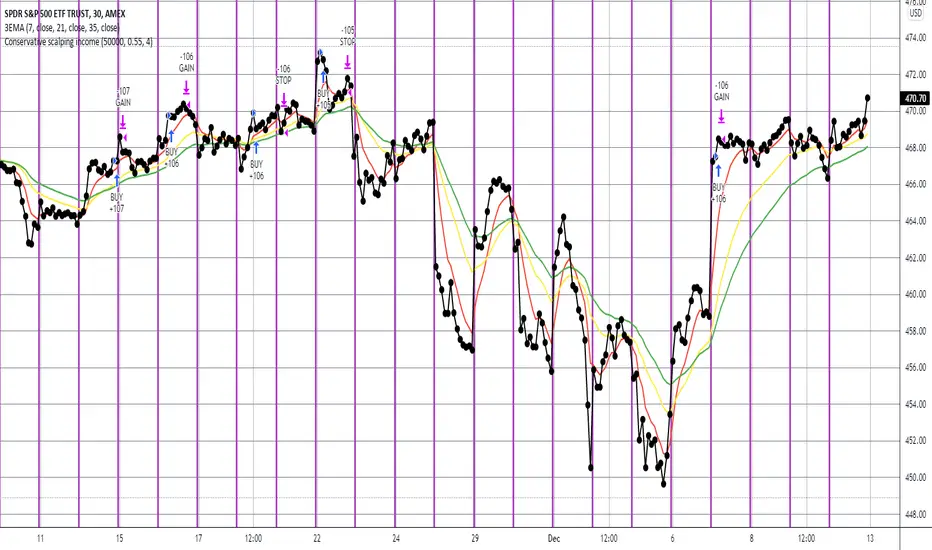
Conservative scalping incomeThis fully automated scalping strategy aims for an 10-12% annual return using LONG positions only (i.e. no SHORTs), with 2 to 1 number of winning trades and 1.5 to 1 avg win amount vs avg loss amount. It should generally make from zero to four trades per day depending on market conditions. It should remain in a position for roughly an hour. It leverages numerous indicators, including multiple moving averages, ADX, and MACD.
Note that this strategy does not try to time tops and bottoms. Rather it waits to clearly identify a trend, and then rides that trend for a short while making a defined profit. Thus it may enter and exit a trade under profitable conditions, but not at the most profitable conditions possible. It gets in when it's sure of the trend, and then generally leaves that trend as soon as a defined profit is made or before a meaningful loss is incurred.
This strategy will work well with any index (e.g. SPY) and most stocks. It works best on a five minute time interval and when the index or stock is either generally increasing over time or bouncing back and forth between a medium to wide range.
DMI (Multi timeframe) DI Strategy [KL]Directional Movement Index Strategy
Entry conditions:
- (a) when DI+ > DI- on timeframe #1, and
- (b) Confirmation: when DI+ > DI- on timeframe #2
In the shown example, timeframe1 was same as the chart (1H) and timeframe2 was 1D.
Stop Loss: ATR based trailing stop
About DMI
Can refer to Investopedia for general understanding.
Applications of DMI in this strategy:
- Assumes uptrend when DI+ is above DI- (when green DI+ lines above red DI-), vice versa for downtrend. This is checked in two different timeframes that can be set by user in settings.
- DX is ignored, it doesn't give a direction of the trend. But if DX was applied, it would be a good indicator for quantifying the strength of uptrend/downtrend. This measurement would typically be read along a threshold (i.e. if below 20, then market is likely consolidating). All of these have been commented out (ignored by pinescript's interpreter via //) in the codes, as said; we are not using DX for sake of simplicity.
Visualizations
To make the chart look cleaner, DMI plots have been simplified to just down/up arrows placed at bottom of the chart.
Referring to the example chart:
- Green arrows : when DI+ > DI- for both timeframes, implies uptrend
- Red arrows: other way around (DI+ < DI-), implies downtrend

DI Crossing Daily Straregy HulkTradingSimple strategy based on crossing DI+ and DI- and Average True Range.
Long entry when DI+ crossover DI-
Short entry when DI+ crossunder DI-
Stop Loss and Take Profits based on Average True Range.
Default values are 1*ATR(14) for stop loss and 2*ATR(14) for Take Profit.
Risk reward 1 to 2 ratio.
Recommended default values, but you can change it if you want.
Recommended timeframe - 1D.
Script was tested on BTCUSDT pair and have a 2.4 profit factor.

Keltner Channel + DMI + EMA Strategy @DaviddTechThis strategy is a long only strategy that evolves 3 main indicators.
It is optimised for ETH USDT and LONG ONLY
Long positions :
* EMA 50 is above the EMA 400 to define our trend direction.
* Price breaks above the upper band of the the Keltner Channel.
* Confirmation is found with the DMI + being over the DMI -
Other indicators :
ADX set to above 20
The TP I put at 20% and I use Multiple TP levels.
If the price crosses and closes below the Keltner Channel lower band I close the trade.
WARNING:
- For purpose educate only - My mission is to debunk fake strategies with code to find THE ONE.
- Plots EMAs and other values on chart.
- This script to change bars colours.

Ultimate Scalper 1.2 @DaviddTechThis script turns out to be a great scalper for Crypto.
Long
* Looks for a pullback in MACD
* EMA 50 over EMA 200
Short
* Looks for a pullback in MACD
* EMA 50 below EMA 200
I use also the ADX for filtering flat markets.
ATR, VWAP and RSI can be used for confluence.
WARNING:
- For purpose educate only - My mission is to debunk fake strategies with code to find THE ONE.
- Plots EMAs and other values on chart.
- This script to change bars colours.
Release Notes: Change the description tabs

MACD-Extendido-Estrategia por Neil--------------------------------
MACD-Extendida-Estrategia
--------------------------------
DESCRIPTION
Resource that identifies entry and exit operations using the indicator
Average Convergence and Divergence Movements ( MACD ) and 5 strategies
INTERESTING
Novel strategies are implemented such as:
1. Overbought and oversold band to avoid horizontal movements
2. Control inputs and outputs at positions opposite the histogram line
3. Make a profit (take profit) without prior purchase orders
HOW DOES IT WORK (STRATEGIES)
1) Overbought and oversold:
Allows you to define an overbought upper band
Allows you to define an oversold ower band
Operations that occur within the band are ignored
2) Place of next operation (either side):
Indicates that the next operation can occur on either side of the histogram
3) Place of next operation (opposite side):
Indicates that the next operation must occur on the opposite side of the histogram
4) Take profit:
It allows defining the deviation in favor to execute a take profit.
It does not place a buy order at a distant point, instead it looks back and if the shift meets the expected deviation, take profit is executed
5) Loss control (stop loss):
It allows to define the deviation against to execute a stop loss.
It does not place a stop order at a distant point, instead it looks back and if the displacement meets the expected deviation the stop loss is executed
How to use it:
Press the "Indicators" option, go to the "Public Librarian" segment, write the name "MACD-Extended-Strategy by Neil", double-click on the record in question and you will have it added in your work panel, now, just It remains to be used to identify the inputs and outputs and you can do it visually or by defining the automatic notification alerts.
--------------------------------
MACD-Extendida-Estrategia
--------------------------------
DESCRIPCION
Recurso que identifica operaciones de entradas y salida haciendo uso del indicador
Media móvil de Convergencia/Divergencia ( MACD ) y 5 estrategias
NOVEDADES
Se implementan estrategias novedosas como:
1. Banda de sobrecompra y sobreventa para esquivar movimientos horizontales
2. Control de entradas y salidas en posiciones contrarias a la línea del histograma
3. Toma de ganancias (take profit) sin ordenes de compra previa
COMO FUNCIONA (ESTRATEGIAS)
1) Sobrecompra y Sobreventa:
Permite definir una banda superior de sobrecompra
Permite definir una banda inferior de sobreventa
Operaciones que ocurren dentro de la banda son ignoradas
2) Lugar de próxima operación (cualquier lado):
Indica que la próxima operación puede ocurrir en cualquier lado del histograma
3) Lugar de próxima operación (lado opuesto):
Indica que la próxima operación debe ocurrir en el lado opuesto del histograma
4) Toma de ganancias (take profit):
Permite definir la desviación a favor para ejecutar una toma de ganancia.
No coloca una orden de compra en un punto distante, en su lugar mira hacia atrás y si el desplazamiento cumple con la desviación esperada se ejecuta la toma de ganancia
5) Control de pérdida (stop loss):
Permite definir la desviación en contra para ejecutar una parada de pérdida.
No coloca una orden de parada en un punto distante, en su lugar mira hacia atrás y si el desplazamiento cumple con la desviación esperada se ejecuta la parada de la pérdida
Como usarlo:
Presione la opción "Indicadores", ubíquese en el segmento "Libreria Publica", escriba el nombre "MACD-Extendido-Estrategia por Neil", haga doble clic sobre el registro en cuestión y lo tendrá agregado en su panel de trabajo, ahora, solo resta usarlo para identificar las entradas y salidas y puede hacerlo de forma visual o definiendo las alertas de notificación automática.

DMI + HMA - No Risk ManagementDMI (Directional Movement Index) and HMA (Hull Moving Average)
The DMI and HMA make a great combination, The DMI will gauge the market direction, while the HMA will add confirmation to the trend strength.
What is the DMI?
The DMI is an indicator that was developed by J. Welles Wilder in 1978. The Indicator was designed to identify in which direction the price is moving. This is done by comparing previous highs and lows and drawing 2 lines.
1. A Positive movement line
2. A Negative movement line
A third line can be added, which would be known as the ADX line or Average Directional Index. This can also be used to gauge the strength in which direction the market is moving.
When the Positive movement line (DI+) is above the Negative movement line (DI-) there is more upward pressure. Ofcourse visa versa, when the DI- is above the DI+ that would indicate more downwards pressure.
Want to know more about HMA? Check out one of our other published scripts
What is this strategy doing?
We are first waiting for the DMI to cross in our favoured direction, after that, we wait for the HMA to signal the entry. Without both conditions being true, no trade will be made.
Long Entries
1. DI+ crosses above DI-
2. HMA line 1 is above HMA line 2
Short Entries
1. DI- Crosses above DI+
2. HMA line 1 is below HMA lilne 2
Its as simple as that.
Conclusion
While this strategy does have its downsides, that can be reduced by adding some risk manegment into the script. In general the trade profitability is above average, And the max drawdown is at a minimum.
The settings have been optimised to suite BTCUSDT PERP markets. Though with small adjustments it can be used on many assets!

Ultimate MACD Strategy [PrismBot] [Lite]Included in this Ultimate MACD Lite Strategy:
✔️ Tweak a multitude of specific settings (MA lengths, R:R, SL distance etc)
✔️ Enable advanced setup filters
✔️ Use money management and risk calculations
✔️ Draw trade info directly to chart (eg. SL size in percent, win rate etc)
✔️ Use various filters (eg. time filter, date filter, MA slope angle etc)
✔️ Manage risk per position when auto-trading forex through AutoView
✔️ Choose from various alert conditions!
✔️ Sync to any bot or algorithmic trading system
Some details about this strategy:
LONG SIGNAL
When the MACD is below the zero line of the histogram, close is above the 200EMA, and the MACD line crosses above the signal line, longs are taken
SHORT SIGNAL
When the MACD is above the zero line of the histogram, close is below the 200EMA, and the MACD line crosses below the signal line, shorts are taken
A couple of options are given for how to calculator stop losses.
The Take profit is calculated by the risk of the stop loss. So a 1.5 take profit target is 1.5 times the stop loss added to the entry price.
There is also an option to filter out trades by the histogram deviation. This prevents crossovers that are too close to the histogram from being taken.
Please note I used the code for the PPO instead of the traditional MACD to make calculating these percentage deviations more consistent across multiple asset types.
You can easily enable and disable strategies using the checkbox.
This strategy incorporates a risk to reward system where the user can select between ATR and Percent based stop losses and take profit targets. This means that the user has much better control over money management when utilizing this strategy and it doesn't require you to babysit the strategy to ensure it's entering and existing strategies in an ideal place.
You can also enter custom messages for alerts for use with bots (set alerts to "alert() function calls only")

Keltner Worm Strategy [PrismBot] [Lite]Included in this Keltner Worm Lite Strategy:
✔️ Tweak a multitude of specific settings (MA lengths, R:R, SL distance etc)
✔️ Enable advanced setup filters
✔️ Use money management and risk calculations
✔️ Draw trade info directly to chart (eg. SL size in percent, win rate etc)
✔️ Use various filters (eg. time filter, date filter, MA slope angle etc)
✔️ Manage risk per position when auto-trading forex through AutoView
✔️ Choose from various alert conditions!
✔️ Sync to any bot or algorithmic trading system
Some details about this strategy:
- it incorporates 2 strategies - Keltner Re-entry and Baseline MA Crossing
- it uses a take profit and stop loss level fixed
- there are up to 6 allowable "worms"
- the worm multipliers are exponential, so a value of 2 will mean that the 6th worm is multiplied by 6
- you can multiply the offset or the Keltner Channel default values
- You can enable alerts for order entry, take profit, and stop loss values
- You can easily enable and disable strategies using the checkbox.
- This strategy incorporates a risk to reward system where the user can select between ATR and Percent based stop losses and take profit targets. This means that the user has much better control over money management when utilizing this strategy and it doesn't require you to babysit the strategy to ensure it's entering and existing strategies in an ideal place.

Relative Volume & RSI PopThis is a basic idea/script designed to take a breakout trade by taking advantage of volume spikes when price/strength is extended (either long or short).
The script only utilises two indicators, the Relative Volume (RV) and the Relative Strength Index (RSI). The script allows the user to select a RSI value between 69 up to 100 for a long trade and between 35 down to 0 for short trade and then pair this with RV from 0 - 10. The period for both the RSI and RV can also be amended by the user but I found in most cases there was no benefit gained by changing away from normal "14" period lookback. The script typically only has small draw downs as the script is designed to exit the trade when the RSI returns back to "normalised" level, therefore the trades are generally quite short. The exit condition for a long trade is when RSI crosses back below 69 (which is why you cannot enter a long below this value) and for a short the, trade will close when RSI crosses back above 35 (which is why you cannot enter a short above this value). These exit values are locked.
By allowing RSI value to go all the way up to "100" on the long side and "0" on the short side this in effect is a way of eliminating the script from taking either longs or shorts if lets say you wanted to back test the script for long only spikes or short only spike. E.G. By setting RSI upper value to "75" the RV to "1" and RSI lower value to "0" then no short trades will not be taken in your back test as the RSI never really gets down to zero.
I put this together with meme stocks in mind and back tested it on day charts for AMC and then a few trending style stocks too. It typically worked best as long only and with RSI settings between 71 - 75 and RV at 1 or 1.5. I also found it had okay results on some lower 1hr timeframe futures markets and weekly time frames too (albeit trades were few and far between on weekly timeframe).
The beauty of such a basic script you could easily set up a trading view screener to look for these opportunities everyday and perhaps even add in an ADX filter on the screener to see if the trend is increasing. Then use this script to run a back test on the stocks that you've selected from the screener.

Simple way to BEAT the market [STRATEGY]This script has been created to demonstrate the effectiveness of using market regime filters in your trading strategy, and how they can improve your returns and lower your drawdowns
This strategy adds a simple filter (A historical volatility percentile filter, an implementation of which can be found on my trading profile) to a traditional buy and hold strategy of the index SPY.
Note, There are other filters that could also be added including a long-term moving average/percentile rank filter/ADX filter etc, to improve the returns further.
The filter closes our long position during periods of volatility that exceed the 95th percentile (or in the top 5% of volatile days) and buys back when the volatility is below 95% rank of the past 100 days
Have included the backtest results since 1993 which is 28 years of data at the time of writing. Comparison of traditional buy and hold with this modified strategy can be found below:
Traditional buy and hold:
Return per year: 7.95 % (ex Dividends)
Total return: 851.1 %
Max drawdown: 50.79 %
'Modified' buy and hold (this script):
Return per year: 9.92 % (ex Dividends)
Total return: 1412.2 %
Max drawdown: 31.57 %
Feel free to use some of the market filters in my trading profile to improve and refine your strategies further, or make a copy and play around with the code yourself. This is just a simple example for demo purposes.

Strategy - DMI Indicator with DPO Indicator as a GuardThe Directional Movement Index Indicator is one of my favorite indicators in tradingview's built-in library. It is free to use for all
For more information on what the DMI is, please visit: www.tradingview.com
The only problem I've come across with the DMI is that when it hits a 'trade range zone' it triggers false new trends (this is the case with almost every indicator I've ever tested).
This script modifies the DMI by removing the need for the ADX logic. It only focuses on the +DI and the -DI.
In order to remove the 'noise' generated during a trade range zone I have added another powerful indicator called the Detrended Price Oscillator.
The DPO is also a 'built-in' indicator on tradingview. www.tradingview.com
The DPO is used in conjunction with the DMI to stop trade ranges from wrecking your profits.
This strategy logic simply checks for the DMI indicator to cross itself. If the +DI crosses over the -DI this is a bullish cross and visa versa, if the -DI crosses over the +DI then it could mean bearish sentiment is building.
But then strategy logic uses the DPO to check if the DPO is above 0 or below 0 value
If the +DI crosses over the -DI and the DPO is above 0 value, then it's a Long entry point.
However, if the +DI crosses over the -DI and the DPO is below 0 value, then the Long signal is void.
And visa versa, if the -DI crosses over the +DI and the DPO is below 0 value, then it's a Short entry point (unless the DPO is greater than 0)
With this DPO 'guard' in place, it helps us keep the total trades executed to a minimum.
This is vital to push through trade ranges that can wreck your profit potential.
I wish I could create a better plotting mechanism for this indicator so you can better see the visuals. But combining the DMI to scale with the DPO is not possible.
The best solution is to simply add another DMI indicator to your chart so you can compare the DMI to this script that is dominated by the DPO (yellow line).
Enjoy! Likes are much appreciated!

iGTR_Official StrategyThis alert indicator is pair of strategy using crossover of multiple Moving Averages for entry in Buy/Sell side & Pivots/Fibonacci zones for booking/trailing gains. Also added pair of moving averages which corresponds with the crossovers to hint potential trend reversal on breach. Green line gives trend reversal indication for Long trades, Red line gives SL indication for Short trades.
Also one may add indicator like MACD/ADX/CCI/RSI for more conformation/rejection/follow-up of trend post entry of signals.
Trend tracking strategy indicators through trend analysis.
Through 18 years of trading experience, I have developed this strategy indicator for Tradingview that enables stable and high returns.
This is the one I am currently using for real trading.
Correct timeframe is key to success. 5-15 min for Intraday, 45-60 min for Swing Positional trades.
The research process is very important as you can see beforehand how well the alerts for this Study would perform.
For detailed backtesting, a backtesting period can be set.
*Note: Backtesting results do not guarantee future results.
This premium indicator is free & not chargeable.
Do not try to outsmart the strategy
Leave your emotion out of trading! If you trust the strategy, you will have way better returns than if you try to outsmart it. Follow each signal you receive even if it doesn't seem logical at the moment.
Become a machine that executes.
Don't look at fundamentals. Follow the trend! Trust the strategy!
Any form of trading has large potential rewards but also large potential risks. The user must be aware of those risks and be willing to accept them. Don't trade with money that you, the user, cannot afford to lose. No representation is being made that you are guaranteed positive results.
The past performance of any trading methodology is not necessarily indicative of future results. Trading involves high risks.
I hope you enjoy it!

Grid ToolThe core idea of this grid tool is that you have to concentrate less on the trade entries (this happens automatically time-independent but price-dependant) but rather on the validity of the macro trend. Exiting a trend when it is no longer valid is more important than entering a trade. But as long as the trend is valid, the trader participates exponentially in the overall trend.
It is advisable to start with a basic position and then "set up" the grid on this in a ratio of 1/10.
A major advantage of grid trading is that the average entry price in a trend moves further and further away from the current market price while the position continues to grow.
A small timeframe should be used so that the distance between the trades corresponds as closely as possible to the selected grid gap and since TV backtests are carried out with closed bars.
Before starting a grid, pre-analysis the market to make sure it is trending. Select the grid gap and grid position size that you are comfortable with. Monitor the trend and from time to time take some profit :).
PS: The ADX filter looks interesting.

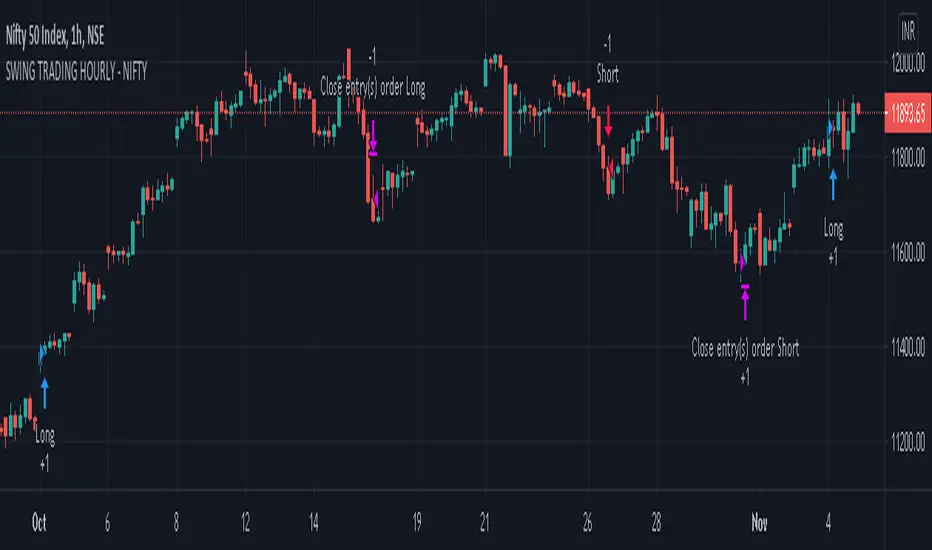
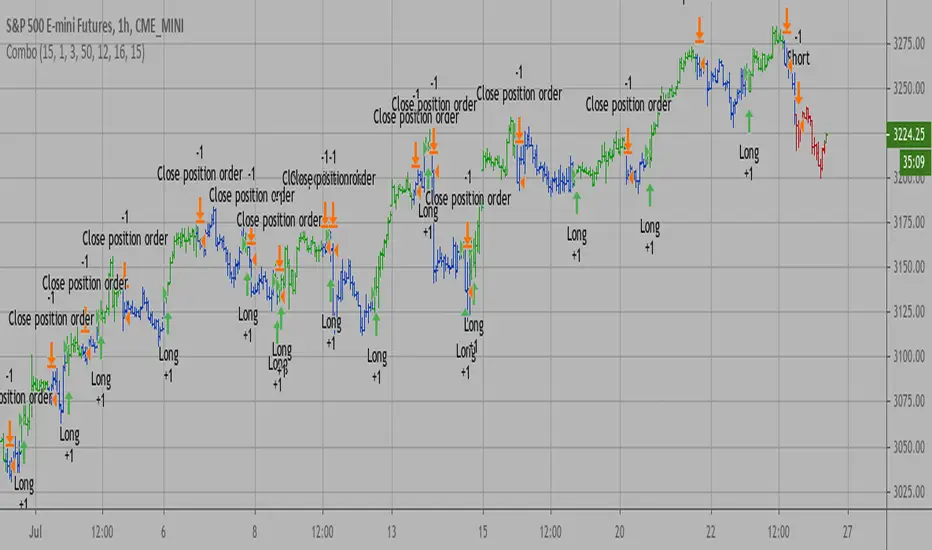
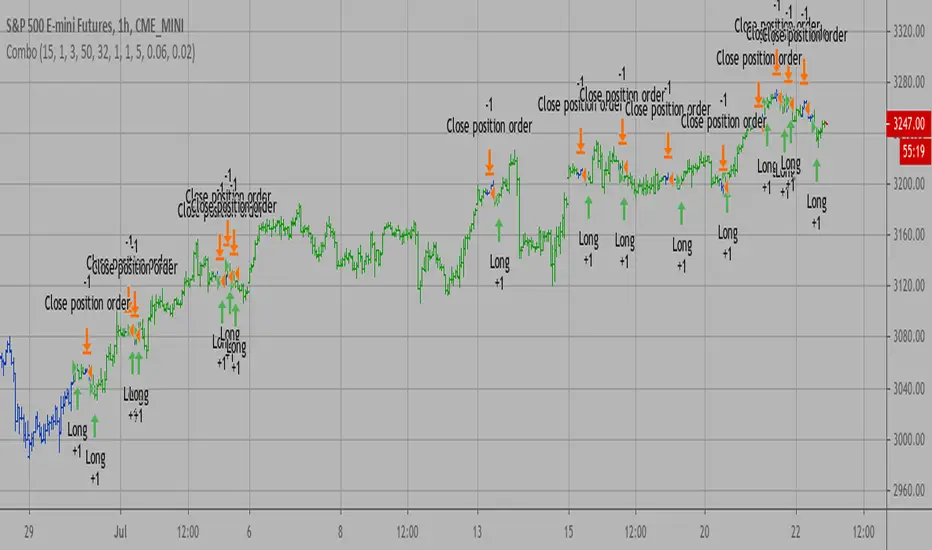
SWING TRADING HOURLY - NIFTYSWING TRADING STARTEGY - NIFTY
TIME FRAME - 1 Hour
INSTRUMENT - NIFTY
STARTEGY LOGIC - Startegy involves 4 components to initiate a trade.
1). Simple moving average cross for trend confirmation.
2). ADX (higher time frame) for trend confirmation.
3). RSI for momentum confirmation.
4). Price Action confirmation in form of range breakout to TRIGGER a trade. Range breaakout is inspired from Donchain Channels
EXIT LOGIC - Close above / below the SMA (simple moving average) in oppoite direction.
TRADE TYPE - Swing Trading
HOLDING PERIOD - As long as Trend remains and till EXIT signal appears.
TRADE METHOD -----
METHOD 1 -
BUY / SHORT NIFTY Futures as per the trend direction.
METHOD 2 -
OPTION SELLING. At The Money (ATM) Weekly Options can be sold to gain premium decay (theta decay). This process can be continued to sell ATM option every week till the trade signal is active.
NOTE 1 - Option Selling can be more profitable in weekly option selling but also carries risk. One must have deep knowledge about risks related to Option Selling.
NOTE 2 - Please analyse the trade signals from this startegy for some period to gain confidence before starting to trade.
NOTE 3 - Trading is a serious business and one must consult a financial advisor before taking a trade. Profits / Loss from this script (strategy) is completely individual user's responsibility.
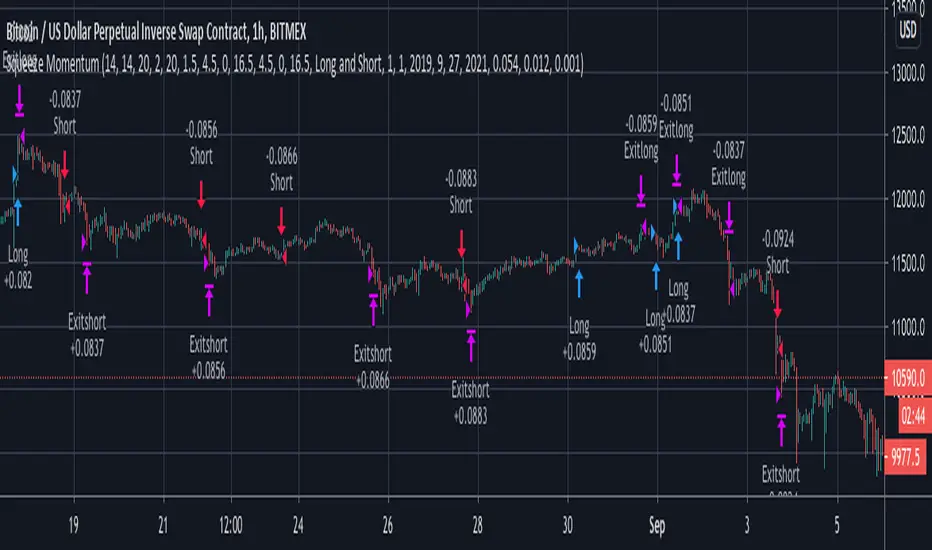
Squeeze Momentum with DMI confirmation strategyThe script combines Squeeze Momentum and Directional Movement Index (DMI) confirmation. It provides long and short entry and closure daily trade signals, suitable for Spot, Marginal and Futures exchanges
The strategy components are customizable:
Change risk management settings (take profit, stop loss, trailing)
Change signals filters
Enable TrueRange or disable
Change lengths and periods of components
Advantages:
1. Deal start condition includes the following filters and requirements:
Momentum value is adjusted using a relative proportion of volume at each timeframe scale to exclude a chance of opening position at a low impulse stage
Squeeze momentum trigger condition is automatically checked before a position is opened
+DI , -DI and ADX values are taken into account to confirm the trend direction
2. Exit positions using unique risk management settings for each asset
3. Strategy allows to connect broker or automatic trading system using web hook alerts
If you want to obtain access to the strategy please send us a personal message
Combo Backtest 123 Reversal & Ergodic TSI This is combo strategies for get a cumulative signal.
First strategy
This System was created from the Book "How I Tripled My Money In The
Futures Market" by Ulf Jensen, Page 183. This is reverse type of strategies.
The strategy buys at market, if close price is higher than the previous close
during 2 days and the meaning of 9-days Stochastic Slow Oscillator is lower than 50.
The strategy sells at market, if close price is lower than the previous close price
during 2 days and the meaning of 9-days Stochastic Fast Oscillator is higher than 50.
Second strategy
r - Length of first EMA smoothing of 1 day momentum 4
s - Length of second EMA smoothing of 1 day smoothing 8
u- Length of third EMA smoothing of 1 day momentum 6
Length of EMA signal line 3
Source of Ergotic TSI Close
This is one of the techniques described by William Blau in his book "Momentum,
Direction and Divergence" (1995). If you like to learn more, we advise you to
read this book. His book focuses on three key aspects of trading: momentum,
direction and divergence. Blau, who was an electrical engineer before becoming
a trader, thoroughly examines the relationship between price and momentum in
step-by-step examples. From this grounding, he then looks at the deficiencies
in other oscillators and introduces some innovative techniques, including a
fresh twist on Stochastics. On directional issues, he analyzes the intricacies
of ADX and offers a unique approach to help define trending and non-trending periods.
WARNING:
- For purpose educate only
- This script to change bars colors.

Combo Backtest 123 Reversal & Ergodic MDI This is combo strategies for get a cumulative signal.
First strategy
This System was created from the Book "How I Tripled My Money In The
Futures Market" by Ulf Jensen, Page 183. This is reverse type of strategies.
The strategy buys at market, if close price is higher than the previous close
during 2 days and the meaning of 9-days Stochastic Slow Oscillator is lower than 50.
The strategy sells at market, if close price is lower than the previous close price
during 2 days and the meaning of 9-days Stochastic Fast Oscillator is higher than 50.
Second strategy
This is one of the techniques described by William Blau in his book "Momentum,
Direction and Divergence" (1995). If you like to learn more, we advise you to
read this book. His book focuses on three key aspects of trading: momentum,
direction and divergence. Blau, who was an electrical engineer before becoming
a trader, thoroughly examines the relationship between price and momentum in
step-by-step examples. From this grounding, he then looks at the deficiencies
in other oscillators and introduces some innovative techniques, including a
fresh twist on Stochastics. On directional issues, he analyzes the intricacies
of ADX and offers a unique approach to help define trending and non-trending periods.
WARNING:
- For purpose educate only
- This script to change bars colors.
Combo Backtest 123 Reversal & Ergodic MACD This is combo strategies for get a cumulative signal.
First strategy
This System was created from the Book "How I Tripled My Money In The
Futures Market" by Ulf Jensen, Page 183. This is reverse type of strategies.
The strategy buys at market, if close price is higher than the previous close
during 2 days and the meaning of 9-days Stochastic Slow Oscillator is lower than 50.
The strategy sells at market, if close price is lower than the previous close price
during 2 days and the meaning of 9-days Stochastic Fast Oscillator is higher than 50.
Second strategy
This is one of the techniques described by William Blau in his book
"Momentum, Direction and Divergence" (1995). If you like to learn more,
we advise you to read this book. His book focuses on three key aspects
of trading: momentum, direction and divergence. Blau, who was an electrical
engineer before becoming a trader, thoroughly examines the relationship
between price and momentum in step-by-step examples. From this grounding,
he then looks at the deficiencies in other oscillators and introduces some
innovative techniques, including a fresh twist on Stochastics. On directional
issues, he analyzes the intricacies of ADX and offers a unique approach to help
define trending and non-trending periods.
Blau`s indicator is like usual MACD, but it plots opposite of meaningof
stndard MACD indicator.
WARNING:
- For purpose educate only
- This script to change bars colors.
Combo Backtest 123 Reversal & Ergodic CSI This is combo strategies for get a cumulative signal.
First strategy
This System was created from the Book "How I Tripled My Money In The
Futures Market" by Ulf Jensen, Page 183. This is reverse type of strategies.
The strategy buys at market, if close price is higher than the previous close
during 2 days and the meaning of 9-days Stochastic Slow Oscillator is lower than 50.
The strategy sells at market, if close price is lower than the previous close price
during 2 days and the meaning of 9-days Stochastic Fast Oscillator is higher than 50.
Second strategy
This is one of the techniques described by William Blau in his book
"Momentum, Direction and Divergence" (1995). If you like to learn more,
we advise you to read this book. His book focuses on three key aspects
of trading: momentum, direction and divergence. Blau, who was an electrical
engineer before becoming a trader, thoroughly examines the relationship between
price and momentum in step-by-step examples. From this grounding, he then looks
at the deficiencies in other oscillators and introduces some innovative techniques,
including a fresh twist on Stochastics. On directional issues, he analyzes the
intricacies of ADX and offers a unique approach to help define trending and
non-trending periods.
This indicator plots Ergotic CSI and smoothed Ergotic CSI to filter out noise.
WARNING:
- For purpose educate only
- This script to change bars colors.
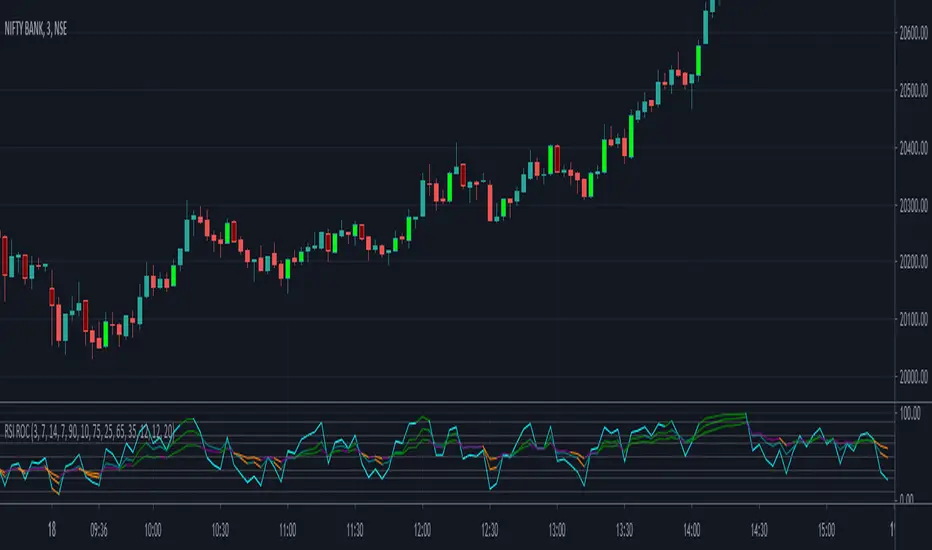
RSI - Rate of ChangeCode based on RSI lower value crossing over higher value
RSI Rate of Change of different lengths used in all parts of code
ADX and CCI use is limited in V1.0
Script provides 3 RSIs and overbrought and oversold for each of these RSIs. When RSI cross over each other clearly Buy and Sell signals are fired.
Lime is buy and Maroon means sell. Use it along with EMA
E.B. StrategyThis strategy use a custom indicator. When the green line cross above the level 6, it's going to sell the stock. When cross down -6, it's going to buy the stock. You can change the level's number to adapt it to any asset.
It works for US30, or any Dow's Futures . But you can adapt it to any market, FOREX/Crypto/Stocks.
Also it works better in 5/15 min chart, but you can adapt it to any resolution too.
We use EMA 100 and ADX 14 as a filter of the indicator.
EntryModel is the level to make Buy and Sell transactions.
ExitModel is the level to close transactions.
In TPandSL you can choose:
No -> if you want only buy and sell, without closing transactions.
Model -> you will use the ExitModel parameter to close transactions.
% -> if you want to use a percentage of TP and SL.
Volatility -> to adapt TP and SL with the volatility of the moment.
Pips -> if you want to use Pips to close transactions.
If you would like to have the access, just DM me!
