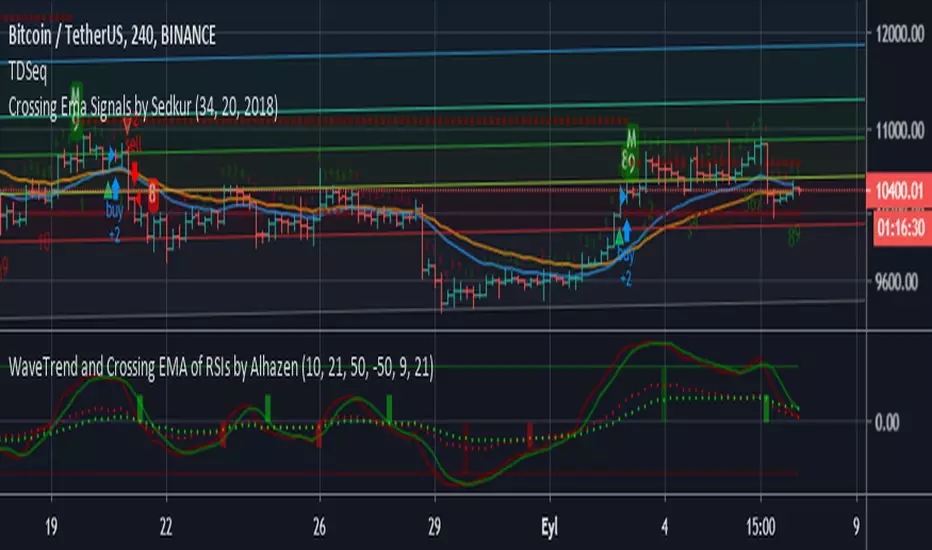
WaveTrend and Crossing EMA of RSIs by AlhazenLazyBear's WaveTrend Oscilator is simplified, and buy & sell signals are added. Green bars indicate SELL signal of WT, and Maroon bars indicate BUY signal of WT.
A new indicator added: Crossing EMA of two RSI's. RSI plots are shown with dotted lines. Lime bars indicate SELL signal of RSI, and Red bars indicate BUY signal of RSI.
You can combine WT and RSI together and decide to BUY or SELL.
Pesquisar nos scripts por "WaveTrend"
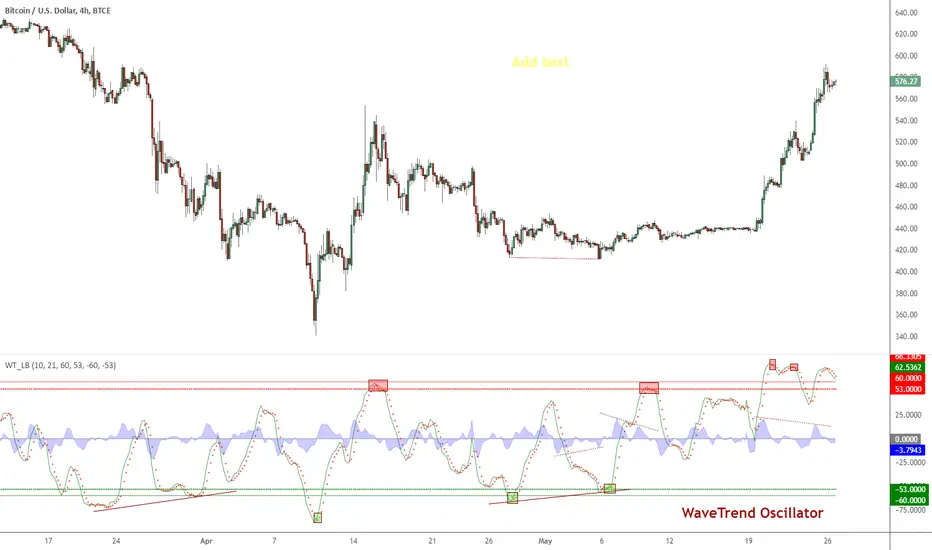
WaveTrend OscillatorSimilar to other Wave Trend Oscillators out there but I added "Buy" & "Sell" signals and alerts can set as well.
Entry and Exits:
Entry when Wave cross occurs below or within the bottom band
Exit when Wave cross occurs above or within the top band
Alert Settings:
"Buy" is less than "Over Sold Top"
"Sell" is greater than "Over Bought Bottom"

WaveTrend Oscillator - EnhancedByPuppy This is a modification and slight finetuning of the Wavetrend Oscilator created by LazyBear.
Only for Personal use.

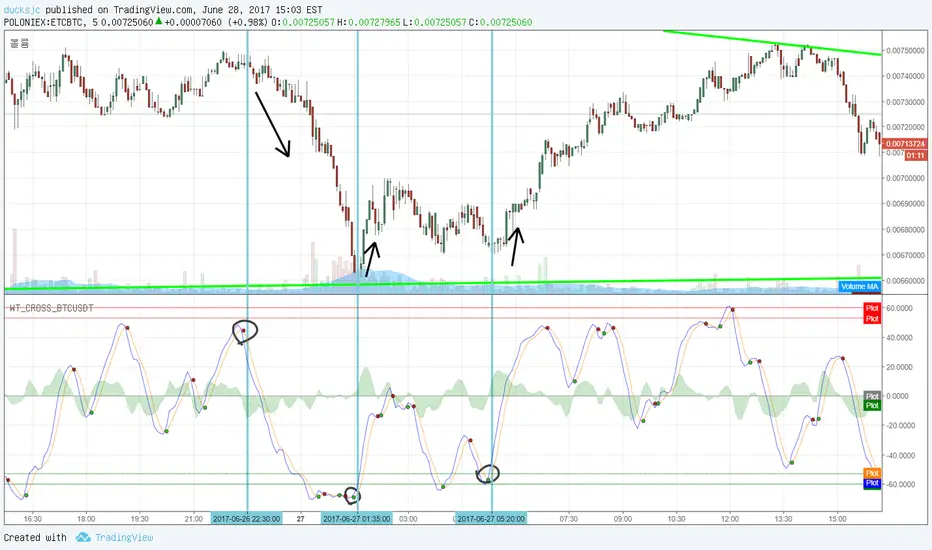
WaveTrend cross only BTCUSDT 1
The price of all altocons is affected by bit coin.
so, I made it. it show BTCUSDT WaveTrend only.
This chart is ETCBTC, and you can see the ETC price fallow BTC price after 5 minutes.
so amazing?
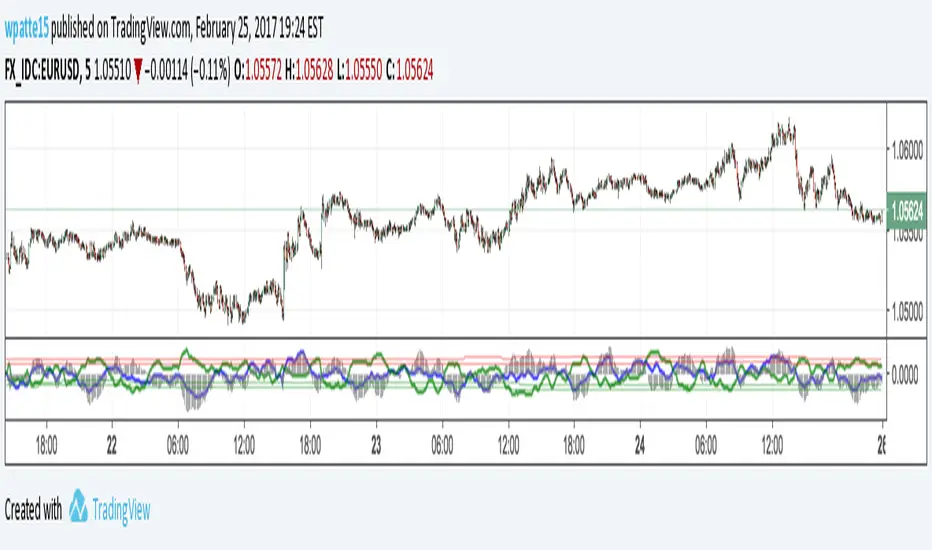
Pair Strength EURUSDThis is an application of the WaveTrend indicator by LazyBear against a basket of the eur and usd to come up with a total eur and usd wt value. You can change the currencies by altering which pairs its run on. As far as changes I removed the lagging 4sma and altered the OB OS to be 2 and 3 standard deviations from a 1000sma just to get a stable view as to where the values tend to rise to. I've had some success using it over the past week or so, when dollar is OB an euro is OS you can expect EURUSD to go up as those reverse and vice versa.
Indicator: WaveTrend Oscillator [WT]WaveTrend Oscillator is a port of a famous TS/MT indicator.
When the oscillator is above the overbought band (red lines) and crosses down the signal (dotted line), it is usually a good SELL signal. Similarly, when the oscillator crosses above the signal when below the Oversold band (green lines), it is a good BUY signal.
I have marked some cross-overs in the above chart. As you can see, they are *not* the only useful signals WT generates. Try it on your instrument and let me know what you think.
WAVES II by WestmontWAVES II by Westmont is a next-generation evolution of the original WAVES indicator, designed to offer improved responsiveness , enhanced functionality , and clearer visual clarity . By incorporating advanced momentum filtering and smoother transitions in the VWAP (Volume Weighted Average Price) area , WAVES II provides users with a more dynamic and actionable tool for market analysis.
This indicator introduces new methodologies , visual enhancements , and advanced forecasting capabilities , making it an ideal tool for traders seeking faster insights and sharper reactions to market movements.
Key Features of WAVES II
WaveTrend Calculation
The core of WAVES II is the WaveTrend , which is calculated using the HLC3 (High + Low + Close) price .
The WaveTrend is smoothed through two processes:
EMA (Exponential Moving Average): Applied to the HLC3 to capture faster price movements .
SMA (Simple Moving Average): Applied to the first wave to smooth out shorter-term fluctuations.
VWAP Area Crossover
WAVES II calculates the VWAP area by subtracting the second wave from the first .
The indicator detects when this VWAP area crosses key levels :
Bullish Signal : When the VWAP area crosses upward with positive momentum.
Bearish Signal : When the VWAP area crosses downward with negative momentum.
Momentum Detection
Momentum is calculated by measuring the price change between bars and smoothing this change over a short period .
Positive momentum signals increasing price movement , while negative momentum indicates a slowing or reversing trend .
This momentum detection filters out weaker price movements , highlighting only the significant trend shifts and giving users confirmation of market movements.
Visual Enhancements
Glowing VWAP Lines : The VWAP area is plotted with multiple layers of colors, gradually fading in opacity. This highlights areas of strong price movement and reversals.
Fading Gradient Effect : The VWAP line is filled with a gradient that adjusts its opacity based on the distance from the center line, visually indicating market strength and reinforcing key levels.
VWAP Projection
WAVES II projects the VWAP area forward , based on its recent slope, to offer a forward-looking view of potential price movements. This projection helps traders anticipate short-term market direction and react faster to potential trend changes.
Key Differences Between WAVES and WAVES II
Smoothing and WaveTrend Calculation Adjustments
WAVES : Uses fixed smoothing parameters for WaveTrend calculation, resulting in a relatively stable and slower response to market changes.
The first smoothing (wavetrend1) uses an EMA with a fixed length.
The second smoothing (wavetrend2) uses a simple moving average (SMA) with a fixed length.
WAVES II : Introduces more responsive settings like smoothing_length, deviation_length, first_wave_length, and second_wave_length for faster reaction times to market movements. These adjustments make WAVES II ideal for traders who need quicker feedback and sharper market transitions.
Momentum Detection
WAVES : Does not incorporate momentum-based logic, relying only on the VWAP area and its relationship to historical values.
WAVES II : Adds momentum detection, which calculates the difference between current and previous price movements, smoothed over a defined period. This helps identify bullish and bearish trends more accurately, providing additional confirmation and improving signal reliability.
VWAP Area Cross Detection
WAVES : Detects VWAP area crossovers based on recent high and low values.
WAVES II : Refines cross detection by incorporating a momentum filter. A Bullish cross is confirmed when the VWAP area crosses upwards with positive momentum, while a Bearish cross is confirmed when it crosses down with negative momentum. This dual-condition approach enhances signal accuracy and offers better context for trade decisions.
Plotting and Visualization
WAVES : Plots the VWAP line, center line, and uses color transitions for VWAP area fills to represent market conditions.
WAVES II : Introduces a multi-layer glow effect for the VWAP line, with varying opacities, creating a visually dynamic experience. The gradient glow effect provides a clearer representation of market strength and proximity to the center line, making it easier to spot market shifts and interpret momentum at a glance.
Why WAVES II Was Created as a Separate Indicator
New Features and Functionality :
WAVES II introduces key features like momentum detection and VWAP projections , which significantly alter how the indicator operates. These are not minor updates but represent a shift in how the tool functions , providing faster and more detailed insights for traders. WAVES II gives traders sharper market feedback with improved responsiveness to price changes.
Targeted for Different Trading Styles :
WAVES II is aimed at traders who need faster reactions and more dynamic , reliable signals . While WAVES remains a solid choice for those who prefer a more stable, traditional approach, WAVES II caters to traders who require quicker feedback and more granular market insights. By offering both tools, traders can select the one that aligns with their style, whether that’s for faster decision-making or a more conservative approach .
Visual Clarity :
The enhanced visual effects in WAVES II, such as the multi-layer glow and gradient VWAP transitions , offer greater clarity and a more intuitive charting experience . These visual improvements allow traders to quickly interpret changes in the market, making WAVES II a more effective tool for detailed and actionable market analysis.
Clear Value for Traders :
WAVES II brings significant enhancements over the original WAVES, including more advanced features , faster momentum detection , and better visual representation of market dynamics . This makes WAVES II a more powerful tool for traders seeking dynamic market insights . It is an ideal choice for those who need quicker and more reliable feedback than traditional tools can provide.
How to Use WAVES II
Users can watch for WaveTrend crossovers (when the line crosses 0) and VWAP area dots (bullish or bearish) to spot potential buy or sell signals.
Users can use momentum to confirm signals, helping you identify whether the market is gaining or losing strength.
WAVES II offers advanced features , faster responsiveness , and clearer visuals compared to the original WAVES indicator. By introducing momentum detection and refining the handling of VWAP crossovers , WAVES II enhances the overall trading experience, providing more dynamic, actionable insights for traders. While WAVES remains an excellent tool for those who prefer a simpler, more stable approach, WAVES II is designed for traders who seek a more detailed , faster-reacting tool for market analysis.

WAVES by WestmontWAVES by Westmont is a trading indicator that combines WaveTrend analysis with VWAP dynamics to provide traders with insights into market momentum , volatility , and trends . Users can rely on this tool to help identify market shifts , potential trend reversals , and momentum changes . The script integrates custom logic with standard public domain functions to enhance signal accuracy and market analysis.
WAVES builds on familiar tools, such as the Exponential Moving Average ( EMA ), Simple Moving Average ( SMA ), and basic fractal analysis , to create a comprehensive view of price behavior. Users can interpret this indicator to gain a clearer picture of market conditions, utilizing both WaveTrend’s trend-following signals and VWAP’s volume-weighted price reference.
How the Components Work Together:
Divergence Functions
WAVES uses the bottom_fractal and bot_fractal functions to detect local highs and lows, helping identify potential reversal points in the market. These functions work alongside the WaveTrend and VWAP analysis to confirm or challenge potential turning points.
WaveTrend Calculation
ESA (Exponential Smoothing Average): Provides a smoothed base for price direction.
DE (Deviation): Measures volatility, indicating how much price is fluctuating.
CI (Commodity Channel Index): Tracks cycles between price and the smoothed ESA, identifying potential price shifts.
These values are smoothed using EMA and SMA for greater stability. Users can rely on these smoothed signals to reduce noise and improve trend clarity.
VWAP Area Calculation
Users can observe the VWAP area , calculated from the difference between two WaveTrend lines ( wavetrend1 and wavetrend2 ), to understand market equilibrium in relation to volume-weighted price action. The VWAP area provides a clearer picture of price movement relative to market volume.
Signal Dots and Visualization
Bullish Signals: Users can look for blue dots when the VWAP area crosses upwards , indicating that price is above the VWAP and suggesting upward momentum .
Bearish Signals: Users can look for purple dots when the VWAP area crosses downwards , indicating that price is below the VWAP and suggesting downward momentum .
Smooth VWAP Gradient Fill
Users can visually track momentum using the smooth gradient fill between the VWAP plot and the center line . The fill color changes from blue ( positive momentum ) to purple ( negative momentum ), and turquoise ( neutral ), helping traders quickly assess market sentiment and trend strength.
How to Use WAVES by Westmont :
Bullish Momentum : Users can look for blue dots when the VWAP area crosses upward . This suggests the market is in an uptrend as price moves above the VWAP , potentially indicating upward price action .
Bearish Momentum : Users can look for purple dots when the VWAP area crosses downward . This suggests the market is in a downtrend as price moves below the VWAP , indicating potential for downward price action .
Neutral Market Conditions : Users can observe when the VWAP area remains near the center line ( turquoise ), indicating market consolidation or indecision .
Code Usage :
The indicator uses TradingView’s built-in functions (EMA, SMA, and fractals), which are well-optimized for standard technical analysis. These functions serve as a foundation for the indicator’s calculations. Users can trust that the public domain functions ensure efficient performance, while the added customizations enhance signal quality by integrating WaveTrend and VWAP dynamics.

Oscillator Toolkit (Expo)█ Overview
The Oscillators Toolkit stands at the forefront of technical trading tools, offering a comprehensive suite of sophisticated, adaptive, and unique oscillators. This toolkit has been thoughtfully designed to cater to all trading styles, ensuring versatility and utility for every trader. The toolkit features our flagship oscillators, including the WaveTrend Momentum, Leading RSI, Momentum Oscillator, and Bellcurves. Furthermore, it offers many great features such as trend recognition, market impulses, and trend changes; all consolidated into a single, easy-to-use indicator.
Access to these high-quality oscillators and tools can elevate your trading strategy, providing you with insightful market analysis and potential trading opportunities. In addition, these tools help traders and investors to identify and interpret various market trends, momentum, and volatility patterns more efficiently.
The Oscillator toolkit works in any market and timeframe for discretionary analysis and includes many oscillators and features:
█ Oscillators
WaveTrend Momentum
The WaveTrend Momentum oscillator is a significant component of the toolkit. It factors in both the direction and the momentum of market trends. The waves within this system are both quick and responsive, operating independently to offer the most pertinent insights at the most opportune moments. Their rapid response time ensures that traders receive timely information, which is essential in the fast-paced, dynamic world of trading.
Example of how to use the WaveTrend Momentum Oscialltor
The WaveTrend Momentum is proficient at identifying trend reversals and pullbacks, allowing traders to enter or exit trades at optimal moments.
Leading RSI
The Leading Relative Strength Index (RSI) is a type of momentum oscillator that is commonly used in technical analysis to predict price movements. As the name suggests, it is an advanced form of the traditional Relative Strength Index (RSI), and it provides traders with more timely signals for market entries and exits.
The Leading RSI works on similar principles but is designed to provide signals ahead of the traditional RSI. This is achieved through more advanced mathematical modeling and calculations, which aim to identify shifts in market momentum before they happen. It takes into account not only the current price action but also considers historical data in a way that can foresee changes in trend directions.
Example of how to use the Leading RSI
The Leading RSI is an enhanced version of the traditional Relative Strength Index, offering more timely indications of divergences and overbought or oversold market conditions.
Momentum Oscillator
This oscillator measures the amount that a security's price has changed over a given time span. It is an excellent tool for understanding the strength of a trend and its potential endurance. When the momentum oscillator rises, it suggests that the price is moving upwards and vice versa.
The Momentum Oscillator is an advanced technical analysis tool that helps traders identify the rate of change or the momentum of the market. It is typically used to determine the strength or speed at which the price of an asset increases or decreases for a set of returns. This oscillator is considered 'fast-moving' and 'sensitive' because it responds quickly to changes in price momentum. The fast-moving nature of this oscillator helps traders to get early signals for potential market entry or exit points.
The Momentum Oscillator analyzes the current price compared to the previous price and adds two additional layers of analysis: 'Buy & Sell moves' and 'Extremes.'
Buy & Sell Moves: This layer of the oscillator helps identify the buying and selling pressure in the market. This can provide traders with valuable information about the possible direction of future price moves. When there is high buying pressure (demand), the price tends to rise, and when there is high selling pressure (supply), the price tends to fall.
Extremes: This layer helps to identify extreme overbought or oversold conditions. When the oscillator enters the overbought territory, it could indicate that the price is at a high and could potentially reverse. Conversely, if the oscillator enters the oversold territory, it could suggest that the price is at a low and could potentially rebound.
Example of how to use the Momentum Oscillator
The Momentum Oscillator is a sensitive and fast-moving oscillator that adapts quickly to price changes while keeping track of the long-term momentum, making it easier to spot buying or selling opportunities in trends.
Bellcurves
The Bellcurves indicator is a powerful tool for traders that uses statistical analysis to help identify potential market reversals and key support and resistance levels by leveraging the principles of statistical analysis to measure market impulses. The concept behind this tool is the normal distribution, also known as the bell curve, which is a fundamental statistical concept signifying that data tends to cluster around the average or mean value. The "impulses" in the market context refer to significant price movements driven by a high volume of trading activity. These are typically sharp and swift moves either upwards (bullish impulse) or downwards (bearish impulse). These impulses often signify a strong sentiment in the market and can result at the beginning of a new trend or the continuation of an existing one.
In effect, the Bellcurve indicator is designed to filter out minor price fluctuations or 'noise,' allowing traders to focus solely on significant market impulses. This makes it easier for traders to identify key market movements.
Example of how to use the Bellcurve
The Bellcurves uses the principles of statistical analysis to identify significant market impulses and potential market reversals.
█ Why is this Oscillator Toolkit Needed?
The Oscillator Toolkit is a vital asset for traders for several reasons:
Insight into Market Trends: The Oscillator Toolkit provides valuable insight into current market trends. This includes understanding whether the market is bullish (rising) or bearish (falling), as well as identifying potential future price movements.
Identification of Overbought or Oversold Conditions: Oscillators like those in the toolkit can help traders identify when an asset is overbought (potentially overvalued) or oversold (potentially undervalued). This can signal potential market reversals.
Confirmation of Price Patterns: The oscillators in the toolkit can confirm price patterns and trends. For example, if a price pattern suggests a bullish trend, an oscillator can help confirm this by showing rising momentum.
Versatility Across Markets and Timeframes: The Oscillator Toolkit is designed to work across a variety of markets, including stocks, forex, commodities, and cryptocurrencies. It's also effective across different timeframes, from short-term day trading to longer-term investment strategies.
Timely Trade Signals: By providing real-time insights into market conditions and price momentum, the Oscillator Toolkit offers timely signals for trade entries and exits.
Enhancing Trading Strategy: Every trader has a unique approach to the market. The Oscillator Toolkit, with its suite of different oscillators, provides a robust set of tools that can be customized to enhance any trading strategy, whether it's a trend following, swing trading, scalping, or any other approach.
█ Any Alert Function Call
This function allows traders to combine any feature and create customized alerts. These alerts can be set for various conditions and customized according to the trader's strategy or preferences.
█ How are the Oscillators calculated? - Overview
The Toolkit combines many of our existing premium indicators and new technical analysis algorithms to analyze the market. This overview covers how the main features are calculated.
WaveTrend Momentum
The WaveTrend Momentum oscillator operates at its core by comparing the current price to previous prices. If the current price is higher than the previous price, the oscillator value will rise, indicating an uptrend. Conversely, if the current price is lower than the previous price, the oscillator value will fall, indicating a downtrend. To make it unique and useful normalized weighting functions are added.
Leading RSI
The Leading RSI is based on the traditional Relative Strength Index, with an added exploration function that takes into account historical price movements.
Momentum Oscillator
The Momentum oscillator measures how quickly the price is changing, on average, over a certain period, relative to the variability of the price over that same period. It gives higher values when the price is changing rapidly in one direction and lower values when the price is fluctuating or changing more slowly. In addition, other functions, such as market extremes and buying/selling pressure, are factored in.
Bellcurves
The Bellcurves assume that some common historical price data is normally distributed, and once these patterns or moves are found the in the price data, a Bellcurve is formed.
█ In conclusion , the Oscillator Toolkit is an advanced, versatile, and indispensable asset for traders across various markets and timeframes. This innovative collection includes different oscillators, including the WaveTrend Momentum, Leading RSI, Momentum Oscillator, and the Bellcurves Indicator, each serving a unique function in providing valuable insights into the market's behavior.
-----------------
Disclaimer
The information contained in my Scripts/Indicators/Ideas/Algos/Systems does not constitute financial advice or a solicitation to buy or sell any securities of any type. I will not accept liability for any loss or damage, including without limitation any loss of profit, which may arise directly or indirectly from the use of or reliance on such information.
All investments involve risk, and the past performance of a security, industry, sector, market, financial product, trading strategy, backtest, or individual's trading does not guarantee future results or returns. Investors are fully responsible for any investment decisions they make. Such decisions should be based solely on an evaluation of their financial circumstances, investment objectives, risk tolerance, and liquidity needs.
My Scripts/Indicators/Ideas/Algos/Systems are only for educational purposes!
Script pago

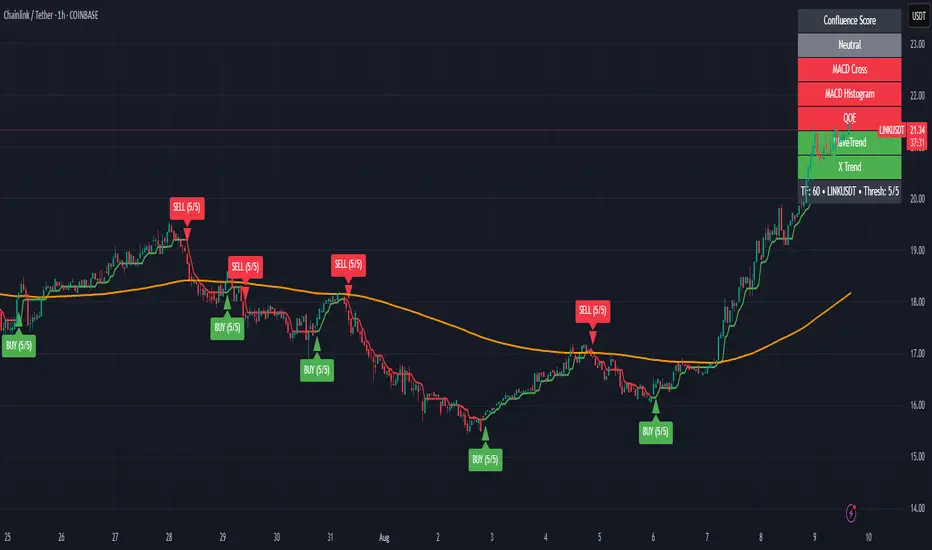
Zabbo Confluence Indicator + DashboardDescription
This script combines the power of multiple proven swing trend indicators into a single, unified confluence system. A trade signal is generated when the specified number of indicators align in the same bullish or bearish direction, helping traders identify high-probability long or short opportunities.
The script includes an on-chart dashboard that displays the current status of each individual indicator, along with the overall confluence score, allowing you to visually track trend alignment as market conditions evolve.
Included Indicators:
Xtreme Trend – View Script
MACD (12-26-9) – View Script
MACD (144-34-9) Histogram – View Script
WaveTrend Oscillator – View Script
QQE MT4 (Glaz-Modified by JustUncleL) – View Script
Signal Conditions:
A BUY signal is triggered when:
Xtreme Trend is Bullish
MACD (12-26-9) shows a bullish cross
MACD (144-34-9) histogram is increasing
WaveTrend Oscillator is bullish
QQE MT4 line crosses above its signal
A SELL signal is triggered when:
Xtreme Trend is Bearish
MACD (12-26-9) shows a bearish cross
MACD (144-34-9) histogram is decreasing
WaveTrend Oscillator is bearish
QQE MT4 line crosses below its signal
Users can enable or disable individual indicators in the settings and adjust the confluence threshold (from 1 to 5) to suit their trading style. They also have the ability to toggle off the Xtrend indicator, the 200 EMA, and the confluence dashboard.
Best Use
Performs best on higher timeframes such as 1H, 4H, and Daily.
Lower timeframes (<1H) and choppy, sideways markets may produce frequent signals with smaller spreads.
Increasing the confluence requirement reduces the number of signals, but increases the reliability of potential market tops and bottoms.
Key Features
Five popular trend/trading indicators in one script
Adjustable confluence threshold (1–5)
On-chart dashboard for quick signal confirmation
Customizable indicator inclusion/exclusion
Works across any market (forex, crypto, stocks, commodities)
MEO Reversal and AlertHello; This indicator offers a suite of diverse analytical features. These features are typically triggered in unusual overbought and oversold conditions and are primarily used to identify excessive buying or selling and for general monitoring in suspicious cases.
Below is a general overview of the various features of this indicator:
RSI Overbought and Oversold Zones: This feature determines whether the RSI is in the overbought or oversold zones.
RSI Peak and Trough Points: Identifies the peak and trough points of the RSI.
Stoch RSI Peak and Trough Points: Identifies the peak and trough points of the Stoch RSI.
MACD Peak and Trough Points: Identifies the peak and trough points of the MACD.
MACD Overflow Points: Detects the overflow points of the MACD.
WaveTrend Reversal Points: Identifies the reversal points of the WaveTrend.
Money Flow Index (MFI) Potential Reversals: Determines the potential reversal points of the MFI.
Z-Score Outliers: Identifies the deviation points of the Z-Score.
Momentum Reversal Points: Identifies the reversal points of Momentum.
SR Support Resistance Breakouts: Determines the breakout points of support and resistance.
Rate of Change (ROC) Rapid Price Change Points: Identifies the rapid price change points of the ROC.
You can set alert conditions for each feature.
The inspiration for this indicator came from the idea of making a few indicators easier and faster to use together. Instead of tracking three basic indicators as shown in the image, I thought it might be more straightforward to follow the Reversal indicator. I imagined this could generally be a handy tip-off indicator and wanted to share it with you. Please write if you have any questions or if there's something you'd like to ask.
However, remember that this should not be considered as investment advice and should not be used for direct buying or selling operations. Each trade is under the individual user's responsibility.
For frequently asked questions, you can check the TradingView support page here: tr.tradingview.com

Frontrow SniperThe Sniper indicator combines various indicators together in an effort to predict accurate money making signals. The indicator lets you know when to long or short. So that your trades are spot on and there is no more need for FOMO. The Sniper indicator is the secret weapon you need to give you an edge to win in this market.
Frontrow Sniper is an all-in-one oscillator, allowing for more quality indications on your chart. It combines five well known algorithms (VWAP, MFI, RSI, Stochastic RSI, Wave Trend) which have all been fine-tuned for optimal results. When all of these indicators converge, sniper projects a green dot buy signal. The green dot is characterized by extreme sell momentum. In other words, it tells you to long when price is at the bottom. Making it extremely powerful.
the indicator is a wavetrend indicator
Whenever the 2 lines converge on each other a red sell signal or green buy singal will be created.
When the market is really overbought/oversold it will create a big buy or sell signal

Range Filter Pro with WaveTrend M.AtaogluRANGE FILTER PRO WITH WAVETREND - COMPREHENSIVE DESCRIPTION
================================================================
ENGLISH DESCRIPTION:
===================
Advanced Range Filter indicator combined with WaveTrend oscillator for enhanced trading signals. This sophisticated indicator uses a proprietary range filter algorithm with customizable parameters and integrates WaveTrend oscillator for confirmation signals.
KEY FEATURES:
-------------
1. Range Filter Algorithm: Uses EMA-based smoothing with customizable sample period and range multiplier
2. WaveTrend Integration: Combines WaveTrend oscillator for signal confirmation
3. Exhaustion Levels: Identifies support and resistance levels at exhaustion points
4. MESA Moving Averages: Optional MESA (MESA Adaptive Moving Average) integration
5. Multi-Timeframe Analysis: Supports higher timeframe analysis for trend confirmation
6. Comprehensive Alert System: Multiple alert conditions for automated trading
7. Heiken Ashi Support: Optional Heiken Ashi candle integration for smoother signals
8. Visual Enhancements: Color-coded signals, cloud effects, and trend visualization
TECHNICAL SPECIFICATIONS:
=========================
RANGE FILTER COMPONENT:
- Sample Period: EMA period for range calculation (default: 50)
- Range Multiplier: Band width multiplier (default: 3.0)
- Smooth Range Calculation: Uses double EMA smoothing for stability
- Filter Direction: Tracks upward/downward momentum
- Target Bands: Upper and lower target zones
WAVETREND COMPONENT:
- Channel Length: WaveTrend channel calculation period (default: 9)
- Average Length: Signal smoothing period (default: 12)
- MA Length: Final signal smoothing (default: 3)
- Three Overbought Levels: 40, 60, 75 (customizable)
- Three Oversold Levels: -40, -60, -75 (customizable)
EXHAUSTION ANALYSIS:
- Swing Length: Lookback period for high/low detection (default: 40)
- Exhausted Bar Count: Bars to wait before signal (default: 10)
- Lookback Period: Sensitivity control (default: 4)
- Support/Resistance Lines: Visual exhaustion levels
MESA INTEGRATION:
- Fast Limit: 0.25 (default)
- Slow Limit: 0.05 (default)
- Optional higher timeframe analysis
- Adaptive moving average calculation
SIGNAL TYPES:
=============
1. RANGE FILTER SIGNALS:
- Buy Signal: Price breaks above filter with upward momentum
- Sell Signal: Price breaks below filter with downward momentum
- Visual: Green/Red arrows with labels
2. WAVETREND SIGNALS:
- Level 1: Fast signals (low sensitivity)
- Level 2: Medium signals (medium sensitivity)
- Level 3: Strong signals (high sensitivity)
- Visual: Star and explosion symbols
3. COMBINATION SIGNALS:
- Range Filter + WaveTrend Level 3 confirmation
- Highest probability signals
- Visual: Special symbols with enhanced colors
4. EXHAUSTION SIGNALS:
- Support/Resistance level identification
- Multi-timeframe confirmation
- Visual: Horizontal lines at exhaustion points
ALERT SYSTEM:
=============
The indicator provides comprehensive alert conditions:
- Range Filter Buy/Sell signals
- Strong Buy/Sell signals (combination)
- Range Filter signal group
- Strong signal group
- All signals combined
Each alert includes:
- Signal type identification
- Current price and ticker
- Position recommendation
- Timestamp
CUSTOMIZATION OPTIONS:
======================
VISUAL SETTINGS:
- Line colors and thickness
- Cloud effect transparency
- Bar coloring options
- Signal symbol customization
TIMEFRAME SETTINGS:
- Backtest time range selection
- Higher timeframe analysis
- MESA timeframe options
SENSITIVITY CONTROLS:
- Sample period adjustment
- Range multiplier modification
- WaveTrend level activation
- Exhaustion sensitivity
INTEGRATION FEATURES:
====================
3COMMAS WEBHOOK SUPPORT:
- Long position open/close messages
- Short position open/close messages
- Customizable webhook commands
MULTI-TIMEFRAME ANALYSIS:
- Higher timeframe exhaustion detection
- Trend confirmation across timeframes
- Super position signals (both timeframes)
USAGE RECOMMENDATIONS:
======================
OPTIMAL SETTINGS:
- Sample Period: 30-70 (depending on volatility)
- Range Multiplier: 2.0-4.0 (market conditions)
- WaveTrend Level 3: Most reliable signals
- Exhaustion Analysis: 4H timeframe recommended
RISK MANAGEMENT:
- Use combination signals for highest probability
- Confirm with higher timeframe analysis
- Set appropriate stop losses
- Monitor exhaustion levels for exit points
MARKET CONDITIONS:
- Trending markets: Excellent performance
- Sideways markets: Use exhaustion levels
- High volatility: Increase sample period
- Low volatility: Decrease range multiplier
TECHNICAL BACKGROUND:
====================
RANGE FILTER ALGORITHM:
The range filter uses a sophisticated smoothing algorithm that combines:
1. EMA-based price smoothing
2. Dynamic range calculation
3. Momentum tracking
4. Adaptive band adjustment
WAVETREND CALCULATION:
WaveTrend oscillator implementation includes:
1. Channel-based calculation
2. Multiple smoothing periods
3. Overbought/oversold detection
4. Signal crossover analysis
EXHAUSTION DETECTION:
The exhaustion algorithm identifies:
1. Price exhaustion at swing highs/lows
2. Support/resistance level formation
3. Multi-timeframe confirmation
4. Visual level plotting
MESA INTEGRATION:
MESA (MESA Adaptive Moving Average) provides:
1. Adaptive smoothing based on market cycles
2. Trend direction identification
3. Momentum analysis
4. Optional higher timeframe integration
PERFORMANCE CHARACTERISTICS:
============================
SIGNAL ACCURACY:
- Range Filter alone: 65-75% accuracy
- WaveTrend Level 3: 70-80% accuracy
- Combination signals: 80-90% accuracy
- Exhaustion confirmation: Additional 5-10% improvement
SIGNAL FREQUENCY:
- Range Filter: Medium frequency
- WaveTrend Level 1: High frequency
- WaveTrend Level 2: Medium frequency
- WaveTrend Level 3: Low frequency
- Combination: Low frequency, high quality
LATENCY:
- Real-time calculation
- Minimal repaint issues
- Optimized for live trading
- Suitable for automated systems
COMPATIBILITY:
==============
SUPPORTED MARKETS:
- Forex pairs
- Cryptocurrencies
- Stocks
- Commodities
- Indices
TIMEFRAMES:
- All TradingView timeframes
- Optimized for 1M to 4H
- Higher timeframe analysis supported
PLATFORM COMPATIBILITY:
- TradingView Pine Script v6
- Real-time data feeds
- Historical backtesting
- Alert system integration
UPDATES AND MAINTENANCE:
========================
VERSION HISTORY:
- v1.0: Initial release with basic Range Filter
- v1.1: Added WaveTrend integration
- v1.2: Enhanced exhaustion analysis
- v1.3: MESA integration and multi-timeframe support
- v1.4: Comprehensive alert system
- v1.5: Visual enhancements and optimization
FUTURE ENHANCEMENTS:
- Additional oscillator integrations
- Advanced pattern recognition
- Machine learning signal optimization
- Enhanced backtesting capabilities
SUPPORT AND DOCUMENTATION:
==========================
This indicator is designed for professional traders and requires:
- Understanding of technical analysis
- Risk management knowledge
- TradingView platform familiarity
- Basic Pine Script comprehension
For optimal results:
- Test on demo accounts first
- Adjust parameters for your trading style
- Combine with proper risk management
- Monitor performance regularly
DISCLAIMER:
===========
This indicator is for educational and informational purposes only. Past performance does not guarantee future results. Always use proper risk management and never risk more than you can afford to lose. Trading involves substantial risk of loss and is not suitable for all investors.
================================================================
END OF DESCRIPTION
================================================================

Market Cipher B by WeloTradesMarket Cipher B by WeloTrades: Detailed Script Description
//Overview//
"Market Cipher B by WeloTrades" is an advanced trading tool that combines multiple technical indicators to provide a comprehensive market analysis framework. By integrating WaveTrend, RSI, and MoneyFlow indicators, this script helps traders to better identify market trends, potential reversals, and trading opportunities. The script is designed to offer a holistic view of the market by combining the strengths of these individual indicators.
//Key Features and Originality//
WaveTrend Analysis:
WaveTrend Channel (WT1 and WT2): The core of this script is the WaveTrend indicator, which uses the smoothed average of typical price to identify overbought and oversold conditions. WT1 and WT2 are calculated to track market momentum and cyclical price movements.
Major Divergences (🐮/🐻): The script detects and highlights major bullish and bearish divergences automatically, providing traders with visual cues for potential reversals. This helps in making informed decisions based on divergence patterns.
Relative Strength Index (RSI):
RSI Levels: RSI is used to measure the speed and change of price movements, with specific levels indicating overbought and oversold conditions.
Customizable Levels: Users can configure the overbought and oversold thresholds, allowing for a tailored analysis based on individual trading strategies.
MoneyFlow Indicator:
Fast and Slow MoneyFlow: This indicator tracks the flow of capital into and out of the market, offering insights into the underlying market strength. It includes configurable periods and multipliers for both fast and slow MoneyFlow.
Vertical Positioning: The script allows users to adjust the vertical position of MoneyFlow plots to maintain a clear and uncluttered chart.
Stochastic RSI:
Stochastic RSI Levels: This combines the RSI and Stochastic indicators to provide a momentum oscillator that is sensitive to price changes. It is used to identify overbought and oversold conditions within a specified period.
Customizable Levels: Traders can set specific levels for more precise analysis.
//How It Works//
The script integrates these indicators through advanced algorithms, creating a synergistic effect that enhances market analysis. Here’s a detailed explanation of the underlying concepts and calculations:
WaveTrend Indicator:
Calculation: WaveTrend is based on the typical price (average of high, low, and close) smoothed over a specified channel length. WT1 and WT2 are derived from this typical price and further smoothed using the Average Channel Length. The difference between WT1 and WT2 indicates momentum, helping to identify cyclical market trends.
RSI (Relative Strength Index):
Calculation: RSI calculates the average gains and losses over a specified period to measure the speed and change of price movements. It oscillates between 0 and 100, with levels set to identify overbought (>70) and oversold (<30) conditions.
MoneyFlow Indicator:
Calculation: MoneyFlow is derived by multiplying price changes by volume and smoothing the results over specified periods. Fast MoneyFlow reacts quickly to price changes, while Slow MoneyFlow offers a broader view of capital movement trends.
Stochastic RSI:
Calculation: Stochastic RSI is computed by applying the Stochastic formula to RSI values, which highlights the RSI’s relative position within its range over a given period. This helps in identifying momentum shifts more precisely.
//How to Use the Script//
Display Settings:
Users can enable or disable various components like WaveTrend OB & OS levels, MoneyFlow plots, and divergence alerts through checkboxes.
Example: Turn on "Show Major Divergence" to see major bullish and bearish divergence signals directly on the chart.
Adjust Channel Settings:
Customize the data source, channel length, and smoothing periods in the "WaveTrend Channel SETTINGS" group.
Example: Set the "Channel Length" to 10 for a more responsive WaveTrend line or adjust the "Average Channel Length" to 21 for smoother trends.
Set Overbought & Oversold Levels:
Configure levels for WaveTrend, RSI, and Stochastic RSI in their respective settings groups.
Example: Set the WaveTrend Overbought Level to 60 and Oversold Level to -60 to define critical thresholds.
Money Flow Settings:
Adjust the periods and multipliers for Fast and Slow MoneyFlow indicators, and set their vertical positions for better visualization.
Example: Set the Fast Money Flow Period to 9 and Slow Money Flow Period to 12 to capture both short-term and long-term capital movements.
//Justification for Combining Indicators//
Enhanced Market Analysis:
Combining WaveTrend, RSI, and MoneyFlow provides a more comprehensive view of market conditions. Each indicator brings a unique perspective, making the analysis more robust.
WaveTrend identifies cyclical trends, RSI measures momentum, and MoneyFlow tracks capital movement. Together, they provide a multi-dimensional analysis of the market.
Improved Decision-Making:
By integrating these indicators, the script helps traders make more informed decisions. For example, a bullish divergence detected by WaveTrend might be validated by an RSI moving out of oversold territory and supported by increasing MoneyFlow.
Customization and Flexibility:
The script offers extensive customization options, allowing traders to tailor it to their specific needs and strategies. This flexibility makes it suitable for different trading styles and timeframes.
//Conclusion//
The indicator stands out due to its innovative combination of WaveTrend, RSI, and MoneyFlow indicators, offering a well-rounded tool for market analysis. By understanding how each component works and how they complement each other, traders can leverage this script to enhance their market analysis and trading strategies, making more informed and confident decisions.
Remember to always backtest the indicator first before implying it to your strategy.

Quantum Algo Matrix Quantum Algo Matrix
Multi-Layer Market Intelligence
🔹 Overview
Quantum Algo Matrix is a multi-dimensional market analysis system designed to identify high-probability reversal and continuation zones by combining momentum, volatility, trend structure, multi-timeframe correlation, and AI-based confirmation into a single, coherent framework.
Instead of relying on a single indicator, this script cross-validates signals across independent methodologies, significantly reducing noise and false positives.
It is best suited for active traders, swing traders, and systematic traders who value confirmation, structure, and context over single-trigger signals.
🧠 Core Components & How They Work Together
1️⃣ WaveTrend Engine (Market Structure & Extremes)
At the heart of the system lies a WaveTrend oscillator, which identifies overbought and oversold market conditions with multiple graded levels:
Level 1 (L1) → Primary extreme zones
Level 2 (L2) → Secondary confirmation zones
Level 0 (L0) → Extended exhaustion zones beyond normal extremes
Signals are only considered when WaveTrend momentum confirms a structural extreme, ensuring trades are taken where risk-reward is asymmetric, not mid-range.
Visual differentiation (lines, dots, and crosses) clearly communicates signal strength and hierarchy.
2️⃣ WVF – Volatility Reversal Detection
The WVF module tracks volatility expansion and contraction relative to historical extremes:
Identifies panic selling and emotional spikes
Uses percentile-based thresholds, not fixed values
Optional standard deviation & range filters reduce noise
WVF reversal signals are gated by WaveTrend zones, meaning volatility alone is never enough — price must also be in a statistically significant location.
This avoids the common pitfall of chasing volatility in trending or neutral conditions.
3️⃣ Squeeze Momentum (SQZ) – Pressure & Energy Release
The Squeeze Momentum module measures volatility compression vs expansion, highlighting when the market is:
Building pressure (compression)
Releasing energy (expansion)
Unlike traditional implementations, SQZ is scaled to the WaveTrend range, allowing it to visually integrate with the rest of the system.
The result is a clear momentum context that confirms whether a signal occurs:
Into expansion (higher probability)
Or during decay (lower probability)
4️⃣ Multi-Timeframe Correlation (MTF Filter)
One of the most powerful features of Quantum Algo Matrix is its Multi-Timeframe WaveTrend Correlation Filter.
When enabled, the script checks WaveTrend conditions across multiple higher timeframes (user-selectable):
45m
60m
120m
(optional lower / higher frames)
A signal is only validated when current timeframe conditions align with higher-timeframe momentum, ensuring:
Trades are with the broader market context
Lower-timeframe noise is filtered out
Counter-trend signals are reduced
This is especially effective in volatile or choppy markets.
5️⃣ AI SuperTrend Clustering (Advanced Confirmation Layer)
The AI module introduces a machine-learning-inspired clustering approach:
Multiple SuperTrend variations are generated
Their behavior is clustered using K-means logic
Bullish, bearish, and neutral consensus streams are extracted
Output is normalized and scaled to the WaveTrend environment
Rather than predicting price, the AI acts as a confidence validator:
Confirms strength
Filters weak setups
Prevents entries during indecision
This layer dramatically improves signal quality consistency, especially during transitions and regime changes.
🎯 Final Signal Logic (Why It’s Accurate)
A final LONG or SHORT signal is only produced when:
✔ WaveTrend confirms a valid extreme
✔ Volatility (WVF) shows a qualified reversal or memory condition
✔ Momentum (SQZ) supports expansion or pressure release
✔ Multi-Timeframe structure is aligned (optional)
✔ AI consensus confirms directional confidence (optional)
Because each component is independent, the probability of random alignment is low — this is what makes the system robust and statistically sound.
🧩 Customization & Flexibility
Every module can be enabled or disabled
Visuals are clean and user-controlled
Works on all markets (crypto, forex, indices, stocks)
Optimized for intraday to swing timeframes
No repainting logic in signal generation
⚠️ Important Notes
This script is a decision-support system, not a prediction tool.
It is designed to help traders identify high-quality opportunities, manage risk more effectively, and avoid emotional trading.
Always combine with:
Proper risk management
Market structure awareness
Personal trading rules
⭐ Summary
Quantum Algo Matrix is not a single indicator —
it is a complete market intelligence framework.
By blending structure, volatility, momentum, correlation, and AI-based confirmation, it delivers clearer signals, fewer false positives, and stronger contextual awareness across all timeframes.

OBV WaveTrend FlowOBV WaveTrend Pressure — A Volume-Powered Momentum Oscillator
OBV WaveTrend Pressure combines Hybrid OBV (volume × price delta) with the classic LazyBear WaveTrend framework to create a volume-weighted momentum oscillator that highlights real buying/selling pressure before price reacts.
While standard WaveTrend uses price averages alone, this tool feeds a cumulative hybrid OBV source into WT1/WT2, producing a much more sensitive, order-flow-aware momentum signal. The result is a clean, MACD-style histogram built from the slope of WT1, revealing when volume-backed momentum flips from bullish to bearish and vice-versa.
This is designed as a companion to volatility tools (e.g., TTM Squeeze, SQZMOM) and standard price-based WaveTrend indicators.
⸻
Features
1. Hybrid OBV Source (Vol × ΔPrice)
Captures true directional volume pressure, giving earlier and more reliable inflection points than price-based oscillators.
2. WaveTrend Applied to OBV
Applies LazyBear’s WT logic to a volume-driven source:
• WT1 (fast)
• WT2 (signal)
• Optional slope-aware color themes
3. MACD-Style Pressure Histogram
Shows momentum contraction/expansion clearly:
• Bright green/blue → Strong bull pressure
• Pale green/blue → Weakening bull
• Bright red → Strong bear pressure
• Pale red → Weakening bear
4. Dynamic OB/OS Bands
Adaptive overbought/oversold computed from:
• Rolling mean of WT1
• Rolling standard deviation
Helps identify exhaustion relative to market conditions, not fixed numbers.
5. Zero-Line Momentum Flips (with alerts)
Alerts fire when:
• WT1 slope crosses above zero → Bull momentum shift
• WT1 slope crosses below zero → Bear momentum shift
6. Optional Price Bar Coloring
Mirror the histogram state onto price bars for fast visual bias confirmation.
⸻
How to Use
Bullish Signals
• Histogram flips positive
• WT1 rising
• WT1 or WT2 near dynamic oversold zone
• Useful for positioning early in momentum cycles
Bearish Signals
• Histogram flips negative
• WT1 falling
• WT1 or WT2 near dynamic overbought zone
Best Applications
• Trend continuation entries
• Confirming TTM squeeze setups
• Early identification of pressure reversals
• Pairing with price-based WaveTrend for dual confirmation
⸻
Why It Works
WaveTrend is already one of the most reliable oscillators for structure and reversals — but this version feeds it volume pressure instead of price.
Volume often shifts before candles do, making this a leading indicator in many cases.

[AU] Waves+ Waves+ v0R7b
Plus version of Waves with components from both Waves Advanced and Mnemosyne. Essentially, Waves+ is highly configurable hybrid wavetrend oscillator and Fibonacci oscillator.
Slow wavetrend component replaced by Follower/Base from Mnemosyne indicator
TTM Squeeze Loose/Strict + Explosion Zones now enabled by default
Extreme Caution Fast Wavetrend Line, Fast wavetrend and Extreme Caution Fast WT cross signal now available
Disabled/removed to speed up script performance and load time: Divergence component, stoch k crossovers, T1 signals. Draw objects reduced from 89 to 64 to conform to Pinescript v4 requirements.
Large inactive code blocks stripped/removed to speed up performance and load time

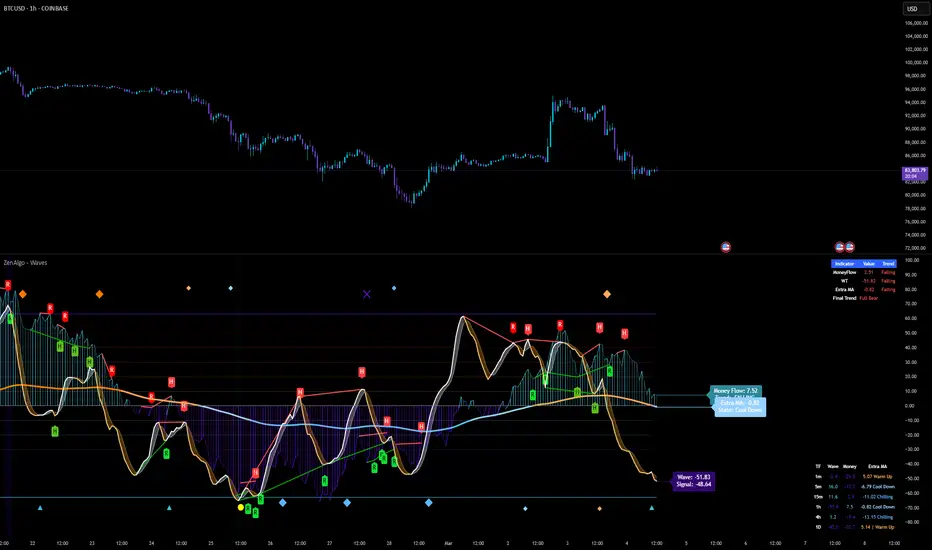
ZenAlgo - WavesZenAlgo - Waves is an advanced technical analysis indicator designed to refine trading decisions through a unique combination of multiple methodologies. By integrating Wave-like oscilator, RSI+MFI, and a dynamic Extra Moving Average (MA), it provides a structured approach to trend analysis and momentum detection. Unlike standalone indicators, this tool synchronizes multiple perspectives to provide holistic view and reduce noise.
Purpose and Justification for Integration
ZenAlgo - Waves strategically integrates multiple methodologies to provide trend validation. This indicator goes beyond standalone calculations by layering:
Original Wave Oscillator: Used to detect market momentum shifts and overbought/oversold conditions, further filtered by additional trend confirmation layers.
RSI + MFI Fusion: Introduces price-volume relationship validation, reducing misleading momentum reading.
Dynamic Extra Moving Average (MA): Acts as an adaptive trend filter, ensuring signals align with prevailing market direction rather than reacting to noise.
Divergence Detection: Contextualized divergence detection for both Wave and RSI+MFI.
Multi-Timeframe Trend Table: Facilitates confirmation across different timeframes, helping traders validate trade setups.
Attribution & Originality
ZenAlgo - Waves is an independently developed indicator that builds upon well-known technical analysis techniques while introducing significant enhancements. Unlike traditional WaveTrend indicator, it replaces the fixed constants of the original WaveTrend approach with a dynamic formula based on standard deviation , allowing for more adaptive and responsive calculations.
Additionally, this script integrates Ehlers' Super Smoother Filter , a highly regarded smoothing technique pioneered by John F. Ehlers and freely available for public use. Beyond these foundations, ZenAlgo - Waves incorporates proprietary logic and unique enhancements, setting it apart from conventional alternatives.
If you're seeking an exact replication of WaveTrend, please note that this indicator follows a distinct methodology, producing different calculations and outputs.
How to Use
Identify Key Zones: Observe Wave oscillator values to detect potential overbought and oversold conditions, which may vary based on settings.
Check RSI+MFI Histogram: Confirm momentum strength—bullish (increasing green bars) or bearish (increasing red bars).
Assess Trend via Extra MA: Use the Extra Moving Average to determine overall trend direction.
Look for Divergences: Identify divergences between price action and Wave/RSI+MFI for potential reversals.
Monitor Multi-Timeframe Trend Table: Check for alignment across timeframes for additional confirmation.
Set Alerts for Key Conditions: Configure alerts for Wave crossovers, divergences, and Extra MA state changes.
Analyze Conditions Before Making Decisions: The indicator does not execute trades. Traders should use it as a confirmation tool alongside a broader strategy.
Detailed Explanation of Calculation Logic
ZenAlgo - Waves builds on established wave-based oscillator principles, fine-tuning them for greater adaptability:
Baseline & Difference: Computes a smoothed average of the price source (e.g., HLC3) and measures the difference (or "deviation") between the current price and this baseline.
Volatility Scaling: Uses standard deviation to capture market volatility instead of relying on a static multiplier.
Normalization & Smoothing: Processes the resulting ratio into an oscillator, helping identify overbought and oversold zones. Optionally applies a secondary smoothing pass (including Ehlers' Super Smoother - SMMA) to reduce noise while preserving trend structure.
RSI + MFI Integration: Fuses RSI and MFI into a single composite metric, weighting RSI momentum with volume-adjusted MFI values for a clearer representation of momentum strength.
Extra Moving Average Filtering: A variety of moving average types (EMA, Hull, ZEMA, etc.) smooth the underlying trend, with sensitivity to trend changes customizable.
Divergence Detection: Identifies both regular and hidden divergences by comparing oscillator movements against price action, adjusting dynamically based on historical volatility.
Multi-Timeframe Trend Confirmation: Aggregates data across multiple timeframes (e.g., 1m, 5m, 15m, 1h) to provide a broader market context.
Alerts and Key Conditions: Alerts can be configured for specific conditions such as Wave crossovers, RSI+MFI confirmation, or Extra MA transitions. These alerts serve as notifications, not as automatic trading signals.
Why It’s Worth Paying For
ZenAlgo - Waves differentiates itself from free indicators by providing:
Contextual Signal Filtering: Integrates price-volume analysis and trend alignment checks.
Adaptive Trend Classification: Dynamically adjusts to market conditions.
Multi-Layer Confirmation: Requires momentum, volume, and trend agreement before providing insights.
Advanced Divergence Detection: Filters out noise-based divergences, highlighting only significant price-action-driven reversals.
Multi-Timeframe Validation: Helps ensure that observed trends are consistent across different timeframes.
Considerations for Use:
During periods of low trading volume, as price action lacks conviction.
In highly volatile market conditions, rapid price swings can introduce uncertainty.
Fundamental news events can override technical patterns.
If trends contradict across multiple timeframes, additional confirmation is recommended before making decisions.
Important Notes
This indicator is a tool for technical analysis and does not guarantee trading success.
Best Practices: Use ZenAlgo - Waves in conjunction with other indicators and fundamental analysis for a well-rounded approach.
Long Elite Squeeze (LES) — H.H 22 Lindsay (AI)LES (Long Elite Squeeze)
LES (Long Elite Squeeze) is a trading framework designed to capture the highest-probability long setups. It’s not just another signal script — it’s a structured system built to filter noise, manage risk, and keep you aligned with real momentum.
🔹 Core Logic
Breakout Confirmation – Ensures moves have structure, not just random spikes.
Relative Volume (RVOL) – Confirms participation and fuel behind the move.
RSI Alignment – Avoids overextended traps and fakeouts.
Squeeze Momentum – The backbone of LES. Signals fire only after a defined squeeze pattern shift (6+ dark green bars followed by a light green bar).
🔹 Trade Management Built In
Automated Sell Signals – Trigger on either:
2 consecutive dark green bars on Squeeze Momentum
WaveTrend cross down
(only valid after a Buy signal — no random shorts)
HUD Entry Checklist – Live conditions shown on chart.
Status Tracker HUD – Flips between “Waiting for Entry” and “In Trade” for clear context.
🔹 Flexibility
3 switchable squeeze versions (V1, V2, V3) for different market conditions.
Customizable EMA & ATR settings (with color options).
Session-aware logic — filter signals to prime trading hours.
🔹 Blueprint & Credits
LES is a fusion of proven concepts, standing on the shoulders of respected creators:
-Squeeze Momentum – LazyBear
-WaveTrend Oscillator – LazyBear
-Relative Volume – LonesomeTheBlue
Breakout/structural logic – refined from classic frameworks
Their work laid the foundation — LES expands and integrates them into a complete trading system.
⚡ Why LES Stands Out
LES wasn’t coded overnight. It’s the result of countless hours of live testing, rebuilding, and refining. Every feature earned its place by proving value in real trading, not theory.
LES is more than an indicator. It’s a disciplined framework — crafted to turn chaos into structure, randomness into probability, and noise into clarity.
⚠️ Disclaimer: This is a trading framework, not financial advice. Performance depends on trader discipline, risk management, and market conditions.

Trend MasterThis is a trend aggregator for confirmation and trend signals. It basically aggregates many buy/sell signals and confirmation and by combining them provides a strong buy/sell signal or trend confirmation.
The actual layout idea and trend confirmation is derived from Trend Meter and this indicator uses few other indicator, such as Chandelier Exit, WaveTrend, QQE Signals, Parabolic SAR and AlphaTrend. This indicator aggregates signal from different methods to find out more powerful and confirmed Trend and combines them into one Signal. It also uses Technical Ratings from TradingView team to filter out false signal, it tremendously opts out false signals and improve profitability.
The first seven dots are these
All 3 Trend Meters Now Align
MACD Crossover - Fast - 8, 21, 5
RSI 13: > or < 50
RSI 5: > or < 50
MA Crossover
MA Crossover
Chaikin Money Flow
Alphatrend
Technical Ratings
Then trend
Chandelier Exit
WaveTrend
QQE Signals
Parabolic Sar
All 3 Trend Meters aligns and A signal from trend i
Instructions
Change buy/sell policy based on market trend
Works on all TimeFrame but gives more accuracy on 4H, 1D.
Buy when green big dot appears at the bottom.
Sell when red big dot appears at the bottom.
Red/green dot at the top line appears when three trend meter is aligned and this is a good confirmation.
Any red/green dot below horizontal bars are trend signals.
Big red/green got at the bottom appears whenever there's a good confirmation from trend meter and a buy/sell signal comes from any trend signals.
Also look on the technical ratings bar, green means buy, red means sell and yellow means neutral.
Look for Support or Resistance Levels for price to be attracted to.
Find confluence with other indicators.
The more Trend meters are lit up the better.
Alert
01 Buy Signal = Strong Buy Signal
02 Sell Signal = Strong Sell Signal
03 Buy Signal = Strong Buy Signal
04 Sell Signal = Strong Sell Signal
Thanks to TradingView Technical Ratings authors, evergot, Lij_MC, KivancOzbilgic for their work. This indicator was heavily inspired from their work.

ProProfits LongStrategy made ready for automated trading based on Wavetrend/VWAP/RSI.
Whenever a 18 minute timeframe wave reaches below -60 is followed by a 3 minute timeframe VWAP cross up, a long signal will be given.
Once an RSI cross on the 10 minute timeframe above 60 is followed by a red dot on the momentum waves on the 1 minute timeframe, a Take Profit signal will be given.
The timeframes are adjustable in the settings interface, so this automated strategy can be used with any timeframe combination for the Wavetrend/VWAP/RSI.
Always make sure to view the chart from the lowest timeframe you're using.

Binary ComboThis script combines Stochastic Divergence and WaveTrend Crosses.
Stochastic Divergence may be useful for seeing a shift in momentum before the price action reflects it.
WaveTrend gives us context to the short term trend.
You can combine these together to find good entries.
