Volume ⨃ αMomentum 🦝🦾First attempt playing around with mixing volume and momentum... I find it to be nonsense, but putting it up for the moment.
Pesquisar nos scripts por "Volume"

Volume with directionOscillator plots cumulative volume with direction defined by price (positive price change = positive volume and vice versa) divided by volume sma.
It is good for divergence indication and can be used for trend change prediction.
It is faster then stoch with the same length.

Volume SpikeDetect current bar's volume is at least Ratio times than average volume of previous "Look back" bars.

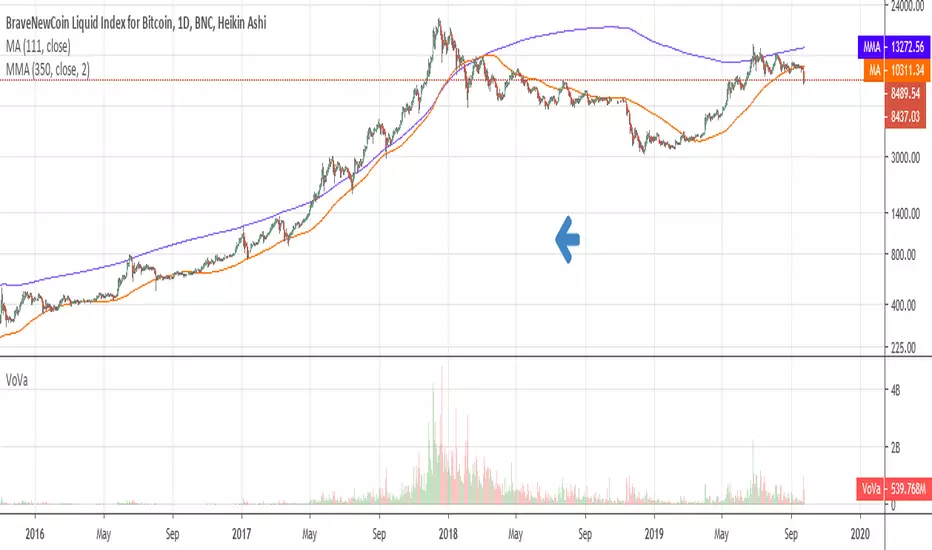
Volume ValueInstead of the Volume this plots the closure price times volume, hence the Value.
Useful in study of long term phenomenons.
Volume @PuppyTherapyWell, you know what its Volume but I don't color it based on price but it just stays grey the moment it reaches a critical threshold level it is orange and spikes are very much red.
You can also set alerts on those spikes to make sure you are not missing the action.

Volume Flow v3DepthHouse Volume Flow indicator is used to help determine trend direction strictly based on Negative and Positive volume data.
How to Read:
- Moving Average crossovers are used to help determine a possible trend change or retracement.
- The area cloud on the bottom is calculated by the difference of the moving averages. This could be used to help determine the trending volume strength.
- Bright colored volume bars are large volume spikes calculated by the x factor in the options.
Other changes:
- DepthHouse is going open source with numerous of its indicators. This is only one of many!
- Volume is now displayed without being altered for calculations.


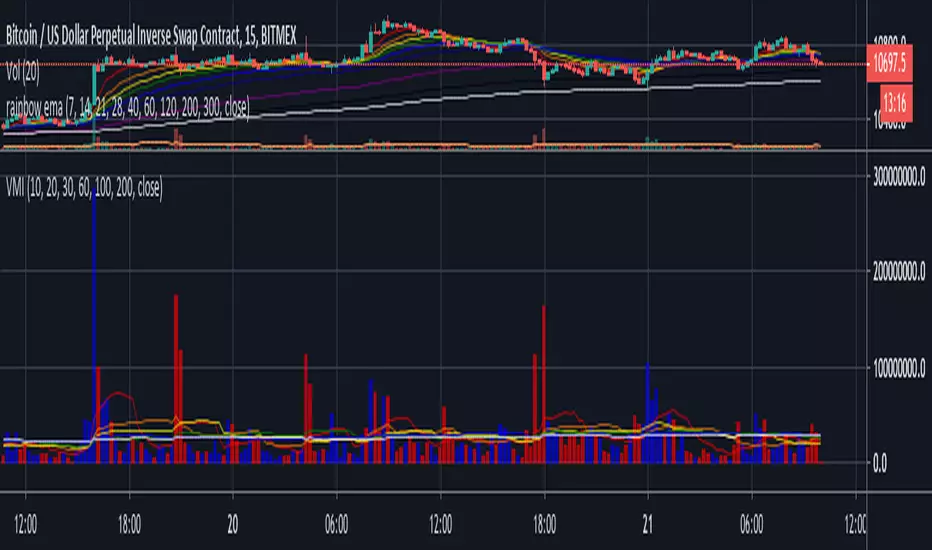
Volume moving indicatorHi guys,
This is a multiple Volume MA script. Editing is free for use.
You can use several ma lines by adding one indicator only, and I put 10,20,30,60,100,200 as a threshold which I frequently use.
It is made as an open source at any time possible, so that you are free for playing with it. Even you can add more if you are keen to do so.
Cheers,
JB
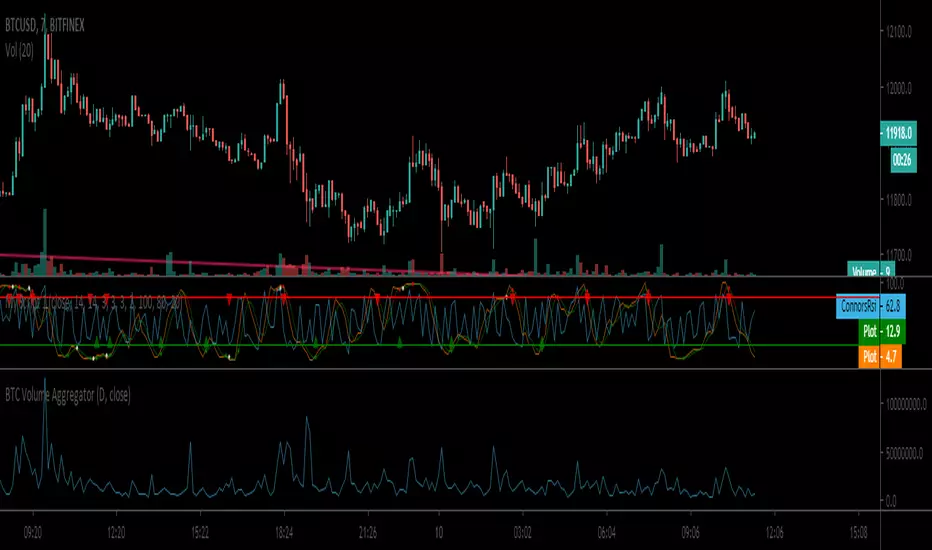
BTC Volume Aggregator"Volume Aggregator" indicator gathering the volume data from usd markets usdt markets and contracts. I will expand is euro, Korean and china pairs.
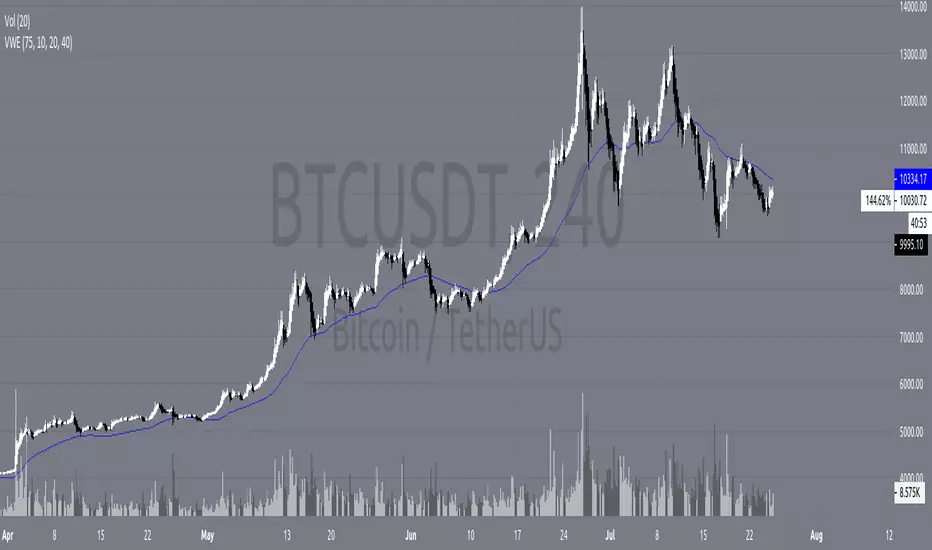
Volume Weighted EMAAn EMA using the Volume Oscillator to integrate volume fluctuations into the EMA calculations.
Especially useful for Crypto and Forex
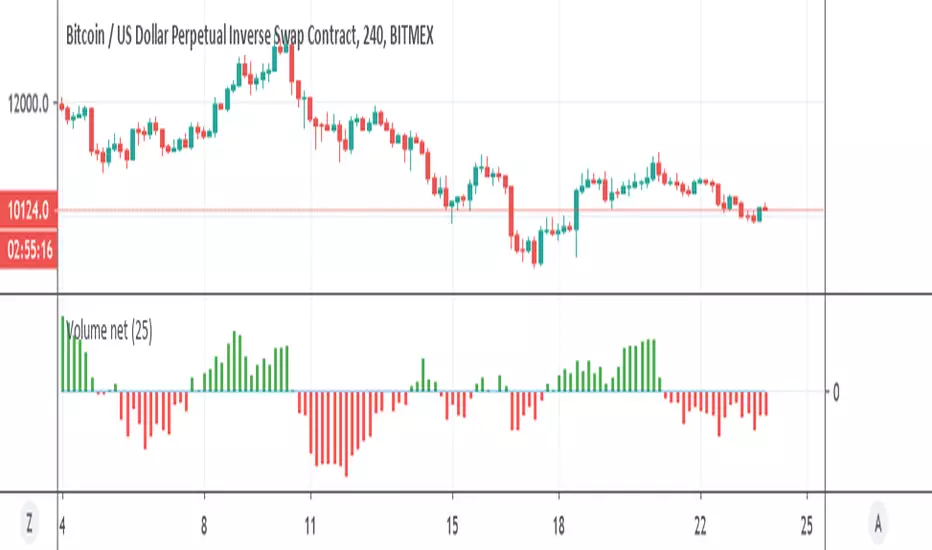
Volume net histogramNice histogram in order to calculate net volume
green =above 0 so bullish
red=bellow zero so bearish
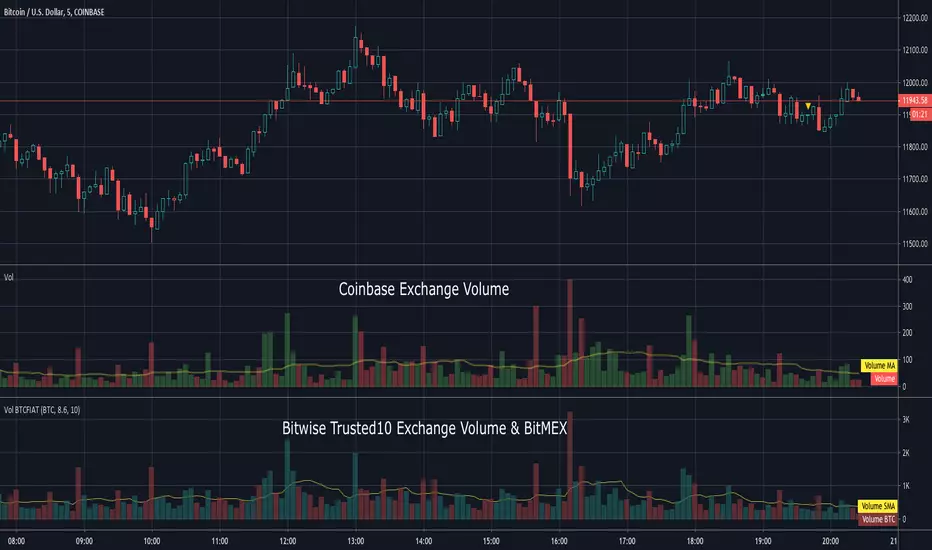
Volume BTCFIATThis indicator shows the aggregated volume of BTCFIAT of the Bitwise "Trusted 10" Exchanges that are available on TradingView.
I did not include every currency or stable coin available on these exchanges due to some being inconsequential in volume .
I also included option to show BitMEX deleveraged amount. Recent report suggests average leverage used there is 8.6X.
Volume can be shown in BTC or USD amounts. The moving average can be adjusted and if set to 0 will hide it.
Due to the number of lookups please be patient while loading. It will take a moment to display.
To load search Indicators for "Volume BTCFIAT" and click to load.
This indicator does not require access from me.
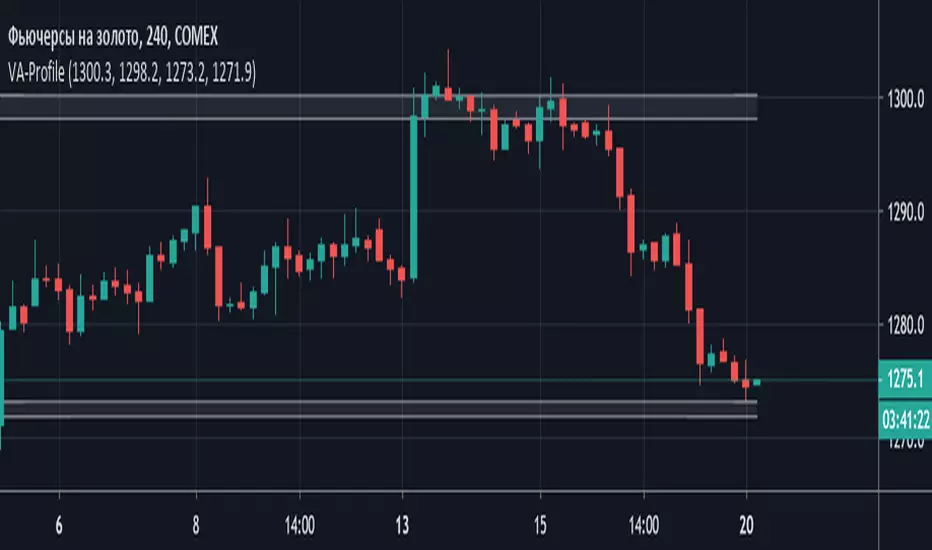
Volume Area Profile (Индикатор горизонтальных объемов)Volume Area Profile (Индикатор горизонтальных объемов)
Данные введены для графика GC!- Futures Gold - Дата: 20 мая 2019
Индикатор интегрирует данные полученные Вами после анализа кластерного графика объемов цены и строит зоны профиля объемных уровней поддержки и сопротивления
Необходимо отредактировать входные параметры:
Resistance_max - верхняя граница зоны сопротивления
Resistance_min - нижняя граница зоны сопротивления
Support_max - верхняя граница зоны поддержки
Support_min - нижняя граница зоны поддержки
Volume Weighted Price Over A Moving 60 Bar Window// By S.Black
// 4/24/2019
// Pine on TradingView.com
//
// This plot takes a simple 60 bar window
// For each bar in the window 3 things are plotted:
// 1.) The volume-weighted average, each bar's volumne * price summed, then divided by total volume
// 2.) The simple 60 bar average (not weighted)
// 3.) The close price (for reference)
//
// Green is used when the weighted price is above the average
// This is meant to indicate that actually, by volume the stock may be worth more that it is currently trading at.
// I made a new script was because I didn't see one that had a rolling hour window.


Volume/$ - Color Trend BarsThis is the volume script I use on all my charts. The idea is to emphasize trend bars with green and red.
Highish volume doji bars are colored yellow to point out range compression churn areas which can often be the turning point of a trend.


Volume Weighted MomentumVolume Weighted Momentum
Similar to the awesome oscilator but uses volume weighted averages instead of simple moving averages. This should help to build a more accurate picture over the AO version

Volume Based S/RI got a question if it would be possible to Automatically draw S/R levels based on Volume rather than RSI as I had earlier done in this script;
Well it certainly is and it looks as though it might even be tradeable.
The indicator compares the size of volume bars so that if there is a noticeable increase in volume (noticeable here meaning above the indicator threshold) it marks the bar high and low prior to the bigger volume candle.

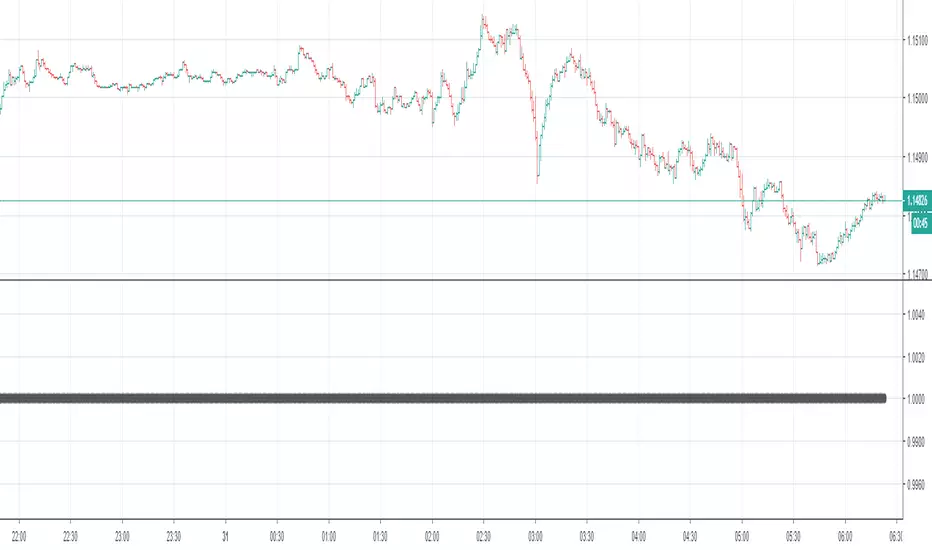
Volume Warning, Wyckoff Trend Tracking Trading SystemVolume Warning by Wyckoff Trend Tracking Trading System
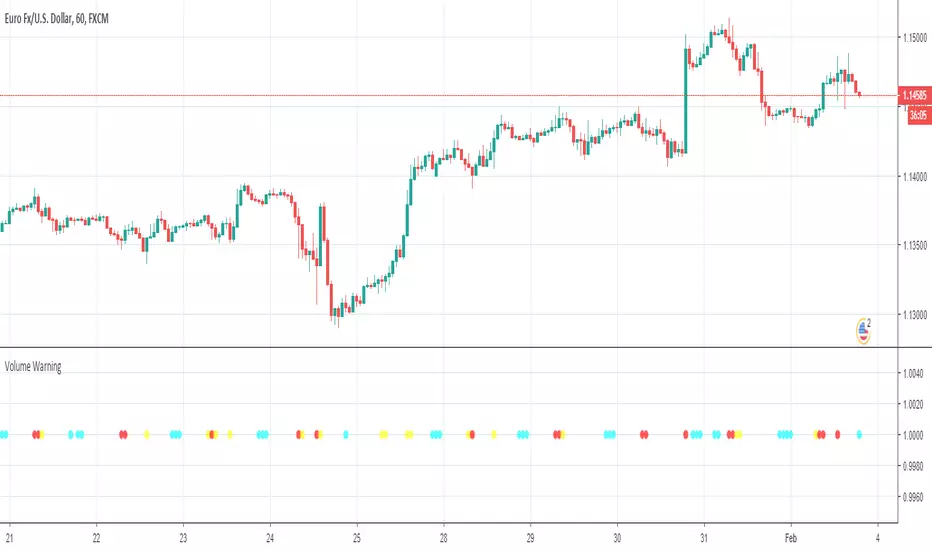
Volume Warning, Wyckoff Trend Tracking Trading SystemVolume Warning by Wyckoff Trend Tracking Trading System
BTC Dollar VolumeVolume conversion indicator for coins traded to USD value. Does not work on exchanges with dollar volume already displayed. Will be updated with new features.

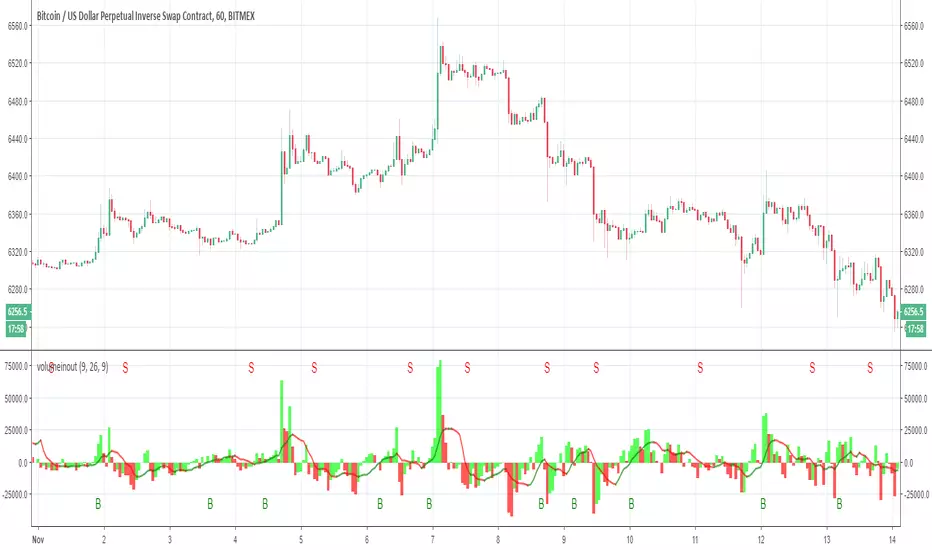
Volume in out as MACD with alerts Lets make the Volume in out as MACD
with alerts (B =buy) S=sell
have fun