Casa_VolumeProfileSessionLibrary "Casa_VolumeProfileSession"
Analyzes price and volume during regular trading hours to provide a session volume profile,
including Point of Control (POC), Value Area High (VAH), and Value Area Low (VAL).
Calculates and displays these levels historically and for the developing session.
Offers customizable visualization options for the Value Area, POC, histogram, and labels.
Uses lower timeframe data for increased accuracy and supports futures sessions.
The number of rows used for the volume profile can be fixed or dynamically calculated based on the session's price range and the instrument's minimum tick increment, providing optimal resolution.
calculateEffectiveRows(configuredRows, dayHigh, dayLow)
Determines the optimal number of rows for the volume profile, either using the configured value or calculating dynamically based on price range and tick size
Parameters:
configuredRows (int) : User-specified number of rows (0 means auto-calculate)
dayHigh (float) : Highest price of the session
dayLow (float) : Lowest price of the session
Returns: The number of rows to use for the volume profile
debug(vp, position)
Helper function to write some information about the supplied SVP object to the screen in a table.
Parameters:
vp (Object) : The SVP object to debug
position (string) : The position.* to place the table. Defaults to position.bottom_center
getLowerTimeframe()
Depending on the timeframe of the chart, determines a lower timeframe to grab volume data from for the analysis
Returns: The timeframe string to fetch volume for
get(volumeProfile, lowerTimeframeHigh, lowerTimeframeLow, lowerTimeframeVolume, lowerTimeframeTime, lowerTimeframeSessionIsMarket)
Populated the provided SessionVolumeProfile object with vp data on the session.
Parameters:
volumeProfile (Object) : The SessionVolumeProfile object to populate
lowerTimeframeHigh (array) : The lower timeframe high values
lowerTimeframeLow (array) : The lower timeframe low values
lowerTimeframeVolume (array) : The lower timeframe volume values
lowerTimeframeTime (array) : The lower timeframe time values
lowerTimeframeSessionIsMarket (array) : The lower timeframe session.ismarket values (that are futures-friendly)
drawPriorValueAreas(todaySessionVolumeProfile, extendYesterdayOverToday, showLabels, labelSize, pocColor, pocStyle, pocWidth, vahlColor, vahlStyle, vahlWidth, vaColor)
Given a SessionVolumeProfile Object, will render the historical value areas for that object.
Parameters:
todaySessionVolumeProfile (Object) : The SessionVolumeProfile Object to draw
extendYesterdayOverToday (bool) : Defaults to true
showLabels (bool) : Defaults to true
labelSize (string) : Defaults to size.small
pocColor (color) : Defaults to #e500a4
pocStyle (string) : Defaults to line.style_solid
pocWidth (int) : Defaults to 1
vahlColor (color) : The color of the value area high/low lines. Defaults to #1592e6
vahlStyle (string) : The style of the value area high/low lines. Defaults to line.style_solid
vahlWidth (int) : The width of the value area high/low lines. Defaults to 1
vaColor (color) : The color of the value area background. Defaults to #00bbf911)
drawHistogram(volumeProfile, bgColor, showVolumeOnHistogram)
Given a SessionVolumeProfile object, will render the histogram for that object.
Parameters:
volumeProfile (Object) : The SessionVolumeProfile object to draw
bgColor (color) : The baseline color to use for the histogram. Defaults to #00bbf9
showVolumeOnHistogram (bool) : Show the volume amount on the histogram bars. Defaults to false.
Object
Object Contains all settings and calculated values for a Volume Profile Session analysis
Fields:
numberOfRows (series int) : Number of price levels to divide the range into. If set to 0, auto-calculates based on price range and tick size
valueAreaCoverage (series int) : Percentage of total volume to include in the Value Area (default 70%)
trackDevelopingVa (series bool) : Whether to calculate and display the Value Area as it develops during the session
valueAreaHigh (series float) : Upper boundary of the Value Area - price level containing specified % of volume
pointOfControl (series float) : Price level with the highest volume concentration
valueAreaLow (series float) : Lower boundary of the Value Area
startTime (series int) : Session start time in Unix timestamp format
endTime (series int) : Session end time in Unix timestamp format
dayHigh (series float) : Highest price of the session
dayLow (series float) : Lowest price of the session
step (series float) : Size of each price row (calculated as price range divided by number of rows)
pointOfControlLevel (series int) : Index of the row containing the Point of Control
valueAreaHighLevel (series int) : Index of the row containing the Value Area High
valueAreaLowLevel (series int) : Index of the row containing the Value Area Low
lastTime (series int) : Tracks the most recent timestamp processed
volumeRows (map) : Stores volume data for each price level row (key=row number, value=volume)
ltfSessionHighs (array) : Stores high prices from lower timeframe data
ltfSessionLows (array) : Stores low prices from lower timeframe data
ltfSessionVols (array) : Stores volume data from lower timeframe data
Pesquisar nos scripts por "Volume Profile"

Lockin Strength Indicator (LSI)How It Works:
RSI Calculation: The standard RSI is calculated using a 14-period by default.
Volume Weighting: If enabled, the LSI modifies the RSI by weighting it based on the volume relative to its moving average. This emphasizes periods of high or low volume, which can be particularly useful for Solana-based assets that might have unique volume profiles.
Plotting: The LSI is plotted with standard overbought and oversold levels, and background highlighting makes these areas visually distinct.
Customization:
RSI Length: You can adjust the length of the RSI period.
Overbought/Oversold Levels: You can modify the levels for overbought and oversold signals.
Volume Weighting: You can toggle volume weighting on or off.
This indicator is designed to give you a more nuanced view of Solana cryptocurrencies by combining RSI with volume dynamics.

Volume Forks [Trendoscope]🎲 Volume Forks - Advanced Price Analysis with Recursive Auto-Pitchfork and Angled Volume Profile
The Volume Forks Indicator is a comprehensive research tool that combines two innovative techniques, Recursive Auto-Pitchfork and Angled Volume Profile . This indicator provides traders with valuable insights into price dynamics by integrating accurate pitchfork drawing and volume analysis over angled levels. The indicator does following things
Detects Pitchfork formations automatically on the chart over Recursive Zigzag
Instead of drawing forks based on fib levels, volume distribution over ABC of pitchfork is calculated and drawn in the direction of the handle.
🎲 Brief about Pitchfork
Pitchfork is drawn when price forms ABC pattern. Pitchfork draws a series of parallel lines in the direction of trend which can be used for support and resistance.
There are many methods of drawing pitchfork. In all cases, a line joining BC will make the base of pitchfork and fork lines are drawn from different points of the base. All the fork lines will be parallel. But, the handle of the base defines the direction of fork lines. Classification of pitchfork is mainly based on the starting and ending points of the handle.
🎲 Regular Types
Here, end of the handle is always fixed and it will be the mid point of B and C.
🎯 Andrews Pitchfork
Handle starts from A and joins the base at mid of B and C.
Forks are drawn based on fib ratios from the handle
🎯 Schiff Pitchfork
Handle starts from Bar of A and price of middle of AB and joins the base at mid of B and C
Forks are drawn based on fib ratios from the handle
🎯 Modified Schiff Pitchfork
Handle starts from mid of A and B and joins the base at mid of B and C
Forks are drawn based on fib ratios from the handle
🎲 Inside Types
Here, C will act as end of the handle which joins the Base BC .
🎯 Andrews Pitchfork (Inside)
Handle starts from A and joins the base at C
Forks are drawn based on fib ratios from the handle
🎯 Schiff Pitchfork (Inside)
Handle starts from Bar of A and price of (A+B)/2 and joins the base at C
Forks are drawn based on fib ratios from the handle
🎯 Modified Schiff Pitchfork (Inside)
Handle starts from mid of A and B and joins the base at C
Forks are drawn based on fib ratios from the handle
🎲 Brief about Pitchfork
The Angled Volume Profile technique expands on the concept of volume profile by measuring volume distribution levels over angled levels rather than just horizontal levels. By selecting a starting point and angle interactively, traders can assess volume distribution within specific price trends. This feature is particularly useful for analysing volume dynamics in trending markets.
🎲 Settings
Indicator settings include few things which determine the scanning of pitchforks and few which determines drawing of volume profile lines.
Please note that, due to pine limitations of 500 lines, if there are too many formations on the chart, volume profile may not appear correctly. If that happens, please reduce the number of volume forks per formation.

Value Matrix – Previous Day VAValue Matrix – Previous Day Volume Profile Indicator
Description:
The Value Matrix – Previous Day VA indicator plots the previous trading session’s Volume Profile key levels directly on your chart, providing clear reference points for intraday trading. This indicator calculates the Value Area High (VAH), Value Area Low (VAL), and Point of Control (POC) from the prior session and projects them across the current trading day, helping traders identify potential support, resistance, and high-volume zones.
Features:
Calculates previous day VAH, VAL, and POC based on a user-defined session (default 09:30–16:00).
Uses Volume Profile bins for precise distribution calculation.
Fully customizable line colors for VAH, VAL, and POC.
Lines extend across the current session for easy intraday reference.
Works on any timeframe, optimized for 1-minute charts for precision.
Optional toggles to show/hide VAH, VAL, and POC individually.
Inputs:
Session Time: Define the trading session for which the volume profile is calculated.
Profile Bins: Number of price intervals used to divide the session range.
Value Area %: Percentage of volume to include in the value area (default 70%).
Show POC / VAH & VAL: Toggle visibility of each level.
Line Colors: Customize VAH, VAL, and POC colors.
Use Cases:
Identify previous session support and resistance levels for intraday trading.
Gauge areas of high liquidity and potential market reaction zones.
Combine with other indicators or price action strategies for improved entries and exits.
Recommended Timeframe:
Works on all timeframes; best used on 1-minute or 5-minute charts for precise intraday analysis.

Liquidity Spectrum Visualizer [BigBeluga]🔵 OVERVIEW
The Liquidity Spectrum Visualizer is a smart tool for exposing hidden liquidity zones by combining a dynamic volume profile, clear liquidity levels, and intuitive volume bubbles directly on your price chart. It shows you exactly where significant volume is clustering inside your chosen lookback period — highlighting where big market participants may be defending price or planning breakouts.
🔵 CONCEPTS
Volume Profile Bins: Breaks your custom lookback range into 100 fine price bins, calculating total volume per bin to create a precise vertical liquidity histogram.
Liquidity Levels: Bins with high relative volume automatically plot as horizontal lines — thicker and brighter lines signal stronger liquidity concentrations.
Dynamic Coloring: Profile bins and liquidity levels adjust their colors live based on whether current price is trading above (support) or below (resistance).
Volume Bubbles: Each candle displays a bubble at its HLC3 price —
- The bubble’s size shows relative candle volume.
- Its color gradient indicates bullish or bearish volume: greenish for bullish candles, orange for bearish.
Bubble Labels: The largest bubbles automatically label the actual volume amount, revealing big hidden flows.
Range Box High/Low: Marks the absolute swing high and low inside the lookback window, clearly framing the active liquidity zone.
🔵 FEATURES
Smart, auto-scaled volume profile up to 200 candles (or custom).
Liquidity levels with dynamic thickness and color based on real-time volume.
Bubbles sized and colored to show both volume magnitude and bullish/bearish bias.
Largest bubbles labeled for fast detection of high-impact bars.
High and low price labels clearly show the analyzed range.
Toggle Volume Profile, Liquidity Levels, and Bubbles independently.
🔵 HOW TO USE
Watch for thick, bright liquidity levels — these zones mark where large orders or stop clusters are likely hidden.
Use dynamic coloring: if price is above a level, it’s support; if below, it’s resistance.
Pay special attention to big bubbles: these mark sudden spikes in traded volume and can signal absorption, traps, breakouts or significant price levels.
Combine with your existing confluence tools to confirm breakouts or fakeouts around visible liquidity clusters.
🔵 CONCLUSION
The Liquidity Spectrum Visualizer transforms hidden order flow into an intuitive, color-coded map. You see at a glance where price is absorbing, consolidating, or ready to break — all powered by real-time volume behavior and smart visuals. It’s a must-have tool for traders who want to read liquidity and react ahead of the crowd.

Volume Weighted Regression ChannelThis indicator constructs a volume-weighted linear regression channel over a custom time range.
It’s conceptually similar to a Volume Profile, but instead of projecting horizontal value zones, it builds a tilted trend channel that reflects both price direction and volume concentration.
🧠 Core Features:
Volume-weighted points: Each candle contributes to the regression line proportionally to its volume — heavier candles shift the channel toward high-activity price zones.
Linear regression line: Shows the trend direction within the selected time interval.
±σ boundaries: Outer bands represent the standard deviation of price (also volume-weighted), highlighting statistical dispersion.
Fully customizable: Adjustable line styles, widths, and channel width (sigma multiplier).
Time window control: Select any start and end time to define the regression interval.
📊 Why use this instead of Volume Profile?
While Volume Profile shows horizontal distributions of traded volume, this indicator is ideal when:
You want to understand how volume clusters affect trend direction, not just price levels.
You're analyzing time-dependent flow rather than static price zones.
You're looking for a dynamic volume-adjusted channel that moves with the market's structure.
It’s especially useful in identifying volume-supported trends, hidden pullback zones, and statistical extremes.
⚙️ Notes:
Works on any timeframe and instrument.
Does not repaint.
Does not require volume profile data feeds — uses standard volume and hl2.
Order Block Matrix [Alpha Extract]The Order Block Matrix indicator identifies and visualizes key supply and demand zones on your chart, helping traders recognize potential reversal points and high-probability trading setups.
This tool helps traders:
Visualize key order blocks with volume profile histograms showing liquidity distribution.
Identify high-volume price levels where institutional activity occurs.
rank historical order blocks and analyze their strength based on volume.
Receive alerts for potential trading opportunities based on price-block interactions.
🔶 CALCULATION
The indicator processes chart data to identify and analyze order blocks:
Order Block Detection
Inputs:
Price action patterns (consolidation areas followed by breakouts).
Volume data from current and lower timeframes.
User-defined lookback periods and thresholds.
Detection Logic:
Identifies consolidation areas using a dynamic range comparison.
Confirms breakout patterns with percentage threshold validation.
Maps volume distribution across price levels within each order block.
🔶Volume Analysis
Volume Profiling:
Divides each order block into configurable grid segments.
Maps volume distribution across price segments within blocks.
Highlights zones with highest volume concentration.
Strength Assessment:
Calculates total block volume and relative strength metrics.
Compares block volume to historical averages.
Determines probability of reversal based on volume patterns.
isConsolidation(len) =>
high_range = ta.highest(high, len) - ta.lowest(high, len)
low_range = ta.highest(low, len) - ta.lowest(low, len)
avg_range = (high_range + low_range) / 2
current_range = high - low
current_range <= avg_range * (1 + obThreshold)
🔶 DETAILS
Visual Features
Volume Profile Histograms:
Color-coded bars showing volume concentration within order blocks.
Gradient coloring based on relative volume (high volume = brighter colors).
Bull blocks (green/teal) and bear blocks (red) with varying opacity.
Block Visualization:
Dynamic box sizing based on volume concentration.
Optional block borders and background fills.
Volume labels showing total block volume.
Screener Table:
Real-time analysis of order block metrics.
Shows block direction, proximity, retest count, and volume metrics.
Color-coded for quick reference.
Interpretation
High Volume Areas: Zones with institutional interest and potential reversal points.
Block Direction: Bullish blocks typically support price, bearish blocks typically resist price.
Retests: Multiple tests of an order block may strengthen or weaken its influence.
Block Age: Newer blocks often have stronger influence than older ones.
Volume Concentration: Brightest segments within blocks represent the highest volume areas.
🔶 EXAMPLES
The indicator helps identify key trading opportunities:
Bullish Order Blocks
Support Zones: Identify strong support levels where price is likely to bounce.
Breakout Confirmation: Validate breakouts with volume analysis to avoid false moves.
Retest Strategies: Enter trades when price retests a bullish order block with high volume.
Bearish Order Blocks
Resistance Zones: Identify strong resistance levels where price is likely to reverse.
Distribution Areas: Detect zones where smart money is distributing to retail.
Short Opportunities: Find optimal short entry points at high-volume bearish blocks.
Combined Strategies
Order Block Stacking: Multiple aligned blocks create stronger support/resistance zones.
Block Mitigation: When price breaks through a block, it often indicates a strong trend continuation.
Volume Profile Applications: Higher volume segments provide more precise entry and exit points.
🔶 SETTINGS
Customization Options
Order Block Detection:
Consolidation Lookback: Adjust the period for consolidation detection.
Breakout Threshold: Set minimum percentage for breakout confirmation.
Historical Lookback Limit: Control how far back to scan for historical order blocks.
Maximum Order Blocks: Limit the number of visible blocks on the chart.
Visual Style:
Grid Segments: Adjust the number of volume profile segments.
Extend Blocks to Right: Enable/disable extending blocks to current price.
Show Block Borders: Toggle border visibility.
Border Width: Adjust thickness of block borders.
Show Volume Text: Enable/disable volume labels.
Volume Text Position: Control placement of volume labels.
Color Settings:
Bullish High/Low Volume Colors: Customize appearance of bullish blocks.
Bearish High/Low Volume Colors: Customize appearance of bearish blocks.
Border Color: Set color for block outlines.
Background Fill: Adjust color and transparency of block backgrounds.
Volume Text Color: Customize label appearance.
Screener Table:
Show Screener Table: Toggle table visibility.
Table Position: Select positioning on the chart.
Table Size: Adjust display size.
The Order Block Matrix indicator provides traders with powerful insights into market structure, helping to identify key levels where smart money is active and where high-probability trading opportunities may exist.

Smart Range DetectorSmart Range Detector
What It Does
This indicator automatically detects and validates significant trading ranges using pivot point analysis combined with logarithmic fibonacci relationships. It operates by identifying specific pivot patterns (High-Low-High and Low-High-Low) that meet fibonacci validation criteria to filter out noise and highlight only the most reliable trading ranges. Each range is continuously monitored for potential mitigation (breakout) events.
Key Features
Identifies both High-Low-High and Low-High-Low range patterns
Validates each range using logarithmic fibonacci relationships (more accurate than linear fibs)
Detects range mitigations (breakouts) and visually differentiates them
Shows fibonacci levels within ranges (25%, 50%, 75%) for potential reversal points
Visualizes extension levels beyond ranges for breakout targets
Analyzes volume profile with customizable price divisions (default: 60)
Displays Point of Control (POC) and Value Area for traded volume analysis
Implements performance optimization with configurable range limits
Includes user-adjustable safety checks to prevent Pine Script limitations
Offers fully customizable colors, line widths, and transparency settings
How To Use It
Identify Valid Ranges : The indicator automatically detects and highlights trading ranges that meet fibonacci validation criteria
Monitor Fibonacci Levels : Watch for price reactions at internal fib levels (25%, 50%, 75%) for potential reversal opportunities
Track Extension Targets : Use the extension lines as potential targets when price breaks out of a range
Analyze Volume Structure : Enable the volume profile mode to see where most volume was traded within mitigated ranges
Trade Range Boundaries : Look for reactions at range highs/lows combined with volume POC for higher probability entries
Manage Performance : Adjust the maximum displayed ranges and history bars settings for optimal chart performance
Settings Guide
Left/Right Bars Look Back : Controls how far back the indicator looks to identify pivot points (higher values find more ranges but may reduce sensitivity)
Max History Bars : Limits how far back in history the indicator will analyze (stays within Pine Script's 10,000 bar limitation)
Max Ranges to Display : Restricts the total number of ranges kept in memory for improved performance (1-50)
Volume Profile : When enabled, shows volume distribution analysis for mitigated ranges
Volume Profile Divisions : Controls the granularity of the volume analysis (higher values show more detail)
Display Options : Toggle visibility of range lines, fibonacci levels, extension lines, and volume analysis elements
Transparency & Color Settings : Fully customize the visual appearance of all indicator elements
Line Width Settings : Adjust the thickness of lines for better visibility on different timeframes
Technical Details
The indicator uses logarithmic fibonacci calculations for more accurate price relationships
Volume profile analysis creates 60 price divisions by default (adjustable) for detailed volume distribution
All timestamps are properly converted to work with Pine Script's bar limitations
Safety checks prevent "array index out of bounds" errors that plague many complex indicators
Time-based coordinates are used instead of bar indices to prevent "bar index too far" errors
This indicator works well on all timeframes and instruments, but performs best on 5-minute to daily charts. Perfect for swing traders, range traders, and breakout strategists.
What Makes It Different
Most range indicators simply draw boxes based on recent highs and lows. Smart Range Detector validates each potential range using proven fibonacci relationships to filter out noise. It then adds sophisticated volume analysis to help traders identify the most significant price levels within each range. The performance optimization features ensure smooth operation even on lower timeframes and extended history analysis.

Volume Zones Internal Visualizer [LuxAlgo]The Volume Zones Internal Visualizer is an alternate candle type intended to reveal lower timeframe volume activity while on a higher timeframe chart.
It displays the candle's range, the highest and lowest zones of accumulated volume throughout the candle, and the Lower Timeframe (LTF) candle close, which contained the most volume in the session (Candle Session).
🔶 USAGE
The indicator is intended to be used as its own independent candle type. It is not a replacement for traditional candlesticks; however, it is recommended that you hide the chart's display when using this indicator. Another option is to display this indicator in an additional pane alongside the normal chart, as displayed above.
The display consists of candle ranges represented by outlined boxes, within the ranges you will notice a transparent-colored zone, a solid-colored zone, and a line.
Each of these displays different points of volume-related information from an analysis of LTF data.
In addition to this analysis, the indicator also locates the LTF candle with the highest volume, and displays its close represented by the line. This line is considered as the "Peak Activity Level" (PAL), since throughout the (HTF) candle session, this candle's close is the outcome of the most volume transacted at the time.
We are further tracking these PALs by continuing to extend them into the future, looking towards them for potential further interaction. Once a PAL is crossed, we are removing it from display as it has been mitigated.
🔶 DETAILS
The indicator aggregates the volume data from each LTF candle and creates a volume profile from it; the number of rows in the profile is determined by the "Row Size" setting.
With this profile, it locates and displays the highest (solid area) and lowest (transparent area) volume zones from the profile created.
🔶 SETTINGS
Row Size: Sets the number of rows used for the calculation of the volume profile based on LTF data.
Intrabar Timeframe: Sets the Lower Timeframe to use for calculations.
Show Last Unmitigated PALs: Choose how many Unmitigated PALs to extend.
Style: Toggle on and off features, as well as adjust colors for each.

Delta Volume Columns Pro [LucF]█ OVERVIEW
This indicator displays volume delta information calculated with intrabar inspection on historical bars, and feed updates when running in realtime. It is designed to run in a pane and can display either stacked buy/sell volume columns or a signal line which can be calculated and displayed in many different ways.
Five different models are offered to reveal different characteristics of the calculated volume delta information. Many options are offered to visualize the calculations, giving you much leeway in morphing the indicator's visuals to suit your needs. If you value delta volume information, I hope you will find the time required to master Delta Volume Columns Pro well worth the investment. I am confident that if you combine a proper understanding of the indicator's information with an intimate knowledge of the volume idiosyncrasies on the markets you trade, you can extract useful market intelligence using this tool.
█ WARNINGS
1. The indicator only works on markets where volume information is available,
Please validate that your symbol's feed carries volume information before asking me why the indicator doesn't plot values.
2. When you refresh your chart or re-execute the script on the chart, the indicator will repaint because elapsed realtime bars will then recalculate as historical bars.
3. Because the indicator uses different modes of calculation on historical and realtime bars, it's critical that you understand the differences between them. Details are provided further down.
4. Calculations using intrabar inspection on historical bars can only be done from some chart timeframes. See further down for a list of supported timeframes.
If the chart's timeframe is not supported, no historical volume delta will display.
█ CONCEPTS
Chart bars
Three different types of bars are used in charts:
1. Historical bars are bars that have already closed when the script executes on them.
2. The realtime bar is the current, incomplete bar where a script is running on an open market. There is only one active realtime bar on your chart at any given time.
The realtime bar is where alerts trigger.
3. Elapsed realtime bars are bars that were calculated when they were realtime bars but have since closed.
When a script re-executes on a chart because the browser tab is refreshed or some of its inputs are changed, elapsed realtime bars are recalculated as historical bars.
Why does this indicator use two modes of calculation?
Historical bars on TradingView charts contain OHLCV data only, which is insufficient to calculate volume delta on them with any level of precision. To mine more detailed information from those bars we look at intrabars , i.e., bars from a smaller timeframe (we call it the intrabar timeframe ) that are contained in one chart bar. If your chart Is running at 1D on a 24x7 market for example, most 1D chart bars will contain 24 underlying 1H bars in their dilation. On historical bars, this indicator looks at those intrabars to amass volume delta information. If the intrabar is up, its volume goes in the Buy bin, and inversely for the Sell bin. When price does not move on an intrabar, the polarity of the last known movement is used to determine in which bin its volume goes.
In realtime, we have access to price and volume change for each update of the chart. Because a 1D chart bar can be updated tens of thousands of times during the day, volume delta calculations on those updates is much more precise. This precision, however, comes at a price:
— The script must be running on the chart for it to keep calculating in realtime.
— If you refresh your chart you will lose all accumulated realtime calculations on elapsed realtime bars, and the realtime bar.
Elapsed realtime bars will recalculate as historical bars, i.e., using intrabar inspection, and the realtime bar's calculations will reset.
When the script recalculates elapsed realtime bars as historical bars, the values on those bars will change, which means the script repaints in those conditions.
— When the indicator first calculates on a chart containing an incomplete realtime bar, it will count ALL the existing volume on the bar as Buy or Sell volume,
depending on the polarity of the bar at that point. This will skew calculations for that first bar. Scripts have no access to the history of a realtime bar's previous updates,
and intrabar inspection cannot be used on realtime bars, so this is the only to go about this.
— Even if alerts only trigger upon confirmation of their conditions after the realtime bar closes, they are repainting alerts
because they would perhaps not have calculated the same way using intrabar inspection.
— On markets like stocks that often have different EOD and intraday feeds and volume information,
the volume's scale may not be the same for the realtime bar if your chart is at 1D, for example,
and the indicator is using an intraday timeframe to calculate on historical bars.
— Any chart timeframe can be used in realtime mode, but plots that include moving averages in their calculations may require many elapsed realtime bars before they can calculate.
You might prefer drastically reducing the periods of the moving averages, or using the volume columns mode, which displays instant values, instead of the line.
Volume Delta Balances
This indicator uses a variety of methods to evaluate five volume delta balances and derive other values from those balances. The five balances are:
1 — On Bar Balance : This is the only balance using instant values; it is simply the subtraction of the Sell volume from the Buy volume on the bar.
2 — Average Balance : Calculates a distinct EMA for both the Buy and Sell volumes, and subtracts the Sell EMA from the Buy EMA.
3 — Momentum Balance : Starts by calculating, separately for both Buy and Sell volumes, the difference between the same EMAs used in "Average Balance" and
an SMA of double the period used for the "Average Balance" EMAs. The difference for the Sell side is subtracted from the difference for the Buy side,
and an RSI of that value is calculated and brought over the −50/+50 scale.
4 — Relative Balance : The reference values used in the calculation are the Buy and Sell EMAs used in the "Average Balance".
From those, we calculate two intermediate values using how much the instant Buy and Sell volumes on the bar exceed their respective EMA — but with a twist.
If the bar's Buy volume does not exceed the EMA of Buy volume, a zero value is used. The same goes for the Sell volume with the EMA of Sell volume.
Once we have our two intermediate values for the Buy and Sell volumes exceeding their respective MA, we subtract them. The final "Relative Balance" value is an ALMA of that subtraction.
The rationale behind using zero values when the bar's Buy/Sell volume does not exceed its EMA is to only take into account the more significant volume.
If both instant volume values exceed their MA, then the difference between the two is the signal's value.
The signal is called "relative" because the intermediate values are the difference between the instant Buy/Sell volumes and their respective MA.
This balance flatlines when the bar's Buy/Sell volumes do not exceed their EMAs, which makes it useful to spot areas where trader interest dwindles, such as consolidations.
The smaller the period of the final value's ALMA, the more easily you will see the balance flatline. These flat zones should be considered no-trade zones.
5 — Percent Balance : This balance is the ALMA of the ratio of the "On Bar Balance" value, i.e., the volume delta balance on the bar (which can be positive or negative),
over the total volume for that bar.
From the balances and marker conditions, two more values are calculated:
1 — Marker Bias : It sums the up/down (+1/‒1) occurrences of the markers 1 to 4 over a period you define, so it ranges from −4 to +4, times the period.
Its calculation will depend on the modes used to calculate markers 3 and 4.
2 — Combined Balances : This is the sum of the bull/bear (+1/−1) states of each of the five balances, so it ranges from −5 to +5.
█ FEATURES
The indicator has two main modes of operation: Columns and Line .
Columns
• In Columns mode you can display stacked Buy/Sell volume columns.
• The buy section always appears above the centerline, the sell section below.
• The top and bottom sections can be colored independently using eight different methods.
• The EMAs of the Buy/Sell values can be displayed (these are the same EMAs used to calculate the "Average Balance").
Line
• Displays one of seven signals: the five balances or one of two complementary values, i.e., the "Marker Bias" or the "Combined Balances".
• You can color the line and its fill using independent calculation modes to pack more information in the display.
You can thus appraise the state of 3 different values using the line itself, its color and the color of its fill.
• A "Divergence Levels" feature will use the line to automatically draw expanding levels on divergence events.
Default settings
Using the indicator's default settings, this is the information displayed:
• The line is calculated on the "Average Balance".
• The line's color is determined by the bull/bear state of the "Percent Balance".
• The line's fill gradient is determined by the advances/declines of the "Momentum Balance".
• The orange divergence dots are calculated using discrepancies between the polarity of the "On Bar Balance" and the chart's bar.
• The divergence levels are determined using the line's level when a divergence occurs.
• The background's fill gradient is calculated on advances/declines of the "Marker Bias".
• The chart bars are colored using advances/declines of the "Relative Balance". Divergences are shown in orange.
• The intrabar timeframe is automatically determined from the chart's timeframe so that a minimum of 50 intrabars are used to calculate volume delta on historical bars.
Alerts
The configuration of the marker conditions explained further is what determines the conditions that will trigger alerts created from this script. Note that simply selecting the display of markers does not create alerts. To create an alert on this script, you must use ALT-A from the chart. You can create multiple alerts triggering on different conditions from this same script; simply configure the markers so they define the trigger conditions for each alert before creating the alert. The configuration of the script's inputs is saved with the alert, so from then on you can change them without affecting the alert. Alert messages will mention the marker(s) that triggered the specific alert event. Keep in mind, when creating alerts on small chart timeframes, that discrepancies between alert triggers and markers displayed on your chart are to be expected. This is because the alert and your chart are running two distinct instances of the indicator on different servers and different feeds. Also keep in mind that while alerts only trigger on confirmed conditions, they are calculated using realtime calculation mode, which entails that if you refresh your chart and elapsed realtime bars recalculate as historical bars using intrabar inspection, markers will not appear in the same places they appeared in realtime. So it's important to understand that even though the alert conditions are confirmed when they trigger, these alerts will repaint.
Let's go through the sections of the script's inputs.
Columns
The size of the Buy/Sell columns always represents their respective importance on the bar, but the coloring mode for tops and bottoms is independent. The default setup uses a standard coloring mode where the Buy/Sell columns are always in the bull/bear color with a higher intensity for the winning side. Seven other coloring modes allow you to pack more information in the columns. When choosing to color the top columns using a bull/bear gradient on "Average Balance", for example, you will have bull/bear colored tops. In order for the color of the bottom columns to continue to show the instant bar balance, you can then choose the "On Bar Balance — Dual Solid Colors" coloring mode to make those bars the color of the winning side for that bar. You can display the averages of the Buy and Sell columns. If you do, its coloring is controlled through the "Line" and "Line fill" sections below.
Line and Line fill
You can select the calculation mode and the thickness of the line, and independent calculations to determine the line's color and fill.
Zero Line
The zero line can display dots when all five balances are bull/bear.
Divergences
You first select the detection mode. Divergences occur whenever the up/down direction of the signal does not match the up/down polarity of the bar. Divergences are used in three components of the indicator's visuals: the orange dot, colored chart bars, and to calculate the divergence levels on the line. The divergence levels are dynamic levels that automatically build from the line's values on divergence events. On consecutive divergences, the levels will expand, creating a channel. This implementation of the divergence levels corresponds to my view that divergences indicate anomalies, hesitations, points of uncertainty if you will. It precludes any attempt to identify a directional bias to divergences. Accordingly, the levels merely take note of divergence events and mark those points in time with levels. Traders then have a reference point from which they can evaluate further movement. The bull/bear/neutral colors used to plot the levels are also congruent with this view in that they are determined by the line's position relative to the levels, which is how I think divergences can be put to the most effective use. One of the coloring modes for the line's fill uses advances/declines in the line after divergence events.
Background
The background can show a bull/bear gradient on six different calculations. As with other gradients, you can adjust its brightness to make its importance proportional to how you use it in your analysis.
Chart bars
Chart bars can be colored using seven different methods. You have the option of emptying the body of bars where volume does not increase, as does my TLD indicator, and you can choose whether you want to show divergences.
Intrabar Timeframe
This is the intrabar timeframe that will be used to calculate volume delta using intrabar inspection on historical bars. You can choose between four modes. The three "Auto-steps" modes calculate, from the chart's timeframe, the intrabar timeframe where the said number of intrabars will make up the dilation of chart bars. Adjustments are made for non-24x7 markets. "Fixed" mode allows you to select the intrabar timeframe you want. Checking the "Show TF" box will display in the lower-right corner the intrabar timeframe used at any given moment. The proper selection of the intrabar timeframe is important. It must achieve maximal granularity to produce precise results while not unduly slowing down calculations, or worse, causing runtime errors. Note that historical depth will vary with the intrabar timeframe. The smaller the timeframe, the shallower historical plots you will be.
Markers
Markers appear when the required condition has been confirmed on a closed bar. The configuration of the markers when you create an alert is what determines when the alert will trigger. Five markers are available:
• Balances Agreement : All five balances are either bullish or bearish.
• Double Bumps : A double bump is two consecutive up/down bars with +/‒ volume delta, and rising Buy/Sell volume above its average.
• Divergence confirmations : A divergence is confirmed up/down when the chosen balance is up/down on the previous bar when that bar was down/up, and this bar is up/down.
• Balance Shifts : These are bull/bear transitions of the selected signal.
• Marker Bias Shifts : Marker bias shifts occur when it crosses into bull/bear territory.
Periods
Allows control over the periods of the different moving averages used to calculate the balances.
Volume Discrepancies
Stock exchanges do not report the same volume for intraday and daily (or higher) resolutions. Other variations in how volume information is reported can also occur in other markets, namely Forex, where volume irregularities can even occur between different intraday timeframes. This will cause discrepancies between the total volume on the bar at the chart's timeframe, and the total volume calculated by adding the volume of the intrabars in that bar's dilation. This does not necessarily invalidate the volume delta information calculated from intrabars, but it tells us that we are using partial volume data. A mechanism to detect chart vs intrabar timeframe volume discrepancies is provided. It allows you to define a threshold percentage above which the background will indicate a difference has been detected.
Other Settings
You can control here the display of the gray dot reminder on realtime bars, and the display of error messages if you are using a chart timeframe that is not greater than the fixed intrabar timeframe, when you use that mode. Disabling the message can be useful if you only use realtime mode at chart timeframes that do not support intrabar inspection.
█ RAMBLINGS
On Volume Delta
Volume is arguably the best complement to interpret price action, and I consider volume delta to be the most effective way of processing volume information. In periods of low-volatility price consolidations, volume will typically also be lower than normal, but slight imbalances in the trend of the buy/sell volume balance can sometimes help put early odds on the direction of the break from consolidation. Additionally, the progression of the volume imbalance can help determine the proximity of the breakout. I also find volume delta and the number of divergences very useful to evaluate the strength of trends. In trends, I am looking for "slow and steady", i.e., relatively low volatility and pauses where price action doesn't look like world affairs are being reassessed. In my personal mythology, this type of trend is often more resilient than high-volatility breakouts, especially when volume balance confirms the general agreement of traders signaled by the low-volatility usually accompanying this type of trend. The volume action on pauses will often help me decide between aggressively taking profits, tightening a stop or going for a longer-term movement. As for reversals, they generally occur in high-volatility areas where entering trades is more expensive and riskier. While the identification of counter-trend reversals fascinates many traders to no end, they represent poor opportunities in my view. Volume imbalances often precede reversals, but I prefer to use volume delta information to identify the areas following reversals where I can confirm them and make relatively low-cost entries with better odds.
On "Buy/Sell" Volume
Buying or selling volume are misnomers, as every unit of volume transacted is both bought and sold by two different traders. While this does not keep me from using the terms, there is no such thing as “buy only” or “sell only” volume. Trader lingo is riddled with peculiarities.
Divergences
The divergence detection method used here relies on a difference between the direction of a signal and the polarity (up/down) of a chart bar. When using the default "On Bar Balance" to detect divergences, however, only the bar's volume delta is used. You may wonder how there can be divergences between buying/selling volume information and price movement on one bar. This will sometimes be due to the calculation's shortcomings, but divergences may also occur in instances where because of order book structure, it takes less volume to increase the price of an asset than it takes to decrease it. As usual, divergences are points of interest because they reveal imbalances, which may or may not become turning points. To your pattern-hungry brain, the divergences displayed by this indicator will — as they do on other indicators — appear to often indicate turnarounds. My opinion is that reality is generally quite sobering and I have no reliable information that would tend to prove otherwise. Exercise caution when using them. Consequently, I do not share the overwhelming enthusiasm of traders in identifying bullish/bearish divergences. For me, the best course of action when a divergence occurs is to wait and see what happens from there. That is the rationale underlying how my divergence levels work; they take note of a signal's level when a divergence occurs, and it's the signal's behavior from that point on that determines if the post-divergence action is bullish/bearish.
Superfluity
In "The Bed of Procrustes", Nassim Nicholas Taleb writes: To bankrupt a fool, give him information . This indicator can display lots of information. While learning to use a new indicator inevitably requires an adaptation period where we put it through its paces and try out all its options, once you have become used to it and decide to adopt it, rigorously eliminate the components you don't use and configure the remaining ones so their visual prominence reflects their relative importance in your analysis. I tried to provide flexible options for traders to control this indicator's visuals for that exact reason — not for window dressing.
█ LIMITATIONS
• This script uses a special characteristic of the `security()` function allowing the inspection of intrabars — which is not officially supported by TradingView.
It has the advantage of permitting a more robust calculation of volume delta than other methods on historical bars, but also has its limits.
• Intrabar inspection only works on some chart timeframes: 3, 5, 10, 15 and 30 minutes, 1, 2, 3, 4, 6, and 12 hours, 1 day, 1 week and 1 month.
The script’s code can be modified to run on other resolutions.
• When the difference between the chart’s timeframe and the intrabar timeframe is too great, runtime errors will occur. The Auto-Steps selection mechanisms should avoid this.
• All volume is not created equally. Its source, components, quality and reliability will vary considerably with sectors and instruments.
The higher the quality, the more reliably volume delta information can be used to guide your decisions.
You should make it your responsibility to understand the volume information provided in the data feeds you use. It will help you make the most of volume delta.
█ NOTES
For traders
• The Data Window shows key values for the indicator.
• While this indicator displays some of the same information calculated in my Delta Volume Columns ,
I have elected to make it a separate publication so that traders continue to have a simpler alternative available to them. Both code bases will continue to evolve separately.
• All gradients used in this indicator determine their brightness intensities using advances/declines in the signal—not their relative position in a pre-determined scale.
• Volume delta being relative, by nature, it is particularly well-suited to Forex markets, as it filters out quite elegantly the cyclical volume data characterizing the sector.
If you are interested in volume delta, consider having a look at my other "Delta Volume" indicators:
• Delta Volume Realtime Action displays realtime volume delta and tick information on the chart.
• Delta Volume Candles builds volume delta candles on the chart.
• Delta Volume Columns is a simpler version of this indicator.
For coders
• I use the `f_c_gradientRelativePro()` from the PineCoders Color Gradient Framework to build my gradients.
This function has the advantage of allowing begin/end colors for both the bull and bear colors. It also allows us to define the number of steps allowed for each gradient.
I use this to modulate the gradients so they perform optimally on the combination of the signal used to calculate advances/declines,
but also the nature of the visual component the gradient applies to. I use fewer steps for choppy signals and when the gradient is used on discrete visual components
such as volume columns or chart bars.
• I use the PineCoders Coding Conventions for Pine to write my scripts.
• I used functions modified from the PineCoders MTF Selection Framework for the selection of timeframes.
█ THANKS TO:
— The devs from TradingView's Pine and other teams, and the PineCoders who collaborate with them. They are doing amazing work,
and much of what this indicator does could not be done without their recent improvements to Pine.
— A guy called Kuan who commented on a Backtest Rookies presentation of their Volume Profile indicator using a `for` loop.
This indicator started from the intrabar inspection technique illustrated in Kuan's snippet.
— theheirophant , my partner in the exploration of the sometimes weird abysses of `security()`’s behavior at intrabar timeframes.
— midtownsk8rguy , my brilliant companion in mining the depths of Pine graphics.

Harmonic Liquidity Waves [JOAT]Harmonic Liquidity Waves
Overview
Harmonic Liquidity Waves is an open-source oscillator indicator that combines multiple volume-based analysis techniques into a unified liquidity flow framework. It integrates VWAP calculations, Chaikin Money Flow (CMF), Money Flow Index (MFI), and Klinger Volume Oscillator (KVO) with custom harmonic wave calculations to provide a comprehensive view of volume dynamics and money flow.
What This Indicator Does
The indicator calculates and displays:
Liquidity Flow - Volume-weighted price movement accumulated over a lookback period
Harmonic Wave - Multi-depth smoothed oscillator derived from liquidity flow
Chaikin Money Flow (CMF) - Classic accumulation/distribution indicator
Money Flow Index (MFI) - Volume-weighted RSI showing buying/selling pressure
Klinger Volume Oscillator (KVO) - Trend-volume relationship indicator
Wave Interference - Combined constructive/destructive wave patterns
Volume Profile POC - Point of Control from simplified volume distribution
How It Works
The core liquidity flow calculation tracks volume-weighted price changes:
calculateLiquidityFlow(series float vol, series float price, simple int period) =>
float priceChange = ta.change(price)
float volumeFlow = vol * math.sign(priceChange)
// Accumulated over period using buffer array
float avgFlow = flowSum / period
avgFlow
The harmonic oscillator applies multi-depth smoothing:
harmonicOscillator(series float flow, simple int depth, simple int period) =>
float harmonic = 0.0
for i = 1 to depth
float wave = ta.ema(flow, period * i) / i
harmonic += wave
harmonic / depth
CMF measures accumulation/distribution using the Money Flow Multiplier:
float mfm = ((close - low) - (high - close)) / (high - low)
float mfv = mfm * vol
float cmf = ta.sum(mfv, period) / ta.sum(vol, period) * 100
Signal Generation
Liquidity shift signals occur when:
Bullish Shift: Smoothed wave crosses above signal line
Bearish Shift: Smoothed wave crosses below signal line
Strong signals require volume indicator confirmation:
Strong Bull: Bullish shift + CMF > 0 + MFI > 50 + KVO > 0
Strong Bear: Bearish shift + CMF < 0 + MFI < 50 + KVO < 0
Divergence detection compares price pivots with liquidity wave pivots to identify potential reversals.
Dashboard Panel (Bottom-Right)
Wave Strength - Normalized wave magnitude
Volume Pressure - Current volume vs average percentage
Flow Direction - BUYING or SELLING based on wave sign
Histogram - Wave minus signal line value
CMF - Chaikin Money Flow reading
MFI - Money Flow Index value (0-100)
KVO - Klinger oscillator value
Vol Confluence - Combined volume indicator score
Signal - Current actionable status
Visual Elements
Liquidity Wave - Main oscillator line
Wave Signal - Smoothed signal line for crossover detection
Wave Histogram - Difference between wave and signal
Wave Interference - Area plot showing combined wave patterns
CMF/KVO/MFI Lines - Individual volume indicator plots
Divergence Labels - BULL DIV / BEAR DIV markers
Shift Markers - Triangles for basic shifts, labels for strong shifts
Input Parameters
Wave Period (default: 21) - Base period for liquidity calculations
Volume Weight (default: 1.5) - Multiplier for volume emphasis
Harmonic Depth (default: 3) - Number of smoothing layers
Smoothing (default: 3) - Final wave smoothing period
Suggested Use Cases
Identify accumulation/distribution phases using CMF and wave direction
Confirm momentum with MFI overbought/oversold readings
Watch for divergences between price and liquidity flow
Use strong signals when multiple volume indicators align
Timeframe Recommendations
Best on 15m to Daily charts. Volume-based indicators require sufficient trading activity for meaningful readings.
Limitations
Volume data quality varies by exchange and instrument
Divergence detection uses pivot-based lookback and may lag
Volume Profile POC is simplified and not a full profile analysis
Open-Source and Disclaimer
This script is published as open-source under the Mozilla Public License 2.0 for educational purposes. It does not constitute financial advice. Past performance does not guarantee future results. Always use proper risk management.
- Made with passion by officialjackofalltrades

Iridescent Liquidity Prism [JOAT]Iridescent Liquidity Prism | Peer Momentum HUD
A multi-layered order-flow indicator that combines microstructure analysis, smart-money footprint detection, and intermarket momentum signals. The script uses dynamic color-shifting themes to visualize liquidity patterns, structure, and peer momentum data directly on the chart.
There is so much to choose from inside the settings, if you think it's a mess on the chart it's because you have to personally customize it based on your needs...
Core Functionality
The indicator calculates and displays several analytical layers simultaneously:
Order-Flow Imbalance (OFI): Calculates buy vs. sell volume pressure using volume-weighted price distribution within each bar. Uses an EMA filter (default: 55 periods) to smooth the signal. Values are normalized using standard deviation to identify significant imbalances.
Smart Money Footprints: Detects accumulation and distribution zones by comparing volume rate of change (ROC) against price ROC. When volume ROC exceeds a threshold (default: 65%) and price ROC is positive, accumulation is detected. When volume ROC is high but price ROC is negative, distribution is detected.
Fractal Structure Mapping: Identifies pivot highs and lows using a fractal detection algorithm (default: 5-bar period). Maintains a rolling window of recent structure points (default: 4 levels) and draws connecting lines to show trend structure.
Fair Value Gap (FVG) Detection: Automatically detects price gaps where three consecutive candles create an imbalance. Bullish FVGs occur when the current low exceeds the high two bars ago. Bearish FVGs occur when the current high is below the low two bars ago. Gaps persist for a configurable duration (default: 320 bars) and fade when price fills the gap.
Liquidity Void Detection: Identifies candles where the high-low range exceeds an ATR threshold (default: 1.7x ATR) while volume is below average (default: 65% of 20-bar average). These conditions suggest areas where liquidity may be thin.
Price/Volume Divergence: Uses linear regression to detect when price trend direction disagrees with volume trend direction. A divergence alert appears when price is trending up while volume is trending down, or vice versa.
Peer Momentum Heatmap (PMH): Calculates composite momentum scores for up to 6 symbols across 4 timeframes. Each score combines RSI (default: 14 periods) and StochRSI (default: 14 periods, 3-bar smooth) to create a momentum composite between -1 and +1. The highest absolute momentum score across all combinations is displayed in the HUD.
Custom settings using Fractal Pivots, Skeleton Structure, Pulse Liquidity Voids, Bottom Colorful HeatMaps, and Iridescent Field.
---
Visual Components
Spectrum Aura Glow: ATR-weighted bands (default: 0.25x ATR) that expand and contract around price action, indicating volatility conditions. The thickness adapts to market volatility.
Chromatic Flow Trail: A blended line combining EMA and WMA of price (default: 8-period EMA blended with WMA at 65% ratio). The trail uses gradient colors that shift based on a phase oscillator, creating an iridescent effect.
Volume Heat Projection: Creates horizontal volume profile bands at price levels (default: 14 levels). Scans recent bars (default: 150 bars) to calculate volume concentration. Each level is colored based on its volume density relative to the maximum volume level.
Structure Skeleton: Dashed lines connecting fractal pivot points. Uses two layers: a primary line (2-3px width) and an optional glow overlay (4-5px width) for enhanced visibility.
Fractal Markers: Diamond shapes placed at pivot high and low points. Color-coded: primary color for highs, secondary color for lows.
Iridescent Color Themes: Five color themes available: Iridescent (default), Pearlescent, Prismatic, ColorShift, and Metallic. Colors shift dynamically using a phase oscillator that cycles through the color spectrum based on bar index and a speed multiplier (default: 0.35).
---
HUD Console Metrics
The right-side HUD displays seven key metrics:
Flow: Shows OFI status: ▲ FLOW BUY when normalized OFI exceeds imbalance threshold (default: 2.2), ▼ FLOW SELL when below -2.2, or ◆ FLOW BAL when balanced.
Struct: Structure trend bias: ▲ STRUCT BULL when microtrend > 2, ▼ STRUCT BEAR when < -2, or ◆ STRUCT RANGE when neutral.
Smart$: Institutional activity: ◈ ACCUM when smart money index = 1, ◈ DISTRIB when = -1, or ○ IDLE when inactive.
Liquid: Liquidity state: ⚡ VOID when a liquidity void is detected, or ● NORMAL otherwise.
Diverg: Divergence status: ⚠ ALERT when price/volume divergence detected, or ✓ CLEAR when aligned.
PMH: Peer Momentum Heatmap status: Shows dominant timeframe and momentum score. Displays 🪩 for bull surge (above 0.55 threshold) or 🧨 for bear surge (below -0.55).
FVG: Fair Value Gap status: Shows active gap count or CLEAR when no gaps exist. Displays GAP LONG when bullish gap detected, GAP SHORT when bearish gap detected.
Pearlscent Color with Volume Heatmap.
Parameters and Settings
Microstructure Engine:
Analysis Depth: 20-250 bars (default: 55) - Controls OFI smoothing period
Liquidity Threshold ATR: 1.0-4.0 (default: 1.7) - Multiplier for void detection
Imbalance Ratio: 1.5-6.0 (default: 2.2) - Standard deviations for OFI significance
Smart Money Layer:
Smart Money Window: 10-150 bars (default: 24) - Period for ROC calculations
Accumulation Threshold: 40-95% (default: 65%) - Volume ROC threshold
Structural Mapping:
Fractal Pivot Period: 3-15 bars (default: 5) - Period for pivot detection
Structure Memory: 2-8 levels (default: 4) - Number of structure points to track
Volume Heat Projection:
Heat Map Lookback: 60-400 bars (default: 150) - Bars to analyze for volume profile
Heat Map Levels: 5-30 levels (default: 14) - Number of price level bands
Heat Map Opacity: 40-100% (default: 92%) - Transparency of heat map boxes
Heat Map Width Limit: 6-80 bars (default: 26) - Maximum width of heat map boxes
Heat Map Visibility Threshold: 0.0-0.5 (default: 0.08) - Minimum density to display
Iridescent Enhancements:
Visual Theme: Iridescent, Pearlescent, Prismatic, ColorShift, or Metallic
Color Shift Speed: 0.05-1.00 (default: 0.35) - Speed of color phase oscillation
Aura Thickness (ATR): 0.05-1.0 (default: 0.25) - Multiplier for aura band width
Chromatic Trail Length: 2-50 bars (default: 8) - Period for trail calculation
Trail Blend Ratio: 0.1-0.95 (default: 0.65) - EMA/WMA blend percentage
FVG Persistence: 50-600 bars (default: 320) - Bars to keep FVG boxes active
Max Active FVG Boxes: 10-200 (default: 40) - Maximum boxes on chart
FVG Base Opacity: 20-95% (default: 80%) - Transparency of FVG boxes
Peer Momentum Heatmap:
Peer Symbols: Comma-separated list of up to 6 symbols (e.g., "BTCUSD,ETHUSD")
Peer Timeframes: Comma-separated list of up to 4 timeframes (default: "60,240,D")
PMH RSI Length: 5-50 periods (default: 14)
PMH StochRSI Length: 5-50 periods (default: 14)
PMH StochRSI Smooth: 1-10 periods (default: 3)
Super Momentum Threshold: 0.2-0.95 (default: 0.55) - Threshold for surge detection
Clarity & Readability:
Liquidity Void Opacity: 5-90% (default: 30%)
Smart Money Footprint Opacity: 5-90% (default: 35%)
HUD Background Opacity: 40-95% (default: 70%)
Iridescent Field:
Field Opacity: 20-100% (default: 86%) - Background color intensity
Field Smooth Length: 10-200 bars (default: 34) - Smoothing for background gradient
---
Alerts
The indicator provides seven alert conditions:
Liquidity Void Detected - Triggers when void conditions are met
Strong Order Flow - Triggers when normalized OFI exceeds imbalance ratio
Smart Money Activity - Triggers when accumulation or distribution detected
Price/Volume Divergence - Triggers when divergence conditions occur
Structure Shift - Triggers when structure polarity changes significantly
PMH Bull Surge - Triggers when PMH exceeds positive threshold (if enabled)
PMH Bear Surge - Triggers when PMH exceeds negative threshold (if enabled)
Bull/Bear Prismatic FVG - Triggers when new FVG is detected (if FVG display enabled)
---
Usage Considerations
Performance may vary on lower timeframes due to the volume heat map calculations scanning multiple bars. Consider reducing heat map lookback or levels if experiencing slowdowns.
The PMH feature requires data requests to other symbols/timeframes, which may impact performance. Limit the number of peer symbols and timeframes for optimal performance.
FVG boxes automatically expire after the persistence period to prevent chart clutter. The maximum box limit (default: 40) prevents excessive memory usage.
Color themes affect all visual elements. Choose a theme that provides good contrast with your chart background.
The indicator is designed for overlay display. All visual elements are positioned relative to price action.
Structure lines are drawn dynamically as new pivots form. On fast-moving markets, structure may update frequently.
Volume calculations assume typical volume data availability. Symbols without volume may show incomplete data for volume-dependent features.
---
Technical Notes
Built on Pine Script v6 with dynamic request capability for PMH functionality.
Uses exponential moving averages (EMA) and weighted moving averages (WMA) for trail calculations to balance responsiveness and smoothness.
Volume profile calculation uses price level buckets. Higher levels provide finer granularity but require more computation.
Iridescent color engine uses a phase oscillator with sine wave calculations for smooth color transitions.
Box management includes automatic cleanup of expired boxes to maintain performance.
All visual elements use color gradients and transparency for smooth blending with price action.
---
Customization Examples
Intraday Scalping Setup:
Analysis Depth: 30 bars
Heat Map Lookback: 100 bars
FVG Persistence: 150 bars
PMH Window: 15 bars
Fast color shift speed: 0.5+
Macro Structure Tracking:
Analysis Depth: 100+ bars
Heat Map Lookback: 300+ bars
FVG Persistence: 500+ bars
Structure Memory: 6-8 levels
Slower color shift speed: 0.2
---
Limitations
Volume heat map calculations may be computationally intensive on lower timeframes with high lookback values.
PMH requires valid symbol names and accessible timeframes. Invalid symbols or timeframes will return no data.
FVG detection requires at least 3 bars of history. Early bars may not show FVG boxes.
Structure lines connect points but do not predict future structure. They reflect historical pivot relationships.
Color themes are aesthetic choices and do not affect calculation logic.
The indicator does not provide trading signals. All visual elements are analytical tools that require interpretation in context of market conditions.
Open Source
This indicator is open source and available for modification and distribution. The code is published with Pine Script v6 compliance. Users are free to customize parameters, modify calculations, and adapt the visual elements to their trading needs.
For questions, suggestions, or anything please talk to me in private messages or comments below!
Would love to help!
- officialjackofalltrades

Institutional VWAP Suite (Lite Compatible)The **Institutional VWAP Suite (Lite Compatible)** brings true institutional volume-weighted price analysis to every trader — even on TradingView Lite/Free accounts where standard VWAP tools are restricted.
This script recreates the most important VWAP models used by banks, funds, and high-frequency desks, including:
• **Daily VWAP** (exchange-accurate)
• **Weekly VWAP** (manually accumulated)
• **Monthly VWAP** (manually accumulated)
• **Rolling Window VWAP** (array-based, fully Lite-compatible)
All calculations avoid blocked functions like `ta.sum` or session-restricted VWAP calls. Everything is built manually from volume and price to ensure accuracy across all accounts and all markets.
### Features
• Multi-timeframe VWAPs (Daily/Weekly/Monthly)
• Manual Rolling VWAP with adjustable length
• Optional VWAP bands (Lite-safe)
• Clean visuals with color-coded levels
• Optimized arrays for fast, stable performance
• Free-tier compatible — no premium functions required
This tool is designed for traders who want institutional structure, premium-level VWAP calculations, and consistent execution regardless of plan level. Perfect for scalpers, day traders, futures traders, and anyone who uses intraday volume profiles.
### Recommended Use
• Map directional bias using Daily vs Weekly VWAP
• Use Monthly VWAP for macro trend context
• Track intraday mean reversion with Rolling VWAP
• Use VWAP bands as dynamic support/resistance zones
A simple, powerful, no-restrictions VWAP engine — built for everyone.

Bassi's Consolidation Breakout — ULTIMATE PRO + VPOverview
Bassi’s Consolidation Breakout — ULTIMATE PRO + VP is a professional-grade breakout detection system that combines price structure, volume confirmation, volatility compression, and custom volume profile logic.
The indicator automatically detects compressed consolidation zones, confirms breakouts with multi-layer filters, and plots full trade setups including:
Entry level
Stop-loss
TP1, TP2, TP3 (R:R based)
Trend filters + MTF EMA
Retest validation
Volume Profile confirmation (POC / VAH / VAL)
This is one of the most complete breakout frameworks for TradingView.
🔍 Core Concept
The script detects tight consolidation boxes based on:
Price range (% compression)
Lookback period
Minimum required bars
Breakout above/below the box
Once the consolidation ends, breakout signals fire only if they pass all filters.
This focuses your trading on high-probability breakouts only.
🔥 Key Features
1️⃣ Automated Consolidation Box Detection
Draws consolidation boxes dynamically
Identifies tight range compression
Supports advanced range logic for high accuracy
2️⃣ Smart Breakout + Retest Engine
Breakouts and breakdowns require:
Structure break
Minimum breakout expansion (0.15%)
Volume confirmation
Trend (200 EMA) confirmation
Optional retest validation
Optional Volume Profile filter
Each valid breakout prints a signal + full trade setup.
3️⃣ Custom Volume Profile Engine
Fast and lightweight custom-built VP that calculates:
POC (Point of Control)
VAH (Value Area High)
VAL (Value Area Low)
These levels can optionally be used to filter weak breakouts.
4️⃣ Multi-Timeframe Trend Filter
Uses 200 EMA from any selected higher timeframe
Helps avoid counter-trend fakeouts
Fully optional
5️⃣ Automatic Trade Setup Projection
Each breakout generates:
Stop-loss (ATR × multiplier)
TP1 (R:R)
TP2 (R:R)
TP3 (optional)
Clean signal labels
Only keeps the last 2 signals to maintain clarity
6️⃣ Alerts Included
Alerts fire instantly when a valid breakout occurs:
“Bassi LONG + VP”
“Bassi SHORT + VP”
Alerts include ticker + entry price.
📘 Usage Guide & Trading Rules
✔ Recommended Trading Steps
1. Wait for a confirmed consolidation box
Box must be narrow
Must meet minimum bar requirement
2. Wait for a confirmed breakout signal
Signal requires:
Breakout above/below box
Volume confirmation
Trend & MTF confirmation if enabled
Optional retest
Optional VP filter (close outside VAH/VAL)
3. Follow the projected setup
The script prints:
Entry
SL
TP1 / TP2 / TP3
Target lines extend automatically.
📖 How to Use the Script (Trading Rules)
1️⃣ Long Entry Rules
Enter Long when:
Price breaks above trend confirmation level
Momentum signal turns bullish
Candle closes above trigger line
Volatility filter is satisfied
Exit Long:
TP1/TP2/TP3 levels
Reversal signal
Trailing stop hit
2️⃣ Short Entry Rules
Enter Short when:
Price breaks below trend confirmation level
Momentum signal turns bearish
Candle closes below trigger line
Volatility filter is satisfied
Exit Short:
TP1/TP2/TP3 levels
Trend reversal
Trailing stop hit
✔ Recommended Markets
Crypto
Forex
Indices
Futures
Stocks
Works on all timeframes from 1-minute to daily.
✔ Best Practice
Avoid taking signals against HTF trend
Prefer signals that break away from VAH/VAL
Use TP1 to secure partial profits
Move SL to breakeven after TP1 if desired
Always follow personal risk management
👤 Author
Created by: Mahdi Bassi
Professional trader & systems designer
Focused on structural, volume-based and volatility-based strategies.
⚠️ Disclaimer
This script is for educational purposes only.
No indicator can guarantee profits.
Always use proper risk management and trade responsibly.

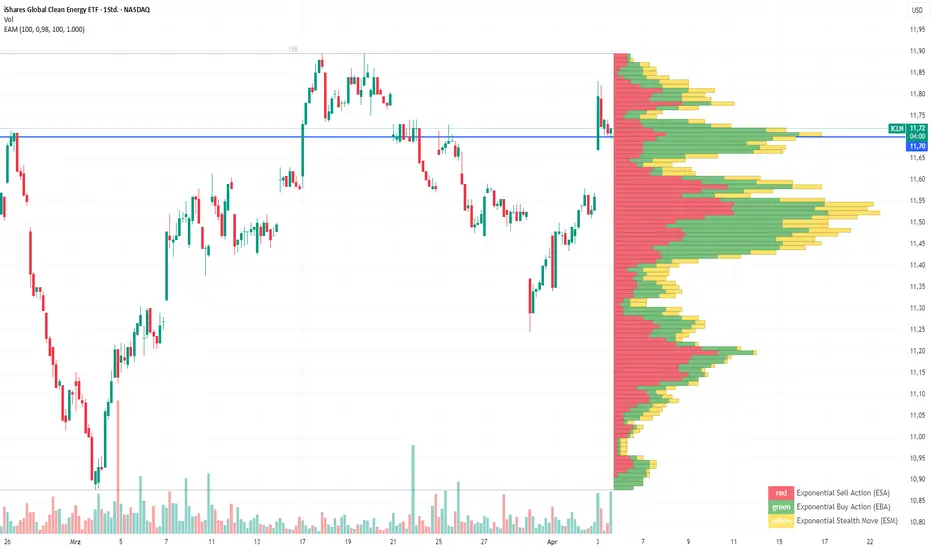
Exponential Action Map (EAM)### **Exponential Action Map (EAM) – Description and Differences from VPVR**
The Exponential Action Map (EAM) indicator is a Pine Script-based volume profile indicator that offers **a weighted representation of buying and selling activity**. Unlike the standard **Volume Profile Visible Range (VPVR)**, which simply shows traded volume at various price levels, the EAM provides the following additional features:
1. **Exponential Weighting**:
- Instead of treating the volume of all considered bars equally, the EAM uses a **decay factor** to gradually diminish the significance of older data. This allows **more recent price movements to have greater influence**, making it particularly useful for short-term analysis.
2. **Exponential Stealth Move (ESM)**:
- In addition to buy and sell volume, the EAM calculates and displays the **Exponential Stealth Move (ESM)**.
- This measures the relative price movement compared to volume and highlights areas where **significant price changes occur with low volume**, which may indicate institutional activity or strong momentum.
- The ESM visualization is not present in VPVR, making it a distinct and valuable feature.
3. **Visualization Methodology**:
- Instead of simple histograms like in VPVR, volume is represented by **dynamic boxes** that encompass Buy (EBA), Sell (ESA), and Stealth Move (ESM) activities.
- The size and color of these boxes are **customizable**, allowing for clear differentiation between various volume types.
4. **Flexibility & Configuration**:
- Users can adjust parameters such as **Number of Bars, Decay Factor, Bar Width, and Maximum History Data**.
- The ability to **toggle historical data visibility** offers a **tailored view** that VPVR does not provide.
**Conclusion:** The EAM extends the classic volume profile (VPVR) by introducing **time-weighted volume analysis and detection of Stealth Moves (ESM)**. This not only highlights price levels with high trading volume but also reveals **price movements with low liquidity**, which can potentially indicate institutional interest.
Multiple AVWAP [OmegaTools]The Multiple AVWAP indicator is a sophisticated trading tool designed for professional traders who require precision in volume-weighted price tracking. This indicator allows for the deployment of multiple Anchored Volume Weighted Average Price (AVWAP) calculations simultaneously, offering deep insights into price movements, dynamic support and resistance levels, and trend structures across multiple timeframes.
This indicator caters to both institutional and retail traders by integrating flexible anchoring methods, multi-timeframe adaptability, and enhanced visualization features. It also includes deviation bands for statistical analysis, making it a comprehensive volume-based trading solution.
Key Features & Functionalities
1. Multiple AVWAP Configurations
Users can configure up to four distinct AVWAP calculations to track different market conditions.
Supports various anchoring methods:
Fixed: A traditional AVWAP that starts from a defined historical point.
Perpetual: A rolling VWAP that continuously adjusts over time.
Extension: An extension-based AVWAP that projects from past calculations.
High Volume: Anchors AVWAP to the highest volume bar within a specified period.
None: Option to disable AVWAP calculation if not required.
2. Advanced Deviation Bands
Implements standard deviation bands (1st and 2nd deviation) to provide a statistical measure of price dispersion from the AVWAP.
Serves as a dynamic method for identifying overbought and oversold conditions relative to VWAP pricing.
Deviation bands are customizable in terms of visibility, color, and transparency.
3. Multi-Timeframe Support
Users can assign different timeframes to each AVWAP calculation for macro and micro analysis.
Helps in identifying long-term institutional trading levels alongside short-term intraday trends.
4. Z-Score Normalization Mode
Option to standardize oscillator values based on AVWAP deviations.
Converts price movements into a statistical Z-score, allowing traders to measure price strength in a normalized range.
Helps in detecting extreme price dislocations and mean-reversion opportunities.
5. Customizable Visual & Aesthetic Settings
Fully customizable line colors, transparency, and thickness to enhance clarity.
Users can modify AVWAP and deviation band colors to distinguish between different levels.
Configurable display options to match personal trading preferences.
6. Oscillator Mode for Trend & Momentum Analysis
The indicator converts price deviations into an oscillator format, displaying AVWAP strength and weakness dynamically.
This provides traders with a momentum-based perspective on volume-weighted price movements.
User Guide & Implementation
1. Configuring AVWAPs for Optimal Use
Choose the mode for each AVWAP instance:
Fixed (set historical point)
Perpetual (rolling, continuously updated AVWAP)
Extension (projection from past AVWAP levels)
High Volume (anchored to highest volume bar)
None (disables the AVWAP line)
Adjust the length settings to fine-tune calculation sensitivity.
2. Utilizing Deviation Bands for Market Context
Activate deviation bands to see statistical boundaries of price action.
Monitor +1 / -1 and +2 / -2 standard deviation levels for extended price movements.
Consider price action outside of deviation bands as potential mean-reversion signals.
3. Multi-Timeframe Analysis for Institutional-Level Insights
Assign different timeframes to each AVWAP to compare:
Daily VWAP (institutional trading levels)
Weekly VWAP (swing trading trends)
Intraday VWAPs (short-term momentum shifts)
Helps identify where institutional liquidity is positioned relative to price.
4. Activating the Oscillator for Momentum & Bias Confirmation
The oscillator converts AVWAP deviations into a normalized value.
Use overbought/oversold levels to determine strength and potential reversals.
Combine with other indicators (RSI, MACD) for confluence-based trading decisions.
Trading Applications & Strategies
5. Trend Confirmation & Institutional VWAP Tracking
If price consistently holds above the primary AVWAP, it signals a bullish trend.
If price remains below AVWAP, it indicates selling pressure and a bearish trend.
Monitor retests of AVWAP levels for potential trend continuation or reversal.
6. Dynamic Support & Resistance Levels
AVWAP lines act as dynamic floating support and resistance zones.
Price bouncing off AVWAP suggests continuation, whereas breakdowns indicate a shift in momentum.
Look for confluence with high-volume zones for stronger trade signals.
7. Mean Reversion & Statistical Edge Trading
Prices that deviate beyond +2 or -2 standard deviations often revert toward AVWAP.
Mean reversion traders can fade extended moves and target AVWAP re-tests.
Helps in identifying exhaustion points in trending markets.
8. Institutional Liquidity & Volume Footprints
Institutions often execute large trades near VWAP zones, causing price reactions.
Tracking multi-timeframe AVWAP levels allows traders to anticipate key liquidity areas.
Use higher timeframe AVWAPs as macro support/resistance for swing trading setups.
9. Enhancing Momentum Trading with AVWAP Oscillator
The oscillator provides a momentum-based measure of AVWAP deviations.
Helps in confirming entry and exit timing for trend-following trades.
Useful for pairing with stochastic oscillators, MACD, or RSI to validate trade decisions.
Best Practices & Trading Tips
Use in Conjunction with Volume Analysis: Combine with volume profiles, OBV, or CVD for increased accuracy.
Adjust Timeframes Based on Trading Style: Scalpers can focus on short-term AVWAP, while swing traders benefit from weekly/daily AVWAP tracking.
Backtest Different AVWAP Configurations: Experiment with different anchoring methods and lookback periods to optimize trade performance.
Monitor Institutional Order Flow: Identify key VWAP zones where institutional traders may be active.
Use with Other Technical Indicators: Enhance trading confidence by integrating with moving averages, Bollinger Bands, or Fibonacci retracements.
Final Thoughts & Disclaimer
The Multiple AVWAP indicator provides a comprehensive approach to volume-weighted price tracking, making it ideal for professional traders. While this tool enhances market clarity and trade decision-making, it should be used as part of a well-rounded trading strategy with risk management principles in place.
This indicator is provided for informational and educational purposes only. Trading involves risk, and past performance is not indicative of future results. Always conduct your own analysis and due diligence before executing trades.
OmegaTools - Enhancing Market Clarity with Precision Indicators

Simplified Market ProfileVolume Bins: This script divides the price range into num_bins equal price levels. Each bin holds the cumulative volume for that price range.
Profile Length: The number of past bars that the profile considers for building the volume histogram.
Bin Size: The price range between bins is determined by dividing the difference between the highest and lowest prices over the specified range.
Volume Calculation: The script iterates over each bar within the specified range, determining which price bin the bar’s volume should be added to.
Plotting: The script visualizes the volume profile as lines plotted horizontally at different price levels, with thickness proportional to the volume traded at that level.

CVD - Cumulative Volume Delta (Chart)█ OVERVIEW
This indicator displays cumulative volume delta (CVD) as an on-chart oscillator. It uses intrabar analysis to obtain more precise volume delta information compared to methods that only use the chart's timeframe.
The core concepts in this script come from our first CVD indicator , which displays CVD values as plot candles in a separate indicator pane. In this script, CVD values are scaled according to price ranges and represented on the main chart pane.
█ CONCEPTS
Bar polarity
Bar polarity refers to the position of the close price relative to the open price. In other words, bar polarity is the direction of price change.
Intrabars
Intrabars are chart bars at a lower timeframe than the chart's. Each 1H chart bar of a 24x7 market will, for example, usually contain 60 bars at the lower timeframe of 1min, provided there was market activity during each minute of the hour. Mining information from intrabars can be useful in that it offers traders visibility on the activity inside a chart bar.
Lower timeframes (LTFs)
A lower timeframe is a timeframe that is smaller than the chart's timeframe. This script utilizes a LTF to analyze intrabars, or price changes within a chart bar. The lower the LTF, the more intrabars are analyzed, but the less chart bars can display information due to the limited number of intrabars that can be analyzed.
Volume delta
Volume delta is a measure that separates volume into "up" and "down" parts, then takes the difference to estimate the net demand for the asset. This approach gives traders a more detailed insight when analyzing volume and market sentiment. There are several methods for determining whether an asset's volume belongs in the "up" or "down" category. Some indicators, such as On Balance Volume and the Klinger Oscillator , use the change in price between bars to assign volume values to the appropriate category. Others, such as Chaikin Money Flow , make assumptions based on open, high, low, and close prices. The most accurate method involves using tick data to determine whether each transaction occurred at the bid or ask price and assigning the volume value to the appropriate category accordingly. However, this method requires a large amount of data on historical bars, which can limit the historical depth of charts and the number of symbols for which tick data is available.
In the context where historical tick data is not yet available on TradingView, intrabar analysis is the most precise technique to calculate volume delta on historical bars on our charts. This indicator uses intrabar analysis to achieve a compromise between simplicity and accuracy in calculating volume delta on historical bars. Our Volume Profile indicators use it as well. Other volume delta indicators in our Community Scripts , such as the Realtime 5D Profile , use real-time chart updates to achieve more precise volume delta calculations. However, these indicators aren't suitable for analyzing historical bars since they only work for real-time analysis.
This is the logic we use to assign intrabar volume to the "up" or "down" category:
• If the intrabar's open and close values are different, their relative position is used.
• If the intrabar's open and close values are the same, the difference between the intrabar's close and the previous intrabar's close is used.
• As a last resort, when there is no movement during an intrabar and it closes at the same price as the previous intrabar, the last known polarity is used.
Once all intrabars comprising a chart bar are analyzed, we calculate the net difference between "up" and "down" intrabar volume to produce the volume delta for the chart bar.
█ FEATURES
CVD resets
The "cumulative" part of the indicator's name stems from the fact that calculations accumulate during a period of time. By periodically resetting the volume delta accumulation, we can analyze the progression of volume delta across manageable chunks, which is often more useful than looking at volume delta accumulated from the beginning of a chart's history.
You can configure the reset period using the "CVD Resets" input, which offers the following selections:
• None : Calculations do not reset.
• On a fixed higher timeframe : Calculations reset on the higher timeframe you select in the "Fixed higher timeframe" field.
• At a fixed time that you specify.
• At the beginning of the regular session .
• On trend changes : Calculations reset on the direction change of either the Aroon indicator, Parabolic SAR , or Supertrend .
• On a stepped higher timeframe : Calculations reset on a higher timeframe automatically stepped using the chart's timeframe and following these rules:
Chart TF HTF
< 1min 1H
< 3H 1D
<= 12H 1W
< 1W 1M
>= 1W 1Y
Specifying intrabar precision
Ten options are included in the script to control the number of intrabars used per chart bar for calculations. The greater the number of intrabars per chart bar, the fewer chart bars can be analyzed.
The first five options allow users to specify the approximate amount of chart bars to be covered:
• Least Precise (Most chart bars) : Covers all chart bars by dividing the current timeframe by four.
This ensures the highest level of intrabar precision while achieving complete coverage for the dataset.
• Less Precise (Some chart bars) & More Precise (Less chart bars) : These options calculate a stepped LTF in relation to the current chart's timeframe.
• Very precise (2min intrabars) : Uses the second highest quantity of intrabars possible with the 2min LTF.
• Most precise (1min intrabars) : Uses the maximum quantity of intrabars possible with the 1min LTF.
The stepped lower timeframe for "Less Precise" and "More Precise" options is calculated from the current chart's timeframe as follows:
Chart Timeframe Lower Timeframe
Less Precise More Precise
< 1hr 1min 1min
< 1D 15min 1min
< 1W 2hr 30min
> 1W 1D 60min
The last five options allow users to specify an approximate fixed number of intrabars to analyze per chart bar. The available choices are 12, 24, 50, 100, and 250. The script will calculate the LTF which most closely approximates the specified number of intrabars per chart bar. Keep in mind that due to factors such as the length of a ticker's sessions and rounding of the LTF, it is not always possible to produce the exact number specified. However, the script will do its best to get as close to the value as possible.
As there is a limit to the number of intrabars that can be analyzed by a script, a tradeoff occurs between the number of intrabars analyzed per chart bar and the chart bars for which calculations are possible.
Display
This script displays raw or cumulative volume delta values on the chart as either line or histogram oscillator zones scaled according to the price chart, allowing traders to visualize volume activity on each bar or cumulatively over time. The indicator's background shows where CVD resets occur, demarcating the beginning of new zones. The vertical axis of each oscillator zone is scaled relative to the one with the highest price range, and the oscillator values are scaled relative to the highest volume delta. A vertical offset is applied to each oscillator zone so that the highest oscillator value aligns with the lowest price. This method ensures an accurate, intuitive visual comparison of volume activity within zones, as the scale is consistent across the chart, and oscillator values sit below prices. The vertical scale of oscillator zones can be adjusted using the "Zone Height" input in the script settings.
This script displays labels at the highest and lowest oscillator values in each zone, which can be enabled using the "Hi/Lo Labels" input in the "Visuals" section of the script settings. Additionally, the oscillator's value on a chart bar is displayed as a tooltip when a user hovers over the bar, which can be enabled using the "Value Tooltips" input.
Divergences occur when the polarity of volume delta does not match that of the chart bar. The script displays divergences as bar colors and background colors that can be enabled using the "Color bars on divergences" and "Color background on divergences" inputs.
An information box in the lower-left corner of the indicator displays the HTF used for resets, the LTF used for intrabars, the average quantity of intrabars per chart bar, and the number of chart bars for which there is LTF data. This is enabled using the "Show information box" input in the "Visuals" section of the script settings.
FOR Pine Script™ CODERS
• This script utilizes `ltf()` and `ltfStats()` from the lower_tf library.
The `ltf()` function determines the appropriate lower timeframe from the selected calculation mode and chart timeframe, and returns it in a format that can be used with request.security_lower_tf() .
The `ltfStats()` function, on the other hand, is used to compute and display statistical information about the lower timeframe in an information box.
• The script utilizes display.data_window and display.status_line to restrict the display of certain plots.
These new built-ins allow coders to fine-tune where a script’s plot values are displayed.
• The newly added session.isfirstbar_regular built-in allows for resetting the CVD segments at the start of the regular session.
• The VisibleChart library developed by our resident PineCoders team leverages the chart.left_visible_bar_time and chart.right_visible_bar_time variables to optimize the performance of this script.
These variables identify the opening time of the leftmost and rightmost visible bars on the chart, allowing the script to recalculate and draw objects only within the range of visible bars as the user scrolls.
This functionality also enables the scaling of the oscillator zones.
These variables are just a couple of the many new built-ins available in the chart.* namespace.
For more information, check out this blog post or look them up by typing "chart." in the Pine Script™ Reference Manual .
• Our ta library has undergone significant updates recently, including the incorporation of the `aroon()` indicator used as a method for resetting CVD segments within this script.
Revisit the library to see more of the newly added content!
Look first. Then leap.

Delta Volume Channels [LucF]█ OVERVIEW
This indicator displays on-chart visuals aimed at making the most of delta volume information. It can color bars and display two channels: one for delta volume, another calculated from the price levels of bars where delta volume divergences occur. Markers and alerts can also be configured using key conditions, and filtered in many different ways. The indicator caters to traders who prefer chart visuals over raw values. It will work on historical bars and in real time, using intrabar analysis to calculate delta volume in both conditions.
█ CONCEPTS
Delta Volume
The volume delta concept divides a bar's volume in "up" and "down" volumes. The delta is calculated by subtracting down volume from up volume. Many calculation techniques exist to isolate up and down volume within a bar. The simplest techniques use the polarity of interbar price changes to assign their volume to up or down slots, e.g., On Balance Volume or the Klinger Oscillator . Others such as Chaikin Money Flow use assumptions based on a bar's OHLC values. The most precise calculation method uses tick data and assigns the volume of each tick to the up or down slot depending on whether the transaction occurs at the bid or ask price. While this technique is ideal, it requires huge amounts of data on historical bars, which usually limits the historical depth of charts and the number of symbols for which tick data is available.
This indicator uses intrabar analysis to achieve a compromise between the simplest and most precise methods of calculating volume delta. In the context where historical tick data is not yet available on TradingView, intrabar analysis is the most precise technique to calculate volume delta on historical bars on our charts. TradingView's Volume Profile built-in indicators use it, as do the CVD - Cumulative Volume Delta Candles and CVD - Cumulative Volume Delta (Chart) indicators published from the TradingView account . My Volume Delta Columns Pro indicator also uses intrabar analysis. Other volume delta indicators such as my Realtime 5D Profile use realtime chart updates to achieve more precise volume delta calculations. Indicators of that type cannot be used on historical bars however; they only work in real time.
This is the logic I use to assign intrabar volume to up or down slots:
• If the intrabar's open and close values are different, their relative position is used.
• If the intrabar's open and close values are the same, the difference between the intrabar's close and the previous intrabar's close is used.
• As a last resort, when there is no movement during an intrabar and it closes at the same price as the previous intrabar, the last known polarity is used.
Once all intrabars making up a chart bar have been analyzed and the up or down property of each intrabar's volume determined, the up volumes are added and the down volumes subtracted. The resulting value is volume delta for that chart bar, which can be used as an estimate of the buying/selling pressure on an instrument.
Delta Volume Percent (DV%)
This value is the proportion that delta volume represents of the total intrabar volume in the chart bar. Note that on some symbols/timeframes, the total intrabar volume may differ from the chart's volume for a bar, but that will not affect our calculations since we use the total intrabar volume.
Delta Volume Channel
The DV channel is the space between two moving averages: the reference line and a DV%-weighted version of that reference. The reference line is a moving average of a type, source and length which you select. The DV%-weighted line uses the same settings, but it averages the DV%-weighted price source.
The weight applied to the source of the reference line is calculated from two values, which are multiplied: DV% and the relative size of the bar's volume in relation to previous bars. The effect of this is that DV% values on bars with higher total volume will carry greater weight than those with lesser volume.
The DV channel can be in one of four states, each having its corresponding color:
• Bull (teal): The DV%-weighted line is above the reference line.
• Strong bull (lime): The bull condition is fulfilled and the bar's close is above the reference line and both the reference and the DV%-weighted lines are rising.
• Bear (maroon): The DV%-weighted line is below the reference line.
• Strong bear (pink): The bear condition is fulfilled and the bar's close is below the reference line and both the reference and the DV%-weighted lines are falling.
Divergences
In the context of this indicator, a divergence is any bar where the slope of the reference line does not match that of the DV%-weighted line. No directional bias is assigned to divergences when they occur.
Divergence Channel
The divergence channel is the space between two levels (by default, the bar's low and high ) saved when divergences occur. When price has breached a channel and a new divergence occurs, a new channel is created. Until that new channel is breached, bars where additional divergences occur will expand the channel's levels if the bar's price points are outside the channel.
Prices breaches of the divergence channel will change its state. Divergence channels can be in one of five different states:
• Bull (teal): Price has breached the channel to the upside.
• Strong bull (lime): The bull condition is fulfilled and the DV channel is in the strong bull state.
• Bear (maroon): Price has breached the channel to the downside.
• Strong bear (pink): The bear condition is fulfilled and the DV channel is in the strong bear state.
• Neutral (gray): The channel has not been breached.
█ HOW TO USE THE INDICATOR
Load the indicator on an active chart (see here if you don't know how).
The default configuration displays:
• The DV channel, without the reference or DV%-weighted lines.
• The Divergence channel, without its level lines.
• Bar colors using the state of the DV channel.
The default settings use an Arnaud-Legoux moving average on the close and a length of 20 bars. The DV%-weighted version of it uses a combination of DV% and relative volume to calculate the ultimate weight applied to the reference. The DV%-weighted line is capped to 5 standard deviations of the reference. The lower timeframe used to access intrabars automatically adjusts to the chart's timeframe and achieves optimal balance between the number of intrabars inspected in each chart bar, and the number of chart bars covered by the script's calculations.
The Divergence channel's levels are determined using the high and low of the bars where divergences occur. Breaches of the channel require a bar's low to move above the top of the channel, and the bar's high to move below the channel's bottom.
No markers appear on the chart; if you want to create alerts from this script, you will need first to define the conditions that will trigger the markers, then create the alert, which will trigger on those same conditions.
To learn more about how to use this indicator, you must understand the concepts it uses and the information it displays, which requires reading this description. There are no videos to explain it.
█ FEATURES
The script's inputs are divided in four sections: "DV channel", "Divergence channel", "Other Visuals" and "Marker/Alert Conditions". The first setting is the selection method used to determine the intrabar precision, i.e., how many lower timeframe bars (intrabars) are examined in each chart bar. The more intrabars you analyze, the more precise the calculation of DV% results will be, but the less chart coverage can be covered by the script's calculations.
DV Channel
Here, you control the visibility and colors of the reference line, its weighted version, and the DV channel between them.
You also specify what type of moving average you want to use as a reference line, its source and length. This acts as the DV channel's baseline. The DV%-weighted line is also a moving average of the same type and length as the reference line, except that it will be calculated from the DV%-weighted source used in the reference line. By default, the DV%-weighted line is capped to five standard deviations of the reference line. You can change that value here. This section is also where you can disable the relative volume component of the weight.
Divergence Channel
This is where you control the appearance of the divergence channel and the key price values used in determining the channel's levels and breaching conditions. These choices have an impact on the behavior of the channel. More generous level prices like the default low and high selection will produce more conservative channels, as will the default choice for breach prices.
In this section, you can also enable a mode where an attempt is made to estimate the channel's bias before price breaches the channel. When it is enabled, successive increases/decreases of the channel's top and bottom levels are counted as new divergences occur. When one count is greater than the other, a bull/bear bias is inferred from it.
Other Visuals
You specify here:
• The method used to color chart bars, if you choose to do so.
• The display of a mark appearing above or below bars when a divergence occurs.
• If you want raw values to appear in tooltips when you hover above chart bars. The default setting does not display them, which makes the script faster.
• If you want to display an information box which by default appears in the lower left of the chart.
It shows which lower timeframe is used for intrabars, and the average number of intrabars per chart bar.
Marker/Alert Conditions
Here, you specify the conditions that will trigger up or down markers. The trigger conditions can include a combination of state transitions of the DV and the divergence channels. The triggering conditions can be filtered using a variety of conditions.
Configuring the marker conditions is necessary before creating an alert from this script, as the alert will use the marker conditions to trigger.
Markers only appear on bar closes, so they will not repaint. Keep in mind, when looking at markers on historical bars, that they are positioned on the bar when it closes — NOT when it opens.
Raw values
The raw values calculated by this script can be inspected using a tooltip and the Data Window. The tooltip is visible when you hover over the top of chart bars. It will display on the last 500 bars of the chart, and shows the values of DV, DV%, the combined weight, and the intermediary values used to calculate them.
█ INTERPRETATION
The aim of the DV channel is to provide a visual representation of the buying/selling pressure calculated using delta volume. The simplest characteristic of the channel is its bull/bear state. One can then distinguish between its bull and strong bull states, as transitions from strong bull to bull states will generally happen when buyers are losing steam. While one should not infer a reversal from such transitions, they can be a good place to tighten stops. Only time will tell if a reversal will occur. One or more divergences will often occur before reversals.
The nature of the divergence channel's design makes it particularly adept at identifying consolidation areas if its settings are kept on the conservative side. A gray divergence channel should usually be considered a no-trade zone. More adventurous traders can use the DV channel to orient their trade entries if they accept the risk of trading in a neutral divergence channel, which by definition will not have been breached by price.
If your charts are already busy with other stuff you want to hold on to, you could consider using only the chart bar coloring component of this indicator:
At its simplest, one way to use this indicator would be to look for overlaps of the strong bull/bear colors in both the DV channel and a divergence channel, as these identify points where price is breaching the divergence channel when buy/sell pressure is consistent with the direction of the breach. I have highlighted all those points in the chart below. Not all of them would have produced profitable trades, but nothing is perfect in the markets. Also, keep in mind that the circles identify the visual you would be looking for — not the trade's entry level.
█ LIMITATIONS
• The script will not work on symbols where no volume is available. An error will appear when that is the case.
• Because a maximum of 100K intrabars can be analyzed by a script, a compromise is necessary between the number of intrabars analyzed per chart bar
and chart coverage. The more intrabars you analyze per chart bar, the less coverage you will obtain.
The setting of the "Intrabar precision" field in the "DV channel" section of the script's inputs
is where you control how the lower timeframe is calculated from the chart's timeframe.
█ NOTES
Volume Quality
If you use volume, it's important to understand its nature and quality, as it varies with sectors and instruments. My Volume X-ray indicator is one way you can appraise the quality of an instrument's intraday volume.
For Pine Script™ Coders
• This script uses the new overload of the fill() function which now makes it possible to do vertical gradients in Pine. I use it for both channels displayed by this script.
• I use the new arguments for plot() 's `display` parameter to control where the script plots some of its values,
namely those I only want to appear in the script's status line and in the Data Window.
• I wrote my script using the revised recommendations in the Style Guide from the Pine v5 User Manual.
█ THANKS
To PineCoders . I have used their lower_tf library in this script, to manage the calculation of the LTF and intrabar stats, and their Time library to convert a timeframe in seconds to a printable form for its display in the Information box.
To TradingView's Pine Script™ team. Their innovations and improvements, big and small, constantly expand the boundaries of the language. What this script does would not have been possible just a few months back.
And finally, thanks to all the users of my scripts who take the time to comment on my publications and suggest improvements. I do not reply to all but I do read your comments and do my best to implement your suggestions with the limited time that I have.

CVD - Cumulative Volume Delta Candles█ OVERVIEW
This indicator displays cumulative volume delta in candle form. It uses intrabar information to obtain more precise volume delta information than methods using only the chart's timeframe.
█ CONCEPTS
Bar polarity
By bar polarity , we mean the direction of a bar, which is determined by looking at the bar's close vs its open .
Intrabars
Intrabars are chart bars at a lower timeframe than the chart's. Each 1H chart bar of a 24x7 market will, for example, usually contain 60 bars at the lower timeframe of 1min, provided there was market activity during each minute of the hour. Mining information from intrabars can be useful in that it offers traders visibility on the activity inside a chart bar.
Lower timeframes (LTFs)
A lower timeframe is a timeframe that is smaller than the chart's timeframe. This script uses a LTF to access intrabars. The lower the LTF, the more intrabars are analyzed, but the less chart bars can display CVD information because there is a limit to the total number of intrabars that can be analyzed.
Volume delta
The volume delta concept divides a bar's volume in "up" and "down" volumes. The delta is calculated by subtracting down volume from up volume. Many calculation techniques exist to isolate up and down volume within a bar. The simplest techniques use the polarity of interbar price changes to assign their volume to up or down slots, e.g., On Balance Volume or the Klinger Oscillator . Others such as Chaikin Money Flow use assumptions based on a bar's OHLC values. The most precise calculation method uses tick data and assigns the volume of each tick to the up or down slot depending on whether the transaction occurs at the bid or ask price. While this technique is ideal, it requires huge amounts of data on historical bars, which usually limits the historical depth of charts and the number of symbols for which tick data is available.
This indicator uses intrabar analysis to achieve a compromise between the simplest and most precise methods of calculating volume delta. In the context where historical tick data is not yet available on TradingView, intrabar analysis is the most precise technique to calculate volume delta on historical bars on our charts. Our Volume Profile indicators use it. Other volume delta indicators in our Community Scripts such as the Realtime 5D Profile use realtime chart updates to achieve more precise volume delta calculations, but that method cannot be used on historical bars, so those indicators only work in real time.
This is the logic we use to assign intrabar volume to up or down slots:
• If the intrabar's open and close values are different, their relative position is used.
• If the intrabar's open and close values are the same, the difference between the intrabar's close and the previous intrabar's close is used.
• As a last resort, when there is no movement during an intrabar and it closes at the same price as the previous intrabar, the last known polarity is used.
Once all intrabars making up a chart bar have been analyzed and the up or down property of each intrabar's volume determined, the up volumes are added and the down volumes subtracted. The resulting value is volume delta for that chart bar.
█ FEATURES
CVD Candles
Cumulative Volume Delta Candles present volume delta information as it evolves during a period of time.
This is how each candle's levels are calculated:
• open : Each candle's' open level is the cumulative volume delta for the current period at the start of the bar.
This value becomes zero on the first candle following a CVD reset.
The candles after the first one always open where the previous candle closed.
The candle's high, low and close levels are then calculated by adding or subtracting a volume value to the open.
• high : The highest volume delta value found in intrabars. If it is not higher than the volume delta for the bar, then that candle will have no upper wick.
• low : The lowest volume delta value found in intrabars. If it is not lower than the volume delta for the bar, then that candle will have no lower wick.
• close : The aggregated volume delta for all intrabars. If volume delta is positive for the chart bar, then the candle's close will be higher than its open, and vice versa.
The candles are plotted in one of two configurable colors, depending on the polarity of volume delta for the bar.
CVD resets
The "cumulative" part of the indicator's name stems from the fact that calculations accumulate during a period of time. This allows you to analyze the progression of volume delta across manageable chunks, which is often more useful than looking at volume delta cumulated from the beginning of a chart's history.
You can configure the reset period using the "CVD Resets" input, which offers the following selections:
• None : Calculations do not reset.
• On a fixed higher timeframe : Calculations reset on the higher timeframe you select in the "Fixed higher timeframe" field.
• At a fixed time that you specify.
• At the beginning of the regular session .
• On a stepped higher timeframe : Calculations reset on a higher timeframe automatically stepped using the chart's timeframe and following these rules:
Chart TF HTF
< 1min 1H
< 3H 1D
<= 12H 1W
< 1W 1M
>= 1W 1Y
The indicator's background shows where resets occur.
Intrabar precision
The precision of calculations increases with the number of intrabars analyzed for each chart bar. It is controlled through the script's "Intrabar precision" input, which offers the following selections:
• Least precise, covering many chart bars
• Less precise, covering some chart bars
• More precise, covering less chart bars
• Most precise, 1min intrabars
As there is a limit to the number of intrabars that can be analyzed by a script, a tradeoff occurs between the number of intrabars analyzed per chart bar and the chart bars for which calculations are possible.
Total volume candles
You can choose to display candles showing the total intrabar volume for the chart bar. This provides you with more context to evaluate a bar's volume delta by showing it relative to the sum of intrabar volume. Note that because of the reasons explained in the "NOTES" section further down, the total volume is the sum of all intrabar volume rather than the volume of the bar at the chart's timeframe.
Total volume candles can be configured with their own up and down colors. You can also control the opacity of their bodies to make them more or less prominent. This publication's chart shows the indicator with total volume candles. They are turned off by default, so you will need to choose to display them in the script's inputs for them to plot.
Divergences
Divergences occur when the polarity of volume delta does not match that of the chart bar. You can identify divergences by coloring the CVD candles differently for them, or by coloring the indicator's background.
Information box
An information box in the lower-left corner of the indicator displays the HTF used for resets, the LTF used for intrabars, and the average quantity of intrabars per chart bar. You can hide the box using the script's inputs.
█ INTERPRETATION
The first thing to look at when analyzing CVD candles is the side of the zero line they are on, as this tells you if CVD is generally bullish or bearish. Next, one should consider the relative position of successive candles, just as you would with a price chart. Are successive candles trending up, down, or stagnating? Keep in mind that whatever trend you identify must be considered in the context of where it appears with regards to the zero line; an uptrend in a negative CVD (below the zero line) may not be as powerful as one taking place in positive CVD values, but it may also predate a movement into positive CVD territory. The same goes with stagnation; a trader in a long position will find stagnation in positive CVD territory less worrisome than stagnation under the zero line.
After consideration of the bigger picture, one can drill down into the details. Exactly what you are looking for in markets will, of course, depend on your trading methodology, but you may find it useful to:
• Evaluate volume delta for the bar in relation to price movement for that bar.
• Evaluate the proportion that volume delta represents of total volume.
• Notice divergences and if the chart's candle shape confirms a hesitation point, as a Doji would.
• Evaluate if the progress of CVD candles correlates with that of chart bars.
• Analyze the wicks. As with price candles, long wicks tend to indicate weakness.
Always keep in mind that unless you have chosen not to reset it, your CVD resets for each period, whether it is fixed or automatically stepped. Consequently, any trend from the preceding period must re-establish itself in the next.
█ NOTES
Know your volume
Traders using volume information should understand the volume data they are using: where it originates and what transactions it includes, as this can vary with instruments, sectors, exchanges, timeframes, and between historical and realtime bars. The information used to build a chart's bars and display volume comes from data providers (exchanges, brokers, etc.) who often maintain distinct feeds for intraday and end-of-day (EOD) timeframes. How volume data is assembled for the two feeds depends on how instruments are traded in that sector and/or the volume reporting policy for each feed. Instruments from crypto and forex markets, for example, will often display similar volume on both feeds. Stocks will often display variations because block trades or other types of trades may not be included in their intraday volume data. Futures will also typically display variations.
Note that as intraday vs EOD variations exist for historical bars on some instruments, differences may also exist between the realtime feeds used on intraday vs 1D or greater timeframes for those same assets. Realtime reporting rules will often be different from historical feed reporting rules, so variations between realtime feeds will often be different from the variations between historical feeds for the same instrument. The Volume X-ray indicator can help you analyze differences between intraday and EOD volumes for the instruments you trade.
If every unit of volume is both bought by a buyer and sold by a seller, how can volume delta make sense?
Traders who do not understand the mechanics of matching engines (the exchange software that matches orders from buyers and sellers) sometimes argue that the concept of volume delta is flawed, as every unit of volume is both bought and sold. While they are rigorously correct in stating that every unit of volume is both bought and sold, they overlook the fact that information can be mined by analyzing variations in the price of successive ticks, or in our case, intrabars.
Our calculations model the situation where, in fully automated order handling, market orders are generally matched to limit orders sitting in the order book. Buy market orders are matched to quotes at the ask level and sell market orders are matched to quotes at the bid level. As explained earlier, we use the same logic when comparing intrabar prices. While using intrabar analysis does not produce results as precise as when individual transactions — or ticks — are analyzed, results are much more precise than those of methods using only chart prices.
Not only does the concept underlying volume delta make sense, it provides a window on an oft-overlooked variable which, with price and time, is the only basic information representing market activity. Furthermore, because the calculation of volume delta also uses price and time variations, one could conceivably surmise that it can provide a more complete model than ones using price and time only. Whether or not volume delta can be useful in your trading practice, as usual, is for you to decide, as each trader's methodology is different.
For Pine Script™ coders
As our latest Polarity Divergences publication, this script uses the recently released request.security_lower_tf() Pine Script™ function discussed in this blog post . It works differently from the usual request.security() in that it can only be used at LTFs, and it returns an array containing one value per intrabar. This makes it much easier for programmers to access intrabar information.
Look first. Then leap.

Market Profile Fixed ViewSome instruments does not provide any volume information, therefore, as a fixed volume profile user, I needed a fixed market profile indicator to use the same principles, regardless of whether the volumes are available or not.
This script draws a market profile histogram corresponding to price variations within a specific duration, you only need to specify Start and End date/time values to see the histogram on your chart.
Details
Two lines corresponding to highest/lowest prices are displayed around the histogram
The redline corresponds to the POC (point of control)
Options
Start calculation
End calculation
Bars number (histogram resolution, currently locked to a max value of 50 bars)
Display side/Width (allows to modify size of bars, to the left or to the right)
Bars/Borders/POC Color customization
Notes
This script will probably be updated (to add VAH/VAL zones, and maybe other options). However, some common market profile attributes have not been implemented yet since I don't really use them)

Elite Cumulative Volume Delta OscillatorOverview
The Elite CVD+ is a premium-grade, session-resettable Cumulative Volume Delta indicator designed exclusively for professional futures and volume-profile traders. By focusing on the cleaner and more actionable Line-Focused mode, it transforms raw order flow data into a precise decision engine that reveals institutional buying/selling pressure, absorption, exhaustion, and high-probability reversal/continuation zones.
Unlike standard CVD tools that accumulate indefinitely or reset awkwardly, this version resets cleanly at your chosen anchor period (default daily) while pulling granular delta from lower timeframes when desired. The result: a smooth, non-repainting line that highlights real-time shifts in aggressive participation without the noise of perpetual accumulation.
Why This Indicator Is Elite-Level Useful
True Institutional Footprint
Cumulative Volume Delta measures the net aggressive buying (bid hits) vs. selling (ask hits). Sustained positive CVD = buyers in control; negative = sellers dominating. When price makes new highs on weakening CVD → classic bearish divergence signaling distribution. The session reset prevents old data from distorting current conviction, making divergences far more reliable than perpetual CVD.
Early Reversal Detection via Absorption & Extremes
Absorption highlighting flags scenarios where heavy delta pushes against price but price refuses to follow (e.g., massive selling into lows yet price holds or closes higher) — textbook trapping/retail stop-hunting.
Session CVD extremes with dynamic test zones pinpoint where aggressive flow is exhausted. Price returning to test these levels often produces high-R:R reversals.
Confluence-Rich Signals
Dual EMAs provide trend/filter context (crossovers, zero-line bounces). Dynamic coloring instantly shows momentum strength. Extreme single-bar delta highlights climax buying/selling. Built-in regular + hidden divergences align order flow with price structure.
Multi-Timeframe Consistency
Optional custom lower-TF delta fetch ensures the same granular data regardless of chart timeframe — critical for traders who switch between 1-min execution charts and 15-min/1H analysis charts.
Clean, Low-Lag Visuals
Thick CVD line with intelligent coloring, subtle backgrounds, persistent extreme lines, and optional labels keep the pane readable even during fast markets. No clutter from inferior candle representations.
How Professional Traders Use Elite CVD+ Most Successfully
Primary Setup Framework
Use on futures with reliable volume delta (ES, NQ, YM, CL, GC, etc.). Best timeframes: 3–15 minutes for intraday, 1H–4H for swing. Combine with price action structure (order blocks, fair value gaps, market profile highs/lows).
Practical Tips for Maximum Edge
Anchor Period: '1D' for regular session trading (resets at 00:00 exchange time). Use '1W' for weekly bias or '4H' for London/NY session-specific flow.
Lower Timeframe Delta: Enable custom and set to '1' or '3' for maximum granularity on indices. Leave disabled on higher charts for smoother read.
Absorption Tuning: Raise threshold to 80–90 on volatile instruments (NQ) to filter noise; lower to 70 on quieter ones (CL, GC).
Divergences: Most powerful on 15M+. Disable hidden on very low TFs if too noisy.
Alerts: Use the master “Any Event” alert for push/email/webhook notifications of zero crosses or new extremes — perfect for mobile monitoring.
Combination Tools: Pair with session VWAP, volume profile (fixed range at highs/lows), or psychological levels for triple confluence.

Trendlines & SR ZonesIt's a comprehensive indicator (Pine Script v6) that represents two powerful technical analysis tools: automatic trendline detection based on pivot points and volume delta analysis with support/resistance zone identification. This overlay indicator helps traders identify potential trend directions and key price levels where significant buying or selling pressure has occurred.
Features: =
1. Price Trendlines
The indicator automatically identifies and draws trendlines based on pivot points, creating dynamic support and resistance levels.
Key Components:
Pivot Detection: Uses configurable left and right bars to identify significant pivot highs and lows
Trendline Filtering: Only draws downward-sloping resistance trendlines and upward-sloping support trendlines
Zone Creation: Creates filled zones around trendlines based on average price volatility
Automatic Management: Maintains only the 3 most recent significant trendlines to avoid chart clutter
Customization Options:
Left/Right Bars for Pivot: Adjust sensitivity of pivot detection (default: 10 bars each side)
Extension Length: Control how far trendlines extend past the second pivot (default: 50 bars)
Average Body Periods: Set the lookback period for volatility calculation (default: 100)
Tolerance Multiplier: Adjust the width of the trendline zones (default: 1.0)
Color Customization: Separate colors for high (resistance) and low (support) trendlines and their fills
2. Volume Delta % Bars
The indicator analyzes volume distribution across price levels to identify significant supply and demand zones.
Key Components:
Volume Profile Analysis: Divides the price range into rows and calculates volume delta at each level
Delta Visualization: Displays horizontal bars showing the percentage difference between buying and selling volume
Zone Identification: Automatically identifies the most significant supply and demand zones
Visual Integration: Connects volume delta bars with corresponding support/resistance zones on the price chart
Customization Options:
Lookback Period: Set the number of bars to analyze for volume (default: 200)
Price Rows: Control the granularity of the volume analysis (default: 50 rows)
Delta Sections: Adjust the number of horizontal delta bars displayed (default: 20)
Panel Appearance: Customize width, position, and direction of the delta panel
Zone Settings: Control the number of supply/demand zones and their extension (default: 3 zones)
How It Works-
Trendline Logic:
The script continuously scans for pivot highs and lows based on the specified left and right bars
When a pivot is detected, it creates a horizontal line at that price level
The script then looks for the previous pivot of the same type (high or low)
It connects these pivots with a trendline, extending it based on the user-specified setting
A parallel line is created to form a zone, with the distance based on average price volatility
The script filters out invalid trendlines (upward-sloping resistance and downward-sloping support). Only the 3 most recent trendlines are maintained to prevent chart clutter
Volume Delta Logic:
The script divides the price range over the lookback period into the specified number of rows
For each bar in the lookback period, it categorizes volume as bullish (close > open) or bearish (close < open). This volume is assigned to the appropriate price level based on the HLC3 price.
The price levels are grouped into sections, and the net delta (bullish - bearish volume) is calculated for each Horizontal bars are drawn to represent these delta percentages.
The most significant positive and negative deltas are identified and displayed as support and resistance zones. These zones are extended to the left on the price chart and connected to the delta panel with dotted lines.
Ideal Timeframes:
The indicator is versatile and can be used across multiple timeframes, but it performs optimally on specific timeframes depending on your trading style:
For Day Trading:
Optimal Timeframes: 15-minute to 1-hour charts
Why: These timeframes provide a good balance between noise reduction and sufficient volume data. The volume delta analysis is particularly effective on these timeframes as it captures intraday accumulation/distribution patterns while the trendlines remain reliable enough for intraday trading decisions.
For Swing Trading:
Optimal Timeframes: 1-hour to 4-hour charts
Why: These timeframes offer the best combination of reliable trendline formation and meaningful volume analysis. The trendlines on these timeframes are less prone to whipsaws, while the volume delta analysis captures multi-day trading sessions and institutional activity.
For Position Trading:
Optimal Timeframes: Daily and weekly charts
Why: On these higher timeframes, trendlines become extremely reliable as they represent significant market structure points. The volume delta analysis reveals longer-term accumulation and distribution patterns that can define major support and resistance zones for weeks or months.
Timeframe-Specific Adjustments:
Lower Timeframes (1-15 minutes):
Reduce left/right bars for pivots (5-8 bars)
Decrease lookback period for volume delta (50-100 bars)
Increase tolerance multiplier (1.2-1.5) to account for higher volatility
Higher Timeframes (Daily+):
Increase left/right bars for pivots (15-20 bars)
Extend lookback period for volume delta (300-500 bars)
Consider increasing the number of price rows (70-100) for more detailed volume analysis
Usage Guidelines-
For Trendline Analysis:
Use the trendlines as dynamic support and resistance levels
Price reactions at these levels can indicate potential trend continuation or reversal points
The filled zones around trendlines represent areas of price volatility or uncertainty
Consider the slope of the trendline as an indication of trend strength
For Volume Delta Analysis:
The horizontal delta bars show where buying or selling pressure has been concentrated
Green bars indicate areas where buying volume exceeded selling volume (demand)
Red bars indicate areas where selling volume exceeded buying volume (supply)
The highlighted supply and demand zones on the price chart represent significant price levels
These zones can act as future support or resistance areas as price revisits them
Customization Tips:
Trendline Sensitivity: Decrease left/right bars values to detect more pivots (more sensitive) or increase them for fewer, more significant pivots
Zone Width: Adjust the tolerance multiplier to make trendline zones wider or narrower based on your trading style
Volume Analysis: Increase the lookback period for a longer-term volume profile or decrease it for more recent activity
Visual Clarity: Adjust colors and transparency settings to match your chart theme and preferences
Conclusion:
This indicator provides traders with a comprehensive view of both trend dynamics and volume-based support/resistance levels. With these two analytical approaches, the indicator offers valuable insights for identifying potential entry and exit points, trend strength, and key price levels where significant market activity has occurred. The extensive customization options allow traders to adapt the indicator to various trading styles and timeframes, with optimal performance on 15-minute to daily charts depending on their trading horizon.
Chart Attached: NSE HINDZINC, EoD 12/12/25
DISCLAIMER: This information is provided for educational purposes only and should not be considered financial, investment, or trading advice. Please do boost if you like it. Happy Trading.
