RSI Breakout Zones█ OVERVIEW
“RSI Breakout Zones” is a technical analysis tool that identifies significant zones on the chart based on the Relative Strength Index (RSI). The indicator maps overbought (OB) and oversold (OS) zones using boxes, then extends them until the next zone of the same type is detected, highlighting breakout points to aid in trade entry decisions. These zones often serve as areas of consolidation, support, or resistance.
█ CONCEPTS
The indicator identifies overbought (above 70) and oversold (below 30) zones, drawing boxes that extend until the next zone of the same type (OB for OB, OS for OS) is detected. Breakout signals are generated when the price crosses the zone boundaries, indicating potential shifts in market momentum.
Why are RSI zones important? These zones represent areas of extreme market sentiment, often leading to corrections or reversals. Overbought zones suggest potential selling pressure, while oversold zones indicate buying opportunities. After a breakout, a zone may switch roles, e.g., from support to resistance or vice versa, making it a key element in price action analysis. Larger zones, formed during high volatility, may attract price for retests due to stronger imbalances in buyer/seller dynamics. Consolidation often occurs within these zones as the market seeks equilibrium before further moves. However, in strong trends, zones may be decisively broken without immediate pullbacks, and their significance depends on their position relative to key support and resistance levels.
█ FEATURES
- RSI Zone Detection: Calculates RSI with a customizable length (default 14) and identifies overbought/oversold zones based on user-defined levels (default 70/30), drawing boxes that dynamically adjust to price action within the zone.
- Customizable Boxes: Zones extend until the next zone of the same type is detected. The indicator draws zones with adjustable colors for overbought (red) and oversold (green) areas, with options for box and zone transparency.
- Breakout Signals: Generates upward (green triangle) and downward (red triangle) breakout signals when the price crosses the top or bottom of a zone. Signals appear below or above the bar, indicating potential trade entry points.
- Midline: Automatically draws a dashed line at the midpoint of each zone, helping traders assess price behavior within the zone and potential halfway retests.
- Box Management: Option to remove outdated boxes.
- Alerts: Built-in support for alerts on breakout signals, enabling traders to receive notifications for key zone crossings.
█ HOW TO USE
Add to Chart: Apply the indicator to your TradingView chart via the Pine Editor or Indicators menu.
Configure Settings:
- RSI Settings: Adjust RSI Length (default 14), Overbought Level (default 70), and Oversold Level (default 30) to tailor zone detection sensitivity—higher lengths smooth signals for longer-term analysis.
- Box Settings: Configure colors and transparency for overbought (red) and oversold (green) zones, including box transparency (default 90) and zone transparency (default 90).
- Signal Settings: Customize breakout signal colors (green for upward, red for downward) and enable/disable keeping boxes after RSI normalization.
Interpreting Signals:
- Upward Breakout Signal: A green triangle below the bar indicates a breakout, suggesting potential bullish momentum and trend continuation or reversal.
- Downward Breakout Signal: A red triangle above the bar indicates a breakout, suggesting potential bearish momentum.
- RSI Zones: If the price re-enters a zone after a breakout, it may signal a false breakout or consolidation; persistent zones can act as future support/resistance levels. Consolidation often occurs within these zones as the market seeks equilibrium.
- Use signals alongside other technical analysis tools for confirmation, such as moving averages (to confirm trend direction), Fibonacci levels (to identify key price zones), or volume indicators (to validate breakout strength). Analyze RSI zones on higher timeframes for stronger signals due to broader market context.
█ APPLICATIONS
- Momentum Trading: Use RSI zones as overbought/oversold filters. In an uptrend, look for buying opportunities on upward breakouts, and in a downtrend, on downward breakouts. Combining with MACD crossovers, Fibonacci levels, or pivot points enhances zone significance.
- Inter-Zone Trading: Utilize breakouts from one RSI zone and hold the position until reaching the next zone, which may act as a target level or reversal point.
█ NOTES
- Test the indicator across different timeframes and markets (stocks, forex, crypto) to optimize RSI length and levels for your trading style.
- For best results, use in trending markets where RSI extremes are more predictive; in ranging markets, additional filters are recommended to reduce false signals.
- Always combine with risk management; RSI zones alone do not guarantee reversals, and false breakouts may occur in low-liquidity environments.
Pesquisar nos scripts por "RSI"

RSI: chart overlay
This indicator maps RSI thresholds directly onto price. Since the EMA of price aligns with RSI’s 50-line, it draws a volatility-based band around the EMA to reveal levels such as 70 and 30.
By converting RSI values into visible price bands, the overlay lets you see exactly where price would have to move to hit traditional RSI boundaries. These bands adapt in real time to both price movement and market volatility, keeping the classic RSI logic intact while presenting it in the context of price action. This approach helps traders interpret RSI signals without leaving the main chart window.
The calculation uses the same components as the RSI: alternative derivation script: Wilder’s EMA for smoothing, a volatility-based unit for scaling, and a normalization factor. The result is a dynamic band structure on the chart, representing RSI boundary levels in actual price terms.
Key components and calculation breakdown:
Wilder’s EMA
Used as the anchor point for measuring price position.
myEMA = ta.rma(close, Length)
Volatility Unit
Derived from the EMA of absolute close-to-close price changes.
CC_vol = ta.rma(math.abs(close - close ), Length)
Normalization Factor
Scales the volatility unit to align with the RSI formula’s structure.
normalization_factor = 1 / (Length - 1)
Upper and Lower Boundaries
Defines price bands corresponding to selected RSI threshold values.
up_b = myEMA + ((upper - 50) / 50) * (CC_vol / normalization_factor)
down_b = myEMA - ((50 - lower) / 50) * (CC_vol / normalization_factor)
Inputs
RSI length
Upper boundary – RSI level above 50
Lower boundary – RSI level below 50
ON/OFF toggle for 50-point line (EMA of close prices)
ON/OFF toggle for overbought/oversold coloring (use with line chart)
Interpretation:
Each band on the chart represents a chosen RSI level.
When price touches a band, RSI is at that threshold.
The distance between moving average and bands adjusts automatically with volatility and your selected RSI length.
All calculations remain fully consistent with standard RSI values.
Feedback and code suggestions are welcome, especially regarding implementation efficiency and customization.

RSI Multi Time FrameWhat it is
A clean, two-layer RSI that shows your chart-timeframe RSI together with a higher-timeframe (HTF) RSI on the same pane. The HTF line is drawn as a live segment plus frozen “steps” for each completed HTF bar, so you can see where the higher timeframe momentum held during your lower-timeframe bars.
How it works
Auto HTF mapping (when “Auto” is selected):
Intraday < 30m → uses 60m (1-hour) RSI
30m ≤ tf < 240m (4h) → uses 240m (4-hour) RSI
240m ≤ tf < 1D → uses 1D RSI
1D → uses 1W RSI
1W or 2W → uses 1M RSI
≥ 1M → keeps the same timeframe
The HTF series is requested with request.security(..., gaps_off, lookahead_off), so values are confirmed bar-by-bar. When a new HTF bar begins, the previous value is “frozen” as a horizontal segment; the current HTF value is shown by a short moving segment and a small dot (so you can read the last value easily).
Visuals
Current RSI (chart TF): solid line (color/width configurable).
HTF RSI: same-pane line + tiny circle for the latest value; historical step segments show completed HTF bars.
Guides: dashed 70 / 30 bands, dotted 60/40 helpers, dashed 50 midline.
Inputs
Higher Time Frame: Auto or a fixed TF (1, 3, 5, 10, 15, 30, 45, 60, 120, 180, 240, 360, 480, 720, D, W, 2W, M, 3M, 6M, 12M).
Length: RSI period (default 14).
Source: price source for RSI.
RSI / HTF RSI colors & widths.
Number of HTF RSI Bars: how many frozen HTF segments to keep.
Reading it
Alignment: When RSI (current TF) and HTF RSI both push in the same direction, momentum is aligned across frames.
Divergence across frames: Current RSI failing to confirm HTF direction can warn about chops or early slowdowns.
Zones: 70/30 boundaries for classic overbought/oversold; 60/40 can be used as trend bias rails; 50 is the balance line.
This is a context indicator, not a signal generator. Combine with your entry/exit rules.
Notes & limitations
HTF values do not repaint after their bar closes (lookahead is off). The short “live” segment will evolve until the HTF bar closes — this is expected.
Very small panels or extremely long histories may impact performance if you keep a large number of HTF segments.
Credits
Original concept by LonesomeTheBlue; Pine v6 refactor and auto-mapping rules by trading_mura.
Suggested use
Day traders: run the indicator on 5–15m and keep HTF on Auto to see 1h/4h momentum.
Swing traders: run it on 1h–4h and watch the daily HTF.
Position traders: run on daily and watch the weekly HTF.
If you find it useful, a ⭐ helps others discover it.

RSI Z-score | Lemniscuss🧠 Introducing RSI Z-Score (RSI-Z) by Lemniscuss
🛠️ Overview
RSI Z-Score (RSI-Z) is a momentum-based market condition detector that transforms the classic Relative Strength Index (RSI) into a standardized volatility framework.
By applying Z-Score normalization to the RSI, this tool allows traders to identify statistically significant deviations in momentum — cutting through noise and highlighting high-probability turning points.
RSI-Z is optimized for trend inflection detection and overextension spotting, providing both visual clarity and actionable trade signals with dynamic labeling and optional bar coloring.
🔍 How It Works
1️⃣ RSI Foundation
The system starts with a standard RSI calculation on a user-defined source and length (default: 45).
2️⃣ Z-Score Normalization
The RSI values are standardized by subtracting their mean and dividing by the standard deviation over the same lookback.
This converts RSI into a statistical measure — revealing how many standard deviations current momentum is from its mean.
3️⃣ Threshold Logic
Two customizable thresholds define actionable zones:
• Long Threshold → Signals bullish momentum shifts when crossed upward
• Short Threshold → Signals bearish momentum shifts when crossed downward
4️⃣ Signal State Tracking
A state variable locks in a bias (Long / Short / Neutral) until an opposing trigger appears, ensuring clear and consistent market bias mapping.
✨ Key Features
🔹 Statistically Driven Momentum Detection — Moves beyond fixed RSI overbought/oversold levels by using standard deviations for adaptive accuracy.
🔹 Customizable Thresholds — Fine-tune long/short triggers for different volatility environments.
🔹 Clear Visual Feedback — Candle coloring and signal labels make trade setups instantly recognizable.
🔹 Overlay-Friendly — Works directly on your main chart or in a separate pane.
⚙️ Custom Settings
• Source: Price stream for RSI calculation (default: close)
• RSI Length: Lookback period for RSI & Z-Score (default: 45)
• Long Threshold: Z-score value for bullish signal (default: 1)
• Short Threshold: Z-score value for bearish signal (default: -1.9)
• Long/Cash Signal Labels: Toggle for "Long"/"Short" markers
• Bar Coloring: Toggle for trend-based candle coloring
📌 Trading Applications
✅ Trend Reversals → Spot statistically significant shifts in momentum before traditional RSI signals trigger
✅ Overextension Monitoring → Identify when momentum has deviated too far from the mean
✅ Mean Reversion Setups → Use extreme Z-score values as potential reversion points
✅ Bias Confirmation → Combine with trend tools for higher conviction entries/exits
📌 Conclusion
RSI-Z by Lemniscuss offers a clean, statistics-backed upgrade to the classic RSI.
By framing momentum in standard deviation terms, it empowers traders to separate normal fluctuations from truly significant market moves — making it a valuable tool for both trend traders and mean reversion specialists.
🔹 Summary Highlights
1️⃣ Statistical upgrade to RSI for higher-quality signals
2️⃣ Threshold-based, customizable long/short triggers
3️⃣ Visual candle coloring & signal labels for clarity
4️⃣ Adaptable to trend, swing, or intraday strategies
📌 Disclaimer: Past performance is not indicative of future results. No indicator guarantees profitability — always test and manage risk appropriately.

RSI Divergence StrategyOverview
The RSI Divergence Strategy Indicator is a trading tool that uses the RSI and divergences created to generate high-probability buy and sell signals.
I have provided the best formula of numbers to use for BTC on a 30 minute timeframe.
You can change where on RSI you enter and exit both long or short trades. This way you can experiment on different tokens using different entry/exit points. Can use on multiple timeframes.
This strategy is designed to open and close long or short trades based on the levels you provide it. You can then check on the RSI where the best levels are for each token you want to trade and amend it as required to generate a profitable strategy.
How It Works
The RSI Divergence Strategy Indicator uses bear and bull divergences in conjuction with a level you have input on the RSI.
RSI for Overbought/Oversold:
• Input variables for entry and exit levels and when the entry levels combine with a bear or bull divergence signal, a trade is alerted.
RSI Divergence:
• Buy and sell signals are confirmed when the RSI creates bearish or bullish divergences and these divergences are in the same area as your levels you input for entry to short or long.
After 7 years of experience and testing I have calculated the exact numbers required and produced a formula to calculate the exact input variables for a 30 minute Bitcoin chart.
Key Features
1️⃣ Divergence Identification – Ensures trades are taken only when a bull or bear divergence has formed.
2️⃣ Overbought/Oversold Input Filtering – Set up your own variables on the RSI for different markets after identifying patterns on the RSI in relation to a bearish or bullish divergence.
3️⃣ Works on any chart – Suitable for all markets and timeframes once you input the correct variables for entry and exit levels.
How to Use
🟢 Basic Trading:
• Use on any timeframe.
• Enter trade only when alert has fired off. Close when it says to exit.
• Change entry and exit levels in the properties of the strategy indicator.
• Make entry and exit levels coincide with bearish or bullish divergences on the RSI.
Check the strategy tester to see backtesting so you know if the indicator is profitable or not for that market and timeframe as each crypto token is different and so is the timeframe you choose.
📢 Webhook Automation:
• Set up TradingView Alerts to auto-execute trades via Webhook-compatible platforms.
Key additions for divergence visualization:
Divergence Arrows:
Bullish divergence: Green label with white 'bull ' text
Bearish divergence: Red label with white 'bear' text
Positioned at the pivot point
Divergence Lines:
Connects consecutive RSI pivot points
Automatically drawn between consecutive pivot points
Enhanced RSI Coloring:
Overbought zone: Red
Oversold zone: Green
Neutral zone: Gray
The visualization helps you instantly spot:
Where divergences are forming on the RSI
The pattern of higher lows (bullish) or lower highs (bearish)
Contextual coloring of RSI relative to standard levels
All divergence markers appear at the correct historical pivot points, making it easy to visually confirm divergence patterns as they develop.
Strategy levels and background zones also shown to help visual look.
Why This Combination?
This indicator is just a simple RSI tool.
It is designed to filter out weak trades and only execute trades that have:
✅ RSI Divergence
✅ Overbought or Oversold Conditions
It does not calculate downtrends or bear markets so care is recommended taking long trades during these times.
Why It’s Worth Using?
📈 Open Source – Free to use and learn from.
📉 Long or Short Term Trading Style – Entry/Exit parameters options are designed for both short or long term trades allowing you to experiment until you find a profitable strategy for that market you want to trade.
📢 Seamless Webhook Automation – Execute trades automatically with TradingView alerts.
💲 Ready to trade smarter?
✅ Add the RSI Divergence Strategy Indicator to your TradingView chart.

RSI Strength & Consolidation Zones (Zeiierman)█ Overview
RSI Strength & Consolidation Zones (Zeiierman) is a hybrid momentum and volatility visualization tool that blends enhanced RSI interpretation with ADX-driven consolidation detection. This indicator doesn't just show where RSI is trending — it interprets how strong that trend is, when that strength changes, and where the market may be consolidating in anticipation of breakout movement.
Using a combination of Kalman-filtered RSI, custom-built DMI/ADX, and low-volatility zone recognition, it gives traders a dynamic RSI with strength-based coloring, while also highlighting consolidation zones to spot breakout opportunities.
█ Its uniqueness
Traditional RSI indicators lack context. They may show you when the market is overbought or oversold, but they won’t tell you how strong that condition is, or whether it’s likely to result in continuation or consolidation.
This tool aims to solve that by introducing adaptive strength metrics and structural compression zones, allowing traders to anticipate when the market is likely preparing for a move.
█ How It Works
⚪ Enhanced RSI
Combines traditional RSI and a custom RSI implementation
Smooths both through a Kalman filter for trend direction
Final RSI line reflects smoothed consensus between manual and built-in RSI
Adds an RSI + Strength overlay to show when the directional conviction is increasing
⚪ ADX-Driven Strength Layer
Directional Movement Index (DMI) is calculated both manually and with built-in smoothing
The average ADX value is used to calculate a strength modifier
When ADX exceeds 20, RSI is dynamically enhanced or dampened to reflect directional force
Resulting visual: RSI appears stronger or weaker based on confirmed trend conditions
⚪ Consolidation Zone Detection
When ADX falls below 20, the indicator enters a consolidation zone state
Boxes are drawn dynamically to contain the price within these low-volatility structures
Once the price breaks out of the zone, the indicator plots a breakout signal (▲ or ▼)
⚪ Breakouts
Breakout markers are placed at the first close outside the consolidation box
These signals serve as early indicators for potential trend continuation or reversal
█ How to Use
⚪ Confirm Momentum Strength
Use the RSI + Strength line to determine whether current momentum is backed by trend conviction. If strength expands alongside rising RSI, the move has confirmation.
⚪ Consolidations Zones
When RSI is around the midline, and a consolidation box appears, expect lower volatility and a range-bound market, followed by a breakout.
⚪ Use Breakout Signals for Entry
Look for ▲ or ▼ markers as early triggers. These often coincide with volume expansions or structural breaks.
█ Settings Explained
RSI Length – Number of bars used for RSI. Shorter = more sensitive.
DMI Length – Used in both custom and built-in ADX/DI calculations.
ADX Smoothing – Smooths the trend strength signal. Higher values = smoother strength detection.
Trend Confirmation (Filter Strength) – Adjusts the responsiveness of the Kalman filter.
-----------------
Disclaimer
The content provided in my scripts, indicators, ideas, algorithms, and systems is for educational and informational purposes only. It does not constitute financial advice, investment recommendations, or a solicitation to buy or sell any financial instruments. I will not accept liability for any loss or damage, including without limitation any loss of profit, which may arise directly or indirectly from the use of or reliance on such information.
All investments involve risk, and the past performance of a security, industry, sector, market, financial product, trading strategy, backtest, or individual's trading does not guarantee future results or returns. Investors are fully responsible for any investment decisions they make. Such decisions should be based solely on an evaluation of their financial circumstances, investment objectives, risk tolerance, and liquidity needs.

RSI HeartHere's an introduction you can use for your RSI Heart indicator:
---
### RSI Heart Indicator
The **RSI Heart Indicator** provides a visually engaging way to monitor and track the **Relative Strength Index (RSI)** across multiple timeframes (10m, 15m, 30m, and 1H). It not only shows the RSI value but also uses heart-shaped symbols to reflect the current market condition based on RSI levels, making it easier to understand the strength and momentum of a given asset at a glance.
### Key Features:
- **Multi-Timeframe Support**: The indicator pulls the RSI values from multiple timeframes (10 minutes, 15 minutes, 30 minutes, and 1 hour) so you can analyze market strength at different intervals in one view.
- **Heart Symbols**: RSI values are displayed alongside heart emojis (❤️, 💛, 💚) that provide a visual cue for the market condition:
- **❤️ (Overbought or Oversold)**: When RSI is below 27 or above 73.
- **💛 (Near Oversold/Overbought)**: When RSI is between 27-30 or 70-73.
- **💚 (Neutral)**: When RSI is between 30 and 70.
- **Customizable Visibility**: Toggle visibility for each timeframe's RSI using simple on/off settings, giving you control over which timeframes are displayed in your chart.
### How it Can Help:
- **Quick Market Sentiment Analysis**: The heart symbols and RSI values allow you to quickly assess whether an asset is in an overbought or oversold condition.
- **Multi-Timeframe RSI**: By viewing RSI across multiple timeframes, you can gain a more comprehensive understanding of market momentum and strength.
- **Personalized to Your Preferences**: Adjust the settings to only show the timeframes that matter most to you, creating a customized and clean chart view.
This indicator helps traders make more informed decisions by providing a clear, easy-to-read representation of market conditions across various timeframes, all within one indicator.
---
This introduction explains what the indicator does, its features, and how it can benefit traders in a concise and easy-to-understand way.

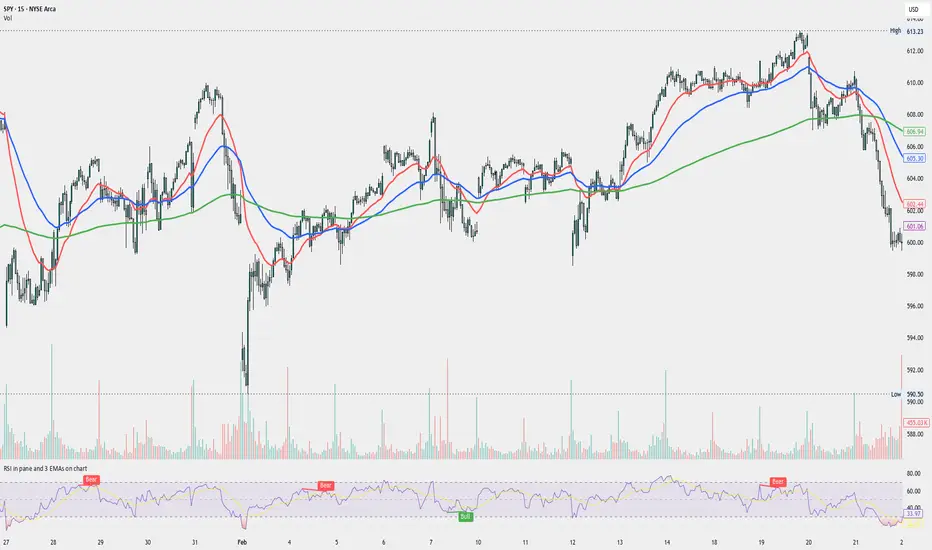
RSI in pane and 3 EMAs on chartCustom RSI in Pane + 3 EMAs on Chart — with Optional RSI Divergence Detection
Combines RSI in a separate pane with 3 EMAs on the chart and optional RSI-based divergence detection. Useful for analyzing both momentum and trend structure.
Features
RSI Pane
Custom RSI calculation (not built-in ta.rsi) with adjustable source and length
Overlay optional moving average (SMA, EMA, SMMA/RMA, WMA, VWMA, or Bollinger Bands) Overbought/oversold gradient fill for visual clarity (70 / 30 zones)
Midline (50) for neutral RSI territory
RSI Divergence Detection
Optional: toggle on/off with one input
Regular Bullish Divergence : Price makes a lower low, RSI makes a higher low
Regular Bearish Divergence : Price makes a higher high, RSI makes a lower high
Customizable lookback for pivot detection
Visual markers and labels plotted on RSI
Built-in alert conditions for both divergence types
3 EMA Trend Indicators on Price Chart
Three customizable EMAs (default: 20, 50, 200)
Color-coded and clearly plotted on main chart
Use to determine short/mid/long-term trend bias
No repainting or smoothing artifacts
Why use this script?
Gives a full view of trend + momentum without cluttering the main price chart, and it helps confirm entries and exits by observing RSI behavior alongside EMAs. The optional divergence detection can act as a signal for potential exhaustion or reversal (not entry signals on their own). It is a Good fit for traders who use RSI zones, divergences, and EMA structure in their decision-making, both for intra-day and swing trades (where it performs best).
How to use
Add this script to your chart. EMAs will appear on the main price chart; RSI and divergence will appear in a separate pane.
Adjust RSI and MA settings to fit your trading style (e.g., fast RSI for scalping, slower for swing)
Enable "Show Divergence" if you want visual alerts and markers
Use alerts to get notified when a divergence occurs without watching the chart
Always check the divergences on different time frames to validate the setup, and do not consider them valid on small time frames (<15 minutes).
Built for traders who want both momentum and trend context in a single tool — without clutter, repainting, or noise. I created this script to streamline my own analysis and avoid switching between multiple indicators. It's not meant to be a "signal generator" but a visual assistant for making better decisions. If you find it useful or have feedback, feel free to reach out.
RSI VWAP POC [Uncle Sam Trading]Category: Oscillators, Volume, Market Profile
Timeframe: Suitable for all timeframes
Markets: Crypto, Forex, Stocks, Commodities
Overview
The RSI VWAP POC indicator is a powerful and innovative oscillator that combines the Relative Strength Index (RSI), Volume-Weighted Average Price (VWAP), and Point of Control (POC) from market profile analysis. Designed to provide traders with clear, high-probability trading signals, this indicator helps you identify key market levels, spot overbought/oversold conditions, and time your entries and exits with precision. Whether you’re a day trader, swing trader, or scalper, this free tool adds significant value to your trading strategy by offering a unique blend of momentum, volume, and market profile insights.
How It Works
This indicator integrates three core components to deliver actionable insights:
RSI (Relative Strength Index): Measures momentum to identify overbought (above 70) and oversold (below 30) conditions, helping you anticipate potential reversals.
VWAP (Volume-Weighted Average Price): Calculates a volume-weighted price benchmark, which is used to compute a more accurate, volume-sensitive RSI. This ensures the indicator reflects true market dynamics.
POC (Point of Control): Derived from market profile analysis, the POC represents the price level with the highest traded volume in a session, acting as a critical support or resistance level.
The indicator plots a smoothed RSI based on VWAP, overlaid with market profile data on a user-defined higher timeframe (default: 4H). The POC is displayed as a red line, with aqua bars indicating the value area where the majority of trading volume occurred. When the RSI crosses the POC, the indicator generates clear buy and sell signals:
Strong Buy (SBU): RSI crosses above the POC in an oversold zone.
Strong Sell (SBD): RSI crosses below the POC in an overbought zone.
Additional features include:
Background colors to highlight bullish (green) or bearish (red) trends.
Shaded zones for overbought (70/60) and oversold (30/40) levels.
Customizable settings to fit your trading style and timeframe.
How This Indicator Adds Value
The RSI VWAP POC indicator offers several key benefits that enhance your trading performance:
High-Probability Signals: By combining RSI, VWAP, and POC, this indicator identifies trades at key market levels where price is likely to react, increasing your win rate.
Improved Timing: Clear buy and sell signals, such as ‘SBU’ and ‘SBD’, help you enter and exit trades at optimal points, maximizing profitability.
Risk Management: Overbought/oversold zones and trend confirmation via background colors help you avoid false signals, protecting your capital.
Versatility: Suitable for all markets (crypto, forex, stocks) and timeframes, making it a valuable tool for traders of all experience levels.
Time Efficiency: The indicator does the heavy lifting by analyzing momentum, volume, and market profile data, allowing you to focus on executing trades.
Real-World Performance Example: On a 1-hour Bitcoin chart with a 4-hour higher timeframe, this indicator identified a strong sell signal on April 6th at 12:00 ($82,000), leading to a 9% drop to $74,600. A subsequent strong buy signal on April 7th at 04:00 ($76,200) captured a 6% rise to $81,200 – a potential 25% profit with 5x leverage if exited at 5%.
How to Use
Add the Indicator: Search for “RSI VWAP POC ” in TradingView’s indicator library and add it to your chart.
Set Your Timeframe: The indicator works on any timeframe but is optimized for a 1-hour chart with a 4-hour higher timeframe (set in the settings).
Interpret Signals:
Look for ‘SBU’ (strong buy) labels when the RSI crosses above the POC in an oversold zone, indicating a potential buying opportunity.
Look for ‘SBD’ (strong sell) labels when the RSI crosses below the POC in an overbought zone, signaling a potential selling opportunity.
Use the background colors (green for bullish, red for bearish) to confirm the trend.
Combine with Your Strategy: Use the indicator alongside your existing analysis (e.g., support/resistance, candlestick patterns) for best results.
Settings and Customization
The indicator is highly customizable to suit your trading needs:
RSI Length (Default: 14): Adjust the sensitivity of the RSI. Use a shorter length (e.g., 10) for scalping, or a longer length (e.g., 20) for smoother signals.
EMA Smoothing Length (Default: 3): Smooths the RSI line. Increase to 5 or 7 for less choppy signals in volatile markets.
Higher Timeframe (Default: 240 minutes): Set to 240 (4 hours) for a 1-hour chart. Adjust based on your chart’s timeframe (e.g., 60 minutes for a 15-minute chart).
Value Area Percentage (Default: 100%): Defines the size of the value area around the POC. Lower to 70% for a tighter focus on key levels.
Overbought/Oversold Thresholds (Defaults: 70/30): Adjust these levels to match market conditions (e.g., 80/20 for trending markets).
Show POC Line (Default: True): Toggle the red POC line on or off.
Show Buy/Sell Signals: Enable ‘Show Strong Breakup Signals’ and ‘Show Strong Breakdown Signals’ to focus on high-probability trades.
Why Choose This Indicator?
The RSI VWAP POC indicator stands out by offering a unique combination of momentum, volume, and market profile analysis in a single, easy-to-use tool. It’s designed to help traders of all levels make informed decisions, reduce risk, and increase profitability. Whether you’re trading Bitcoin, forex pairs, or stocks, this indicator provides the clarity and precision you need to succeed.

RSI and CCICombined RSI and CCI Indicator for MetaTrader
The Combined RSI and CCI Indicator is a powerful hybrid momentum oscillator designed to merge the strengths of two popular indicators—the Relative Strength Index (RSI) and the Commodity Channel Index (CCI)—into a single, visually intuitive chart window. This tool enhances traders’ ability to identify overbought and oversold conditions, divergences, trend strength, and potential reversal zones with improved precision.
Purpose
By integrating RSI and CCI, this indicator helps filter out false signals that often occur when using each tool independently. It is especially useful for swing trading, trend confirmation, and spotting high-probability entry/exit zones. This dual-oscillator approach combines RSI’s relative momentum insights with CCI’s deviation-based analysis to produce a more reliable signal structure.
Key Features
Dual Oscillator Display: Plots both RSI and CCI on the same subwindow for easy comparison and correlation analysis.
Customizable Parameters:
RSI Period and Level (default: 14)
CCI Period and Typical Price Type (default: 20, TP)
Overbought/Oversold Levels for both indicators
Color-Coded Zones:
Background highlights when both RSI and CCI enter overbought/oversold territory, signaling high potential reversal zones.
Combined Signal Logic (Optional Feature):
Buy Signal: RSI < 30 and CCI < -100
Sell Signal: RSI > 70 and CCI > 100
These can be visualized as arrows or plotted as signal markers.
Trend Filter Overlay (Optional):
Can be combined with a moving average or price action filter to confirm trend direction before accepting signals.
Divergence Detection (Advanced Option):
Optional plotting of bullish or bearish divergence where both indicators diverge from price action.
Multi-Timeframe Compatibility:
Allows the use of higher timeframe RSI/CCI values to confirm signals on lower timeframes.
Benefits
Improved Signal Accuracy: Using both RSI and CCI together helps avoid false breakouts and whipsaws.
More Informed Decision-Making: Correlating momentum (RSI) with deviation (CCI) provides a well-rounded picture of market behavior.
Efficient Charting: Saves screen space and cognitive load by combining two indicators into one clean panel.
Scalable Strategy Integration: Can be used in discretionary trading or coded into automated strategies/alerts.
Use Case Example
In a ranging market, the indicator highlights zones where both RSI and CCI are oversold, alerting traders to potential bounce opportunities.
In trending markets, it confirms trend strength when RSI and CCI are both aligned with trend direction.
When RSI is diverging from price but CCI isn’t, it can be a clue of weakening momentum, helping traders scale out or avoid traps.
This combined indicator offers a versatile, high-performance toolset for traders looking to elevate their technical analysis by leveraging multiple momentum perspectives simultaneously.

RSI SiaThis script is a custom indicator for TradingView written in Pine Script version 5. It calculates the Relative Strength Index (RSI) and uses it to generate trading signals. Here's a breakdown of what the script does:
Key Features:
RSI Calculation:
The script calculates the RSI using a 14-period window.
It also calculates the momentum of the RSI over a 9-period window (rsi delta) and a simple moving average (SMA) of the RSI over a 3-period window (rsi sma).
Composite Index (CI):
The composite index is calculated as the sum of rsi delta and rsi sma.
Horizontal Lines and Zones:
Several horizontal lines are plotted at different levels (e.g., 20, 40, 60, 80, 120, 150, 180) to indicate overbought and oversold conditions.
Filled zones are created between certain levels to highlight areas of interest.
Moving Averages:
The script plots SMA and EMA of the RSI when Enable RSI ma is set to true.
It also plots moving averages of the composite index.
Crossover Signals:
The script detects bullish and bearish crossovers between the SMA and EMA of the RSI.
It plots shapes (labels) on the chart to indicate buy (BUY) and sell (SELL) signals based on these crossovers.
Usage:
Enable RSIma: This input allows you to enable or disable the plotting of RSI moving averages.
i1: This variable is used to adjust the vertical position of the composite index and its moving averages.
Visualization:
The RSI is plotted in black.
The RSI fast trigger line (SMA of RSI) is plotted in green when enabled.
The RSI slow trigger line (EMA of RSI) is plotted in orange when enabled.
The composite index and its moving averages are plotted in red, green, and orange.
Buy and sell signals are indicated with green and red labels, respectively.
This script can be used to identify potential trading opportunities based on RSI crossovers and the composite index.

RSI Pro+ (Bear market, financial crisis and so on EditionIn markets defined by volatility, fear, and uncertainty – the battlegrounds of bear markets and financial crises – you need tools forged in resilience. Introducing RSI Pro+, a strategy built upon a legendary indicator born in 1978, yet engineered with modern visual clarity to remain devastatingly effective even in the chaotic financial landscapes of 3078.
This isn't about complex algorithms predicting the unpredictable. It's about harnessing the raw, time-tested power of the Relative Strength Index (RSI) to identify potential exhaustion points and capitalize on oversold conditions. RSI Pro+ cuts through the noise, providing clear, actionable signals when markets might be poised for a relief bounce or reversal.
Core Technology (The 1978 Engine):
RSI Crossover Entry: The strategy initiates a LONG position when the RSI (default period 11) crosses above a user-defined low threshold (default 30). This classic technique aims to enter when selling pressure may be waning, offering potential entry points during sharp downturns or periods of consolidation after a fall.
Modern Enhancements (The 3078 Cockpit):
RSI Pro+ isn't just about the signal; it's about providing a professional-grade visual experience directly on your chart:
Entry Bar Highlight: A subtle background flash on the chart signals the exact bar where the RSI crossover condition is met, alerting you to potential entry opportunities.
Trade Bar Coloring: Once a trade is active, the price bars are subtly colored, giving you immediate visual confirmation that the strategy is live in the market.
Entry Price Line: A clear, persistent line marks your exact average entry price for the duration of the trade, serving as a crucial visual anchor.
Take Profit Line: Your calculated Take Profit target is plotted as a distinct line, keeping your objective clearly in sight.
Custom Entry Marker: A precise shape (▲) appears below the bar where the trade entry was actually executed, pinpointing the start of the position.
On-Chart Info Table (HUD): A clean, customizable Heads-Up Display appears when a trade is active, showing vital information at a glance:
Entry Price: Your position's average cost basis.
TP Target: The calculated price level for your Take Profit exit.
Current PnL%: Real-time Profit/Loss percentage for the open trade.
Full Customization: Nearly every aspect is configurable via the settings menu:
RSI Period & Crossover Level
Take Profit Percentage
Toggle ALL visual enhancements on/off individually
Position the Info Table wherever you prefer on the chart.
How to Use RSI Pro+:
Add to Chart: Apply the "RSI Pro+ (Bear market...)" strategy to your TradingView chart. Ensure any previous versions are removed.
Access Settings: Click the cogwheel icon (⚙️) next to the strategy name on your chart.
Configure Inputs (Crucial Step):
RSI Crossover Level: This is key. The default (30) targets standard oversold conditions. In severe downturns, you might experiment with lower levels (e.g., 25, 20) or higher ones (e.g., 40) depending on the asset and timeframe. Observe where RSI(11) typically bottoms out on your chart.
Take Profit Percentage (%): Define your desired profit target per trade (e.g., enter 0.5 for 0.5%, 1.0 for 1%). The default is a very small 0.11%.
RSI Period: While default is 11, you can adjust this (e.g., the standard 14).
Visual Enhancements: Enable or disable the visual features (background highlights, bar coloring, lines, markers, table) according to your preference using the checkboxes. Adjust table position.
Observe & Backtest: Watch how the strategy behaves on your chosen asset and timeframe. Use TradingView's Strategy Tester to analyze historical performance based on your settings. No strategy works perfectly everywhere; testing is essential.
Important Considerations:
Risk Management: This specific script version focuses on a Take Profit exit. It does not include an explicit Stop Loss. You MUST manage risk through appropriate position sizing, potentially adding a Stop Loss manually, or by modifying the script.
Oversold ≠ Reversal: An RSI crossover is an indicator of potential exhaustion, not a guarantee of a price reversal.
Fixed TP: A fixed percentage TP ensures small wins but may exit before larger potential moves.
Backtesting Limitations: Past performance does not guarantee future results.
RSI Pro+ strips away complexity to focus on a robust, time-honored principle, enhanced with modern visuals for the discerning trader navigating today's (and tomorrow's) challenging markets

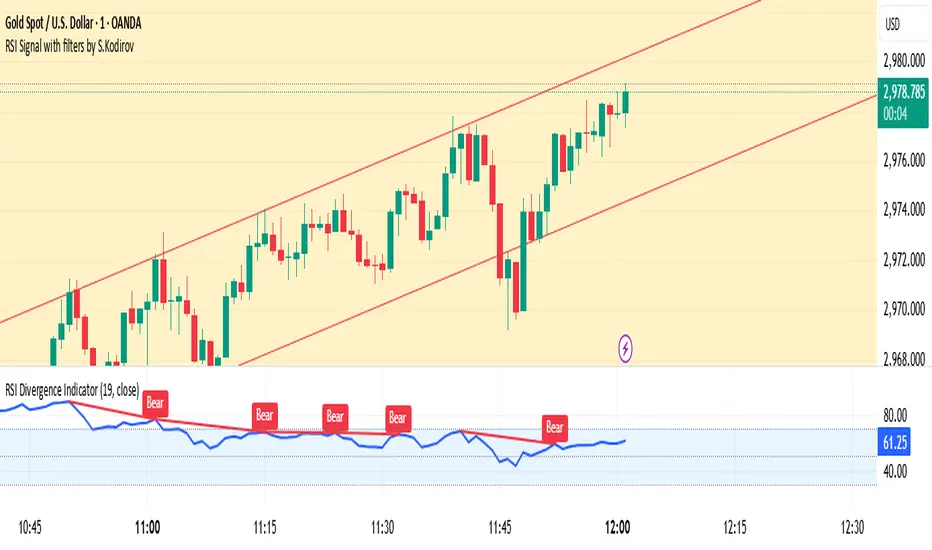
RSI Signal with filters by S.Kodirov📌 English
RSI Signal with Multi-Timeframe Filters
This TradingView indicator generates RSI-based buy and sell signals on the 15-minute timeframe with additional filtering from other timeframes (5M, 30M, 1M).
🔹 Signal Types:
✅ 15/5B & 15/5S – RSI 15M filtered by 5M
✅ 15/30/1B & 15/30/1S – RSI 15M filtered by 30M & 1M
✅ 15B & 15S – RSI 15M without filters
🔹 How It Works:
Signals are displayed as colored triangles on the chart.
Labels indicate the type of signal (e.g., 15/5B, 15S).
Alerts notify users when a signal appears.
🚀 Best for short-term trading with RSI confirmation from multiple timeframes!
📌 Русский
Индикатор RSI с мульти-таймфрейм фильтрами
Этот индикатор для TradingView генерирует сигналы покупки и продажи на 15-минутном таймфрейме, используя фильтрацию с других таймфреймов (5M, 30M, 1M).
🔹 Типы сигналов:
✅ 15/5B & 15/5S – RSI 15M с фильтром 5M
✅ 15/30/1B & 15/30/1S – RSI 15M с фильтрами 30M и 1M
✅ 15B & 15S – RSI 15M без фильтров
🔹 Как это работает:
Сигналы отображаются как цветные треугольники на графике.
Подписи показывают тип сигнала (например, 15/5B, 15S).
Алерты уведомляют трейдера о появлении сигнала.
🚀 Идеально для краткосрочной торговли с подтверждением RSI на нескольких таймфреймах!
📌 O'zbekcha
Ko'p vaqt oralig‘idagi RSI signallari
Ushbu TradingView indikatori 15 daqiqalik vaqt oralig‘ida RSI asosida sotib olish va sotish signallarini yaratadi. Bundan tashqari, boshqa vaqt oralig‘idagi (5M, 30M, 1M) RSI filtrlarini ham hisobga oladi.
🔹 Signal turlari:
✅ 15/5B & 15/5S – 5M bilan filtrlangan RSI 15M
✅ 15/30/1B & 15/30/1S – 30M va 1M bilan filtrlangan RSI 15M
✅ 15B & 15S – Filtrsiz RSI 15M
🔹 Qanday ishlaydi?
Signallar rangli uchburchaklar shaklida ko‘rsatiladi.
Yozuvlar signal turini ko‘rsatadi (masalan, 15/5B, 15S).
Xabarnomalar yangi signal paydo bo‘lganda treyderni ogohlantiradi.
🚀 Ko‘p vaqt oralig‘ida RSI tasdig‘i bilan qisqa muddatli savdo uchun ideal!
RSI & EMA IndicatorMulti-Timeframe EMA & RSI Analysis with Trend Merging Detection
Overview
This script provides traders with a multi-timeframe analysis tool that simplifies trend detection, momentum confirmation, and potential trend shifts. It integrates Exponential Moving Averages (EMAs) and the Relative Strength Index (RSI) across Daily, Weekly, and Monthly timeframes, helping traders assess both long-term and short-term market conditions at a glance.
This script is a simplification and modification of the EMA Cheatsheet by MarketMoves, reducing chart clutter while adding EMA merging detection to highlight potential trend reversals or breakouts.
Originality and Usefulness
Unlike traditional indicators, which focus on a single timeframe, this script combines multiple timeframes in a single view to offer a comprehensive market outlook.
What Makes This Indicator Unique?
This Indicator to Combine RSI and EMA Clouds for Multiple Timeframes
Multi-Timeframe Trend Analysis in One Visual Tool
EMA Merging Detection to Spot Trend Shifts Early
Momentum Validation Using RSI Across Daily, Weekly, and Monthly Timeframes
Reduces Chart Clutter While Providing Actionable Trade Signals
I couldn't find a TradingView indicator that displayed RSI and EMA clouds together across Daily, Weekly, and Monthly timeframes. This tool bridges that gap, allowing traders to see trend strength and momentum shifts across key timeframes without switching charts.
How the Script Works
1. Trend Direction via EMAs
The script tracks Short-term (5 & 12-period), Medium-term (34 & 50-period), and Long-term (72 & 89-period) EMAs across Daily, Weekly, and Monthly timeframes.
Bullish trend: When faster EMAs are above slower EMAs.
Bearish trend: When faster EMAs are below slower EMAs.
A visual table simplifies trend recognition with:
Green cells for bullish alignment.
Red cells for bearish alignment.
This color-coded system allows traders to quickly assess market momentum across different timeframes without excessive manual analysis.
2. Momentum Confirmation with RSI
The RSI(14) values for Daily, Weekly, and Monthly timeframes are displayed alongside the EMAs.
RSI above 70 suggests overbought conditions.
RSI below 30 suggests oversold conditions.
By combining RSI with EMA trends, traders can confirm whether momentum supports the trend direction or if the market is losing strength.
3. Trend Shift Detection (EMA Merging Mechanism)
A unique feature of this script is EMA merging detection, which occurs when:
The short, medium, and long-term EMAs come within 0.5% of the price.
This often signals trend reversals, breakouts, or consolidations.
When this condition is met, a warning signal appears, alerting traders to potential market shifts.
Who This Indicator Is For?
This script is designed for traders who want to track trends across multiple timeframes while keeping a clean and simplified chart.
Swing & Position Traders – Identify strong trends and potential momentum shifts for longer-term trades.
Trend Followers – Stay aligned with major market trends and avoid trading against momentum.
Day Traders – Use the Daily timeframe for entries while referencing higher timeframes for confirmation.
How to Use the Indicator
Add the indicator to any chart.
Check the trend table in the top-right corner:
Green cells indicate a bullish trend.
Red cells indicate a bearish trend.
Look at RSI values to confirm momentum:
RSI above 70 = Overbought.
RSI below 30 = Oversold.
Watch for the "Merge" alert to spot potential reversals or consolidations.
Combine signals from multiple timeframes for stronger trade decisions.
Why This Indicator is Unique on TradingView?
Before this script, no TradingView indicator displayed RSI and EMA clouds together across multiple timeframes (Daily, Weekly, Monthly).
This tool eliminates the need to:
Manually check multiple timeframes for trend alignment.
Add multiple EMA and RSI indicators to the same chart, creating clutter.
Constantly switch between different timeframes to confirm momentum and trend direction.
With this indicator, traders can see trend strength and momentum shifts instantly, improving their decision-making process.
Chart Guidelines
The script is designed for use on a clean chart to maximize clarity.
The trend alignment table is displayed in a non-intrusive manner so traders can focus on price action.
No additional indicators are required, but users may combine this script with volume-based indicators for further confirmation.
The script name and timeframe should always be visible on published charts to help traders understand the analysis.
Final Notes
This script is a simplification and modification of the EMA Cheatsheet by MarketMoves, improving trend detection, momentum confirmation, and EMA merging detection.
It is designed to help traders quickly identify trend direction, confirm momentum, and detect potential trend shifts, reducing the need for excessive manual analysis.
Disclaimer: This indicator is for educational purposes only and does not constitute financial advice. Trading involves risk; always use proper risk management when applying this tool in live markets.

RSI Divergence[UgurTash] – Real-Time📈 RSI Divergence – Real-Time, Adaptive, and Intelligent RSI Divergence Detection
🚀 What Does This Indicator Do?
RSI Divergence is a real-time divergence detection tool that helps traders identify bullish and bearish divergences between price and the Relative Strength Index (RSI). Unlike traditional RSI-based indicators, this script offers:
✅ Real-time detection – No need to wait for bar closes or repainting.
✅ Dynamic time-frame adaptation – The script automatically adjusts RSI settings based on the selected chart time frame.
✅ Multi-layered divergence analysis – Supports short-term, medium-term, and long-term divergence detection with an optional all-term mode that dynamically selects the best configuration.
🛠 How Does It Work?
Pivot-Based Divergence Detection:
The script analyzes pivot points on both price and RSI to determine valid divergences.
Bullish divergence occurs when price forms a lower low but RSI trends higher, indicating potential upward momentum.
Bearish divergence occurs when price forms a higher high but RSI trends lower, signaling possible weakness.
Adaptive RSI Calculation:
The RSI length is dynamically adjusted based on the chosen time frame:
Short-Term: RSI (7) for 1-5 min charts.
Medium-Term: RSI (14) for 15-60 min charts.
Long-Term: RSI (28) for 4H+ charts.
In All-Term Mode, the script automatically determines the best RSI length based on the active chart timeframe.
Smart Visualization & Alerts:
Bullish divergences are marked with green lines & labels.
Bearish divergences are highlighted in red.
Users can customize symbol size, divergence labels, and colors.
Instant alerts notify traders as soon as a divergence is detected.
🎯 How to Use This Indicator?
📌 For Trend Reversals: Look for bullish divergences at key support levels and bearish divergences at resistance zones.
📌 For Trend Continuation: Combine divergence signals with moving averages, volume analysis, or price action strategies to confirm trades.
📌 For Scalping & Swing Trading: Adjust the time-frame settings to match your trading style.
🏆 What Makes This Indicator Original?
🔹 Unlike standard RSI divergence indicators, this script features real-time analysis with no repainting, allowing for instant trading decisions.
🔹 The time-frame adaptive RSI makes it dynamic and suitable for any market condition.
🔹 The multi-term divergence detection offers flexibility, giving traders a precise view of both short-term & long-term market structure.
⚠ Note: No indicator guarantees 100% accuracy. Always use additional confirmations and sound risk management strategies.
If you find this tool useful, don’t forget to support & share! 🚀

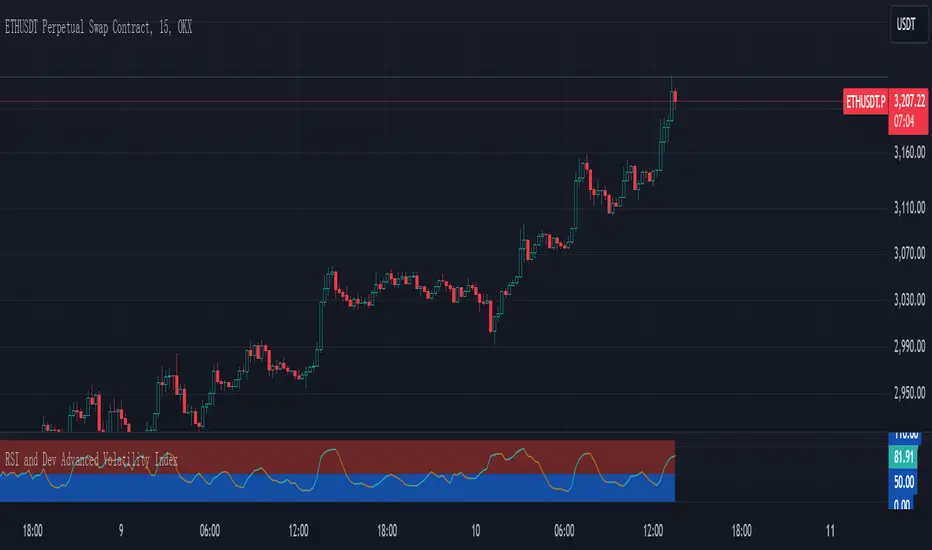
RSI and Dev Advanced Volatility IndexEnglish Explanation of the "RSI and Dev Advanced Volatility Index" Pine Script Code
Understanding the Code
Purpose:
This Pine Script code creates a custom indicator that combines the Relative Strength Index (RSI) and Deviation (DEV) to provide insights into market volatility.
Key Components:
* Deviation (DEV): Calculates the difference between the closing price and the 10-period simple moving average. This measures the extent to which the price deviates from its recent average, indicating volatility.
* RSI: The traditional RSI is then applied to the calculated deviations. This helps to smooth the data and identify overbought or oversold conditions in terms of volatility.
Calculation Steps:
* Deviation Calculation: The difference between the closing price and its 10-period simple moving average is calculated.
* RSI Calculation: The RSI is calculated on the deviations, providing a measure of the speed and change of volatility relative to recent volatility changes.
* Plotting:
* The RSI of the deviations is plotted on the chart.
* Horizontal lines are plotted at 50, 0, and 110 to visually represent different volatility zones.
* The area between the lines is filled with color to highlight low and high volatility regions.
Interpretation and Usage
* Volatility Analysis:
* High Volatility: When the RSI is above 50, it indicates high volatility, suggesting the market might be in a consolidation or trend reversal phase.
* Low Volatility: When the RSI is below 50, it indicates low volatility, suggesting a relatively calm market.
* Trading Signals:
* Buy Signal: When the RSI crosses above 50 from below, it might signal increasing volatility, which could be a buying opportunity.
* Sell Signal: When the RSI crosses below 50 from above, it might signal decreasing volatility, which could be a selling opportunity.
* Risk Management:
* By monitoring volatility, traders can better manage their risk. During periods of high volatility, traders might reduce their position size or adopt more conservative strategies.
Advantages
* Comprehensive: Combines RSI and DEV for a more holistic view of volatility.
* Sensitivity: Quickly responds to changes in market volatility.
* Visual Clarity: Color-coded zones provide a clear visual representation of different volatility levels.
Limitations
* Parameter Sensitivity: The indicator's performance is sensitive to parameter changes, such as the lookback period for the moving average.
* Lag: Like most technical indicators, it has some lag and might not capture every market movement.
* Not Predictive: It can only indicate current and past volatility, not future movements.
Summary
This custom indicator offers a valuable tool for analyzing market volatility. By combining RSI and DEV, it provides a more nuanced perspective on price fluctuations. However, it should be used in conjunction with other technical indicators and fundamental analysis for more robust trading decisions.
Key points to remember:
* Higher RSI values indicate higher volatility.
* Lower RSI values indicate lower volatility.
* Crossovers of the RSI line above or below 50 can provide potential trading signals.
* The indicator should be used in conjunction with other analysis tools for a more complete picture of the market.
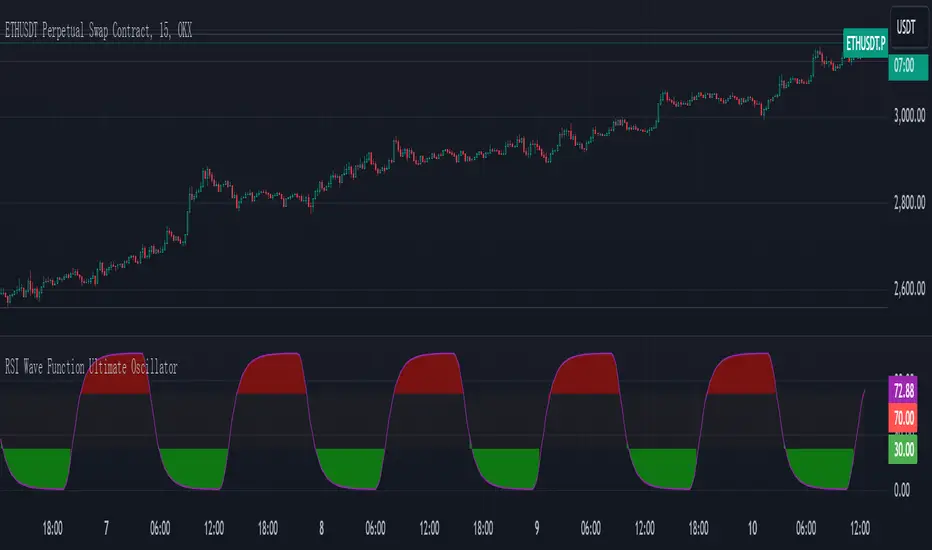
RSI Wave Function Ultimate OscillatorEnglish Explanation of the "RSI Wave Function Ultimate Oscillator" Pine Script Code
Understanding the Code
Purpose:
This Pine Script code creates a custom indicator that combines the Relative Strength Index (RSI) with a wave function to potentially provide more nuanced insights into market dynamics.
Key Components:
* Wave Function: This is a custom calculation that introduces a sinusoidal wave component to the price data. The frequency parameter controls the speed of the oscillation, and the decay factor determines how quickly the influence of past prices diminishes.
* Smoothed Signal: The wave function is applied to the closing price to create a smoothed signal, which is essentially a price series modulated by a sine wave.
* RSI: The traditional RSI is then calculated on this smoothed signal, providing a measure of the speed and change of price movements relative to recent price changes.
Calculation Steps:
* Wave Function Calculation:
* A sinusoidal wave is generated based on the bar index and the frequency parameter.
* The wave is combined with the closing price using a weighted average, where the decay factor determines the weight given to previous values.
* RSI Calculation:
* The RSI is calculated on the smoothed signal using a standard RSI formula.
* Plotting:
* The RSI values are plotted on a chart, along with horizontal lines at 70 and 30 to indicate overbought and oversold conditions.
* The area between the RSI line and the overbought/oversold lines is filled with color to visually represent the market condition.
Interpretation and Usage
* Wave Function: The wave function introduces cyclical patterns into the price data, which can help identify potential turning points or momentum shifts.
* RSI: The RSI provides a measure of the speed and change of price movements relative to recent price changes. When applied to the smoothed signal, it can help identify overbought and oversold conditions, as well as potential divergences between price and momentum.
* Combined Indicator: The combination of the wave function and RSI aims to provide a more sensitive and potentially earlier indication of market reversals.
* Signals:
* Crossovers: Crossovers of the RSI line above or below the overbought/oversold lines can be used to generate buy or sell signals.
* Divergences: Divergences between the price and the RSI can indicate a weakening trend.
* Oscillations: The amplitude and frequency of the oscillations in the RSI can provide insights into the strength and duration of market trends.
How it Reflects Market Volatility
* Amplified Volatility: The wave function can amplify the volatility of the price data, making it easier to identify potential turning points.
* Smoothing: The decay factor helps to smooth out short-term fluctuations, allowing the indicator to focus on longer-term trends.
* Sensitivity: The combination of the wave function and RSI can make the indicator more sensitive to changes in market momentum.
In essence, this custom indicator attempts to enhance traditional RSI analysis by incorporating a cyclical component that can potentially provide earlier signals of market reversals.
Note: The effectiveness of this indicator will depend on various factors, including the specific market, time frame, and the chosen values for the frequency and decay parameters. It is recommended to conduct thorough backtesting and optimize the parameters to suit your specific trading strategy.
RSI Weighted Trend System I [InvestorUnknown]The RSI Weighted Trend System I is an experimental indicator designed to combine both slow-moving trend indicators for stable trend identification and fast-moving indicators to capture potential major turning points in the market. The novelty of this system lies in the dynamic weighting mechanism, where fast indicators receive weight based on the current Relative Strength Index (RSI) value, thus providing a flexible tool for traders seeking to adapt their strategies to varying market conditions.
Dynamic RSI-Based Weighting System
The core of the indicator is the dynamic weighting of fast indicators based on the value of the RSI. In essence, the higher the absolute value of the RSI (whether positive or negative), the higher the weight assigned to the fast indicators. This enables the system to capture rapid price movements around potential turning points.
Users can choose between a threshold-based or continuous weight system:
Threshold-Based Weighting: Fast indicators are activated only when the absolute RSI value exceeds a user-defined threshold. Below this threshold, fast indicators receive no weight.
Continuous Weighting: By setting the weight threshold to zero, the fast indicators always receive some weight, although this can result in more false signals in ranging markets.
// Calculate weight for Fast Indicators based on RSI (Slow Indicator weight is kept to 1 for simplicity)
f_RSI_Weight_System(series float rsi, simple float weight_thre) =>
float fast_weight = na
float slow_weight = na
if weight_thre > 0
if math.abs(rsi) <= weight_thre
fast_weight := 0
slow_weight := 1
else
fast_weight := 0 + math.sqrt(math.abs(rsi))
slow_weight := 1
else
fast_weight := 0 + math.sqrt(math.abs(rsi))
slow_weight := 1
Slow and Fast Indicators
Slow Indicators are designed to identify stable trends, remaining constant in weight. These include:
DMI (Directional Movement Index) For Loop
CCI (Commodity Channel Index) For Loop
Aroon For Loop
Fast Indicators are more responsive and designed to spot rapid trend shifts:
ZLEMA (Zero-Lag Exponential Moving Average) For Loop
IIRF (Infinite Impulse Response Filter) For Loop
Each of these indicators is calculated using a for-loop method to generate a moving average, which captures the trend of a given length range.
RSI Normalization
To facilitate the weighting system, the RSI is normalized from its usual 0-100 range to a -1 to 1 range. This allows for easy scaling when calculating weights and helps the system adjust to rapidly changing market conditions.
// Normalize RSI (1 to -1)
f_RSI(series float rsi_src, simple int rsi_len, simple string rsi_wb, simple string ma_type, simple int ma_len) =>
output = switch rsi_wb
"RAW RSI" => ta.rsi(rsi_src, rsi_len)
"RSI MA" => ma_type == "EMA" ? (ta.ema(ta.rsi(rsi_src, rsi_len), ma_len)) : (ta.sma(ta.rsi(rsi_src, rsi_len), ma_len))
Signal Calculation
The final trading signal is a weighted average of both the slow and fast indicators, depending on the calculated weights from the RSI. This ensures a balanced approach, where slow indicators maintain overall trend guidance, while fast indicators provide timely entries and exits.
// Calculate Signal (as weighted average)
sig = math.round(((DMI*slow_w) + (CCI*slow_w) + (Aroon*slow_w) + (ZLEMA*fast_w) + (IIRF*fast_w)) / (3*slow_w + 2*fast_w), 2)
Backtest Mode and Performance Metrics
This version of the RSI Weighted Trend System includes a comprehensive backtesting mode, allowing users to evaluate the performance of their selected settings against a Buy & Hold strategy. The backtesting includes:
Equity calculation based on the signals generated by the indicator.
Performance metrics table comparing Buy & Hold strategy metrics with the system’s signals, including: Mean, positive, and negative return percentages, Standard deviations (of all, positive and negative returns), Sharpe Ratio, Sortino Ratio, and Omega Ratio
f_PerformanceMetrics(series float base, int Lookback, simple float startDate, bool Annualize = true) =>
// Initialize variables for positive and negative returns
pos_sum = 0.0
neg_sum = 0.0
pos_count = 0
neg_count = 0
returns_sum = 0.0
returns_squared_sum = 0.0
pos_returns_squared_sum = 0.0
neg_returns_squared_sum = 0.0
// Loop through the past 'Lookback' bars to calculate sums and counts
if (time >= startDate)
for i = 0 to Lookback - 1
r = (base - base ) / base
returns_sum += r
returns_squared_sum += r * r
if r > 0
pos_sum += r
pos_count += 1
pos_returns_squared_sum += r * r
if r < 0
neg_sum += r
neg_count += 1
neg_returns_squared_sum += r * r
float export_array = array.new_float(12)
// Calculate means
mean_all = math.round((returns_sum / Lookback) * 100, 2)
mean_pos = math.round((pos_count != 0 ? pos_sum / pos_count : na) * 100, 2)
mean_neg = math.round((neg_count != 0 ? neg_sum / neg_count : na) * 100, 2)
// Calculate standard deviations
stddev_all = math.round((math.sqrt((returns_squared_sum - (returns_sum * returns_sum) / Lookback) / Lookback)) * 100, 2)
stddev_pos = math.round((pos_count != 0 ? math.sqrt((pos_returns_squared_sum - (pos_sum * pos_sum) / pos_count) / pos_count) : na) * 100, 2)
stddev_neg = math.round((neg_count != 0 ? math.sqrt((neg_returns_squared_sum - (neg_sum * neg_sum) / neg_count) / neg_count) : na) * 100, 2)
// Calculate probabilities
prob_pos = math.round((pos_count / Lookback) * 100, 2)
prob_neg = math.round((neg_count / Lookback) * 100, 2)
prob_neu = math.round(((Lookback - pos_count - neg_count) / Lookback) * 100, 2)
// Calculate ratios
sharpe_ratio = math.round(mean_all / stddev_all * (Annualize ? math.sqrt(Lookback) : 1), 2)
sortino_ratio = math.round(mean_all / stddev_neg * (Annualize ? math.sqrt(Lookback) : 1), 2)
omega_ratio = math.round(pos_sum / math.abs(neg_sum), 2)
// Set values in the array
array.set(export_array, 0, mean_all), array.set(export_array, 1, mean_pos), array.set(export_array, 2, mean_neg),
array.set(export_array, 3, stddev_all), array.set(export_array, 4, stddev_pos), array.set(export_array, 5, stddev_neg),
array.set(export_array, 6, prob_pos), array.set(export_array, 7, prob_neu), array.set(export_array, 8, prob_neg),
array.set(export_array, 9, sharpe_ratio), array.set(export_array, 10, sortino_ratio), array.set(export_array, 11, omega_ratio)
// Export the array
export_array
The metrics help traders assess the effectiveness of their strategy over time and can be used to optimize their settings.
Calibration Mode
A calibration mode is included to assist users in tuning the indicator to their specific needs. In this mode, traders can focus on a specific indicator (e.g., DMI, CCI, Aroon, ZLEMA, IIRF, or RSI) and fine-tune it without interference from other signals.
The calibration plot visualizes the chosen indicator's performance against a zero line, making it easy to see how changes in the indicator’s settings affect its trend detection.
Customization and Default Settings
Important Note: The default settings provided are not optimized for any particular market or asset. They serve as a starting point for experimentation. Traders are encouraged to calibrate the system to suit their own trading strategies and preferences.
The indicator allows deep customization, from selecting which indicators to use, adjusting the lengths of each indicator, smoothing parameters, and the RSI weight system.
Alerts
Traders can set alerts for both long and short signals when the indicator flips, allowing for automated monitoring of potential trading opportunities.

RSI 30-50-70 moving averageDescription:
The RSI 30-50-70 Moving Average indicator plots three distinct moving averages based on different RSI ranges (30%, 50%, and 70%). Each moving average corresponds to different market conditions and provides potential entry and exit signals. Here's how it works:
• RSI_30 Range (25%-35%): The moving average of closing prices when the RSI is between 25% and 35%, representing potential oversold conditions.
• RSI_50 Range (45%-55%): The moving average of closing prices when the RSI is between 45% and 55%, providing a balanced perspective for trend-following strategies.
• RSI_70 Range (65%-75%): The moving average of closing prices when the RSI is between 65% and 75%, representing potential overbought conditions.
This indicator offers flexibility, as users can adjust key parameters such as RSI ranges, periods, and time frames to fine-tune the signals for their trading strategies.
How it Works:
Like traditional moving averages, the RSI 30-50-70 Moving Averages can highlight dynamic levels of support and resistance. They offer additional insight by focusing on specific RSI ranges, providing early signals for trend reversals or continuation. The default settings can be used across various assets but should be optimized via backtesting.
Default Settings:
• RSI_30: 25% to 35% (Oversold Zone, yellow line)
• RSI_50: 45% to 55% (Neutral/Trend Zone, green line)
• RSI_70: 65% to 75% (Overbought Zone, red line)
• RSI Period: 14
Buy Conditions:
• Use the 5- or 15-minute time frame.
• Wait for the price to move below the RSI_30 line, indicating potential oversold conditions.
• Enter a buy order when the price closes above the RSI_30 line, signaling a recovery from the oversold zone.
• For a more conservative approach, use the RSI_50 line as the buy signal to confirm a trend reversal.
• Important: Before entering, ensure that the RSI_30 moving average has flattened or started to level off, signaling that the oversold momentum has slowed.
Sell Conditions:
• Use the 5- or 15-minute time frame.
• Wait for the price to close above the RSI_70 line, indicating potential overbought conditions.
• Enter a sell order when the price closes below the RSI_70 line, signaling a decline from the overbought zone.
• Important: Similar to buying, wait for the RSI_70 moving average to flatten or level off before selling, indicating the overbought conditions are stalling.
Key Features:
1. Dynamic Range Customization: The indicator allows users to modify the RSI ranges and periods, tailoring the moving averages to fit different market conditions or asset classes.
2. Trend-Following and Reversal Signals: The RSI 30-50-70 moving averages provide both reversal and trend-following signals, making it a versatile tool for short-term traders.
3. Visual Representation of Market Strength: By plotting moving averages based on RSI levels, traders can visually interpret the market’s strength and potential turning points.
4. Risk Management: The built-in flexibility allows traders to choose lower-risk entries by adjusting which RSI level (e.g., RSI_30 vs. RSI_50) they rely on for signals.
Practical Use:
Different assets respond uniquely to RSI-based moving averages, so it's recommended to backtest and adjust ranges for specific instruments. For example, volatile assets may require wider RSI ranges, while more stable assets could benefit from tighter ranges.
Checking for Buy conditions:
1st: Wait for current price to go below the RSI_30 (yellow line)
2nd: Wait and observe for bullish divergence
3rd: RSI_30 has flattened indicating potential gain of momentum after a bullish divergence.
4th: Enter a buy order when the price closed above the RSI_30, preferably when a green candle appeared.

RSI (Kernel Optimized) | Flux Charts💎 GENERAL OVERVIEW
Introducing our new KDE Optimized RSI Indicator! This indicator adds a new aspect to the well-known RSI indicator, with the help of the KDE (Kernel Density Estimation) algorithm, estimates the probability of a candlestick will be a pivot or not. For more information about the process, please check the "HOW DOES IT WORK ?" section.
Features of the new KDE Optimized RSI Indicator :
A New Approach To Pivot Detection
Customizable KDE Algorithm
Realtime RSI & KDE Dashboard
Alerts For Possible Pivots
Customizable Visuals
❓ HOW TO INTERPRET THE KDE %
The KDE % is a critical metric that reflects how closely the current RSI aligns with the KDE (Kernel Density Estimation) array. In simple terms, it represents the likelihood that the current candlestick is forming a pivot point based on historical data patterns. a low percentage suggests a lower probability of the current candlestick being a pivot point. In these cases, price action is less likely to reverse, and existing trends may continue. At moderate levels, the possibility of a pivot increases, indicating potential trend shifts or consolidations.Traders should start monitoring closely for confirmation signals. An even higher KDE % suggests a strong likelihood that the current candlestick could form a pivot point, which could lead to a reversal or significant price movement. These points often align with overbought or oversold conditions in traditional RSI analysis, making them key moments for potential trade entry or exit.
📌 HOW DOES IT WORK ?
The RSI (Relative Strength Index) is a widely used oscillator among traders. It outputs a value between 0 - 100 and gives a glimpse about the current momentum of the price action. This indicator then calculates the RSI for each candlesticks, and saves them into an array if the candlestick is a pivot. The low & high pivot RSIs' are inserted into two different arrays. Then the a KDE array is calculated for both of the low & high pivot RSI arrays. Explaining the KDE might be too much for this write-up, but for a brief explanation, here are the steps :
1. Define the necessary options for the KDE function. These are : Bandwidth & Nº Steps, Array Range (Array Max - Array Min)
2. After that, create a density range array. The array has (steps * 2 - 1) elements and they are calculated by (arrMin + i * stepCount), i being the index.
3. Then, define a kernel function. This indicator has 3 different kernel distribution modes : Uniform, Gaussian and Sigmoid
4. Then, define a temporary value for the current element of KDE array.
5. For each element E in the pivot RSI array, add "kernel(densityRange.get(i) - E, 1.0 / bandwidth)" to the temporary value.
6. Add 1.0 / arrSize * to the KDE array.
Then the prefix sum array of the KDE array is calculated. For each candlestick, the index closest to it's RSI value in the KDE array is found using binary search. Then for the low pivot KDE calculation, the sum of KDE values from found index to max index is calculated. For the high pivot KDE, the sum of 0 to found index is used. Then if high or low KDE value is greater than the activation threshold determined in the settings, a bearish or bullish arrow is plotted after bar confirmation respectively. The arrows are drawn as long as the KDE value of current candlestick is greater than the threshold. When the KDE value is out of the threshold, a less transparent arrow is drawn, indicating a possible pivot point.
🚩 UNIQUENESS
This indicator combines RSI & KDE Algorithm to get a foresight of possible pivot points. Pivot points are important entry, confirmation and exit points for traders. But to their nature, they can be only detected after more candlesticks are rendered after them. The purpose of this indicator is to alert the traders of possible pivot points using KDE algorithm right away when they are confirmed. The indicator also has a dashboard for realtime view of the current RSI & Bullish or Bearish KDE value. You can fully customize the KDE algorithm and set up alerts for pivot detection.
⚙️ SETTINGS
1. RSI Settings
RSI Length -> The amount of bars taken into account for RSI calculation.
Source -> The source value for RSI calculation.
2. Pivots
Pivot Lengths -> Pivot lengths for both high & low pivots. For example, if this value is set to 21; 21 bars before AND 21 bars after a candlestick must be higher for a candlestick to be a low pivot.
3. KDE
Activation Threshold -> This setting determines the amount of arrows shown. Higher options will result in more arrows being rendered.
Kernel -> The kernel function as explained in the upper section.
Bandwidth -> The bandwidth variable as explained in the upper section. The smoothness of the KDE function is tied to this setting.
Nº Bins -> The Nº Steps variable as explained in the upper section. It determines the precision of the KDE algorithm.

RSI 15/60 and ADX PlotIn this script, the buy and sell criteria are based on the Relative Strength Index (RSI) values calculated for two different timeframes: the 15-minute RSI and the hourly RSI. These timeframes are used together to check signals when certain thresholds are crossed, providing confirmation across both short-term and longer-term momentum.
Buy Criteria:
Condition 1:
Hourly RSI > 60: This means the longer-term momentum shows strength.
15-minute RSI crosses above 60: This shows that the shorter-term momentum is catching up and confirms increasing strength.
Condition 2:
15-minute RSI > 60: This indicates that the short-term trend is already strong.
Hourly RSI crosses above 60: This confirms that the longer-term trend is also gaining strength.
Both conditions aim to capture the moments when the market shows increasing strength across both short and long timeframes, signaling a potential buy opportunity.
Sell Criteria:
Condition 1:
Hourly RSI < 40: This indicates that the longer-term trend is weakening.
15-minute RSI crosses below 40: The short-term momentum is also turning down, confirming the weakening trend.
Condition 2:
15-minute RSI < 40: The short-term trend is already weak.
Hourly RSI crosses below 40: The longer-term trend is now confirming the weakness, indicating a potential sell.
These conditions work to identify when the market is showing weakness in both short-term and long-term timeframes, signaling a potential sell opportunity.
ADX Confirmation :
The Average Directional Index (ADX) is a key tool for measuring the strength of a trend. It can be used alongside the RSI to confirm whether a buy or sell signal is occurring in a strong trend or during market consolidation. Here's how ADX can be integrated:
ADX > 25: This indicates a strong trend. Using this threshold, you can confirm buy or sell signals when there is a strong upward or downward movement in the market.
Buy Example: If a buy signal (RSI > 60) is triggered and the ADX is above 25, this confirms that the market is in a strong uptrend, making the buy signal more reliable.
Sell Example: If a sell signal (RSI < 40) is triggered and the ADX is above 25, it confirms a strong downtrend, validating the sell signal.
ADX < 25: This suggests a weak or non-existent trend. In this case, RSI signals might be less reliable since the market could be moving sideways.
Final Approach:
The RSI criteria help identify potential overbought and oversold conditions in both short and long timeframes.
The ADX confirmation ensures that the signals generated are happening during strong trends, increasing the likelihood of successful trades by filtering out weak or choppy market conditions.
This combination of RSI and ADX can help traders make more informed decisions by ensuring both momentum and trend strength align before entering or exiting trades.

RSI Trend Following StrategyOverview
The RSI Trend Following Strategy utilizes Relative Strength Index (RSI) to enter the trade for the potential trend continuation. It uses Stochastic indicator to check is the price is not in overbought territory and the MACD to measure the current price momentum. Moreover, it uses the 200-period EMA to filter the counter trend trades with the higher probability. The strategy opens only long trades.
Unique Features
Dynamic stop-loss system: Instead of fixed stop-loss level strategy utilizes average true range (ATR) multiplied by user given number subtracted from the position entry price as a dynamic stop loss level.
Configurable Trading Periods: Users can tailor the strategy to specific market windows, adapting to different market conditions.
Two layers trade filtering system: Strategy utilizes MACD and Stochastic indicators measure the current momentum and overbought condition and use 200-period EMA to filter trades against major trend.
Trailing take profit level: After reaching the trailing profit activation level script activates the trailing of long trade using EMA. More information in methodology.
Wide opportunities for strategy optimization: Flexible strategy settings allows users to optimize the strategy entries and exits for chosen trading pair and time frame.
Methodology
The strategy opens long trade when the following price met the conditions:
RSI is above 50 level.
MACD line shall be above the signal line
Both lines of Stochastic shall be not higher than 80 (overbought territory)
Candle’s low shall be above the 200 period EMA
When long trade is executed, strategy set the stop-loss level at the price ATR multiplied by user-given value below the entry price. This level is recalculated on every next candle close, adjusting to the current market volatility.
At the same time strategy set up the trailing stop validation level. When the price crosses the level equals entry price plus ATR multiplied by user-given value script starts to trail the price with trailing EMA(by default = 20 period). If price closes below EMA long trade is closed. When the trailing starts, script prints the label “Trailing Activated”.
Strategy settings
In the inputs window user can setup the following strategy settings:
ATR Stop Loss (by default = 1.75)
ATR Trailing Profit Activation Level (by default = 2.25)
MACD Fast Length (by default = 12, period of averaging fast MACD line)
MACD Fast Length (by default = 26, period of averaging slow MACD line)
MACD Signal Smoothing (by default = 9, period of smoothing MACD signal line)
Oscillator MA Type (by default = EMA, available options: SMA, EMA)
Signal Line MA Type (by default = EMA, available options: SMA, EMA)
RSI Length (by default = 14, period for RSI calculation)
Trailing EMA Length (by default = 20, period for EMA, which shall be broken close the trade after trailing profit activation)
Justification of Methodology
This trading strategy is designed to leverage a combination of technical indicators—Relative Strength Index (RSI), Moving Average Convergence Divergence (MACD), Stochastic Oscillator, and the 200-period Exponential Moving Average (EMA)—to determine optimal entry points for long trades. Additionally, the strategy uses the Average True Range (ATR) for dynamic risk management to adapt to varying market conditions. Let's look in details for which purpose each indicator is used for and why it is used in this combination.
Relative Strength Index (RSI) is a momentum indicator used in technical analysis to measure the speed and change of price movements in a financial market. It helps traders identify whether an asset is potentially overbought (overvalued) or oversold (undervalued), which can indicate a potential reversal or continuation of the current trend.
How RSI Works? RSI tracks the strength of recent price changes. It compares the average gains and losses over a specific period (usually 14 periods) to assess the momentum of an asset. Average gain is the average of all positive price changes over the chosen period. It reflects how much the price has typically increased during upward movements. Average loss is the average of all negative price changes over the same period. It reflects how much the price has typically decreased during downward movements.
RSI calculates these average gains and losses and compares them to create a value between 0 and 100. If the RSI value is above 70, the asset is generally considered overbought, meaning it might be due for a price correction or reversal downward. Conversely, if the RSI value is below 30, the asset is considered oversold, suggesting it could be poised for an upward reversal or recovery. RSI is a useful tool for traders to determine market conditions and make informed decisions about entering or exiting trades based on the perceived strength or weakness of an asset's price movements.
This strategy uses RSI as a short-term trend approximation. If RSI crosses over 50 it means that there is a high probability of short-term trend change from downtrend to uptrend. Therefore RSI above 50 is our first trend filter to look for a long position.
The MACD (Moving Average Convergence Divergence) is a popular momentum and trend-following indicator used in technical analysis. It helps traders identify changes in the strength, direction, momentum, and duration of a trend in an asset's price.
The MACD consists of three components:
MACD Line: This is the difference between a short-term Exponential Moving Average (EMA) and a long-term EMA, typically calculated as: MACD Line = 12 period EMA − 26 period EMA
Signal Line: This is a 9-period EMA of the MACD Line, which helps to identify buy or sell signals. When the MACD Line crosses above the Signal Line, it can be a bullish signal (suggesting a buy); when it crosses below, it can be a bearish signal (suggesting a sell).
Histogram: The histogram shows the difference between the MACD Line and the Signal Line, visually representing the momentum of the trend. Positive histogram values indicate increasing bullish momentum, while negative values indicate increasing bearish momentum.
This strategy uses MACD as a second short-term trend filter. When MACD line crossed over the signal line there is a high probability that uptrend has been started. Therefore MACD line above signal line is our additional short-term trend filter. In conjunction with RSI it decreases probability of following false trend change signals.
The Stochastic Indicator is a momentum oscillator that compares a security's closing price to its price range over a specific period. It's used to identify overbought and oversold conditions. The indicator ranges from 0 to 100, with readings above 80 indicating overbought conditions and readings below 20 indicating oversold conditions.
It consists of two lines:
%K: The main line, calculated using the formula (CurrentClose−LowestLow)/(HighestHigh−LowestLow)×100 . Highest and lowest price taken for 14 periods.
%D: A smoothed moving average of %K, often used as a signal line.
This strategy uses stochastic to define the overbought conditions. The logic here is the following: we want to avoid long trades in the overbought territory, because when indicator reaches it there is a high probability that the potential move is gonna be restricted.
The 200-period EMA is a widely recognized indicator for identifying the long-term trend direction. The strategy only trades in the direction of this primary trend to increase the probability of successful trades. For instance, when the price is above the 200 EMA, only long trades are considered, aligning with the overarching trend direction.
Therefore, strategy uses combination of RSI and MACD to increase the probability that price now is in short-term uptrend, Stochastic helps to avoid the trades in the overbought (>80) territory. To increase the probability of opening long trades in the direction of a main trend and avoid local bounces we use 200 period EMA.
ATR is used to adjust the strategy risk management to the current market volatility. If volatility is low, we don’t need the large stop loss to understand the there is a high probability that we made a mistake opening the trade. User can setup the settings ATR Stop Loss and ATR Trailing Profit Activation Level to realize his own risk to reward preferences, but the unique feature of a strategy is that after reaching trailing profit activation level strategy is trying to follow the trend until it is likely to be finished instead of using fixed risk management settings. It allows sometimes to be involved in the large movements.
Backtest Results
Operating window: Date range of backtests is 2023.01.01 - 2024.08.01. It is chosen to let the strategy to close all opened positions.
Commission and Slippage: Includes a standard Binance commission of 0.1% and accounts for possible slippage over 5 ticks.
Initial capital: 10000 USDT
Percent of capital used in every trade: 30%
Maximum Single Position Loss: -3.94%
Maximum Single Profit: +15.78%
Net Profit: +1359.21 USDT (+13.59%)
Total Trades: 111 (36.04% win rate)
Profit Factor: 1.413
Maximum Accumulated Loss: 625.02 USDT (-5.85%)
Average Profit per Trade: 12.25 USDT (+0.40%)
Average Trade Duration: 40 hours
These results are obtained with realistic parameters representing trading conditions observed at major exchanges such as Binance and with realistic trading portfolio usage parameters.
How to Use
Add the script to favorites for easy access.
Apply to the desired timeframe and chart (optimal performance observed on 2h BTC/USDT).
Configure settings using the dropdown choice list in the built-in menu.
Set up alerts to automate strategy positions through web hook with the text: {{strategy.order.alert_message}}
Disclaimer:
Educational and informational tool reflecting Skyrex commitment to informed trading. Past performance does not guarantee future results. Test strategies in a simulated environment before live implementation

RSI-based MACDThe RSI is one of the most popular indicators available. This indicator, which represents the strength of market momentum based on the gains and losses over the past 14 candlesticks, is rational and is mainly used as an oscillator to determine overbought or oversold conditions. However, because the RSI is an older indicator, its very simple design—displaying only a single line on the graph—may feel somewhat lacking in functionality to modern traders. The main issue is that there is no objective measure to determine whether the RSI is currently rising or falling.
That’s when I came up with the idea of calculating the MACD based on the smoothed values of the RSI. As is well known, the MACD is an indicator that represents the distance between moving averages, designed to show when the moving averages cross as the value falls below zero. By observing the golden crosses and death crosses of the MACD and signal line, one can anticipate the golden and death crosses of the moving averages. Applying the same logic, I thought that calculating the MACD based on RSI values would allow us to predict the rise and fall of the RSI by observing these golden and death crosses.
Currently, the RSI is often used as a contrarian indicator to determine overbought and oversold conditions, but with this approach, I believe the RSI can instead function extremely well as a trend-following indicator. Whenever an uptrend occurs, the RSI inevitably rises, and when a downtrend occurs, the RSI inevitably falls. Therefore, by predicting the rise and fall of the RSI, it becomes possible to forecast what kind of trend is likely to develop.
In this indicator, the MACD calculated from the RSI is displayed, with the original RSI line plotted above it. Since the scales of the RSI and MACD are different, I originally wanted to provide a separate scale for the RSI on the left side. However, due to TradingView’s limitations, it seems quite difficult to display more than one scale in a single panel, so I had to give up on that. Instead, I ask that you mentally multiply the RSI values displayed on the right by 10—for example, 2.11 indicates 21.1%.
Additionally, as a bonus, I’ve included a feature that detects divergences. With these features, I believe this has become the most useful indicator when compared to existing RSI-based indicators. I hope you find it helpful in your trading.
