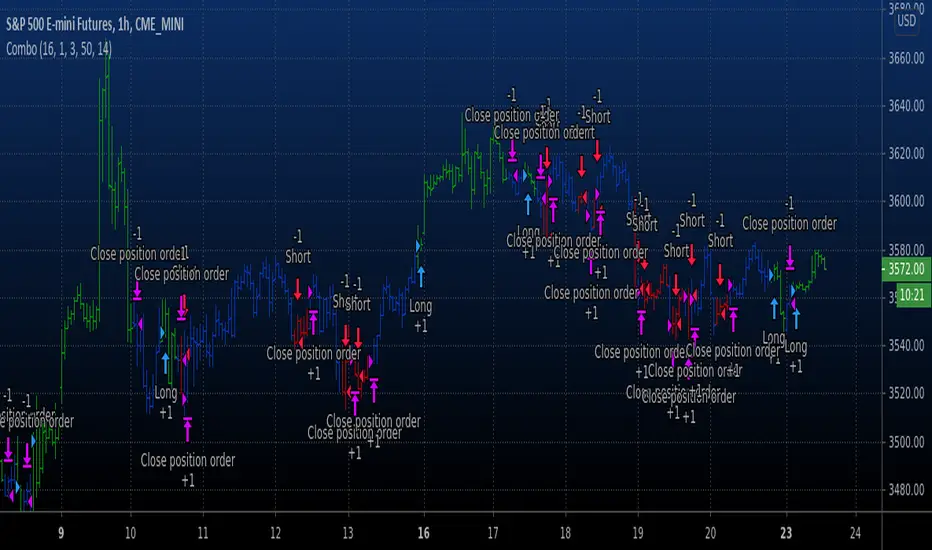
[DS]Entry_Exit_TRADE.V01-StrategyThe proposal of this script is to show the possible trading points of BUY and SELL based on the 15-minute chart of the Nasdaq Future Index. The start point of the strategy was schedule for 2021/01/01 and until the time of this publication (2021/01/31), for 1 index contract the results presented area a Gross Profit of 2.97% with a Net Profit of 1.35%.
█ FEATURES
The indicator shows on the graph the position of the MACD and TSI indicators that are the places of strength among Buyers and Sellers.
It's possible to observe a sharp fall or rise in the price of these positions.
On the current candle, a label is displayed containing the value of the William %R Mod indicator, which will display the OverBought position (dark red) and OverSold position (dark green). The other colors like light red and green are the regions where the price makes the decision of which direction to go.
There are also other indicators:
a) The positions of the BUY (light green) and SELL areas (light red);
b) The label with the position of BUY (dark green) and SELL (dark red) with the line that connects these points;
c) DEMA 72 (orange);
d) EmaOchl4 in the color green for BULL and red for BEAR market;
e) Pivots high and low
f) Maximum (purple light) and minimum areas (blue light)
█ FUNCTIONS AND SETTINGS
The indicator uses the following functions:
(1) DEMA - Double Exponential Moving Average (08,17,34, 72)
(2) ema () - Exponential Moving Averge (72, ohlc4)
(3) plot()
(4) barcolor()
(5) cross()
(6) pivots ()
(7) William R% Md (OverBought = -7, OverSold=-93)
(8) Maximum and Minimum Value
(9) fill()
(10) macd () - Moving Average Convergence Divergence (Fast Lengt=12, Slow Length=26, Source=close, Signal Smoothing=9)
(11) tsi() - Trading Strenght Indicator==> Índice de Força Real ( IFR ) (Long Length=72, Short Length=17, Signal Length=17)
(12) Buy and Sell TRADE Points
█ PERFORMANCE AND ERRORS
The positions of BUY and SELL points are defined through the crossing of the Dema 34 candles with the Ema Ohcl4. As it is an indicator, it can present different positions from de market direction. Thus there is a need to observe the direction of the market in order to verify whether the indicate decision is really acceptable. The decision to BUY or SELL an asset must be well studied to avoid financial losses. The indicator will only help you in this decision, is your responsibility the decision of entering or leaving an asset.
█ THANKS TO
PineCoders for all they do, all the tools and help they provide, and their involvement in making a better community. All the PineCoders, Pine Pros, and Pine Wizards, people who share their work and knowledge for the sake of it and helping others, I'm very happy and grate full indeed.
█ NOTE
If you have any suggestions for improving the script or need help using it, please send a message in the comments
Pesquisar nos scripts por "OHLC"

RSI Divergence 2.0RSI Divergence script will paint green or red lines depending on which way the asset is moving. The code is accessible and can be viewed. I have added alerts and the ability to change the source for slow and fast RSI values.
I have yielded better results using OHLC4 rather than the regular closing candles. As you can see it is working well with COINBASE:BTCUSD and works on all timeframes.
Best of luck!

|AG| VWAP ANALYSIS|AG| VWAP ANALYSIS
The volume-weighted average price (VWAP) is a trading benchmark used by traders that gives the average price security has traded throughout the day, based on both volume and price.
It is important because it provides traders with insight into both the trend and value of the security.
VWAP is calculated by adding up the $ traded for every transaction (price multiplied by the number of shares traded) and then dividing by the total shares traded.
A detailed formula and calculations could be found here:
-> fanf2.user.srcf.net
Actually, TradingView has an option for Anchored Vwap is a really good implementation for specific analysis.
The following script takes into account the #Time_Period_Change and plots the VWAP calculation.
The #Time_Period Available for this script are:
-> Day
-> Week
-> Monthly
-> Quarter
-> Year
1. The option that we have is the SOURCE:
-> HLC3 (High, Low, Close)/3 is the right way to calculate VWAP.
-> But I included other traditional options:
-> open, high, low, close, hl2, hlc3, ohlc4
2. The option of Turn ON/OFF VWAP
-> Timeframe selection:
-> All, 1. Day, 2. Week, 3. Month, 4. Quarter, 5. Year, 6. >=Weekly, 7. >=Montlhy
-> With this, we could select the time for plotting the VWAP. And some cool features such as >= that we are going to plot different Timeframes VWAP calculations.
-> Vwap Label:
-> We could select if show labels or not
3. The option of Turn ON/OFF Previous VWAP Level
-> VWAP of one selected Time Period is going to end with a final price this level most of the time is retested and gives us a good opportunity for entry into one trade.
Or could be used as Stop Loss.
-> Timeframe selection:
-> 1. Day, 2. Week, 3. Month, 4. Quarter, 5. Year, 6. >=Weekly, 7. >=Montlhy, 8. >=Daily
-> Factor
-> The factor options lead as increment the extension of the previous time period.
-> Example: D is the normal time period and with factor, we change from 1D to 2D in order to extend previous levels of VWAP.
->The Factor option is only available in 1. Day and 2. Week. With a Min Value of 1 and a Maximum Value of 50.
-> Labels:
-> We could select if show labels or not
4. The option of Turn ON/OFF Standard Deviation Bands
-> Label:
-> We could select if show labels or not
-> Timeframe selection:
-> 1. Day, 2. Week, 3. Month, 4. Quarter, 5. Year
5. The option of Turn ON/OFF Previous Standard Deviation
-> Timeframe selection:
-> None, 1. Day, 2. Week, 3. Month, 4. Quarter, 5. Year, 6. >=Weekly, 7. >=Montlhy, 8. Quarter & Year
-> STDEV LEVEL
-> Since there are different options for Standard Deviation I included 4 options
-> 1
-> 2
-> 3
-> User Selection
-> In this option we could select any NUMBER for STVDEV 0.25 of step.
-> Label:
-> We could select if show labels or not
6. The Lockback Setting
-> This Script also includes an option to only plot a certain amount of days back.
The main reason in order to have a more clear chart.
-> We could select between:
-> PLOT ALL
-> CUSTOM
-> If we select Custom Then we could select the Number of Days Back that is going to be plotted.
7. Color Theme
Here we select the color (Visual Desing)
-> Color Theme
-> Text Color
-> Here I use the recent input.color option added for TradingView making the color selection really simple
8. Time Period Highlighter
-> In this option, we could select one time period in order to plot one tiny background and identify the change in the time period.
-> Timeframe selection:
-> 1. Day, 2. Week, 3. Month, 4. Quarter, 5. Year
9. Label Offset
-> Finally, this option leads us to change the position of the labels into the X-axis by default 20.
This script has many options the combinations and the possibilities of making different analyses are bast.
Here some examples of what we could make:
DEFAULT SETTING:
PREVIOUS VWAP FOR TIME PERIOD >= WEEK
(work good as S&D levels)
PREVIOUS VWAP Week WITH A FACTOR OF 4
STANDARD DEVIATION BANDS - DAY
STANDARD DEVIATION BANDS - WEEK
STANDARD DEVIATION BANDS - MONTH
STANDARD DEVIATION BANDS - QUARTER
STANDARD DEVIATION BANDS - YEAR
PREVIOUS STANDARD DEVIATION - DAY SDTV 3
PREVIOUS STANDARD DEVIATION - WEEK SDTV 3
USING STANDARD DEVIATION BANDS - WEEK
WITH LOCKBACK -> PLOT ALL
WITH CUSTOM 30 DAYS
I think the options possibilities of analysis using #VWAP are truly awesome.
I like the relationship that one previous VWAP has with Standard Pivot Points.
Good Luck,
Anderson,

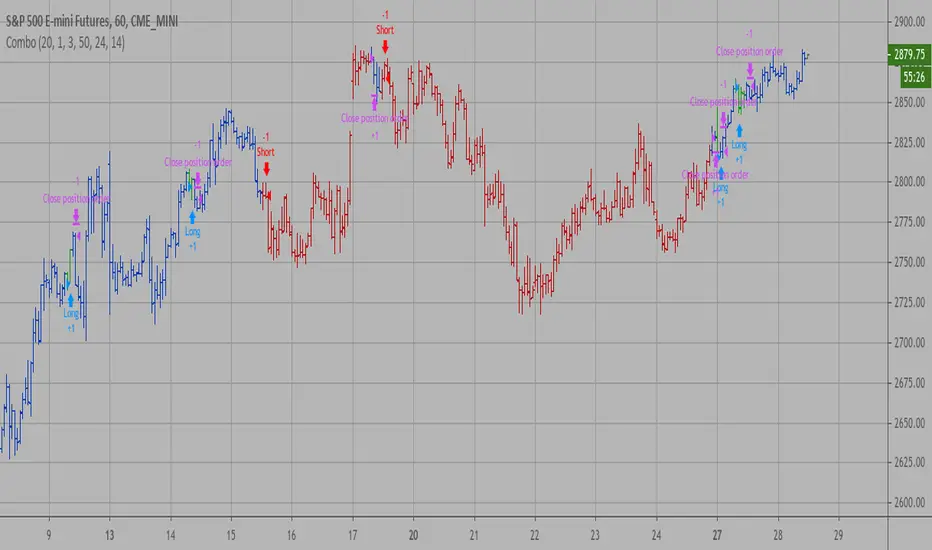
Combo Backtest 123 Reversal & High - EMA Strategy This is combo strategies for get a cumulative signal.
First strategy
This System was created from the Book "How I Tripled My Money In The
Futures Market" by Ulf Jensen, Page 183. This is reverse type of strategies.
The strategy buys at market, if close price is higher than the previous close
during 2 days and the meaning of 9-days Stochastic Slow Oscillator is lower than 50.
The strategy sells at market, if close price is lower than the previous close price
during 2 days and the meaning of 9-days Stochastic Fast Oscillator is higher than 50.
Second strategy
This indicator plots the difference between the High (of the previous period)
and an exponential moving average (13 period) of the Close (of the previous period).
You can use in the xPrice any series: Open, High, Low, Close, HL2, HLC3, OHLC4 and ect...
It buy if indicator above 0 and sell if below.
WARNING:
- For purpose educate only
- This script to change bars colors.
Combo Backtest 123 Reversal & FX Sniper: T3-CCI This is combo strategies for get a cumulative signal.
First strategy
This System was created from the Book "How I Tripled My Money In The
Futures Market" by Ulf Jensen, Page 183. This is reverse type of strategies.
The strategy buys at market, if close price is higher than the previous close
during 2 days and the meaning of 9-days Stochastic Slow Oscillator is lower than 50.
The strategy sells at market, if close price is lower than the previous close price
during 2 days and the meaning of 9-days Stochastic Fast Oscillator is higher than 50.
Second strategy
This simple indicator gives you a lot of useful information - when to enter, when to exit
and how to reduce risks by entering a trade on a double confirmed signal.
You can use in the xPrice any series: Open, High, Low, Close, HL2, HLC3, OHLC4 and ect...
WARNING:
- For purpose educate only
- This script to change bars colors.

Combo Strategy 123 Reversal & FX Sniper: T3-CCI This is combo strategies for get a cumulative signal.
First strategy
This System was created from the Book "How I Tripled My Money In The
Futures Market" by Ulf Jensen, Page 183. This is reverse type of strategies.
The strategy buys at market, if close price is higher than the previous close
during 2 days and the meaning of 9-days Stochastic Slow Oscillator is lower than 50.
The strategy sells at market, if close price is lower than the previous close price
during 2 days and the meaning of 9-days Stochastic Fast Oscillator is higher than 50.
Second strategy
This simple indicator gives you a lot of useful information - when to enter, when to exit
and how to reduce risks by entering a trade on a double confirmed signal.
You can use in the xPrice any series: Open, High, Low, Close, HL2, HLC3, OHLC4 and ect...
WARNING:
- For purpose educate only
- This script to change bars colors.

[M2J] Price SourceThis script is not an indicator. This script is for pine coder to use different type of price sources
Close
Open
High
Low
HL2
HLC3
OHLC4
Median Body
Weighted Close
Trend Biased
Trend Biased Extreme

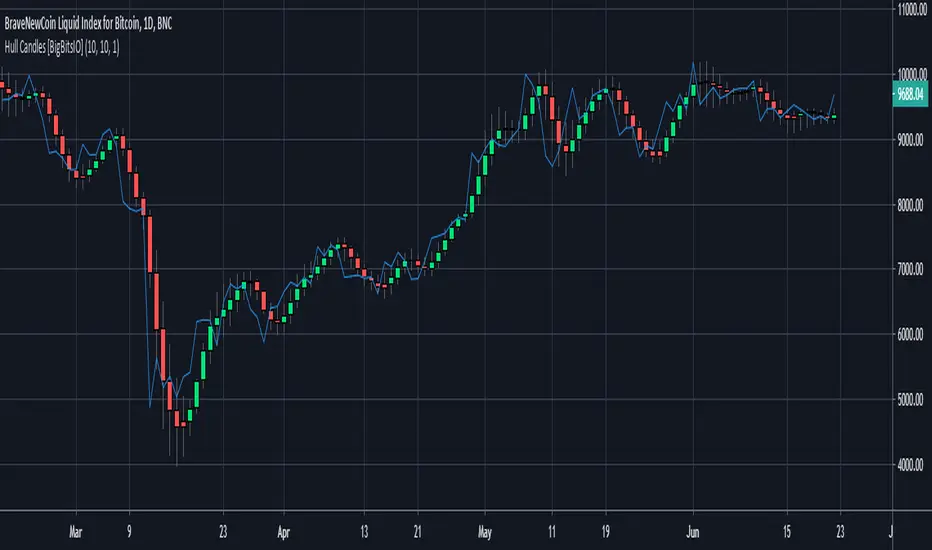
Hull Candles [BigBitsIO]This script is for custom candles based on an HMA calculation with a default period of 10 as well as an SMA of the close price, defaulted to 1 period to only show the current price. The purpose of the custom candles is to try and reduce noise from candles and help identify trends. These custom candles somewhat resemble Heikin-Ashi candles in their appearance.
Explained:
- Open, High, Low and Close (o, h, l, and c) are all calculated using an HMA calculation based on a user input length/period, defaulted at 10.
- Candle colors are determined by using the same HMA calculation on the ohcl4 and comparing it to the previous candle. Green candles have an ohlc4 greater than the previous candle, all other candles are red.
- The current price is plotted with the default blue line with an SMA calculation with 1 period to allow customization of smoothing if necessary to identify trends.
DISCLAIMER: For educational and entertainment purposes only. Nothing in this content should be interpreted as financial advice or a recommendation to buy or sell any sort of security or investment including all types of crypto. DYOR, TYOB.
Combo Backtest 123 Reversal & Elder Ray (Bull Power) This is combo strategies for get a cumulative signal.
First strategy
This System was created from the Book "How I Tripled My Money In The
Futures Market" by Ulf Jensen, Page 183. This is reverse type of strategies.
The strategy buys at market, if close price is higher than the previous close
during 2 days and the meaning of 9-days Stochastic Slow Oscillator is lower than 50.
The strategy sells at market, if close price is lower than the previous close price
during 2 days and the meaning of 9-days Stochastic Fast Oscillator is higher than 50.
Second strategy
Developed by Dr Alexander Elder, the Elder-ray indicator measures buying
and selling pressure in the market. The Elder-ray is often used as part
of the Triple Screen trading system but may also be used on its own.
Dr Elder uses a 13-day exponential moving average (EMA) to indicate the
market consensus of value. Bull Power measures the ability of buyers to
drive prices above the consensus of value. Bear Power reflects the ability
of sellers to drive prices below the average consensus of value.
Bull Power is calculated by subtracting the 13-day EMA from the day's High.
Bear power subtracts the 13-day EMA from the day's Low.
You can use in the xPrice any series: Open, High, Low, Close, HL2, HLC3, OHLC4 and ect...
WARNING:
- For purpose educate only
- This script to change bars colors.

Combo Strategy 123 Reversal & Elder Ray (Bull Power) This is combo strategies for get a cumulative signal.
First strategy
This System was created from the Book "How I Tripled My Money In The
Futures Market" by Ulf Jensen, Page 183. This is reverse type of strategies.
The strategy buys at market, if close price is higher than the previous close
during 2 days and the meaning of 9-days Stochastic Slow Oscillator is lower than 50.
The strategy sells at market, if close price is lower than the previous close price
during 2 days and the meaning of 9-days Stochastic Fast Oscillator is higher than 50.
Second strategy
Developed by Dr Alexander Elder, the Elder-ray indicator measures buying
and selling pressure in the market. The Elder-ray is often used as part
of the Triple Screen trading system but may also be used on its own.
Dr Elder uses a 13-day exponential moving average (EMA) to indicate the
market consensus of value. Bull Power measures the ability of buyers to
drive prices above the consensus of value. Bear Power reflects the ability
of sellers to drive prices below the average consensus of value.
Bull Power is calculated by subtracting the 13-day EMA from the day's High.
Bear power subtracts the 13-day EMA from the day's Low.
You can use in the xPrice any series: Open, High, Low, Close, HL2, HLC3, OHLC4 and ect...
WARNING:
- For purpose educate only
- This script to change bars colors.

Combo Backtest 123 Reversal & Elder Ray (Bear Power) This is combo strategies for get a cumulative signal.
First strategy
This System was created from the Book "How I Tripled My Money In The
Futures Market" by Ulf Jensen, Page 183. This is reverse type of strategies.
The strategy buys at market, if close price is higher than the previous close
during 2 days and the meaning of 9-days Stochastic Slow Oscillator is lower than 50.
The strategy sells at market, if close price is lower than the previous close price
during 2 days and the meaning of 9-days Stochastic Fast Oscillator is higher than 50.
Second strategy
Developed by Dr Alexander Elder, the Elder-ray indicator measures buying
and selling pressure in the market. The Elder-ray is often used as part
of the Triple Screen trading system but may also be used on its own.
Dr Elder uses a 13-day exponential moving average (EMA) to indicate the
market consensus of value. Bull Power measures the ability of buyers to
drive prices above the consensus of value. Bear Power reflects the ability
of sellers to drive prices below the average consensus of value.
Bull Power is calculated by subtracting the 13-day EMA from the day's High.
Bear power subtracts the 13-day EMA from the day's Low.
You can use in the xPrice any series: Open, High, Low, Close, HL2, HLC3, OHLC4 and ect...
WARNING:
- For purpose educate only
- This script to change bars colors.

Combo Strategy 123 Reversal & Elder Ray (Bear Power) This is combo strategies for get a cumulative signal.
First strategy
This System was created from the Book "How I Tripled My Money In The
Futures Market" by Ulf Jensen, Page 183. This is reverse type of strategies.
The strategy buys at market, if close price is higher than the previous close
during 2 days and the meaning of 9-days Stochastic Slow Oscillator is lower than 50.
The strategy sells at market, if close price is lower than the previous close price
during 2 days and the meaning of 9-days Stochastic Fast Oscillator is higher than 50.
Second strategy
Developed by Dr Alexander Elder, the Elder-ray indicator measures buying
and selling pressure in the market. The Elder-ray is often used as part
of the Triple Screen trading system but may also be used on its own.
Dr Elder uses a 13-day exponential moving average (EMA) to indicate the
market consensus of value. Bull Power measures the ability of buyers to
drive prices above the consensus of value. Bear Power reflects the ability
of sellers to drive prices below the average consensus of value.
Bull Power is calculated by subtracting the 13-day EMA from the day's High.
Bear power subtracts the 13-day EMA from the day's Low.
You can use in the xPrice any series: Open, High, Low, Close, HL2, HLC3, OHLC4 and ect...
WARNING:
- For purpose educate only
- This script to change bars colors.

Strategy Tester EMA-SMA-RSI-MACDOn Tradingview I never saw a custom adjustable strategy script yet, so this is it,
you can change different things and see if you'll get a good strategy or not
Settings:
First choose the source, you can choose out of:
close, open, high, low, ohlc4, hlc3, hl2
Then choose you strategy: Long & Short, Long only or Short only
Next, choose your entry "Buy/Long" (which is the "close Short position" when "Short"):
- (E)MA 1 > (E)MA 2 (Each can be made ema or sma)
- close above (E)MA 1
- RSI strategy
- macd > signal
- macd > 0
- signal > 0
Then choose your RSI values if needed (for example you want a trigger when EMA 1 > SMA 2
but only if RSI > 60, then change "IF RSI >" from 0 to 60
Next you can choose an extra argument
and even a second argument with Higher Time Frame settings
Under this you can change your (E)MA values as desired (HTF values, MACD and RSI length can be found lower)
All the same with the exit/close (or if "Short", this is your entry)
Again, change everything as you wish
Then comes the RSI length setting, MACD settings and HTF settings, followed by SL/TP settings
(you also can enable/disable SL/TP), and TIME settings (for example you want to know the profit only from this year)
Alerts are provided in next script
Have fun!
Combo Backtest 123 Reversal & Elder Ray (Bear Power) This is combo strategies for get a cumulative signal.
First strategy
This System was created from the Book "How I Tripled My Money In The
Futures Market" by Ulf Jensen, Page 183. This is reverse type of strategies.
The strategy buys at market, if close price is higher than the previous close
during 2 days and the meaning of 9-days Stochastic Slow Oscillator is lower than 50.
The strategy sells at market, if close price is lower than the previous close price
during 2 days and the meaning of 9-days Stochastic Fast Oscillator is higher than 50.
Second strategy
Developed by Dr Alexander Elder, the Elder-ray indicator measures buying
and selling pressure in the market. The Elder-ray is often used as part
of the Triple Screen trading system but may also be used on its own.
Dr Elder uses a 13-day exponential moving average (EMA) to indicate the
market consensus of value. Bear Power measures the ability of sellers to
drive prices below the consensus of value. Bear Power reflects the ability
of sellers to drive prices below the average consensus of value.
Bull Power is calculated by subtracting the 13-day EMA from the day's High.
Bear power subtracts the 13-day EMA from the day's Low.
You can use in the xPrice any series: Open, High, Low, Close, HL2, HLC3, OHLC4 and ect...
WARNING:
- For purpose educate only
- This script to change bars colors.
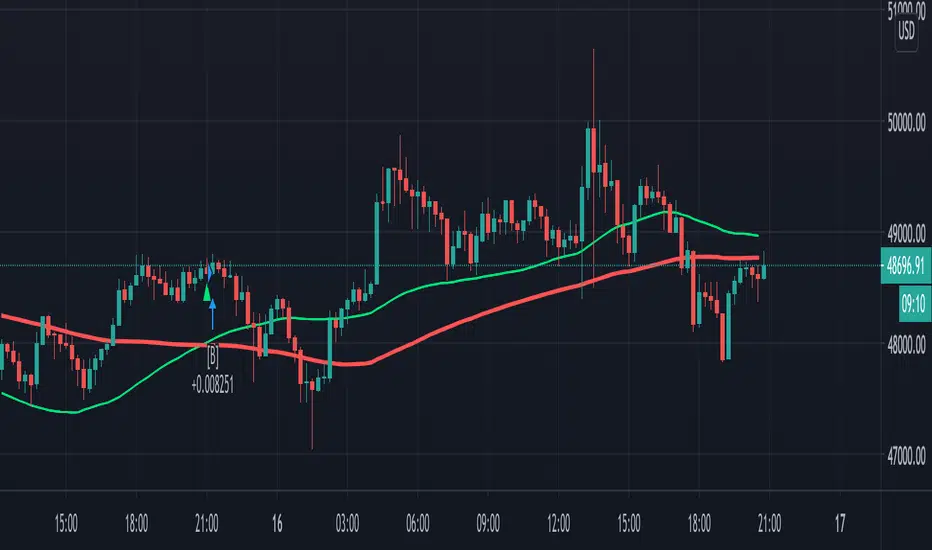
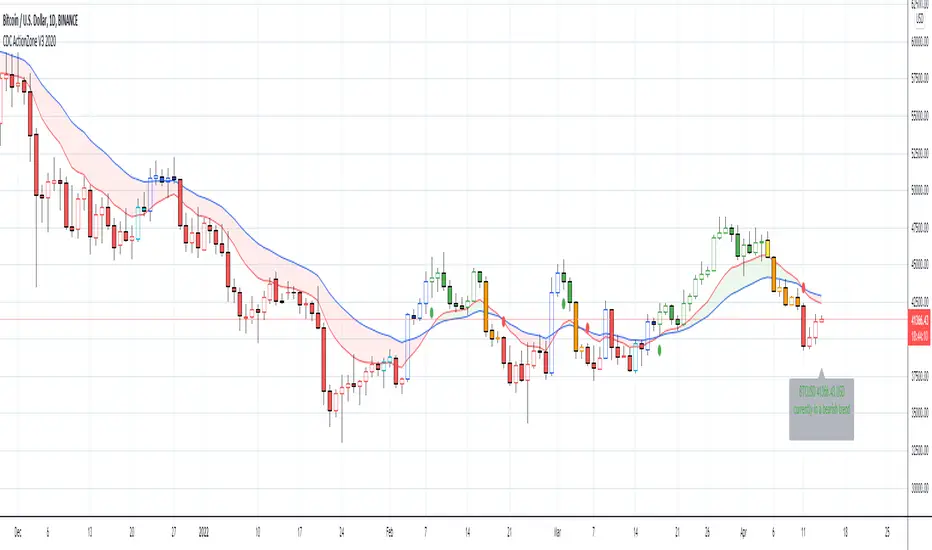
CDC ActionZone V3 2020## CDC ActionZone V3 2020 ##
This is an update to my earlier script, CDC ActionZone V2
The two scripts works slightly differently with V3 reacting slightly faster.
The main update is focused around conforming the standard to Pine Script V4.
## How it works ##
ActionZone is a very simple system, utilizing just two exponential moving
averages. The 'Zones' in which different 'actions' should be taken is
highlighted with different colors on the chart. Calculations for the zones
are based on the relative position of price to the two EMA lines and the
relationship between the two EMAs
CDCActionZone is your barebones basic, tried and true, trend following system
that is very simple to follow and has also proven to be relatively safe.
## How to use ##
The basic method for using ActionZone is to follow the green/red color.
Buy when bar closes in green.
Sell when bar closes in red.
There is a small label to help with reading the buy and sell signal.
Using it this way is safe but slow and is expected to have around 35-40%
accuracy, while yielding around 2-3 profit factors. The system works best
on larger time frames.
The more advanced method uses the zones to switch between different
trading system and biases, or in conjunction with other indicators.
example 1:
Buy when blue and Bullish Divergence between price and RSI is visible,
if not Buy on Green and vise-versa
example 2:
Set up a long-biased grid and trade long only when actionzone is in
green, yellow or orange.
change the bias to short when actionzone turns to te bearish side
(red, blue, aqua)
(Look at colors on a larger time frame)
## Note ##
The price field is set to close by default. change to either HL2 or OHLC4
when using the system in intraday timeframes or on market that does not close
(ie. Cryptocurrencies)
## Note2 ##
The fixed timeframe mode is for looking at the current signal on a larger time frame
ie. When looking at charts on 1h you can turn on fixed time frame on 1D to see the
current 'zone' on the daily chart plotted on to the hourly chart.
This is useful if you wanted to use the system's 'Zones' in conjunction with other
types of signals like Stochastic RSI, for example.
Combo Strategy 123 Reversal & Elder Ray (Bear Power) This is combo strategies for get a cumulative signal.
First strategy
This System was created from the Book "How I Tripled My Money In The
Futures Market" by Ulf Jensen, Page 183. This is reverse type of strategies.
The strategy buys at market, if close price is higher than the previous close
during 2 days and the meaning of 9-days Stochastic Slow Oscillator is lower than 50.
The strategy sells at market, if close price is lower than the previous close price
during 2 days and the meaning of 9-days Stochastic Fast Oscillator is higher than 50.
Second strategy
Developed by Dr Alexander Elder, the Elder-ray indicator measures buying
and selling pressure in the market. The Elder-ray is often used as part
of the Triple Screen trading system but may also be used on its own.
Dr Elder uses a 13-day exponential moving average (EMA) to indicate the
market consensus of value. Bear Power measures the ability of sellers to
drive prices below the consensus of value. Bear Power reflects the ability
of sellers to drive prices below the average consensus of value.
Bull Power is calculated by subtracting the 13-day EMA from the day's High.
Bear power subtracts the 13-day EMA from the day's Low.
You can use in the xPrice any series: Open, High, Low, Close, HL2, HLC3, OHLC4 and ect...
WARNING:
- For purpose educate only
- This script to change bars colors.

Vanilla ABCD PatternPatterns makes parts of the many predictive tools available to technical analysts, the most simples ones can be easily detected by using scripts. The proposed tool detect the simple (vanilla) form of the ABCD pattern, a pattern aiming to detect potential price swings. The script can use an additional confirmation condition that aim to filter potential false signals.
ABCD PATTERN
The ABCD pattern is not meant to be detected by analyzing individuals closing price observations but by analyzing longer term movements, this is done by using tools such as zig-zag. Like any pattern the ABCD one comes in different flavors, the simplest being based on the following structures:
Once price reach D we can expect a reversal. The classical pattern has the following conditions : BC = 0.618*AB and CD = 1.618*AB , as you can see this condition is based on 0.618 which is a ratio in the Fibonacci sequence. Other conditions are for AB to equal to CD or for CD to be 161.8% longer than AB. Why these conditions ? Cause Fibonacci of course .
The ABCD pattern that the proposed tool aim to detect is not based on the zig-zag but only on individual price observations and don't make use of any of the previously described conditions, thus becoming more like a candle pattern.
When the label is blue it means that the tool has detected a bullish ABCD pattern, while a red label means that the tool has detected a bearish ABCD pattern.
We can't expect patterns based on the analysis of 1,2,3 or 4 closing price observations to predict the reversal of mid/long term movements, this can be seen on the above chart, but we can see some signals predicting short term movements.
Since the pattern is based on a noisy variation, using smoother input can result in less signals.
Above the tool on BTCUSD using closing price as input. Below the tool using ohlc4 as input:
TOOL OPTIONS
Being to early can be as devastating as being to late, therefore a confirmation point can be beneficial, the tool allow you to wait for confirmation thus having a potentially better timing. Below is a chart of AMD with no confirmation:
As we can see there are many signals with some of them occurring to early, we can fix this by checking the confirmation option:
The confirmation is simply based on the candle color, for example if a bearish ABCD pattern has been detected in the past and the closing price is greater than the opening price then the tool return a buy signal. The same apply with a bearish ABCD pattern.
The "last bar repaint" option is true by default, this in order to show the bar where the D point of the pattern has been detected, since the closing price of the last bar is constantly changing the signals on the last bar can be constantly appearing/disappearing, unchecking the option will fix this but will no longer the bar where the D point of the pattern has been detected.
SUMMARY
The pattern is simple and can sometimes be accurate when predicting the direction of future short terms movements. The tool was a request, as it seems i don't post many pattern detectors, well thats true, and the reason is that for me patterns are not super significant, and their detection can be extremely subjective, this is why simple patterns are certainly the only ones worth a look.
Don't expect me to post many pattern related indicators in the future ^^'

ATR Percentage of PriceThis indicator takes the standard ATR and expresses it as a percentage of the OHLC4 price. This has the advantage of normalising the ATR value across the history of an asset. For example, an ATR of value 20 when the price is 2000 actually has a very different meaning when the price rises to 4000. The ATR may be the same value but actually the volatility it represents has halved.
I also add an SMA to the value and a histogram which shows the difference between the two. Positive values mean that volatility is expanding while negative values mean volatility is contracting.
Squeeze Momentum Strategy based on Indicator [LazyBear][Bitduke]I improved Squeeze Momentum Indicator by LazyBear (momentum filter, changed data source to ohlc4) and transformed it into a strategy, adding a risk management system + ability to customize time frames for backtest.
Shortly about Squeeze Momentum Indicator:
This is a derivative of John Carter's "TTM Squeeze" volatility indicator, as discussed in his book "Mastering the Trade" (chapter 11).
Backtested on XBTUSD, ETHUSD (Bitmex). As you may notice it shows good results on 1h - 4h timeframes on these timeframes among these pairs. Relatively low drawdown ~ 12% (to date).

(JS) Ultimate RSISo my goal here was to combine all of my RSI ideas into a single indicator in order to make kind of a "Swiss Army Knife" version of the Relative Strength Index ...
------------------------------------------------------------------------------------------------------------------------------------------------------------------------------------------------------------------------------------------------------------------
So, let's begin with the first RSI indicator I made, which is the RSIDVW (Divergence/Volume Weighted);
To rephrase my original post, the "divergence/volume weighted" portion is meant to expand upon the current RSI format by adding more variables into the equation.
The standard RSI is based off one value that you select (open, close, OHLC4, HLC3, etc.) while this version takes three variables into account.
The default setting is to have RSI normal without anything added to it (Divergence Weight = 0)
1st - it takes the standard variable that RSI normally uses.
2nd - it factors RSI divergence by taking the RSI change % and price change % to form a ratio. Using this ratio, I duplicated the RSI formula and created a divergence RS to be factored in with the standard price RS .
3rd - it takes Relative Volume and amplifies/weakens the move based upon volume confirmation. (So if Relative Volume for a price bar is 1.0, the RSI plot would be the same as it normally would)
So to explain the parameters
- Relative Volume Length: This uses the RV length you specify to determine spikes in volume (or lack of volume ), which then is added into the formula to influence the strength of the RSI move
- RV x Divergence: This is how I calculated the original formula, but you can leave this unchecked to turn Relative Volume off, or apply elsewhere.
- RV x RS: There's two sides, Divergence RS and Standard RS - these check marks allow you to select which part you prefer to be multiplied by Relative Volume .
Checking neither turns off Relative Volume , while checking both amplifies its effects by placing it on both sides of the equation.
-Divergence Weight: This controls how much the DVW portion of the formula influences the RSI plot. As I referred to earlier, default is 0 making RSI normal. The Scale is 0-2, so 1.0 would be the same as 50%.
When I do have DVW on, I generally set it to 0.5
-SMA Divergence: To smooth, or not to smooth, that is the question. UJsing an SMA here is much smoother in my opinon, but leaving it unchecked runs it through an RMA the same way standard RSI is calculated.
-Show Fractal Channel: This allows you to see the whole fractal channel around the RSI (This portion of the code, compliments of the original Ricardo Santos fractal script)
------------------------------------------------------------------------------------------------------------------------------------------------------------------------------------------------------------------------------------------------------------------
The next portion of the script is adding a "Slow RSI"...
This is rather simple really, it allows you to add a second RSI plot so that you can watch for crossovers between fast and slow lines.
-Slow RSI: This turns on the second RSI Plot.
-Slow RSI Length: This determines the length of the second RSI Plot.
------------------------------------------------------------------------------------------------------------------------------------------------------------------------------------------------------------------------------------------------------------------
Pivot Point RSI was something a friend of mine requested I make which turned out pretty cool, I thought... It is also available in this indicator.
-Pivot Points: Selecting this enables the rest of the pivot point related parts of the script
If Pivot Points isn't selected, none of the following things will work
-Plot Pivot: Plots the pivot point .
-Plot S1/R1: Plots S1/R1.
-Plot S2/R2: Plots S2/R2.
-Plot S3/R3: Plots S3/R3.
-Plot S4/R4: Plots S4/R4.
-Plot S5/R5: Plots S5/R5.
-Plot Halfway Points: Plots a line between each pivot .
-Show Pivot Labels: Shows the proper label for each pivot .
When using intraday charts, from a 15 minute interval or less the pivots are calculated based on a single days worth of price action, above that the distance expands.
Here are the current resolutions Pivot Points will work with:
Minutes - 1 , 2, 3, 5, 10, 13, 15, 20, 30, 39, 78, 130, 195
Hours - 1, 2, 3, 4, 5, 6
Daily
Weekly
Currently not available on seconds or monthly
------------------------------------------------------------------------------------------------------------------------------------------------------------------------------------------------------------------------------------------------------------------
Background Colors
Background Colors: I have six color schemes I created for this which can be toggled here (they can be edited).
Gray Background for Dark Mode: Having this on looks much better when using dark mode on your charts.
------------------------------------------------------------------------------------------------------------------------------------------------------------------------------------------------------------------------------------------------------------------
Now finally the last portion, Fibonacci Levels
-Fibonacci Levels: This is off, by default, which then uses the standard levels on RSI (30-50-70). When turned on, it removes these and marks fib levels from 0.146 through 0.886.
------------------------------------------------------------------------------------------------------------------------------------------------------------------------------------------------------------------------------------------------------------------
So the quick rundown:
Ultimate RSI contains "divergence/volume weighted" modifications, a slow RSI plot, pivot points , and Fibonacci levels all while auto-plotting divergence and having the trend illustrated in the background colors.
RSI has always been my "go to" indicator, so I hope you all enjoy this as much as I do!

CryptOli 3 MAs long/short Backtest// this is an educational Script - basicly its very simple - you can see how minimal changes impact results, thats why i posted it
// Credits to Quantnomad to publish tons of free educational script
// this Script is based on Quantnomads Ultimate MA Indicator
// HA - Option for calcultion based on HA-Candles (very famous recently)
// Source Input - Option (Candletype for calculation, close, ohlc4 ect.) --- there are huge differences --- try it by your own

Noro's ZZ-4 StrategyIndicator by Noro
The Price Channel indicator is used.
Used OHLC4 to calculate the values of the Price Channel indicator.
Red lines are drawn from the lower boundary of the price channel.
Lime lines are drawn from the upper boundary of the price channel.
Trading
You need to use market stop orders.
If the price is higher than the lime line, open the long position (and close the short position)
If the price is lower than the red line, open the short position (and close the long position)

EMA X BF 🚀EMA Crossover Strategy
A simple EMA cross is a useful indication of a change in direction of a trend and is a very popular tool in trading. It can also be useful to judge price action momentum or severity by looking at the angle of the 2 EMAs, or the distance between them.
There are 2 Exponential Moving Averages, one fast and one slow. When the fast EMA crosses above the slow EMA, this can be considered bullish and may signal an upside move. Conversely, a cross to the downside of the fast EMA under the slow EMA can be considered bearish.
This strategy uses the same principle but uses different sources for the 2 EMAs; instead of using close values, we use ohlc4 values for the fast EMA and hlc3 values for the slow EMA.
The idea is that a trader might enter a long position upon a cross up and reverse position and go short upon the next cross down.
We use a simple 6% stop loss for both long and short positions.
This strategy is tuned to a 6hr chart for Bitcoin USD pairs.
INSTRUCTIONS
Go Long when the background is green
Go short when the background is red
White background means sideways market: a no trade zone
