Adaptive RSI (ARSI)# Adaptive RSI (ARSI) - Dynamic Momentum Oscillator
Adaptive RSI is an advanced momentum oscillator that dynamically adjusts its calculation period based on real-time market volatility and cycle analysis. Unlike traditional RSI that uses fixed periods, ARSI continuously adapts to market conditions, providing more accurate overbought/oversold signals and reducing false signals during varying market phases.
## How It Works
At its core, ARSI calculates an adaptive period ranging from 8 to 28 bars using two key components: volatility measurement through Average True Range (ATR) and cycle detection via price momentum analysis. The logic is straightforward:
- **High volatility periods** trigger shorter calculation periods for enhanced responsiveness to rapid price movements
- **Low volatility periods** extend the calculation window for smoother, more reliable signals
- **Market factor** combines volatility and cycle analysis to determine optimal RSI period in real-time
When RSI crosses above 70, the market enters overbought territory. When it falls below 30, oversold conditions emerge. The indicator also features extreme levels at 80/20 for stronger reversal signals and midline crossovers at 50 for trend confirmation.
The adaptive mechanism ensures the oscillator remains sensitive during critical market movements while filtering out noise during consolidation phases, making it superior to static RSI implementations across different market conditions.
## Features
- **True Adaptive Calculation**: Dynamic period adjustment from 8-28 bars based on market volatility
- **Multiple Signal Types**: Overbought/oversold, extreme reversals, and midline crossovers
- **Configurable Parameters**: RSI length, adaptive sensitivity, ATR period, min/max bounds
- **Smart Smoothing**: Adjustable EMA smoothing from 1-21 periods to reduce noise
- **Visual Clarity**: Gradient colors, area fills, and signal dots for immediate trend recognition
- **Real-time Information**: Live data table showing current RSI, adaptive period, and market factor
- **Flexible Source Input**: Apply to any price source (close, hl2, ohlc4, etc.)
- **Professional Alerts**: Six built-in alert conditions for automated trading systems
## Signal Generation
ARSI generates multiple signal types for comprehensive market analysis:
**Primary Signals**: RSI crosses above 70 (overbought) or below 30 (oversold) - most reliable entry/exit points
**Extreme Signals**: RSI reaches 80+ (extreme overbought) or 20- (extreme oversold) - potential reversal zones
**Trend Signals**: RSI crosses above/below 50 midline - confirms directional momentum
**Reversal Signals**: Price action contradicts extreme RSI levels - early turning point detection
The adaptive period changes provide additional confirmation - signals accompanied by significant period shifts often carry higher probability of success.
## Visual Implementation
The indicator employs sophisticated visual elements for instant market comprehension:
- **Gradient RSI Line**: Color intensity reflects both value and momentum direction
- **Dynamic Zones**: Overbought/oversold areas with customizable fill colors
- **Signal Markers**: Triangular indicators mark key reversal and continuation points
- **Information Panel**: Real-time display of RSI value, adaptive period, market factor, and signal status
- **Background Coloring**: Subtle fills indicate current market state without chart clutter
## Parameter Configuration
**RSI Settings**:
- RSI Length: Base calculation period (default: 14)
- Adaptive Sensitivity: Response aggressiveness to volatility changes (default: 1.0)
- ATR Length: Volatility measurement period (default: 14)
- Min/Max Period: Adaptive calculation boundaries (default: 8/28)
- Smoothing Length: Final noise reduction filter (default: 3)
**Level Settings**:
- Overbought/Oversold: Standard signal levels (default: 70/30)
- Extreme Levels: Enhanced reversal zones (default: 80/20)
- Midline Display: 50-level trend confirmation toggle
**Visual Settings**:
- Line Width: RSI line thickness (1-5)
- Area Fills: Zone highlighting toggle
- Gradient Colors: Dynamic color intensity
- Signal Dots: Entry/exit marker display
## Alerts
ARSI includes six comprehensive alert conditions:
- **ARSI Overbought** - RSI crosses above overbought level
- **ARSI Oversold** - RSI crosses below oversold level
- **ARSI Bullish Cross** - RSI crosses above 50 midline
- **ARSI Bearish Cross** - RSI crosses below 50 midline
- **ARSI Extreme Bull** - Potential bullish reversal from extreme oversold
- **ARSI Extreme Bear** - Potential bearish reversal from extreme overbought
## Use Cases
**Trend Following**: Adaptive periods naturally adjust during trend acceleration and consolidation phases
**Mean Reversion**: Enhanced overbought/oversold signals with volatility-based confirmation
**Breakout Trading**: Extreme level breaches often precede significant directional moves
**Risk Management**: Multiple signal types allow for layered entry/exit strategies
**Multi-Timeframe Analysis**: Works effectively across various timeframes and asset classes
## Trading Applications
**Swing Trading**: Excels during trend transitions with adaptive sensitivity to changing conditions
**Day Trading**: Enhanced responsiveness during volatile sessions while filtering consolidation noise
**Position Trading**: Longer smoothing periods provide stable signals for broader market analysis
**Scalping**: Minimal smoothing with high sensitivity captures short-term momentum shifts
The indicator performs well across stocks, forex, commodities, and cryptocurrencies, though parameter optimization may be required for specific market characteristics.
## Settings Summary
**Display Settings**:
- RSI Length: Moving average baseline period
- Adaptive Sensitivity: Volatility response factor
- ATR Length: Volatility measurement window
- Min/Max Period: Adaptive calculation boundaries
- Smoothing Length: Noise reduction filter
**Level Configuration**:
- Overbought/Oversold: Primary signal thresholds
- Extreme Levels: Secondary reversal zones
- Midline Display: Trend confirmation toggle
**Visual Options**:
- Line Width: RSI line appearance
- Area Fills: Zone highlighting
- Gradient Colors: Dynamic visual feedback
- Signal Dots: Entry/exit markers
## Disclaimer
This indicator is provided for educational and informational purposes only. It is not financial advice. Trading involves substantial risk of loss and is not suitable for all investors. Past performance is not indicative of future results. Always conduct thorough testing and risk assessment before live implementation. The adaptive nature of this indicator requires understanding of its behavior across different market conditions for optimal results.
Pesquisar nos scripts por "OHLC"

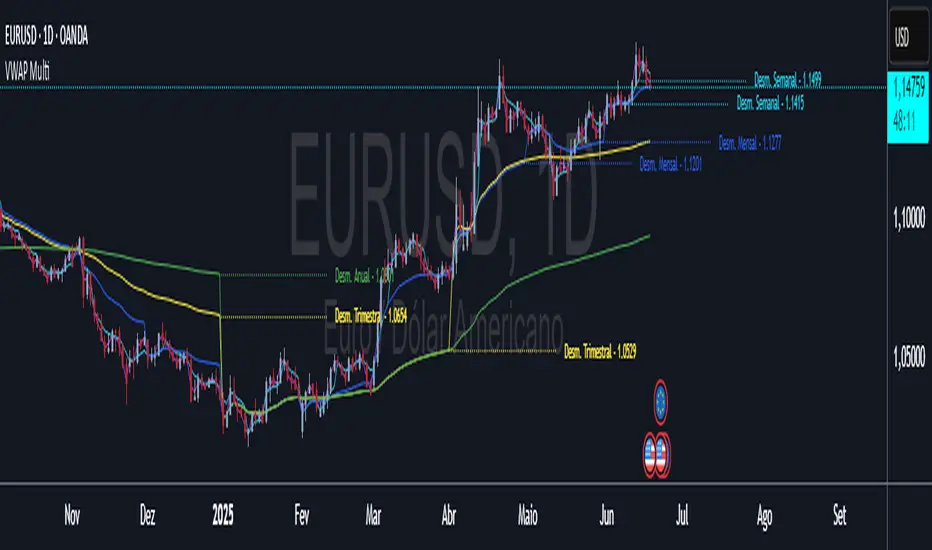
VWAP Multi-Timeframe VWAP Multi-Timeframe - Complete Professional Indicator
🚀 WHAT IS IT?
The VWAP Multi-Timeframe is an advanced indicator that combines 5 different VWAP periods in a single tool, providing a complete view of market fair value levels across multiple time scales.
⭐ KEY FEATURES
📊 5 Configurable VWAPs:
🟡 Daily VWAP - Ideal for day trading and intraday operations
🟠 Weekly VWAP - Perfect for swing trading
🔵 Monthly VWAP - Excellent for medium-term analysis
🔴 Quarterly VWAP - Essential for quarterly strategies
🟢 Yearly VWAP - Fundamental for long-term investments
🎯 Multiple Price Sources:
Choose the source that best fits your strategy:
Close - Closing price (most common)
OHLC4 - Complete average (smoother)
HLC3 - Typical price (default)
HL2 - Period midpoint
Open/High/Low - Specific prices
💡 HOW TO USE
For Day Traders:
Use Daily VWAP as main fair value reference
Prices above = buying pressure / Prices below = selling pressure
For Swing Traders:
Combine Weekly and Monthly VWAP to identify trends
Look for confluences between different timeframes
For Investors:
Quarterly and Yearly VWAP show long-term value levels
Excellent for identifying entry points in investments
🔧 TECHNICAL FEATURES
✅ Pine Script v6 - Latest and optimized version
✅ Clean Interface - User-friendly design
RSI Multi-TF TabRSI Multi-Timeframe Table 📊
A tool for multi-timeframe RSI analysis with visual overbought/oversold level highlighting.
Description
This indicator calculates the Relative Strength Index (RSI) for the current chart and displays RSI values across five additional timeframes (15m, 1h, 4h, 1d, 1w) in a dynamic table. The color-coded system simplifies identifying overbought (>70), oversold (<30), and neutral zones. Visual signals on the chart enhance analysis for the current timeframe.
Key Features
✅ Multi-Timeframe Analysis :
Track RSI across 15m, 1h, 4h, 1d, and 1w in a compact table.
Color-coded alerts:
🔴 Red — Overbought (potential pullback),
🔵 Blue — Oversold (potential rebound),
🟡 Yellow — Neutral zone.
✅ Visual Signals :
Background shading for oversold/overbought zones on the main chart.
Horizontal lines at 30 and 70 levels for reference.
✅ Customizable Settings :
Adjust RSI length (default: 14), source (close, open, high, etc.), and threshold levels.
How to Use
Table Analysis :
Compare RSI values across timeframes to spot divergences (e.g., overbought on 15m vs. oversold on D).
Use colors for quick decisions.
Chart Signals :
Blue background suggests bullish potential (oversold), red hints at bearish pressure (overbought).
Always confirm with other tools (volume, trends, or candlestick patterns).
Examples :
RSI(1h) > 70 while RSI(4h) < 30 → Possible reversal upward.
Sustained RSI(1d) above 50 may indicate a bullish trend.
Settings
RSI Length : Period for RSI calculation (default: 14).
RSI Source : Data source (close, open, high, low, hl2, hlc3, ohlc4).
Overbought/Oversold Levels : Thresholds for alerts (default: 70/30).
Important Notes
No direct trading signals : Use this as an analytical tool, not a standalone strategy.
Test strategies historically and consider market context before trading.

EMD Trend [InvestorUnknown]EMD Trend is a dynamic trend-following indicator that utilizes Exponential Moving Deviation (EMD) to build adaptive channels around a selected moving average. Designed for traders who value responsive trend signals with built-in volatility sensitivity, this tool highlights directional bias, market regime shifts, and potential breakout opportunities.
How It Works
Instead of using standard deviation, EMD Trend employs the exponential moving average of the absolute deviation from a moving average—producing smoother, faster-reacting upper and lower bounds:
Bullish (Risk-ON Long): Price crosses above the upper EMD band
Bearish (Risk-ON Short): Price crosses below the lower EMD band
Neutral: Price stays within the channel, indicating potential mean reversion or low momentum
Trend direction is defined by price interaction with these bands, and visual cues (color-coded bars and fills) help quickly identify market conditions.
Features
7 Moving Average Types: SMA, EMA, HMA, DEMA, TEMA, RMA, FRAMA
Custom Price Source: Choose close, hl2, ohlc4, or others
EMD Multiplier: Controls the width of the deviation envelope
Bar Coloring: Candles change color based on current trend
Intra-bar Signal Option: Enables faster updates (with optional repainting)
Speculative Zones: Fills highlight aggressive momentum moves beyond EMD bounds
Backtest Mode
Switch to Backtest Mode for performance evaluation over historical data:
Equity Curve Plot: Compare EMD Trend strategy vs. Buy & Hold
Trade Metrics Table: View number of trades, win/loss stats, profits
Performance Metrics Table: Includes CAGR, Sharpe, max drawdown, and more
Custom Start Date: Select from which date the backtest should begin
Trade Sizing: Configure capital and trade percentage per entry
Signal Filters: Choose from Long Only, Short Only, or Both
Alerts
Built-in alerts let you automate entries, exits, and trend transitions:
LONG (EMD Trend) - Trend flips to Long
SHORT (EMD Trend) - Trend flips to Short
RISK-ON LONG - Price crosses above upper EMD band
RISK-OFF LONG - Price crosses back below upper EMD band
RISK-ON SHORT - Price crosses below lower EMD band
RISK-OFF SHORT - Price crosses back above lower EMD band
Use Cases
Trend Confirmation with volatility-sensitive boundaries
Momentum Entry Filtering via breakout zones
Mean Reversion Avoidance in sideways markets
Backtesting & Strategy Building with real-time metrics
Disclaimer
This indicator is intended for informational and educational purposes only. It does not constitute investment advice. Historical performance does not guarantee future results. Always backtest and use in simulation before live trading.

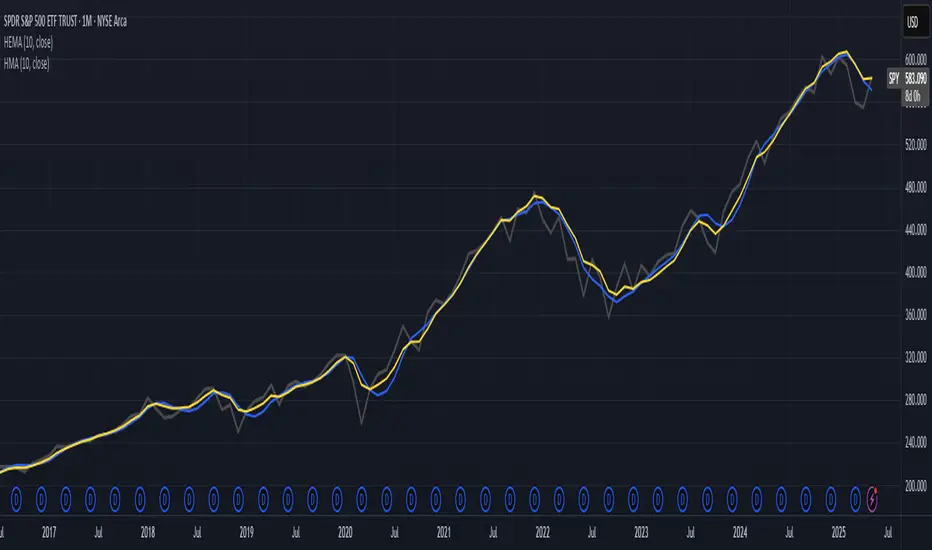
Hull-Exponential Moving Average (HEMA)The Hull Exponential Moving Average (HEMA) is an experimental technical indicator that uses a sequence of Exponential Moving Averages (EMAs) with the same logic as HMA - except with EMAs and not WMAs. It aims to create a responsive yet smooth trend indicator than HMA.
HEMA applies a multi-stage EMA process. Initial EMAs are calculated using alphas derived from logarithmic relationships and the input period. Their outputs are then combined in a de-lagging step, which itself uses a logarithmically derived ratio. A final EMA smoothing pass is then applied to this de-lagged series. This creates a moving average that responds quickly to genuine price changes while maintaining effective noise filtering. The specific alpha calculations and the de-lagging formula contribute to its balance between responsiveness and smoothness.
▶️ **Core Concepts**
Logarithmically-derived alphas: Alpha values for the three EMA stages are derived using natural logarithms and specific formulas related to the input period **N**.
Three-stage EMA process: The calculation involves:
An initial EMA (using **αS**) on the source data.
A second EMA (using **αF**) also on the source data.
A de-lagging step that combines the outputs of the first two EMAs using a specific ratio **r**.
A final EMA (using **αFin**) applied to the de-lagged series.
Specific de-lagging formula: Utilizes a constant ratio **r = ln(2.0) / (1.0 + ln(2.0))** to combine the outputs of the first two EMAs, aiming to reduce lag.
Optimized final smoothing: The alpha for the final EMA (**αFin**) is calculated based on the square root of the period **N**.
Warmup compensation: The internal EMA calculations include a warmup mechanism to provide more accurate values from the initial bars. This involves tracking decay factors (**eS**, **eF**, **eFin**) and applying a compensation factor **1.0 / (1.0 - e_decay)** during the warmup period. A shared warmup duration is determined by the smallest alpha among the three stages.
HEMA achieves its characteristics through this multi-stage EMA process, where the specific alpha calculations and the de-lagging step are key to its responsiveness and smoothness.
▶️ **Common Settings and Parameters**
Period (**N**): Default: 10 | Base lookback period for all alpha calculations | When to Adjust: Increase for longer-term trends and more smoothness, decrease for shorter-term signals and more responsiveness
Source: Default: Close | Data point used for calculation | When to Adjust: Change to HL2, HLC3, or OHLC4 for different price representations
Pro Tip: The HEMA's behavior is sensitive to the **Period** setting due to the non-linear relationships in its alpha calculations. Experiment with values around your typical MA periods. Small changes in **N** can have a noticeable impact, especially for smaller **N** values.
▶️ **Calculation and Mathematical Foundation**
Simplified explanation:
HEMA calculates its value through a sequence of three Exponential Moving Averages (EMAs) with specially derived smoothing factors (alphas).
Two initial EMAs are calculated from the source price, using alphas **αS** and **αF**.
The outputs of these two EMAs are combined into a "de-lagged" series.
This de-lagged series is then smoothed by a third EMA, using alpha **αFin**, to produce the final HEMA value.
All internal EMAs use a warmup compensation mechanism for improved accuracy on early bars.
Technical formula (let **N** be the input period):
1. Alpha for the first EMA (slow component related):
αS = 3.0 / (2.0 * N - 1.0)
2. Lambda for **αS** (intermediate value):
λS = -ln(1.0 - αS)
Note: **αS** must be less than 1, which implies 2N-1 > 3 or N > 2 for **λS** to be well-defined without NaN from ln of non-positive number. The code uses nz() for robustness but the formula implies this constraint.
3. De-lagging ratio **r**:
r = ln(2.0) / (1.0 + ln(2.0))
(This is a constant, approximately 0.409365)
4. Alpha for the second EMA (fast component related):
αF = 1.0 - exp(-λS / r)
5. Alpha for the final EMA smoothing:
αFin = 2.0 / (sqrt(N) / 2.0 + 1.0)
6. Applying the stages:
**OutputS = EMA_internal(source, αS, eS_state, emaS_state)**
**OutputF = EMA_internal(source, αF, eF_state, emaF_state)**
8. Calculate the de-lagged series:
DeLag = (OutputF / (1.0 - r)) - (r * OutputS / (1.0 - r))
9. Calculate the final HEMA:
HEMA = EMA_internal(DeLag, αFin, eFin_state, emaFin_state)
🔍 Technical Note: The HEMA implementation uses a shared warmup period controlled by **aMin** (the minimum of **αS**, **αF**, **αFin**). During this period, each internal EMA stage still tracks its own decay factor (**eS**, **eF**, **eFin**) to apply the correct compensation. The **nz()** function is used in the code to handle potential NaN values from alpha calculations if **N** is very small (e.g., **N=1** would make **αS=3**, **1-αS = -2**, **ln(-2)** is NaN).
▶️ **Interpretation Details**
HEMA provides several key insights for traders:
When price crosses above HEMA, it often signals the beginning of an uptrend
When price crosses below HEMA, it often signals the beginning of a downtrend
The slope of HEMA provides insight into trend strength and momentum
HEMA creates smooth dynamic support and resistance levels during trends
Multiple HEMA lines with different periods can identify potential reversal zones
HEMA is particularly effective for trend following strategies where both responsiveness and noise reduction are important. It provides earlier signals than traditional EMAs while exhibiting less whipsaw than standard HMA in choppy market conditions. The indicator excels at identifying the underlying trend direction while filtering out minor price fluctuations.
▶️ **Limitations and Considerations**
Experimental nature: As an experimental indicator, HEMA may behave differently from established HMA in certain market conditions
Lag characteristics: While designed to reduce lag, HEMA may exhibit slightly more lag than HMA in some scenarios due to the long tail of EMA
Mathematical complexity: The multi-stage calculation with specialized alpha parameters makes the behavior less intuitive to understand
Parameter sensitivity: Performance can vary significantly with different period settings
Complementary tools: Works best when combined with volume analysis or momentum indicators for confirmation
▶️ **References**
Hull, A. (2005). "Hull Moving Average," Technical Analysis of Stocks & Commodities .
RetryClaude can make mistakes. Please double-check responses.
LGMM (flat buffers) — multivariate poly + latent statesLGMM POLYNOMIAL BANDS — DISCOVER THE MARKET’S HIDDEN STATES
Overview
Latent-Gaussian-Mixture-Models (LGMMs) view price action as a mix of several invisible regimes: trending up, drifting sideways, sudden volatility spikes, and so on.
A Gaussian Mixture learns these states directly from data and outputs, for every bar, the probability that the market is in each state.
This indicator feeds those probabilities into a rolling polynomial regression that draws a fair-value line, then builds adaptive upper and lower bands.
Band width expands when recent residuals are large *and* when the state mix is uncertain, and contracts when price is calm or one regime clearly dominates.
Crossing back into the band from below generates a buy flag; crossing back into the band from above generates a sell flag (or take-profit for longs).
Key Inputs
Price source – default is Close; you can choose HL2, OHLC4, etc.
Training window (bars) – look-back length for every retrain. 252 bars (one trading year) is a balanced default for US stocks on daily timeframe. Use fewer bars for intraday charts (say 7*24=168 for 1H bars on crypto), more for weekly periods.
Polynomial degree – 1 for a straight trend line, 2 for a curved fit. Curved fits are better when the symbol shows persistent drift.
Hidden states K – number of regimes the mixture tracks (1 to 3). Three states often map well to up-trend, chop, down-trend.
Band width ×σ – multiplier on the entropy-weighted standard deviation. Smaller values (1.5-2) give more trades; larger values (2.5-3) give fewer, higher-conviction trades.
Offline μ,σ pairs (optional) – paste component means and sigmas from an offline LGMM (format: mu1,sigma1;mu2,sigma2;…). Leave blank to let the script use its built-in approximation.
Quick Start
Add the indicator to a chart and wait until the initial Training window has filled.
Watch for green BUY triangles when price closes back above the lower band and red SELL triangles when price closes back below the upper band.
Fine-tune:
– Increase Training window to reduce noise.
– Decrease Band width ×σ for more frequent signals.
– Experiment with Hidden states K; more states capture richer behaviour but need longer windows to stay reliable.
Tips
Bands widen automatically in chaotic periods and tighten when one regime dominates.
Combine with a volume filter or a higher-time-frame trend to reduce whipsaws.
If you already run an LGMM in Python or Matlab, paste its component parameters for a perfect match between your back-test and the TradingView plot.
Works on all markets and time-frames, provided you have at least five times the Training window’s bars in history.
Happy trading!

6 Moving Averages Difference TableIndicator Summary: 6 Moving Averages Difference Table (6MADIFF)
This TradingView indicator calculates and plots up to six distinct moving averages (MAs) directly on the price chart. Users have extensive control over each MA, allowing selection of:
Type: SMA, EMA, WMA, VWMA, HMA, RMA
Length: Any positive integer
Color: User-defined
Visibility: Can be toggled on/off
A core feature is the on-chart data table, designed to provide a quick overview of the relationships between the MAs and the price. This table displays:
$-MA Column: The absolute difference between the user-selected Input Source (e.g., Close, Open, HLC3) and the current value of each MA.
MA$ Column: The actual calculated price value of each MA for the current bar.
MA vs. MA Matrix: A grid showing the absolute difference between every possible pair of the calculated MAs (e.g., MA1 vs. MA2, MA1 vs. MA3, MA2 vs. MA5, etc.).
Customization Options:
Input Source: Select the price source (Open, High, Low, Close, HL2, HLC3, OHLC4) used for all MA calculations and the price difference column.
Table Settings: Control the table's visibility, position on the chart, text size, decimal precision for displayed values, and the text used for the column headers ("$-MA" and "MA$").
Purpose:
This indicator is useful for traders who utilize multiple moving averages in their analysis. The table provides an immediate, quantitative snapshot of:
How far the current price is from each MA.
The exact value of each MA.
The spread or convergence between different MAs.
This helps in quickly assessing trend strength, potential support/resistance levels based on MA clusters, and the relative positioning of short-term versus long-term averages.

Machine Learning | Adaptive Trend Signals [Bitwardex]⚙️🧠Machine Learning | Adaptive Trend Signals
🔷Overview
Machine Learning | Adaptive Trend Signals is a Pine Script™ v6 indicator designed to visualize market trends and generate signals through a combination of volatility clustering, Gaussian smoothing, and adaptive trend calculations. Built as an overlay indicator, it integrates advanced techniques inspired by machine learning concepts, such as K-Means clustering, to adapt to changing market conditions. The script is highly customizable, includes a backtesting module, and supports alert conditions, making it suitable for traders exploring trend-based strategies and developers studying volatility-driven indicator design.
🔷Functionality
The indicator performs the following core functions:
• Volatility Clustering: Uses K-Means clustering to categorize market volatility into high, medium, and low states, adjusting trend sensitivity accordingly.
• Trend Calculation: Computes adaptive trend lines (SmartTrend) based on volatility-adjusted standard deviation, smoothed RSI, and ADX filters.
• Signal Generation: Identifies potential buy and sell points through trend line crossovers and directional confirmation.
• Backtesting Module: Tracks trade outcomes based on the SmartTrend3 value, displaying win rate and total trades.
• Visualization: Plots trend lines with gradient colors and optional signal markers (bullish 🐮 and bearish 🐻).
• Alerts: Provides configurable alerts for trend shifts and volatility state changes.
🔷Technical Methodology
Volatility Clustering with K-Means
The indicator employs a K-Means clustering algorithm to classify market volatility, measured via the Average True Range (ATR), into three distinct clusters:
• Data Collection: Gathers ATR values over a user-defined training period (default: 100 bars).
• Centroid Initialization: Sets initial centroids at the highest, lowest, and midpoint ATR values within the training period.
• Iterative Clustering: Assigns ATR data points to the nearest centroid, recalculates centroid means, and repeats until convergence.
• Dynamic Adjustment: Assigns a volatility state (high, medium, or low) based on the closest centroid, adjusting the trend factor (e.g., tighter for high volatility, wider for low volatility).
This approach allows the indicator to adapt its sensitivity to varying market conditions, providing a data-driven foundation for trend calculations.
🔷Gaussian Smoothing
To enhance signal clarity and reduce noise, the indicator applies Gaussian kernel smoothing to:
• RSI: Smooths the Relative Strength Index (calculated from OHLC4) to filter short-term fluctuations.
• SmartTrend: Smooths the primary trend line for a more stable output.
The Gaussian kernel uses a sigma value derived from the user-defined smoothing length, ensuring mathematically consistent noise reduction.
🔷SmartTrend Calculation
The pineSmartTrend function is the core of the indicator, producing three trend lines:
• SmartTrend: The primary trend line, calculated using a volatility-adjusted standard deviation, smoothed RSI, and ADX conditions.
• SmartTrend2: A secondary trend line with a wider factor (base factor * 1.382) for signal confirmation.
SmartTrend3: The average of SmartTrend and SmartTrend2, used for plotting and backtesting.
Key components of the calculation include:
• Dynamic Standard Deviation: Scales based on ATR relative to its 50-period smoothed average, with multipliers (1.0 to 1.4) applied according to volatility thresholds.
• RSI and ADX Filters: Requires RSI > 50 for bullish trends or < 50 for bearish trends, alongside ADX > 15 and rising to confirm trend strength.
Volatility-Adjusted Bands: Constructs upper and lower bands around price action, adjusted by the volatility cluster’s dynamic factor.
🔷Signal Generation
The generate_signals function generates signals as follows:
• Buy Signal: Triggered when SmartTrend crosses above SmartTrend2 and the price is above SmartTrend, with directional confirmation.
• Sell Signal: Triggered when SmartTrend crosses below SmartTrend2 and the price is below SmartTrend, with directional confirmation.
Directional Logic: Tracks trend direction to filter out conflicting signals, ensuring alignment with the broader market context.
Signals are visualized as small circles with bullish (🐮) or bearish (🐻) emojis, with an option to toggle visibility.
🔷Backtesting
The get_backtest function evaluates signal outcomes using the SmartTrend3 value (rather than closing prices) to align with the trend-based methodology.
It tracks:
• Total Trades: Counts completed long and short trades.
• Win Rate: Calculates the percentage of trades where SmartTrend3 moves favorably (higher for longs, lower for shorts).
Position Management: Closes opposite positions before opening new ones, simulating a single-position trading system.
Results are displayed in a table at the top-right of the chart, showing win rate and total trades. Note that backtest results reflect the indicator’s internal logic and should not be interpreted as predictive of real-world performance.
🔷Visualization and Alerts
• Trend Lines: SmartTrend3 is plotted with gradient colors reflecting trend direction and volatility cluster, accompanied by a secondary line for visual clarity.
• Signal Markers: Optional buy/sell signals are plotted as small circles with customizable colors.
• Alerts: Supports alerts for:
• Bullish and bearish trend shifts (confirmed on bar close).
Transitions to high, medium, or low volatility states.
🔷Input Parameters
• ATR Length (default: 14): Period for ATR calculation, used in volatility clustering.
• Period (default: 21): Common period for RSI, ADX, and standard deviation calculations.
• Base SmartTrend Factor (default: 2.0): Base multiplier for volatility-adjusted bands.
• SmartTrend Smoothing Length (default: 10): Length for Gaussian smoothing of the trend line.
• Show Buy/Sell Signals? (default: true): Enables/disables signal markers.
• Bullish/Bearish Color: Customizable colors for trend lines and signals.
🔷Usage Instructions
• Apply to Chart: Add the indicator to any TradingView chart.
• Configure Inputs: Adjust parameters to align with your trading style or market conditions (e.g., shorter ATR length for faster markets).
• Interpret Output:
• Trend Lines: Use SmartTrend3’s direction and color to gauge market bias.
• Signals: Monitor bullish (🐮) and bearish (🐻) markers for potential entry/exit points.
• Backtest Table: Review win rate and total trades to understand the indicator’s behavior in historical data.
• Set Alerts: Configure alerts for trend shifts or volatility changes to support manual or automated trading workflows.
• Combine with Analysis: Use the indicator alongside other tools or market context, as it is designed to complement, not replace, comprehensive analysis.
🔷Technical Notes
• Data Requirements: Requires at least 100 bars for accurate volatility clustering. Ensure sufficient historical data is loaded.
• Market Suitability: The indicator is designed for trend detection and may perform differently in ranging or volatile markets due to its reliance on RSI and ADX filters.
• Backtesting Scope: The backtest module uses SmartTrend3 values, which may differ from price-based outcomes. Results are for informational purposes only.
• Computational Intensity: The K-Means clustering and Gaussian smoothing may increase processing time on lower timeframes or with large datasets.
🔷For Developers
The script is modular, well-commented, encouraging reuse and modification with proper attribution.
Key functions include:
• gaussianSmooth: Applies Gaussian kernel smoothing to any data series.
• pineSmartTrend: Computes adaptive trend lines with volatility and momentum filters.
• getDynamicFactor: Adjusts trend sensitivity based on volatility clusters.
• get_backtest: Evaluates signal performance using SmartTrend3.
Developers can extend these functions for custom indicators or strategies, leveraging the volatility clustering and smoothing methodologies. The K-Means implementation is particularly useful for adaptive volatility analysis.
🔷Limitations
• The indicator is not predictive and should be used as part of a broader trading strategy.
• Performance varies by market, timeframe, and parameter settings, requiring user experimentation.
• Backtest results are based on historical data and internal logic, not real-world trading conditions.
• Volatility clustering assumes sufficient historical data; incomplete data may affect accuracy.
🔷Acknowledgments
Developed by Bitwardex, inspired by machine learning concepts and adaptive trading methodologies. Community feedback is welcome via TradingView’s platform.
🔷 Risk Disclaimer
Trading involves significant risks, and most traders may incur losses. Bitwardex AI Algo is provided for informational and educational purposes only and does not constitute financial advice or a recommendation to buy or sell any financial instrument . The signals, metrics, and features are tools for analysis and do not guarantee profits or specific outcomes. Past performance is not indicative of future results. Always conduct your own due diligence and consult a financial advisor before making trading decisions.

QuantumSync Pulse [ w.aritas ]QuantumSync Pulse (QSP) is an advanced technical indicator crafted for traders seeking a dynamic and adaptable tool to analyze diverse market conditions. By integrating momentum, mean reversion, and regime detection with quantum-inspired calculations and entropy analysis, QSP offers a powerful histogram that reflects trend strength and market uncertainty. With multi-timeframe synchronization, adaptive filtering, and customizable visualization, it’s a versatile addition to any trading strategy.
Key Features
Hybrid Signals: Combines momentum and mean reversion, dynamically weighted by market regime.
Quantum Tunneling: Enhances responsiveness in volatile markets using volatility-adjusted calculations.
3-State Entropy: Assesses market uncertainty across up, down, and neutral states.
Regime Detection: Adapts signal weights with Hurst exponent and volatility ROC.
Multi-Timeframe Alignment: Syncs with higher timeframe trends for context.
Customizable Histogram: Displays trend strength with ADX-based visuals and flexible styling.
How to Use and Interpret
Histogram Interpretation
Positive (Above Zero): Bullish momentum; color intensity shows trend strength.
Negative (Below Zero): Bearish momentum; gradients indicate weakness.
Overlaps: Alignment of final_z (signal) and ohlc4 (price) histograms highlights key price levels or turning points.
Regime Visualization
Green Background: Trending market; prioritize momentum signals.
Red Background: Mean-reverting market; focus on reversion signals.
Blue Background: Neutral state; balance both signal types.
Trading Signals
Buy: Histogram crosses above zero or shows positive divergence between histograms.
Sell: Histogram crosses below zero or exhibits negative divergence.
Confirmation: Match signals with regime background—green for trends, red for ranges.
Customization
Tweak Momentum Length, Entropy Lookback, and Hurst Exponent Lookback for sensitivity.
Adjust color themes and transparency to suit your charts.
Tips for Optimal Use
Timeframes: Use higher timeframes (1h, 4h) for trend context and lower (5m, 15m) for entries.
Pairing: Combine with RSI, MACD, or volume indicators for confirmation.
Backtesting: Test settings on historical data for asset-specific optimization.
Overlaps: Watch for histogram overlaps to identify support, resistance, or reversals.
Simulated Performance
Trending Markets: Histogram stays above/below zero, with overlaps at retracements for entries.
Range-Bound Markets: Oscillates around zero; overlaps signal reversals in red regimes.
Volatile Markets: Quantum tunneling ensures quick reactions, with filters reducing noise.
Elevate your trading with QuantumSync Pulse—a sophisticated tool that adapts to the market’s rhythm and your unique style.

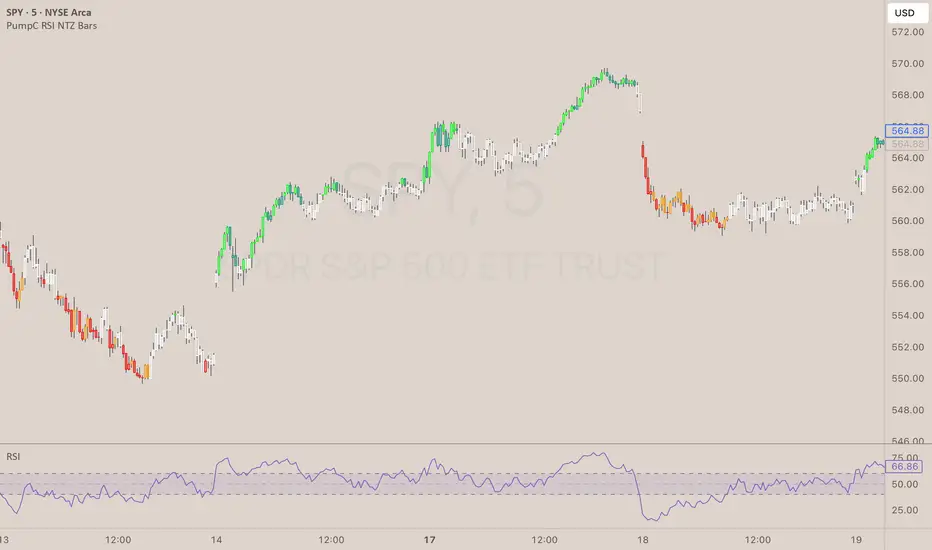
PumpC RSI NTZ BarsPumpC RSI NTZ Bars — Slope-Aware RSI Momentum Overlay
The PumpC RSI NTZ Bars indicator builds on the classic RSI by combining it with slope detection and custom bar highlighting, helping traders quickly identify strong momentum breakouts while avoiding sideways chop — the (NTZ) or No Trade Zone .
What is (NTZ)?
(NTZ) stands for No Trade Zone — the neutral RSI area between bullish and bearish thresholds. In this zone, RSI lacks directional strength, which often reflects indecision or consolidation in price. This indicator helps visually separate the chop from true momentum, so you can trade the breakout, not the noise .
Core Features
Dynamic RSI-Based Bar Coloring with Slope Awareness
Bars change color based on RSI value and its slope:
Bright Green: RSI ≥ Bullish Threshold and sloping upward
Teal Green: RSI ≥ Bullish Threshold but sloping downward
Bright Red: RSI ≤ Bearish Threshold and sloping downward
Orange: RSI ≤ Bearish Threshold but sloping upward
White: RSI is between thresholds (NTZ)
Slope Detection Logic
RSI slope is used to confirm directional bias and filter out weak or fading momentum.
Clean Visual Integration
Choose how signals appear: full bar color, border-only style, background shading, or a mix of all three.
RSI Smoothing Option
Optional smoothing to reduce noise — especially useful on faster timeframes.
Built-In Alerts
RSI crossing above the bullish threshold with an upward slope
RSI crossing below the bearish threshold with a downward slope
User Inputs & Customization Options
RSI Length: Default 14
RSI Source: Default Close
Smooth RSI: On or Off
Smoothing Length: Default 2
Bullish Threshold: Default 60
Bearish Threshold: Default 40
Bar Highlight Style: Full Bar or Border Only
Display Mode: Bar Color, Background, or Both
How to Use It
Step 1 – Adjust Your RSI Settings:
Start by setting the RSI Length (default is 14) and choosing which price source to use — typically close , but you can experiment with hl2 , ohlc4 , etc.
You can also turn on smoothing if you want to reduce noise, especially on fast timeframes like the 1m or 5m chart.
Step 2 – Define Your No Trade Zone (NTZ):
The NTZ is the space between the bullish and bearish thresholds (default 60 and 40).
This is where momentum is weak and price is often ranging or chopping. You don’t want to trade in this zone — you're waiting for RSI to break out of it with conviction.
Step 3 – Choose Your Visual Style:
You can choose to: Highlight the entire candle (Full Bar)
Just highlight the outline (Border Only)
Add a background color behind the chart
Or use a combination of the above This makes the signal easy to see without changing your whole chart look.
Step 4 – Read the Colors for Quick Clarity:
Bright Green / Bright Red = Strong Momentum (with RSI slope confirmation)
Teal / Orange = Momentum is weakening — RSI value is above/below threshold but losing slope strength
White = RSI is in the No Trade Zone (NTZ) — not enough strength to trade
Use this color feedback to stay out during weak periods and act when the trend gains strength.
Step 5 – Use Alerts for Clean Signals:
Set alerts when RSI breaks out of the NTZ with slope confirmation .
These are high-quality signals you can use to trigger your setups or review potential entries.
Disclaimer
This indicator is for educational and informational purposes only and should not be considered financial advice. Always combine tools like this with proper market context and risk management.
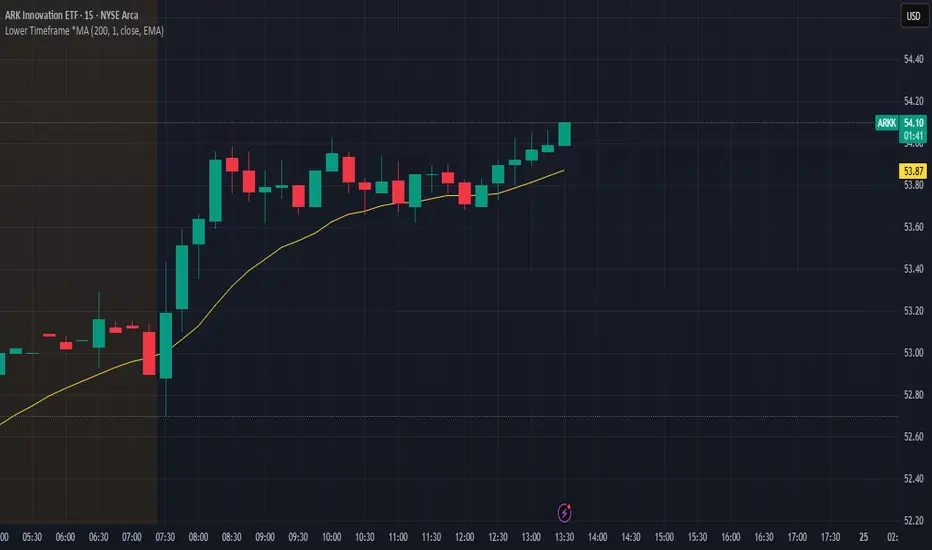
Lower Timeframe *MALower Timeframe Moving Average (MA) Indicator
This indicator calculates a moving average using data from a lower timeframe than the chart's current timeframe.
It provides potentially earlier signals and smoother price action by incorporating more granular price data. It also allows you to keep the same reference frame for your moving average regardless of your currently selected period.
Key Features:
- Uses lower timeframe data to calculate moving averages on higher timeframes
- Supports multiple MA types: SMA, EMA, WMA, VWMA, RMA, and HMA
- Allows selection of various price inputs (close, open, high, low, hl2, hlc3, ohlc4)
- Automatically adjusts MA length based on the ratio between chart timeframe and selected sub-timeframe
15m
5m
Triple SRSI-MFI Ⅲ - Multi TimeframeTriple SRSI-MFI Ⅲ - Multi Timeframe Indicator
Description
The Triple SRSI-MFI Ⅲ - Multi Timeframe indicator is a powerful tool designed to combine Stochastic RSI (SRSI) and Money Flow Index (MFI) across multiple timeframes (higher, current, and lower). It provides a comprehensive view of market momentum and potential overbought/oversold conditions by calculating a weighted hybrid of SRSI-MFI values from three different timeframes. The indicator also integrates Bollinger Bands to help identify trend direction and volatility.
This indicator is ideal for traders who want to analyze market conditions across multiple timeframes without switching charts. It automatically adjusts settings based on the current timeframe and includes a dynamic weighting system optimized for Bitcoin volatility. Additionally, a real-time information panel displays the market state (buy/sell) and signal strength.
Key Features
Multi-Timeframe Analysis: Combines SRSI-MFI from higher, current, and lower timeframes for a holistic view.
Dynamic Weighting: Automatically adjusts weights for each timeframe based on Bitcoin volatility, with an option for manual customization.
Bollinger Bands Integration: Visualizes trend direction and volatility using Bollinger Bands, with customizable source selection.
Real-Time Info Panel: Displays market state (buy/sell) and signal strength (%) in the top-right corner of the chart.
Customizable Settings: Allows users to tweak MFI source, Bollinger Bands parameters, and visibility of individual components.
How to Use
Add to Chart: Add the "Triple SRSI-MFI Ⅲ - Multi Timeframe" indicator to your chart.
Interpret Signals:
Market State (Buy/Sell): Shown in the info panel. "Buy" when the average SRSI-MFI is above the Bollinger Bands basis, "Sell" when below.
Strength (%): The relative position of the average SRSI-MFI within the Bollinger Bands, scaled from 0% to 100%.
Overbought/Oversold Levels: The indicator plots horizontal lines at 80 (overbought) and 20 (oversold). Use these as potential reversal zones.
Combine with Price Action: Use the indicator in conjunction with price action or other tools for better decision-making.
Adjust Settings: Customize the settings (e.g., Bollinger Bands length, weights, visibility) to match your trading style.
Settings
MFI Source: Select the source for MFI calculation (default: "hlc3"). Options include "close", "open", "high", "low", "hl2", "hlc3", "ohlc4".
Bollinger Bands:
Length: Period for Bollinger Bands calculation (default: 20).
Multiplier: Standard deviation multiplier for the bands (default: 2.0).
Source: Choose which SRSI-MFI value to use for Bollinger Bands ("averageHybrid", "hybrid_higher", "hybrid_current", "hybrid_lower"; default: "hybrid_higher").
Weights:
Auto Weight Enabled: Enable/disable automatic weights based on Bitcoin volatility (default: true).
Higher/Current/Lower Weights: Manually set weights for each timeframe if auto-weight is disabled (defaults: 1.5, 1.0, 0.5).
Indicator On/Off:
Toggle visibility for Higher SRSI-MFI, Current SRSI-MFI, Lower SRSI-MFI, Average SRSI-MFI, and Bollinger Bands.
How It Works
SRSI-MFI Calculation:
Stochastic RSI (SRSI) and Money Flow Index (MFI) are calculated for three timeframes: higher, current, and lower.
The hybrid value (SRSI * (MFI / 100)) is computed for each timeframe.
Weighted Average:
The hybrid values are combined into a weighted average (averageHybrid) using dynamic or manual weights.
Bollinger Bands:
Bollinger Bands are applied to the selected source (e.g., hybrid_higher) to identify trend direction and volatility.
Relative Position:
The position of averageHybrid within the Bollinger Bands is scaled to a percentage (0% to 100%) for strength assessment.
Visualization:
Plots individual SRSI-MFI lines, Bollinger Bands, and overbought/oversold levels.
A real-time info panel provides market state and signal strength.
Notes
This indicator is best used as part of a broader trading strategy. It is not a standalone signal generator and should be combined with other forms of analysis.
The automatic weights are optimized for Bitcoin (BTC) volatility. For other assets, you may need to adjust the weights manually.
The indicator may require sufficient historical data to calculate higher and lower timeframe values accurately.

Deviation ChannelsIndicator Name: Deviation Channels (Dev Chan)
Why Use This Indicator?
Visualize Volatility Ranges:
The indicator plots Keltner Channels at four levels above and below an average line, letting you easily see how far price has deviated from a typical range. Each “dev” line highlights potential support or resistance during pullbacks or surges.
Color-Coded Clarity:
Each band shifts color intensity depending on whether the current price is trading above or below it, letting you spot breakouts and rejections at a glance. Meanwhile, the Fast SMA (default 10) also changes color – green if price is above, red if below – adding a quick momentum read.
Adjustable Source & Length:
Choose your input source (open, close, ohlc4, or hlc3) and set your Keltner length to suit different asset classes or timeframes. Whether you want a tighter, more reactive channel or a smoother, longer-term reading, the script adapts with minimal effort.
A Simple Trading Approach
Identify Trend with Fast SMA:
If the Fast SMA (default length 10) is green (price above it), treat that as a bullish environment. If it’s red (price below), favor bearish or neutral stances.
Wait for Price to Reach Lower/Upper Deviations:
In a bullish setup (Fast SMA green), watch for price to dip into one of the lower channels (e.g., -1 Dev or -2 Dev). Such pullbacks can become potential “buy the dip” zones if price stabilizes and resumes upward momentum.
Conversely, if the Fast SMA is red, watch for price to test the upper channels (1 Dev or 2 Dev). That might be a short opportunity or a place to close out any remaining longs before a deeper correction.
Manage Risk with Channel Levels:
Place stop-losses just beyond the next “dev” band to protect against volatility. For example, if you enter on a bounce at -1 Dev, consider placing a stop near -2 Dev or -3 Dev, depending on your risk tolerance.
Take Profits Gradually:
In an uptrend, you might scale out of positions as price moves toward higher lines (e.g., 1 Dev or 2 Dev). Conversely, if price fails to hold above the Fast SMA or repeatedly closes below a key band, it might be time to exit.
Disclaimer: No single indicator is foolproof. Always combine with sound risk management, observe multiple timeframes, and consider fundamental factors before making trading decisions. Experiment with the Keltner length and Fast SMA fastLength to find the sweet spot for your market and time horizon.
ATR Stop Loss & 3 TP FinderATR Stop Loss & 3 TP Finder - By SeehraSingh
This indicator is designed to help traders automate Stop Loss (SL) and Take Profit (TP) placement based on the Average True Range (ATR). It dynamically calculates:
Stop Loss (SL): Set based on a user-defined ATR multiplier.
Three Take Profit (TP) levels: Configurable ATR multipliers for TP1, TP2, and TP3.
Customizable Price Sources: Allows traders to choose different price sources (Open, High, Low, Close, HL2, HLC3, OHLC4, HLCC4) for both SL and TP calculations.
Visual Representation: Plots dashed lines for Entry, SL, TP1, TP2, and TP3.
Table Display: Provides an easy-to-read table at the bottom showing SL, TP1, TP2, and TP3 values.
How It Works:
Select ATR length and smoothing type (RMA, SMA, EMA, WMA).
Set ATR multipliers for SL and TP levels.
Choose the price source for SL and TP calculations.
The indicator automatically plots entry, SL, and three TP levels on the chart.
Ideal For:
Traders who use ATR-based dynamic Stop Loss and Take Profit strategies.
Those who want to avoid fixed SL/TP placements and prefer volatility-based risk management.
Scalpers, Swing Traders, and Position Traders looking for automated SL/TP visualization.
Disclaimer
⚠️ Trading involves risk. This indicator is for educational purposes only and should not be considered financial advice. Always conduct your own analysis before entering any trade. The author is not responsible for any financial losses incurred while using this tool. Past performance does not guarantee future results.
TestMA-STATEOverview:
This Pine Script (version 6) is designed to generate trading events based on moving average (MA) behavior and dynamically calculated percentiles. It leverages a custom state machine library (version 7) from decrypt_capital to track and manage state transitions related to MA conditions, and it triggers alerts (and optionally, chart labels) when specific state transitions occur.
Key Components:
License & Metadata:
The script is distributed under the Mozilla Public License 2.0.
It carries copyright by decrypt_capital.
The title ("TestMA-STATE") and short title ("MA-STATE") are defined, and the script runs on an overlay with extended backtracking and drawing limits.
State Machine Integration:
The script imports the lib_statemachine_modified library (version 7) using the alias modSM.
A persistent state machine instance (MovingAverageDirection_SM) is created to manage various MA-related states.
Several state constants are defined to represent different market conditions, such as:
MA_SHORT_ABOVE_OVERBOUGHT: When the short MA low is above the overbought threshold.
MA_SHORT_CROSSUNDER_MID & MA_SHORT_CROSSUNDER_BIG: Conditions for bearish crossunders.
MA_SHORT_BELOW_OVERSOLD: When the short MA high is below the oversold threshold.
MA_SHORT_CROSSOVER_MID & MA_SHORT_CROSSOVER_BIG: Conditions for bullish crossovers.
Inputs & MA Calculation:
Users can choose the type of moving average (EMA, SMA, WMA, VWMA) and adjust lengths for short, mid, and big MAs.
Additional inputs include lookback length for percentile calculations and percentile thresholds for determining overbought and oversold boundaries.
The script computes:
Short MA Low and High: Based on the low and high series.
Mid MA and Big MA: Based on the average price (ohlc4).
Dynamic Percentile Boundaries:
Two functions (f_getPercentile() and f_getPercentileArr()) calculate dynamic percentile values from the MA data.
These functions determine the oversold and overbought boundaries used in the state transition conditions.
Timestamp & Alert Header Formatting:
A helper function (f_formatTimestamp()) formats timestamps into a human-readable form (e.g., "Tue 12 Mar 16:30").
This formatted time, along with ticker information and other details, is used to build an alert header.
State Transitions & Alerts:
The script calls the state machine’s step() method multiple times with conditions based on the relationship between MA values and the percentile boundaries.
For example:
A bullish condition is triggered when the short MA low moves above the overbought threshold.
A bearish condition is triggered when the short MA high falls below the oversold boundary.
Transitions are further refined by checking if the MA is rising or falling.
When specific state transitions occur (e.g., MA_SHORT_CROSSOVER_MID after MA_SHORT_BELOW_OVERSOLD), the script:
Checks that the transition is recent (using the barsSinceState() method).
Optionally creates a label on the chart.
Triggers an alert with a descriptive message.
Chart Plotting:
The script plots the calculated moving averages (short, mid, and optionally big) on the chart.
It also plots the dynamic percentile boundaries for visual reference.
Purpose & Usage:
Trading Signal Generation:
The primary goal is to monitor key MA conditions and trigger alerts when significant crossovers or crossunders occur. These events—such as bullish crossovers when the market recovers from oversold conditions or bearish crossunders when the market retracts from overbought conditions—can be used as trading signals.
Visualization:
Users have options to display the various moving averages and percentile boundaries directly on the chart, as well as optional labels that mark when an alert is generated.
Alerting:
When specific state transitions are detected, the script constructs and sends an alert message with a timestamp, ticker, and descriptive text, aiding traders in making timely decisions.
TWAP & VWAP CombinedThis script integrates Time Weighted Average Price (TWAP) and Volume Weighted Average Price (VWAP) into a single TradingView indicator, allowing traders to analyze both price-weighted and volume-weighted trends simultaneously.
Features:
TWAP Calculation:
Computes the average price over a specified anchor period (e.g., daily).
Resets and recalculates TWAP when the anchor period changes.
Uses the OHLC4 (Open, High, Low, Close average) as the default price source.
VWAP Calculation:
Computes the VWAP based on the selected anchor period (Session, Week, Month, etc.).
Allows the option to hide VWAP when the timeframe is 1D or higher.
Uses HLC3 (High, Low, Close average) as the default source.
Dynamically resets VWAP at the start of a new period.
Customization Options:
Users can modify the source price for TWAP and VWAP calculations.
Adjustable offsets for both indicators to shift plots forward or backward.
Ability to select different VWAP anchor periods, including earnings, dividends, and splits.
Error Handling:
Displays an error message if volume data is missing, ensuring VWAP functions correctly.
Turtle ZoneTurtle Zone indicator helps to visually determine support and resistance zones of the price movement.
Displays a channel with zones located symmetrically around the moving average of the price.
Width of the channel is determined by the current volatility computed as average true range which makes the channel width adaptable to the volatility.
Touching of the zones from inside of the channel can be interpreted as a signal of potential reversal.
Breaking outside of the outer boundary of the zones can be interpreted as a signal of a potential continuation of price movement.
Parameters
• Price Source - Component of the bar for computation. Default is ‘hlc3’. Other reasonable values, such as ‘ohlc4’, ‘open’ or’ close’ can be used by advanced users.
• Lookback period - Amount of bars used in moving average computation. Default is 200.
• Inner Amplitude - Relative width of the inner channel. Default is 5.6.
• Outer Amplitude - Relative width of the outer channel. Default is 9.6.
Available plots for notifications
There are five plots on the graph comprising the channel: four boundaries of the channel bands and one hidden mean line of the channel:
Upper Zone Upper Line
Upper Zone Lower Line
Mean
Lower Zone Upper Line
Lower Zone Lower Line
All of the plots can be used to set up notifications.
Notes
All computations are performed in logarithmic price scale which makes this indicator useful on large timeframes.
Credits
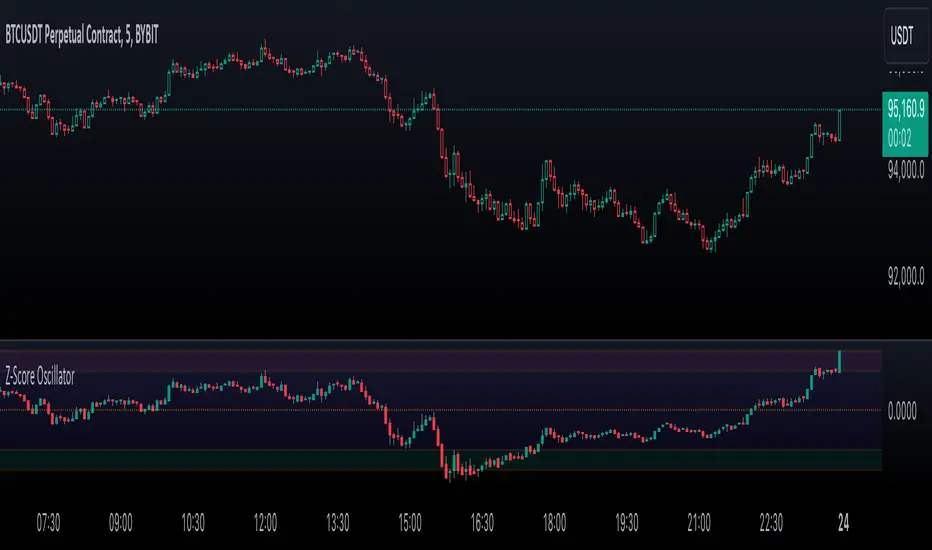
This script uses Ehlers_Super_Smoother library by KevanoTrades

Enhanced Price Z-Score OscillatorThe Enhanced Price Z-Score Oscillator by tkarolak is a powerful tool that transforms raw price data into an easy-to-understand statistical visualization using Z-Score-derived candlesticks. Simply put, it shows how far prices stray from their average in terms of standard deviations (Z-Scores), helping traders identify when prices are unusually high (overbought) or unusually low (oversold).
The indicator’s default feature displays Z-Score Candlesticks, where each candle reflects the statistical “distance” of the open, high, low, and close prices from their average. This creates a visual map of market extremes and potential reversal points. For added flexibility, you can also switch to Z-Score line plots based on either Close prices or OHLC4 averages.
With clear threshold lines (±2σ and ±3σ) marking moderate and extreme price deviations, and color-coded zones to highlight overbought and oversold areas, the oscillator simplifies complex statistical concepts into actionable trading insights.
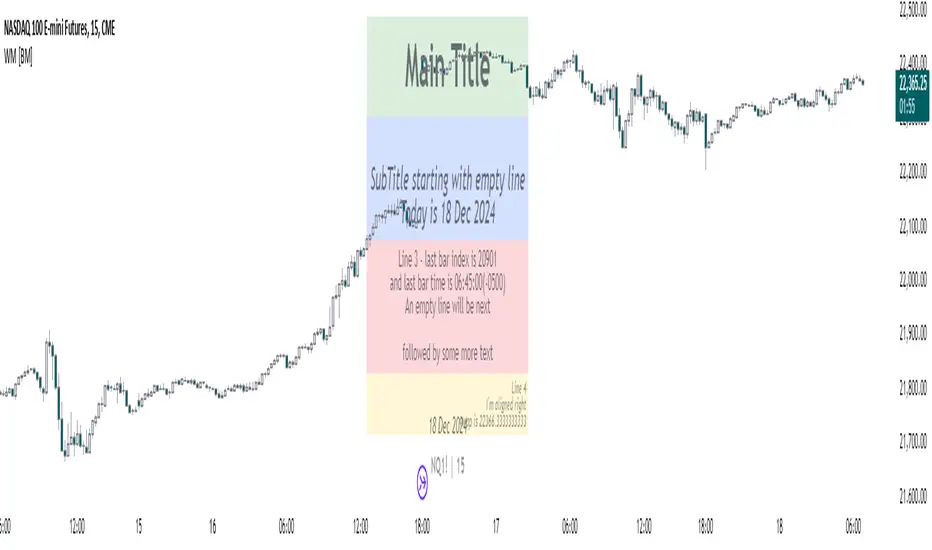
Watermark with dynamic variables [BM]█ OVERVIEW
This indicator allows users to add highly customizable watermark messages to their charts. Perfect for branding, annotation, or displaying dynamic chart information, this script offers advanced customization options including dynamic variables, text formatting, and flexible positioning.
█ CONCEPTS
Watermarks are overlay messages on charts. This script introduces placeholders — special keywords wrapped in % signs — that dynamically replace themselves with chart-related data. These watermarks can enhance charts with context, timestamps, or branding.
█ FEATURES
Dynamic Variables : Replace placeholders with real-time data such as bar index, timestamps, and more.
Advanced Customization : Modify text size, color, background, and alignment.
Multiple Messages : Add up to four independent messages per group, with two groups supported (A and B).
Positioning Options : Place watermarks anywhere on the chart using predefined locations.
Timezone Support : Display timestamps in a preferred timezone with customizable formats.
█ INPUTS
The script offers comprehensive input options for customization. Each Watermark (A and B) contains identical inputs for configuration.
Watermark settings are divided into two levels:
Watermark-Level Settings
These settings apply to the entire watermark group (A/B):
Show Watermark: Toggle the visibility of the watermark group on the chart.
Position: Choose where the watermark group is displayed on the chart.
Reverse Line Order: Enable to reverse the order of the lines displayed in Watermark A.
Message-Level Settings
Each watermark contains up to four configurable messages. These messages can be independently customized with the following options:
Message Content: Enter the custom text to be displayed. You can include placeholders for dynamic data.
Text Size: Select from predefined sizes (Tiny, Small, Normal, Large, Huge) or specify a custom size.
Text Alignment and Colors:
- Adjust the alignment of the text (Left, Center, Right).
- Set text and background colors for better visibility.
Format Time: Enable time formatting for this watermark message and configure the format and timezone. The settings for each message include message content, text size, alignment, and more. Please refer to Formatting dates and times for more details on valid formatting tokens.
█ PLACEHOLDERS
Placeholders are special keywords surrounded by % signs, which the script dynamically replaces with specific chart-related data. These placeholders allow users to insert dynamic content, such as bar information or timestamps, into watermark messages.
Below is the complete list of currently available placeholders:
bar_index , barstate.isconfirmed , barstate.isfirst , barstate.ishistory , barstate.islast , barstate.islastconfirmedhistory , barstate.isnew , barstate.isrealtime , chart.is_heikinashi , chart.is_kagi , chart.is_linebreak , chart.is_pnf , chart.is_range , chart.is_renko , chart.is_standard , chart.left_visible_bar_time , chart.right_visible_bar_time , close , dayofmonth , dayofweek , dividends.future_amount , dividends.future_ex_date , dividends.future_pay_date , earnings.future_eps , earnings.future_period_end_time , earnings.future_revenue , earnings.future_time , high , hl2 , hlc3 , hlcc4 , hour , last_bar_index , last_bar_time , low , minute , month , ohlc4 , open , second , session.isfirstbar , session.isfirstbar_regular , session.islastbar , session.islastbar_regular , session.ismarket , session.ispostmarket , session.ispremarket , syminfo.basecurrency , syminfo.country , syminfo.currency , syminfo.description , syminfo.employees , syminfo.expiration_date , syminfo.industry , syminfo.main_tickerid , syminfo.mincontract , syminfo.minmove , syminfo.mintick , syminfo.pointvalue , syminfo.prefix , syminfo.pricescale , syminfo.recommendations_buy , syminfo.recommendations_buy_strong , syminfo.recommendations_date , syminfo.recommendations_hold , syminfo.recommendations_sell , syminfo.recommendations_sell_strong , syminfo.recommendations_total , syminfo.root , syminfo.sector , syminfo.session , syminfo.shareholders , syminfo.shares_outstanding_float , syminfo.shares_outstanding_total , syminfo.target_price_average , syminfo.target_price_date , syminfo.target_price_estimates , syminfo.target_price_high , syminfo.target_price_low , syminfo.target_price_median , syminfo.ticker , syminfo.tickerid , syminfo.timezone , syminfo.type , syminfo.volumetype , ta.accdist , ta.iii , ta.nvi , ta.obv , ta.pvi , ta.pvt , ta.tr , ta.vwap , ta.wad , ta.wvad , time , time_close , time_tradingday , timeframe.isdaily , timeframe.isdwm , timeframe.isintraday , timeframe.isminutes , timeframe.ismonthly , timeframe.isseconds , timeframe.isticks , timeframe.isweekly , timeframe.main_period , timeframe.multiplier , timeframe.period , timenow , volume , weekofyear , year
█ HOW TO USE
1 — Add the Script:
Apply "Watermark with dynamic variables " to your chart from the TradingView platform.
2 — Configure Inputs:
Open the script settings by clicking the gear icon next to the script's name.
Customize visibility, message content, and appearance for Watermark A and Watermark B.
3 — Utilize Placeholders:
Add placeholders like %bar_index% or %timenow% in the "Watermark - Message" fields to display dynamic data.
Empty lines in the message box are reflected on the chart, allowing you to shift text up or down.
Using \n in the message box translates to a new line on the chart.
4 — Preview Changes:
Adjust settings and view updates in real-time on your chart.
█ EXAMPLES
Branding
DodgyDD's charts
Debugging
█ LIMITATIONS
Only supports variables defined within the script.
Limited to four messages per watermark.
Visual alignment may vary across different chart resolutions or zoom levels.
Placeholder parsing relies on correct input formatting.
█ NOTES
This script is designed for users seeking enhanced chart annotation capabilities. It provides tools for dynamic, customizable watermarks but is not a replacement for chart objects like text labels or drawings. Please ensure placeholders are properly formatted for correct parsing.
Additionally, this script can be a valuable tool for Pine Script developers during debugging . By utilizing dynamic placeholders, developers can display real-time values of variables and chart data directly on their charts, enabling easier troubleshooting and code validation.
Multi-Timeframe Stochastic Alert [tradeviZion]# Multi-Timeframe Stochastic Alert : Complete User Guide
## 1. Introduction
### What is the Multi-Timeframe Stochastic Alert?
The Multi-Timeframe Stochastic Alert is an advanced technical analysis tool that helps traders identify potential trading opportunities by analyzing momentum across multiple timeframes. It combines the power of the stochastic oscillator with multi-timeframe analysis to provide more reliable trading signals.
### Key Features and Benefits
- Simultaneous analysis of 6 different timeframes
- Advanced alert system with customizable conditions
- Real-time visual feedback with color-coded signals
- Comprehensive data table with instant market insights
- Motivational trading messages for psychological support
- Flexible theme support for comfortable viewing
### How it Can Help Your Trading
- Identify stronger trends by confirming momentum across multiple timeframes
- Reduce false signals through multi-timeframe confirmation
- Stay informed of market changes with customizable alerts
- Make more informed decisions with comprehensive market data
- Maintain trading discipline with clear visual signals
## 2. Understanding the Display
### The Stochastic Chart
The main chart displays three key components:
1. ** K-Line (Fast) **: The primary stochastic line (default color: green)
2. ** D-Line (Slow) **: The signal line (default color: red)
3. ** Reference Lines **:
- Overbought Level (80): Upper dashed line
- Middle Line (50): Center dashed line
- Oversold Level (20): Lower dashed line
### The Information Table
The table provides a comprehensive view of stochastic readings across all timeframes. Here's what each column means:
#### Column Explanations:
1. ** Timeframe **
- Shows the time period for each row
- Example: "5" = 5 minutes, "15" = 15 minutes, etc.
2. ** K Value **
- The fast stochastic line value (0-100)
- Higher values indicate stronger upward momentum
- Lower values indicate stronger downward momentum
3. ** D Value **
- The slow stochastic line value (0-100)
- Helps confirm momentum direction
- Crossovers with K-line can signal potential trades
4. ** Status **
- Shows current momentum with symbols:
- ▲ = Increasing (bullish)
- ▼ = Decreasing (bearish)
- Color matches the trend direction
5. ** Trend **
- Shows the current market condition:
- "Overbought" (above 80)
- "Bullish" (above 50)
- "Bearish" (below 50)
- "Oversold" (below 20)
#### Row Explanations:
1. ** Title Row **
- Shows "🎯 Multi-Timeframe Stochastic"
- Indicates the indicator is active
2. ** Header Row **
- Contains column titles
- Dark blue background for easy reading
3. ** Timeframe Rows **
- Six rows showing different timeframe analyses
- Each row updates independently
- Color-coded for easy trend identification
4. **Message Row**
- Shows rotating motivational messages
- Updates every 5 bars
- Helps maintain trading discipline
### Visual Indicators and Colors
- ** Green Background **: Indicates bullish conditions
- ** Red Background **: Indicates bearish conditions
- ** Color Intensity **: Shows strength of the signal
- ** Background Highlights **: Appear when alert conditions are met
## 3. Core Settings Groups
### Stochastic Settings
These settings control the core calculation of the stochastic oscillator.
1. ** Length (Default: 14) **
- What it does: Determines the lookback period for calculations
- Higher values (e.g., 21): More stable, fewer signals
- Lower values (e.g., 8): More sensitive, more signals
- Recommended:
* Day Trading: 8-14
* Swing Trading: 14-21
* Position Trading: 21-30
2. ** Smooth K (Default: 3) **
- What it does: Smooths the main stochastic line
- Higher values: Smoother line, fewer false signals
- Lower values: More responsive, but more noise
- Recommended:
* Day Trading: 2-3
* Swing Trading: 3-5
* Position Trading: 5-7
3. ** Smooth D (Default: 3) **
- What it does: Smooths the signal line
- Works in conjunction with Smooth K
- Usually kept equal to or slightly higher than Smooth K
- Recommended: Keep same as Smooth K for consistency
4. ** Source (Default: Close) **
- What it does: Determines price data for calculations
- Options: Close, Open, High, Low, HL2, HLC3, OHLC4
- Recommended: Stick with Close for most reliable signals
### Timeframe Settings
Controls the multiple timeframes analyzed by the indicator.
1. ** Main Timeframes (TF1-TF6) **
- TF1 (Default: 10): Shortest timeframe for quick signals
- TF2 (Default: 15): Short-term trend confirmation
- TF3 (Default: 30): Medium-term trend analysis
- TF4 (Default: 30): Additional medium-term confirmation
- TF5 (Default: 60): Longer-term trend analysis
- TF6 (Default: 240): Major trend confirmation
Recommended Combinations:
* Scalping: 1, 3, 5, 15, 30, 60
* Day Trading: 5, 15, 30, 60, 240, D
* Swing Trading: 15, 60, 240, D, W, M
2. ** Wait for Bar Close (Default: true) **
- What it does: Controls when calculations update
- True: More reliable but slightly delayed signals
- False: Faster signals but may change before bar closes
- Recommended: Keep True for more reliable signals
### Alert Settings
#### Main Alert Settings
1. ** Enable Alerts (Default: true) **
- Master switch for all alert notifications
- Toggle this off when you don't want any alerts
- Useful during testing or when you want to focus on visual signals only
2. ** Alert Condition (Options) **
- "Above Middle": Bullish momentum alerts only
- "Below Middle": Bearish momentum alerts only
- "Both": Alerts for both directions
- Recommended:
* Trending Markets: Choose direction matching the trend
* Ranging Markets: Use "Both" to catch reversals
* New Traders: Start with "Both" until you develop a specific strategy
3. ** Alert Frequency **
- "Once Per Bar": Immediate alerts during the bar
- "Once Per Bar Close": Alerts only after bar closes
- Recommended:
* Day Trading: "Once Per Bar" for quick reactions
* Swing Trading: "Once Per Bar Close" for confirmed signals
* Beginners: "Once Per Bar Close" to reduce false signals
#### Timeframe Check Settings
1. ** First Check (TF1) **
- Purpose: Confirms basic trend direction
- Alert Triggers When:
* For Bullish: Stochastic is above middle line (50)
* For Bearish: Stochastic is below middle line (50)
* For Both: Triggers in either direction based on position relative to middle line
- Settings:
* Enable/Disable: Turn first check on/off
* Timeframe: Default 5 minutes
- Best Used For:
* Quick trend confirmation
* Entry timing
* Scalping setups
2. ** Second Check (TF2) **
- Purpose: Confirms both position and momentum
- Alert Triggers When:
* For Bullish: Stochastic is above middle line AND both K&D lines are increasing
* For Bearish: Stochastic is below middle line AND both K&D lines are decreasing
* For Both: Triggers based on position and direction matching current condition
- Settings:
* Enable/Disable: Turn second check on/off
* Timeframe: Default 15 minutes
- Best Used For:
* Trend strength confirmation
* Avoiding false breakouts
* Day trading setups
3. ** Third Check (TF3) **
- Purpose: Confirms overall momentum direction
- Alert Triggers When:
* For Bullish: Both K&D lines are increasing (momentum confirmation)
* For Bearish: Both K&D lines are decreasing (momentum confirmation)
* For Both: Triggers based on matching momentum direction
- Settings:
* Enable/Disable: Turn third check on/off
* Timeframe: Default 30 minutes
- Best Used For:
* Major trend confirmation
* Swing trading setups
* Avoiding trades against the main trend
Note: All three conditions must be met simultaneously for the alert to trigger. This multi-timeframe confirmation helps reduce false signals and provides stronger trade setups.
#### Alert Combinations Examples
1. ** Conservative Setup **
- Enable all three checks
- Use "Once Per Bar Close"
- Timeframe Selection Example:
* First Check: 15 minutes
* Second Check: 1 hour (60 minutes)
* Third Check: 4 hours (240 minutes)
- Wider gaps between timeframes reduce noise and false signals
- Best for: Swing trading, beginners
2. ** Aggressive Setup **
- Enable first two checks only
- Use "Once Per Bar"
- Timeframe Selection Example:
* First Check: 5 minutes
* Second Check: 15 minutes
- Closer timeframes for quicker signals
- Best for: Day trading, experienced traders
3. ** Balanced Setup **
- Enable all checks
- Use "Once Per Bar"
- Timeframe Selection Example:
* First Check: 5 minutes
* Second Check: 15 minutes
* Third Check: 1 hour (60 minutes)
- Balanced spacing between timeframes
- Best for: All-around trading
### Visual Settings
#### Alert Visual Settings
1. ** Show Background Color (Default: true) **
- What it does: Highlights chart background when alerts trigger
- Benefits:
* Makes signals more visible
* Helps spot opportunities quickly
* Provides visual confirmation of alerts
- When to disable:
* If using multiple indicators
* When preferring a cleaner chart
* During manual backtesting
2. ** Background Transparency (Default: 90) **
- Range: 0 (solid) to 100 (invisible)
- Recommended Settings:
* Clean Charts: 90-95
* Multiple Indicators: 85-90
* Single Indicator: 80-85
- Tip: Adjust based on your chart's overall visibility
3. ** Background Colors **
- Bullish Background:
* Default: Green
* Indicates upward momentum
* Customizable to match your theme
- Bearish Background:
* Default: Red
* Indicates downward momentum
* Customizable to match your theme
#### Level Settings
1. ** Oversold Level (Default: 20) **
- Traditional Setting: 20
- Adjustable Range: 0-100
- Usage:
* Lower values (e.g., 10): More conservative
* Higher values (e.g., 30): More aggressive
- Trading Applications:
* Potential bullish reversal zone
* Support level in uptrends
* Entry point for long positions
2. ** Overbought Level (Default: 80) **
- Traditional Setting: 80
- Adjustable Range: 0-100
- Usage:
* Lower values (e.g., 70): More aggressive
* Higher values (e.g., 90): More conservative
- Trading Applications:
* Potential bearish reversal zone
* Resistance level in downtrends
* Exit point for long positions
3. ** Middle Line (Default: 50) **
- Purpose: Trend direction separator
- Applications:
* Above 50: Bullish territory
* Below 50: Bearish territory
* Crossing 50: Potential trend change
- Trading Uses:
* Trend confirmation
* Entry/exit trigger
* Risk management level
#### Color Settings
1. ** Bullish Color (Default: Green) **
- Used for:
* K-Line (Main stochastic line)
* Status symbols when trending up
* Trend labels for bullish conditions
- Customization:
* Choose colors that stand out
* Match your trading platform theme
* Consider color blindness accessibility
2. ** Bearish Color (Default: Red) **
- Used for:
* D-Line (Signal line)
* Status symbols when trending down
* Trend labels for bearish conditions
- Customization:
* Choose contrasting colors
* Ensure visibility on your chart
* Consider monitor settings
3. ** Neutral Color (Default: Gray) **
- Used for:
* Middle line (50 level)
- Customization:
* Should be less prominent
* Easy on the eyes
* Good background contrast
### Theme Settings
1. **Color Theme Options**
- Dark Theme (Default):
* Dark background with white text
* Optimized for dark chart backgrounds
* Reduces eye strain in low light
- Light Theme:
* Light background with black text
* Better visibility in bright conditions
- Custom Theme:
* Use your own color preferences
2. ** Available Theme Colors **
- Table Background
- Table Text
- Table Headers
Note: The theme affects only the table display colors. The stochastic lines and alert backgrounds use their own color settings.
### Table Settings
#### Position and Size
1. ** Table Position **
- Options:
* Top Right (Default)
* Middle Right
* Bottom Right
* Top Left
* Middle Left
* Bottom Left
- Considerations:
* Chart space utilization
* Personal preference
* Multiple monitor setups
2. ** Text Sizes **
- Title Size Options:
* Tiny: Minimal space usage
* Small: Compact but readable
* Normal (Default): Standard visibility
* Large: Enhanced readability
* Huge: Maximum visibility
- Data Size Options:
* Recommended: One size smaller than title
* Adjust based on screen resolution
* Consider viewing distance
3. ** Empowering Messages **
- Purpose:
* Maintain trading discipline
* Provide psychological support
* Remind of best practices
- Rotation:
* Changes every 5 bars
* Categories include:
- Market Wisdom
- Strategy & Discipline
- Mindset & Growth
- Technical Mastery
- Market Philosophy
## 4. Setting Up for Different Trading Styles
### Day Trading Setup
1. **Timeframes**
- Primary: 5, 15, 30 minutes
- Secondary: 1H, 4H
- Alert Settings: "Once Per Bar"
2. ** Stochastic Settings **
- Length: 8-14
- Smooth K/D: 2-3
- Alert Condition: Match market trend
3. ** Visual Settings **
- Background: Enabled
- Transparency: 85-90
- Theme: Based on trading hours
### Swing Trading Setup
1. ** Timeframes **
- Primary: 1H, 4H, Daily
- Secondary: Weekly
- Alert Settings: "Once Per Bar Close"
2. ** Stochastic Settings **
- Length: 14-21
- Smooth K/D: 3-5
- Alert Condition: "Both"
3. ** Visual Settings **
- Background: Optional
- Transparency: 90-95
- Theme: Personal preference
### Position Trading Setup
1. ** Timeframes **
- Primary: Daily, Weekly
- Secondary: Monthly
- Alert Settings: "Once Per Bar Close"
2. ** Stochastic Settings **
- Length: 21-30
- Smooth K/D: 5-7
- Alert Condition: "Both"
3. ** Visual Settings **
- Background: Disabled
- Focus on table data
- Theme: High contrast
## 5. Troubleshooting Guide
### Common Issues and Solutions
1. ** Too Many Alerts **
- Cause: Settings too sensitive
- Solutions:
* Increase timeframe intervals
* Use "Once Per Bar Close"
* Enable fewer timeframe checks
* Adjust stochastic length higher
2. ** Missed Signals **
- Cause: Settings too conservative
- Solutions:
* Decrease timeframe intervals
* Use "Once Per Bar"
* Enable more timeframe checks
* Adjust stochastic length lower
3. ** False Signals **
- Cause: Insufficient confirmation
- Solutions:
* Enable all three timeframe checks
* Use larger timeframe gaps
* Wait for bar close
* Confirm with price action
4. ** Visual Clarity Issues **
- Cause: Poor contrast or overlap
- Solutions:
* Adjust transparency
* Change theme settings
* Reposition table
* Modify color scheme
### Best Practices
1. ** Getting Started **
- Start with default settings
- Use "Both" alert condition
- Enable all timeframe checks
- Wait for bar close
- Monitor for a few days
2. ** Fine-Tuning **
- Adjust one setting at a time
- Document changes and results
- Test in different market conditions
- Find your optimal timeframe combination
- Balance sensitivity with reliability
3. ** Risk Management **
- Don't trade against major trends
- Confirm signals with price action
- Use appropriate position sizing
- Set clear stop losses
- Follow your trading plan
4. ** Regular Maintenance **
- Review settings weekly
- Adjust for market conditions
- Update color scheme for visibility
- Clean up chart regularly
- Maintain trading journal
## 6. Tips for Success
1. ** Entry Strategies **
- Wait for all timeframes to align
- Confirm with price action
- Use proper position sizing
- Consider market conditions
2. ** Exit Strategies **
- Trail stops using indicator levels
- Take partial profits at targets
- Honor your stop losses
- Don't fight the trend
3. ** Psychology **
- Stay disciplined with settings
- Don't override system signals
- Keep emotions in check
- Learn from each trade
4. ** Continuous Improvement **
- Record your trades
- Review performance regularly
- Adjust settings gradually
- Stay educated on markets

Non-repainting ticker
The objective here is to provide a "non-repainting" source to indicators, meaning being sure that data is stable and will not affect the results, w/o having to make any change into the indicators
To use it :
1- include this "NRT" indicators onto your page : nothing will be displayed, just keep it.
2- as an exemple, when running any other indicator onto this page, and willing to select "close" as a source, just select instead " NRT: close" into source input; your indicator will then run "non-repainting"
Available sources : open, high, low , close, hl2, hlc3, ohlc4, hlcc4
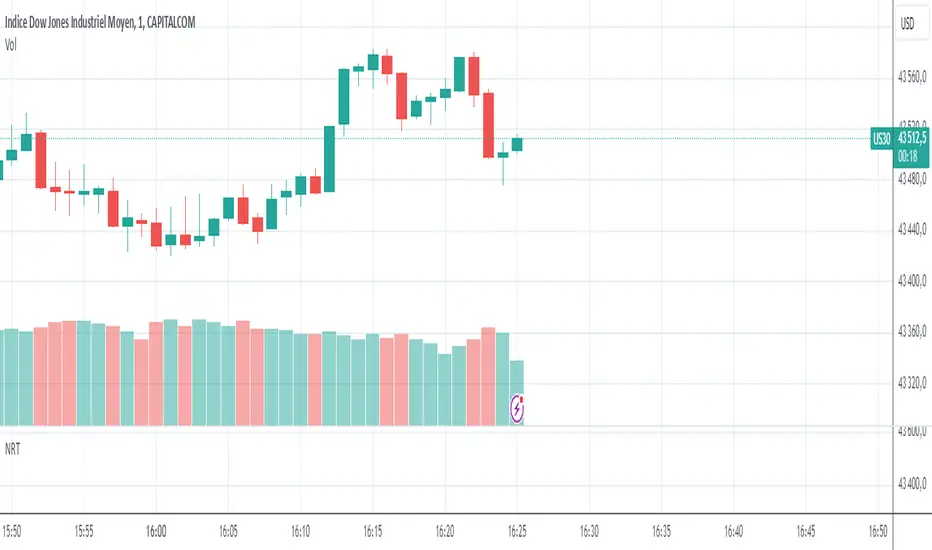
Savitzky Golay Median Filtered RSI [BackQuant]Savitzky Golay Median Filtered RSI
Introducing BackQuant's Savitzky Golay Median Filtered RSI, a cutting-edge indicator that enhances the classic Relative Strength Index (RSI) by applying both a Savitzky-Golay filter and a median filter to provide smoother and more reliable signals. This advanced approach helps reduce noise and captures true momentum trends with greater precision. Let’s break down how the indicator works, the features it offers, and how it can improve your trading strategy.
Core Concept: Relative Strength Index (RSI)
The Relative Strength Index (RSI) is a widely used momentum oscillator that measures the speed and change of price movements. It oscillates between 0 and 100, with levels above 70 typically indicating overbought conditions and levels below 30 indicating oversold conditions. However, the standard RSI can sometimes generate noisy signals, especially in volatile markets, making it challenging to identify reliable entry and exit points.
To improve upon the traditional RSI, this indicator introduces two powerful filters: the Savitzky-Golay filter and a median filter.
Savitzky-Golay Filter: Smoothing with Precision
The Savitzky-Golay filter is a digital filtering technique used to smooth data while preserving important features, such as peaks and trends. Unlike simple moving averages that can distort important price data, the Savitzky-Golay filter uses polynomial regression to fit the data, providing a more accurate and less lagging result.
In this script, the Savitzky-Golay filter is applied to the RSI values to smooth out short-term fluctuations and provide a more reliable signal. By using a window size of 5 and a polynomial degree of 2, the filter effectively reduces noise without compromising the integrity of the underlying price movements.
Median Filter: Reducing Outliers
After applying the Savitzky-Golay filter, the median filter is applied to the smoothed RSI values. The median filter is particularly effective at removing short-lived outliers, further enhancing the accuracy of the RSI by reducing the impact of sudden and temporary price spikes or drops. This combination of filters creates an ultra-smooth RSI that is better suited for detecting true market trends.
Long and Short Signals
The Savitzky Golay Median Filtered RSI generates long and short signals based on user-defined threshold levels:
Long Signals: A long signal is triggered when the filtered RSI exceeds the Long Threshold (default set at 176). This indicates that momentum is shifting upward, and it may present a good buying opportunity.
Short Signals: A short signal is generated when the filtered RSI falls below the Short Threshold (default set at 162). This suggests that momentum is weakening, potentially signaling a selling opportunity or exit from a long position.
These threshold levels can be adjusted to suit different market conditions and timeframes, allowing traders to fine-tune the sensitivity of the indicator.
Customization and Visualization Options
The Savitzky Golay Median Filtered RSI comes with several customization options, enabling traders to tailor the indicator to their specific needs:
Calculation Source: Select the price source for the RSI calculation (default is OHLC4, but it can be changed to close, open, high, or low prices).
RSI Period: Adjust the lookback period for the RSI calculation (default is 14).
Median Filter Length: Control the length of the median filter applied to the smoothed RSI, affecting how much noise is removed from the signal.
Threshold Levels: Customize the long and short thresholds to define the sensitivity for generating buy and sell signals.
UI Settings: Choose whether to display the RSI and thresholds on the chart, color the bars according to trend direction, and adjust the line width and colors used for long and short signals.
Visual Feedback: Color-Coded Signals and Thresholds
To make the signals easier to interpret, the indicator offers visual feedback by coloring the price bars and the RSI plot according to the current market trend:
Green Bars indicate long signals when momentum is bullish.
Red Bars indicate short signals when momentum is bearish.
Gray Bars indicate neutral or undecided conditions when no clear signal is present.
In addition, the Long and Short Thresholds can be plotted directly on the chart to provide a clear reference for when signals are triggered, allowing traders to visually gauge the strength of the RSI relative to its thresholds.
Alerts for Automation
For traders who prefer automated notifications, the Savitzky Golay Median Filtered RSI includes built-in alert conditions for long and short signals. You can configure these alerts to notify you when a buy or sell condition is met, ensuring you never miss a trading opportunity.
Trading Applications
This indicator is versatile and can be used in a variety of trading strategies:
Trend Following: The combination of Savitzky-Golay and median filtering makes this RSI particularly useful for identifying strong trends without being misled by short-term noise. Traders can use the long and short signals to enter trades in the direction of the prevailing trend.
Reversal Trading: By adjusting the threshold levels, traders can use this indicator to spot potential reversals. When the RSI moves from overbought to oversold levels (or vice versa), it may signal a shift in market direction.
Swing Trading: The smoothed RSI provides a clear signal for short to medium-term price movements, making it an excellent tool for swing traders looking to capitalize on momentum shifts.
Risk Management: The filtered RSI can be used as part of a broader risk management strategy, helping traders avoid false signals and stay in trades only when the momentum is strong.
Final Thoughts
The Savitzky Golay Median Filtered RSI takes the classic RSI to the next level by applying advanced smoothing techniques that reduce noise and improve signal reliability. Whether you’re a trend follower, swing trader, or reversal trader, this indicator provides a more refined approach to momentum analysis, helping you make better-informed trading decisions.
As with all indicators, it is important to backtest thoroughly and incorporate sound risk management strategies when using the Savitzky Golay Median Filtered RSI in your trading system.
Thus following all of the key points here are some sample backtests on the 1D Chart
Disclaimer: Backtests are based off past results, and are not indicative of the future.
INDEX:BTCUSD
INDEX:ETHUSD
BINANCE:SOLUSD

KAMA Cloud STIndicator:
Description:
The KAMA Cloud indicator is a sophisticated trading tool designed to provide traders with insights into market trends and their intensity. This indicator is built on the Kaufman Adaptive Moving Average (KAMA), which dynamically adjusts its sensitivity to filter out market noise and respond to significant price movements. The KAMA Cloud leverages multiple KAMAs to gauge trend direction and strength, offering a visual representation that is easy to interpret.
How It Works:
The KAMA Cloud uses twenty different KAMA calculations, each set to a distinct lookback period ranging from 5 to 100. These KAMAs are calculated using the average of the open, high, low, and close prices (OHLC4), ensuring a balanced view of price action. The relative positioning of these KAMAs helps determine the direction of the market trend and its momentum.
By measuring the cumulative relative distance between these KAMAs, the indicator effectively assesses the overall trend strength, akin to how the Average True Range (ATR) measures market volatility. This cumulative measure helps in identifying the trend’s robustness and potential sustainability.
The visualization component of the KAMA Cloud is particularly insightful. It plots a 'cloud' formed between the base KAMA (set at a 100-period lookback) and an adjusted KAMA that incorporates the cumulative relative distance scaled up. This cloud changes color based on the trend direction — green for upward trends and red for downward trends, providing a clear, visual representation of market conditions.
How the Strategy Works:
The KAMA Cloud ST strategy employs multiple KAMA calculations with varying lengths to capture the nuances of market trends. It measures the relative distances between these KAMAs to determine the trend's direction and strength, much like the original indicator. The strategy enhances decision-making by plotting a 'cloud' formed between the base KAMA (set to a 100-period lookback) and an adjusted KAMA that scales according to the cumulative relative distance of all KAMAs.
Key Components of the Strategy:
Multiple KAMA Layers: The strategy calculates KAMAs for periods ranging from 5 to 100 to analyze short to long-term market trends.
Dynamic Cloud: The cloud visually represents the trend’s strength and direction, updating in real-time as the market evolves.
Signal Generation: Trade signals are generated based on the orientation of the cloud relative to a smoothed version of the upper KAMA boundary. Long positions are initiated when the market trend is upward, and the current cloud value is above its smoothed average. Conversely, positions are closed when the trend reverses, indicated by the cloud falling below the smoothed average.
Suggested Usage:
Market: Stocks, not cryptocurrency
Timeframe: 1 Hour
Indicator:
