SSL HybridThis script is designed for the NNFX Method, so it is recommended for Daily charts only.
Tried to implement a few VP NNFX Rules
This script has a SSL / Baseline (you can choose between the SSL or MA), a secondary SSL for continiuation trades and a third SSL for exit trades.
Alerts added for Baseline entries, SSL2 continuations, Exits.
Baseline has a Keltner Channel setting for "in zone" Gray Candles
Added "Candle Size > 1 ATR" Diamonds from my old script with the criteria of being within Baseline ATR range.
Credits go to:
Strategy causecelebre www.tradingview.com
SSL Channel ErwinBeckers www.tradingview.com
Moving Averages jiehonglim www.tradingview.com
Moving Averages everget www.tradingview.com
"Many Moving Averages" script Fractured www.tradingview.com
Pesquisar nos scripts por "N+credit最新动态"

CryptOli 3 MAs long/short Backtest// this is an educational Script - basicly its very simple - you can see how minimal changes impact results, thats why i posted it
// Credits to Quantnomad to publish tons of free educational script
// this Script is based on Quantnomads Ultimate MA Indicator
// HA - Option for calcultion based on HA-Candles (very famous recently)
// Source Input - Option (Candletype for calculation, close, ohlc4 ect.) --- there are huge differences --- try it by your own

Red and Green Ignored Bar by Oliver VelezOn this occasion I present a script that detects Ignored Red Candles and Ignored Green Candles, basically it is a Price Action event that indicates a possible continuation of the current trend and gives the opportunity to climb it with a Very tight risk, before delving into detail I would like to leave this note:
Note: the detection of this event does not guarantee that the signal will be good, the trader must have the ability to determine its quality based on aspects such as trend, maturity, support / resistance levels, expansion / contraction of the market, risk / benefit, etc, if you do not have knowledge about this you should not use this indicator since using it without a robust trading plan and experience could cause you to partially or totally lose your money, if this is your case you should train before If you try to extract money from the market, this script was created to be another tool in your trading plan in order to configure the rules at your discretion, execute them consistently and have AUTOMATIC ALERTS when the event occurs, which is where I find more value because you can have many instruments waiting for the event to be generated, in the time frame you want and without having to observe the mer When the alert is generated, the Trader should evaluate the quality of the alert and define whether or not to execute it (higher timeframes, they can give you more time to execute the operation correctly).
Let's continue….
This event was created by Oliver Velez recognized trader / mentor of price action, the event has a very interesting particularity since it allows to take a position with a very limited risk in trend movements, this achieves favorable operations of good ratio and small losses when taking An adjusted risk, if the trade works, a good ratio is quickly achieved and we agree with a key point in the “Keep small losses and big profits” trading, this makes it easier to have a positive mathematical hope when your level of Success is not very high, so leave you in the field of profitability.
THE EVENT:
The event has a bullish configuration (Ignored Red Candle) and a bearish configuration (Ignored Green Candle), below I detail the “Hard” rules (later I explain why “Hard”):
1- Last 3 bars have to be GREEN-RED-GREEN (possible bullish configuration) or RED-GREEN-RED (possible bearish configuration), the first bar is called Control Bar, the second is called Ignored Bar and the third Signal Bar as shown in the following image:
2- Be in a trend determined by simple moving averages (Slow of 20 periods and Fast of 8 periods), as a general rule you can take the direction of MA20 but the Trader has to determine if there is a trend movement or not.
3- Control bar of good range, little tail and with a body greater than 55%.
4- Ignored bar preferably narrow range, little tail and that is located in the upper 1/3 of the control bar.
5- Signal bar cannot override the minimum of the ignored bar.
6- Activation / Confirmation of event by means of signal bar in overcoming the body of the ignored bar.
Some examples of ignored bars (with “Hard” and “Flexible” rules):
Features and configuration of the indicator:
To access the indicator settings, press the wheel next to the indicator name VVI_VRI "Configuration options".
- Operation mode (Filtering Type):
• Filtering Complete: all filters activated according to the configuration below.
• Without Filtering: all filters deactivated, all VRI / VVI are displayed without any selection criteria.
• Trend Filter only: shows only VRI / VVI that are in accordance with what is set in “Trend Settings”
- Configuration Moving Averages:
• See Slow Media: slow moving average display with direction detection and color change.
• See Fast Media: display of fast moving average with direction detection and color change.
• Type: possibility to choose the type of media: DEMA, EMA, HullMA, SMA, SSMA, SSMA, TEMA, TMA, VWMA, WMA, ZEMA)
• Period: number of previous bars.
• Source: possibility to choose the type of source, open, close, high, low, hl2 hlc3, ohlc4.
• Reaction: this configuration affects the color change before a change of direction, 1 being an immediate reaction and higher values, a more delayed reaction obtaining les false "changes of direction", a value of 3 filters the direction quite well.
- Trend Configuration
• Uptrend Condition P / VRI: possibility to select any of these conditions:
o Bullish MA direction
o Quick bullish MA direction
o Slow and fast bullish MA direction
o Price higher than slow MA
o Price higher than fast MA
o Price higher than slow and fast MA
o Price higher than slow MA and bullish direction
o Price higher than fast MA and bullish direction
o Price higher than slow, fast MA and bullish direction
o No condition
• Condition P / VVI bear trend: possibility of selecting any of these conditions:
o Slow bearish MA direction
o Fast bearish MA direction
o Slow and fast bearish MA direction
o Price less than slow MA
o Price less than fast MA
o Price less than slow and fast MA
o Price lower than slow MA and bearish direction
o Price less than fast MA and bearish direction
o Price less than slow, fast MA and bearish direction
o No condition
- Control bar configuration
• Minimum body percentage%: possibility to select what body percentage the bar must have.
• Paint control bar: when selected, paint the control bar.
• See control bar label: when selected, a label with the legend BC is plotted.
- Configuration bar ignored
• Above X% of the control bar: possibility to select above what percentage of the control bar the ignored bar must be located.
• Paint ignored bar: when selected, paint the ignored bar.
- Signal bar configuration
• You cannot override the minimum of the ignored bar: when selected, the condition is added that the signal bar cannot override the minimum of the ignored bar.
• Paint signal bar: when selected, paint the signal bar.
• See arrow: when selected it shows the direction arrow of the possible movement.
• See bear and arrow: when selected it shows bear and arrow label
• See bull and arrow: when selected it shows bull and arrow label
The following image shows the ignored bar and painted signal:
- Take profit / loss
The profit / loss taking varies depending on the trader and its risk / monetary plan, the proposal is a recommendation based on the nature of the event that is to have a small risk unit (stop below the minimum of the ignored bar), look for objectives in ratios greater than 2: 1 and eliminate the risk in 1: 1 by taking the stop to BE, all parameters are configurable and are the following:
• See recommended stop loss and take profit: trace the levels of Stop, BE, TP1 and TP2, as well as their prices to know them quickly based on the assumed risk
• To: select which event you want to draw the SL and TP (VRI, VVI)
• Extend stop loss line x bars: allows extending the stop line by x number of bars
• Extend take profit line x bars: allows extending the stop line by x number of bars
• Ratio to move to break even: allows you to select the minimum ratio to move stop to break even (default 1: 1)
• Take profit 1 ratio: allows you to select the ratio for take profit 1 (default 2: 1)
• Take profit 2 ratio: allows you to select the ratio for take profit 2 (default 4: 1)
- Alerts
• It is possible to configure the following alerts:
-VRI DETECTED
-VVI DETECTED
-VRI / VVI DETECTED
Final Notes:
- The term hard rules refers to the fact that an event is sought with the rules detailed above to obtain a high quality event but this brings 2 situations to consider, less
number of events and events that are generated in a strong impulse may be leaked, a very large control bar followed by an ignored narrow body away from moving averages, despite having a good chance of continuing, taking a stop very tight in a strong impulse you can touch it by the simple fact of the own volatility at that time.
- The setting of the parameters “Minimum body percentage% (control bar)”, “Above x% of the control bar (bar ignored)” and “Cannot override the minimum of the ignored bar” can bring large Benefits in terms of number of events and that can also be of high quality, feel free to find the best configuration for your instrument to operate.
- It is recommended to look for trending events, near moving averages and at an early stage of it.
- The display of several nearby VRIs or VVIs in an advanced trend may indicate a depletion of it.
- The alerts can be worked in 2 ways: at the closing of the candle (confirms event but the risk unit may be larger or smaller) or immediately the body of the ignored bar is exceeded, in case you are operating from the mobile and miss many events because of the short time I recommend that you operate in a superior time frame to have more time.
- The indicator is configured with “flexible” rules to have more events, but without any important criteria, each trader has to look for the best configuration that suits his instrument.
- It is recommended to partially close the operation based on the ratio and always keep a part of the position to apply manual trailing stop and try to maximize profits.
The code is open feel free to use and modify it, a mention in credits is appreciated.
If you liked this SCRIPT THUMB UP!
Greetings to all, I wish you much green!

CustomCrossCorrelations+AlertsJust a bunch of neatly displayed commonly used/_reused_ indicators that I mainly use alongside cross-correlation. Simply put, this script might help other traders to enter trades indicative of moves to the upside/downside and want to see more confirmation such as crosses and/or confluence areas.
Feel free to customize to your liking and adjust the options as needed. Credits are given to the other authors whose scripts were referenced and used as boilerplate. Feedback appreciated as well!
Disclaimer: Potential signals are subjective, to each his own. Although some settings may need to be tweaked to the trader's preferences, some prove worthy.

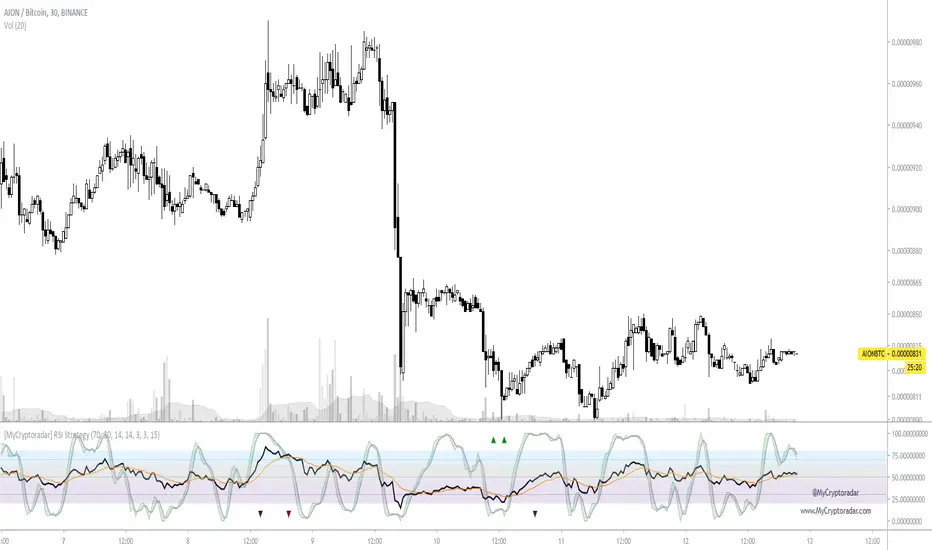
[MyCryptoradar] Three Moving Average Strategy + S/R levels + BBMade this script for a friend. There are three moving average strategy and automatic S/R level reconizing and BB.
EMA 8, 21 & 55 Strategy
EMA 5, 8 & 13 Strategy
EMA 12 & 26 Strategy
Credits to @parsa1368 for BB script i used.

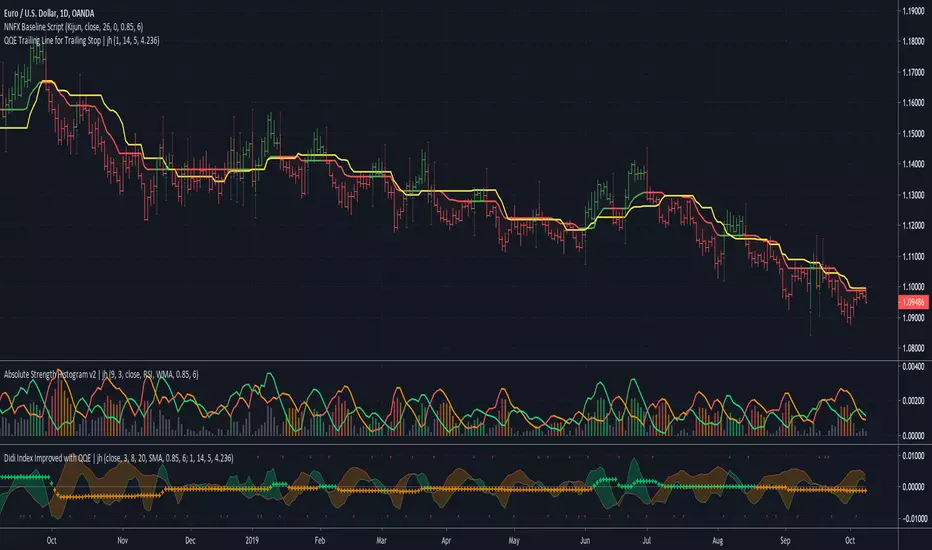
QQE Trailing Line for Trailing Stop | jhUsing parts of QQE (Qualitative Quantitative Estimation) again, this time I'm applying the trailing line of QQE on price directly.
Outcome, it's behaving like a baseline filter and it can be use as an exit or a trailing stop indicator.
As comparing to Kijun-sen line in yellow, the QQE trailing line follows the price closer, therefore exiting you sooner when the trend direction changes.
There's 2 QQE option, they behave differently during the trend change.
Credits to Glaz and Shizaru for their QQE code.
My Recursive Bands [ChuckBanger]This is a different type of bands. I modified Alex Pierrefeu Recursive Bands algo. It is a smoothed version of Alex's algo and imo it suites better for heikin ashi candles but it works well with regular candles.
How to use it:
When price hugs the upper band. It is a potential long and when price hugs the lower band it is a potential short.
Credits to Alex Pierrefeu: figshare.com

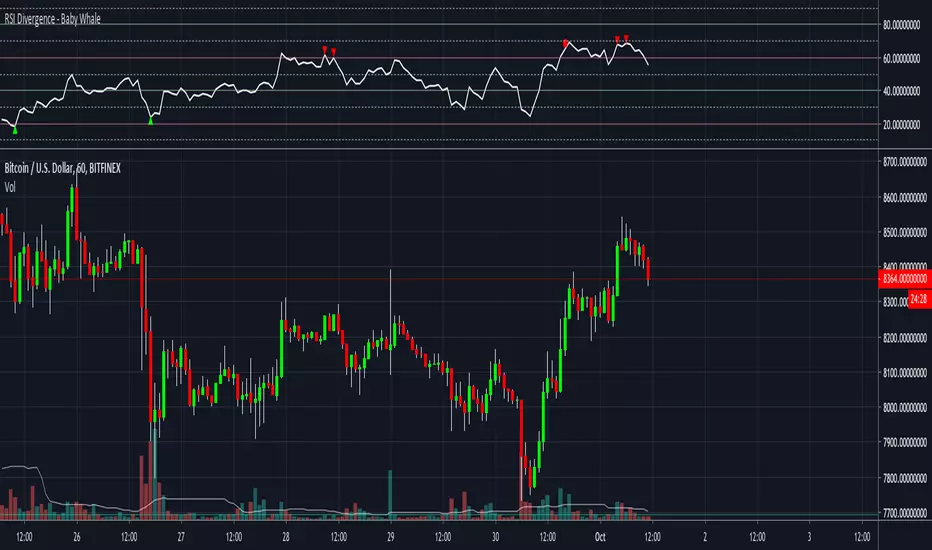
RSI Divergence - Baby WhaleHey guys!
BabyWhale here!
I will open source my scripts, so everyone can use them and update.
In this RSI Divergence script I added Hidden Divergence (beta) as well.
This script will show you:
Bullish Divergence (green triangle)
Hidden Bullish Divergence (green circle)
Bearish Divergence (red triangle)
Hidden Bearish Divergence (red circle)
You can set the RSI values.
I recommend 60 / 40 or 70 / 30.
Last but not least, you can set alarms when a Divergence or Hidden Divergence is found.
Feedback is always welcome!
Credits to @Libertus, I used his script as inspiration.
Good luck with trading!
BabyWhale
Didi Index Improved with QQE | jhI was perplexed by the lack of continuation signals in trends, so I spent some time looking for a suitable indicator just for that purpose and fast indicators that can provide continuation signals tend to be too noisy as well.
I'm always intrigued by QQE (Qualitative Quantitative Estimation), so I QQE-ed almost everything I encountered.
After a while, I settled on Didi Index and enhanced it by adding an additional signal line calculated from QQE trailing line. The QQE trailing line provides additional cross overs for the short/fast Didi line, specially created for the NNFX continuation signals in the same direction.
The QQE trailing line acts as zero cross, providing an additional filter for ranging periods.
There's a few ways of identifying the cross overs:
Didi cross overs signals are highlighted with shapes at the top.
Didi long signal when fast and slow Didi crosses above zero
Didi short signal when fast and slow Didi crosses below zero
Continuation signals are highlighted with shapes at the bottom.
Continuation long signal when Didi fast line cross over QQE trailing line
Continuation short signal when Didi fast line cross under QQE trailing line
Example of continuation trades
Example of filtering bad signals from your baseline, confirmation or continuation signals.
Credits to Glaz and Shizaru for their QQE code.

[Coingrats]RSI Divergence + StochRSIThis indicator shows the RSI and StochRSI. RSI divergence will also be marked.
- Bullish divergence - green triangle,
- Hidden bullish divergence - gray triangle
- Bearish divergence = red triangle
- Hidden bearish divergence - gray triangle
Credits to BabyWhale83 for the code to spotting divergence
WANNA TIP ME? BUY ME SOME BEERS!
BTC: 3BMEXX5JrX94ziUSoQMLEmi51WcYwphAg3
ETH: 0x541e504bb461aa141de6ddce09dc89eb16f58f9c
LTC: LPBJXzUZJksCuCK27AY2qAVYGGGiUfejok
DON'T FORGET TO LOOK AT OUR SITE MYCRYPTODARAR.COM
ATR TRex [SHK]To appreciate dear Mr.Khakestar efforts i have converted his mt4 ATR formula to pine script. All credits goes to him.
Plots
You can enable plots from the settings tab and then disable five first plots from the style tabs (finally save as default). Then you can view the ATR result of each candle in the past:
Green number is the HL range of the candle.
Red number is the ATR of the candle.
First black number is the ATR of the 4H chart.
Second black number is the ATR of the 1D chart.
Third black number is the ATR of the 1W chart.
What makes this ATR formula so different?
This formula invented by Mr.Khakestar and it shows the power of the price to move in each cycle of the chart. We can use it in RTM strategy and Price Action trading. To learn how to use it you need to learn TRex strategy (Presented by Mr.Khakestart for free in Persian).

MASEMAS All-In-One V2.0This is an indicator for those with a free account and have a low maximum of active indicators at once.
V2.0 contains:
- 3 Simple Moving Averages + 5 Exponetial Moving Averages.
- EMA Ribbon (Credits to as I literally copy/pasted his work).
- Auto Fibonacci Levels!

[Alarm] GetTrendStrategyAll credits to the original strategy creator.
I simply converted it to an alarm to save others some time :)

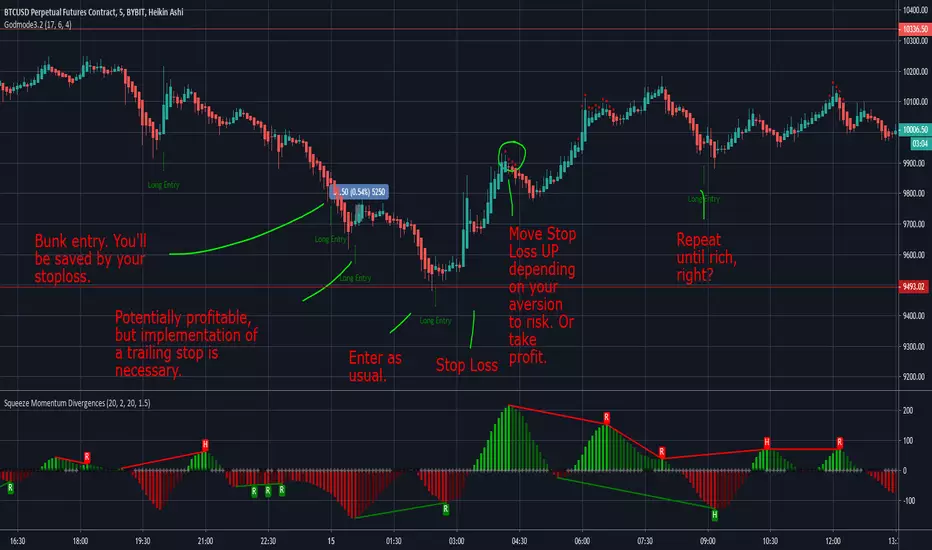
Godmode3.2 - Long Signals (with alerts)Building upon an indicator that I really like, I decided to add alerts and plot shapes for extra certainty. Credits to all the programmers who actually did all the heavy lifting on the calculations - I just added easy stuff (and what I think are good conditions for going long).
No Nonsense NNFX VP Strategy for Back Testing Indicators| jhAfter putting the whole system together, sat down to benchmark the various confirmation indicators, shrink it down to backtest individual confirmation indicators.
Results for 24 periods way better than 10, then again it's only one pair. :)
More details below.
//////////////////////////////////////////////////////////////////////////////////////////////////////////////////////////////////
//Designed per No Nonsense Forex VP rules
//For testing your individual indicators before the full system
//Originated from causecelebre
//Tried to put in as much VP rules as possible
///////////////////////////////////////////////////
//Rules Implemented:
///////////////////////////////////////////////////
// - SL 1.5 x ATR
// - TP 1 x ATR
//
// - Entry conditions
//// - Entry from 1 x confirmation
// - Exit conditions
//// - Exit on confirmation flip
///////////////////////////////////////////////////
//Trades entries
///////////////////////////////////////////////////
// - First entry L1 or S1 with standard SL and TP
///////////////////////////////////////////////////
//Included Indicators and settings
///////////////////////////////////////////////////
// - Confirmtion = SSL 10
///////////////////////////////////////////////////
//Credits
// Strategy causecelebre www.tradingview.com
// SSL Channel ErwinBeckers www.tradingview.com
//////////////////////////////////////////////////////////////////////////////////////////////////////////////////////////////////
//Change log
//First release. Testing of indicators
//////////////////////////////////////////////////////////////////////////////////////////////////////////////////////////////////

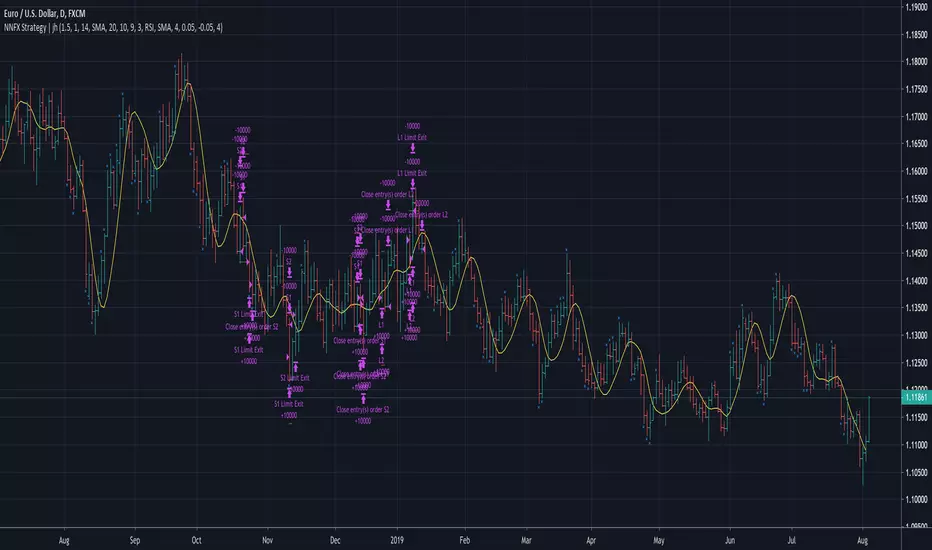
No Nonsense NNFX VP Strategy for Back Testing | jhMy first script, be kind :)
Most of the rules are implemented:
- Money management
- ATR, Baseline, Confirmation, Volume, Exit
More details below.
//////////////////////////////////////////////////////////////////////////////////////////////////////////////////////////////////
//////////////////////////////////////////////////////////////////////////////////////////////////////////////////////////////////
//Designed per No Nonsense Forex VP rules
//Made to be as modular as possible, so we can swap the indicators in and out.
//Originated from causecelebre
//Tried to put in as much VP rules as possible
///////////////////////////////////////////////////
//Rules Implemented:
///////////////////////////////////////////////////
// - SL 1.5 x ATR
// - TP 1 x ATR
//
// - Entry conditions
//// - Entry within 1 candles of baseline + 1 x confirmation + volume
//// - Entry only if baseline is < 1 x ATR
// - Exit conditions
//// - Exit on exit indicator or when baseline or confirmation flip
///////////////////////////////////////////////////
//Trades entries
///////////////////////////////////////////////////
// - First entry L1 or S1 with standard SL and TP
// - Second entry L2 or S2 with standard SL and exit upon the exit conditions
///////////////////////////////////////////////////
//Included Indicators and settings
///////////////////////////////////////////////////
// - Baseline = HMA 20
// - Confirmtion = SSL 10
// - Volume = TDFI 4
// - Exit = RVI 4
///////////////////////////////////////////////////
//Credits
// Strategy causecelebre
// TDFI causecelebre
// SSL Channel ErwinBeckers
//////////////////////////////////////////////////////////////////////////////////////////////////////////////////////////////////
//////////////////////////////////////////////////////////////////////////////////////////////////////////////////////////////////
Waddah Attar Explosion V2 [SHK]Hey everyone
I have modified Waddah Attar Explosion indicator to work in low price markets like crypto as well as any other market. So now the DeadZone line is based on ATR instead of a fixed number. Nothing more changed and all credits goes to it's MT4 developer and LazyBear (Main Script Link) .
Hope you enjoy!
Read the main description below...
- - - - - - - - - - - - - - - - - - - - - - - - - - - - - - - - - - - - - - -
This is a port of a famous MT4 indicator. This indicator uses MACD/BB to track trend direction and strength. Author suggests using this indicator on 30mins.
Explanation from the indicator developer:
"Various components of the indicator are:
Dead Zone Line: Works as a filter for weak signals. Do not trade when the red or green histogram is below it.
Histograms:
- Red histogram shows the current down trend.
- Green histogram shows the current up trend.
- Sienna line shows the explosion in price up or down.
Signal for ENTER_BUY: All the following conditions must be met.
- Green histo is raising.
- Green histo above Explosion line.
- Explosion line raising.
- Both green histo and Explosion line above DeadZone line.
Signal for EXIT_BUY: Exit when green histo crosses below Explosion line.
Signal for ENTER_SELL: All the following conditions must be met.
- Red histo is raising.
- Red histo above Explosion line.
- Explosion line raising.
- Both red histo and Explosion line above DeadZone line.
Signal for EXIT_SELL: Exit when red histo crosses below Explosion line.
All of the parameters are configurable via options page. You may have to tune it for your instrument.

Fib Divergence SystemCombo of many useful indicators which includes fib lines, time and money channels and divergence buy sell signals
Credits for source code:
Scarf, Lazybear, 100kiwi

Philakone 5EMA Swing Trading Strategy [Buy&Sell Signals]Fork of the "Philakone 55 EMA Swing Trading Strategy" made by lvynnil
-Added 200EMA
-Changed shape of the arrows and added text of Buy & Sell
All credits go to lvynnil
For more informations about the original script go to:

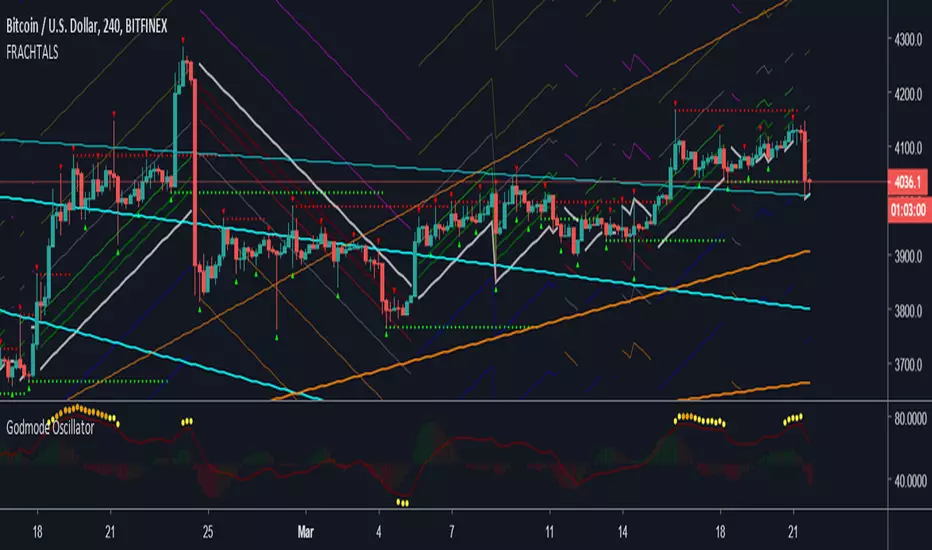
FRACHTALS"FRACHTALS" - A practical example of taking a joke entirely way, way too far
Speaking of which - Moon when?
#REKT
Credits/Acknowledgements/References:
Fractal detection + other functions (@RicardoSantos)
Laguerre RSI w/ self-Adjusting Alpha (@everget)
CM Super Guppy ala WY StrategyThis is a work-in-progress..
Created a strategy from CM Super Guppy by FritzMurphy
Have been using that script to eyeball for long positions, so I decided to transform the CM Super Guppy script into a strategy to automate long positions
The results are kinda massacred as the Long entry and exit are somehow one bar delayed from where I want it to enter and exit, care to help improve this?
After fixing the entry and exit delay..
Next iterations will be to have a drop down selection for various MAs
Then, to add short positions
Credits to Chris Moody and Fritz Murphy prior work on Super Guppy

Fisher Transform Multi-Timeframe Backtest (No Trailing)This is the Backtester without Trailing Stops
Credits to mortdiggiddy

Waddah Attar Explosion and WaveTrend Oscillator combinedWaddah Attar Explosion by LazyBear and WaveTrend Oscillator by Krypt.
All credits goes to LazyBear and Krypt, i have only done some combining with the two indicators, barcolors and BG colors to clarify entrys and exits.
Combine with CM_Williams Vix_Fix, Super Guppy R1.0 by JustUncleL and you have a powerful tool.
Barcolors to look for
Aggressive Buy 1 = Lime
Agressive Buy 2 = Aqua
Buy = Green
Sell 1 = Orange
Sell 2 = Red
This is my first try, so be nice to me :-)
