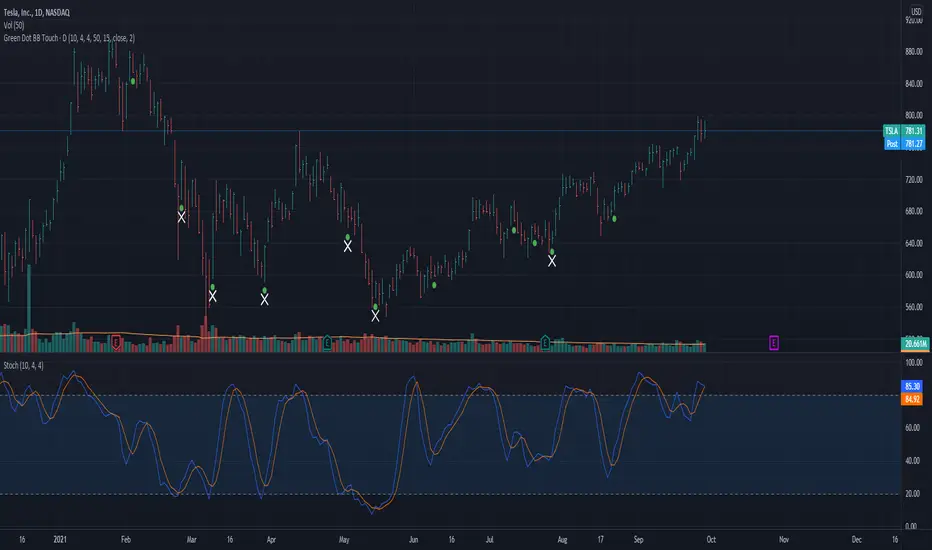
Green Dot with Lower BB TouchThis code is based on Dr. Wish's Green Dot indicator and all credits should go to him for this indicator. I have adapted the code described by Dr. Wish in his various blog posts and webinars.
This indicator involves Stochastics and Bollinger Band indicators to provide an indication when a technically sound stock is potentially oversold and reading to resume its uptrend. This is best used in Stage 2 (Weinstein) stocks viewed on a daily chart.
The green dot appears when the fast stochastic recently crosses over the slow stochastic at the oversold (OS) threshold.
The default values for this Stochastic are 10,4,4 with an oversold (OS) threshold of 50. You can add the built-in Stochastic indicator to check this out and have a better visual as to why this works.
An added enhancement is using Bollinger Bands, specifically when the price has crossed the lower band in the past 3 days. The also plays into the themes of stocks that are following an uptrend.
The default values for the Bollinger Band portion of the indicator is a length of 15 with a standard deviation of using the stock's closing price.
I have compared this indicator with the many examples from Dr. Wish's blog and feel free to do the same to make sure it is in agreement.
I welcome your feedback and any enhancements you may suggest.
Pesquisar nos scripts por "N+credit最新动态"
[pp] Signal GeneratorResearch and Development Tool.
For anyone who is familiar with working with digital signals (audio/electrical engineers) you might appreciate this Signal Generator.
You can select and vary 4 different types of signals.
Logistic Map
If you're not familiar with the logistic map, then go watch a youtube video. By default the equation is meant to represent chaos and is a good alternative for random number generation.
Random
This uses the built-in random number generator. I'm not sure if it's better to use this or the logmap default settings. Either way, you have a choice.
Unit Impulse
Good for creating a transient impulse.
Step Impulse
Similar to the unit impulse. Except constant and not a transient.
Synthesizer
It comes with 4 wave functions (Sine, Triangle, Square, Saw) that can be combined for additive synthesis. Each wave function contains its own respective phase and amplitude control.
Credits
Many of these functions were taken from www.pinecoders.com with the exception of the logistic map. I simply aggregated them all into this toolkit for ease of use.
How to use
This is not a trading indicator. This is meant to be used for research and development. You could use it to test strategies, by generating white noise with the logmap and creating trading signals. Or you could use it for teaching and learning. Using the constant data as a dependable, repeatable resource.

Gann Square 9 Price Line Helper (Experimental)This indicator was intended as educational purpose only for Gann Square 9, specifically to show Cross and Cross Cardinal.
This indicator was build upon The Tunnel Thru The Air Or Looking Back From 1940, written by WD Gann .
Values shown is theoretical for basic understanding and may not represent actual market trend.
This pine script for educational purpose as basic understanding only, not recommend for actual trade and use at your on risk.
Indicator features :
1. Font size for table from tiny to huge.
2. Table can change position or hide.
2. For desktop display only, not for mobile.
3. All values can be selected individually or group to display individual or group lines and labels.
FAQ
1. Credits
WD Gann , The Tunnel Thru The Air Or Looking Back From 1940
2. Page involved
195 - 198
3. Code Usage
Free to use for personal usage.

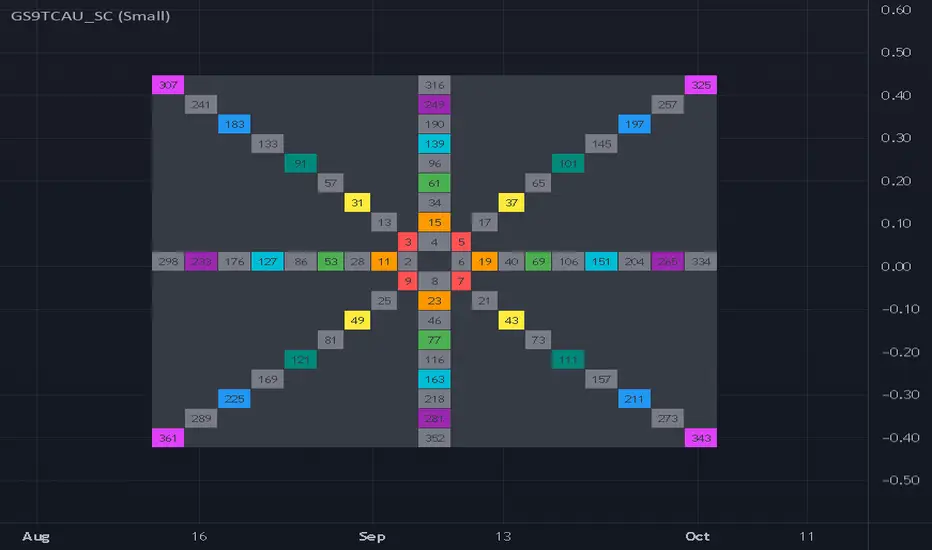
Gann Square 9 Table Concept Alternate UIThis indicator was intended as educational purpose only for Gann Square 4, specifically to show Cross Cardinal.
This indicator was build upon The Tunnel Thru The Air Or Looking Back From 1940, written by WD Gann .
This build was improved by grouping similar values after selected to save time.
User Interface also was improved.
Indikator ini bertujuan sebagai pendidikan sahaja untuk Gann Square 4, khusus untuk menunjukkan Cross Cardinal.
Indikator ini dibina berdasarkan buku The Tunnel Thru The Air Or Looking Back From 1940, ditulis oleh WD Gann .
Binaan ini telah ditambah baik engan mengumpulkan nilai yang sama setelah dipilih untuk menjimatkan masa.
User Interface juga telah ditambah baik.
Indicator features :
1. Font size from tiny to huge.
2. For desktop display only, not for mobile.
3. All values can be selected by group.
Kemampuan indikator :
1. Saiz font dari paling kecil ke paling besar.
2. Untuk paparan desktop sahaja, bukan untuk mobile.
3. Semua nilai boleh dipilih secara berkumpulan.
FAQ
1. Credits / Kredit
WD Gann , The Tunnel Thru The Air Or Looking Back From 1940
Ganzilla
2. Page involved / Muka Surat terlibat
195 - 198
3. Code Usage / Penggunaan Kod
Free to use for personal usage.
Bebas untuk kegunaan peribadi.
4. Previous build / Binaan sebelum ini
Gann Square 9 Cross Cardinal Table Concept
5. Related build / Binaan berkaitan
Gann Square 4 Cross Cardinal Table Concept
Gann Square 4 Table Concept Alternate UI
Left : Even array number / Kiri : Array nombor genap
Right : Odd array number / Kanan : Array nombor ganjil
Gann Square 4 Table Concept Alternate UIThis indicator was intended as educational purpose only for Gann Square 4, specifically to show Cross Cardinal.
This indicator was build upon The Tunnel Thru The Air Or Looking Back From 1940, written by WD Gann .
This build was improved based on Gann Square 4 Cross Cardinal Table Concept by grouping similar values after selected to save time.
User Interface also was improved.
Indikator ini bertujuan sebagai pendidikan sahaja untuk Gann Square 4, khusus untuk menunjukkan Cross Cardinal.
Indikator ini dibina berdasarkan buku The Tunnel Thru The Air Or Looking Back From 1940, ditulis oleh WD Gann .
Binaan ini telah ditambah baik berdasarkan Gann Square 4 Cross Cardinal Table Concept dengan mengumpulkan nilai yang sama setelah dipilih untuk menjimatkan masa.
User Interface juga telah ditambah baik.
Indicator features :
1. Font size from tiny to huge.
2. For desktop display only, not for mobile.
3. All values can be selected by group.
Kemampuan indikator :
1. Saiz font dari paling kecil ke paling besar.
2. Untuk paparan desktop sahaja, bukan untuk mobile.
3. Semua nilai boleh dipilih secara berkumpulan.
FAQ
1. Credits / Kredit
WD Gann , The Tunnel Thru The Air Or Looking Back From 1940
Ganzilla
2. Page involved / Muka Surat terlibat
195 - 198
3. Code Usage / Penggunaan Kod
Free to use for personal usage.
Bebas untuk kegunaan peribadi.
4. Previous build / Binaan sebelum ini
Gann Square 4 Cross Cardinal Table Concept
5. Related build / Binaan berkaitan
Gann Square 9 Cross Cardinal Table Concept
Left : Even array number / Kiri : Array nombor genap
Right : Odd array number / Kanan : Array nombor ganjil

Gann Square 4 Cross Cardinal Table ConceptThis indicator was intended as educational purpose only for Gann Square 4, specifically to show Cross Cardinal.
This indicator was build upon The Tunnel Thru The Air Or Looking Back From 1940, written by WD Gann.
Gann Square 4 is similar to Gann Square 9 (Refer this build) but limited to Cross Cardinal only.
Indikator ini bertujuan sebagai pendidikan sahaja untuk Gann Square 4, khusus untuk menunjukkan Cross Cardinal.
Indikator ini dibina berdasarkan buku The Tunnel Thru The Air Or Looking Back From 1940, ditulis oleh WD Gann.
Gann Square 4 hampir sama dengan Gann Square 9 (Rujuk binaan ini) tetapi terhad kepada Cross Cardinal sahaja.
Indicator features :
1. Font size from tiny to huge.
2. For desktop display only, not for mobile.
3. All values can be selected individually.
Kemampuan indikator :
1. Saiz font dari paling kecil ke paling besar.
2. Untuk paparan desktop sahaja, bukan untuk mobile.
3. Semua nilai boleh dipilih secara individu.
FAQ
1. Credits / Kredit
WD Gann , The Tunnel Thru The Air Or Looking Back From 1940
Ganzilla
2. Page involved / Muka Surat terlibat
195 - 198
3. Code Usage / Penggunaan Kod
Free to use for personal usage.
Bebas untuk kegunaan peribadi.
Left : All values off / Kiri : Semua nilai off
Right : All values on / Kanan : Semua nilai on
Left : Random Usage / Kiri : Kegunaan Random
Right : Ideal Usage / Kanan : Kegunaan Ideal
Gann Square 9 Cross Cardinal Table ConceptThis indicator was intended as educational purpose only for Gann Square 9, specifically to show Cross and Cross Cardinal.
This indicator was build upon The Tunnel Thru The Air Or Looking Back From 1940, written by WD Gann.
Indikator ini bertujuan sebagai pendidikan sahaja untuk Gann Square 9, khusus untuk menunjukkan Cross dan Cross Cardinal.
Indikator ini dibina berdasarkan buku The Tunnel Thru The Air Or Looking Back From 1940, ditulis oleh WD Gann.
Indicator features :
1. Font size from tiny to huge.
2. For desktop display only, not for mobile.
3. All values can be selected individually.
Kemampuan indikator :
1. Saiz font dari paling kecil ke paling besar.
2. Untuk paparan desktop sahaja, bukan untuk mobile.
3. Semua nilai boleh dipilih secara individu.
FAQ
1. Credits / Kredit
WD Gann, The Tunnel Thru The Air Or Looking Back From 1940
Ganzilla
2. Page involved / Muka Surat terlibat
195 - 198
3. Code Usage / Penggunaan Kod
Free to use for personal usage.
Bebas untuk kegunaan peribadi.
Left : All values off / Kiri : Semua nilai off
Right : All values on / Kanan : Semua nilai on
Left : All Cross / Kiri : Semua Cross
Right : All Cross Cardinal/ Kanan : Semua Cross Cardinal
Left : Random Usage / Kiri : Kegunaan Random
Right : Ideal Usage / Kanan : Kegunaan Ideal

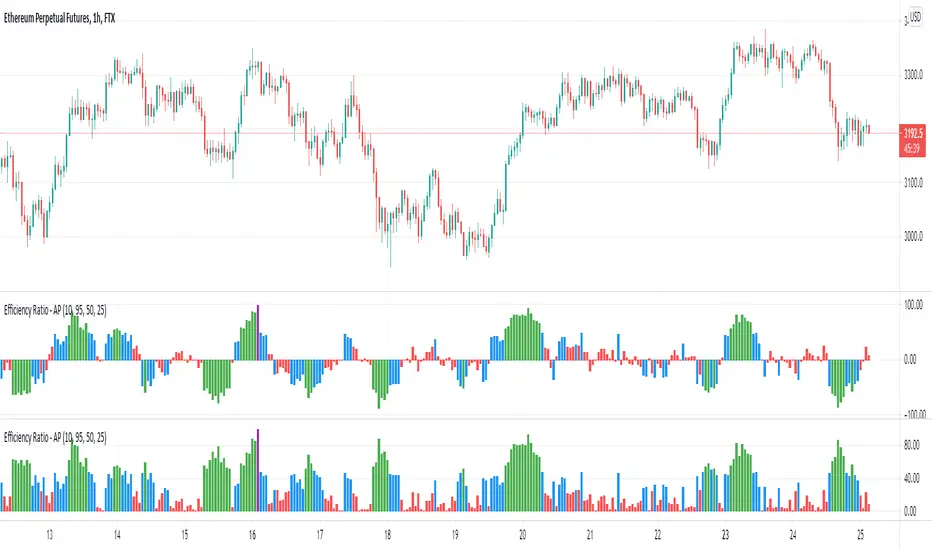
Efficiency Ratio (Market Noise) by Alejandro PThis is an indicator based on the Efficiency Ratio by Perry Kaufman. Like Price Density, which we have published previously, Perry Kaufman's Efficiency Ratio is a quantifiable method of measuring market noise.
This version of the indicator includes a feature to make the values of the indicator change based on thresholds to easier visualize different market conditions. Additionally there is a directional feature which factors in the direction of the price moves.
We can use the Efficiency Ratio to set rules and only trade particular systems when noise is at an appropriate level. For example, if noise is high then we would want to avoid trend following strategies and instead trade mean-reversion strategies, and vice-versa when the opposite is true.
The Efficiency Ratio can also be used to match assets to strategies. Some assets will be naturally more noisy than others and therefore we might have a principle where we only trade those noisy assets with our mean reversion strategies and the more quiet assets with trend following strategies.
Calculation:
Efficiency Ratio = Absolute net change in close price / absolute sum of the individual close price changes
The numerator looks at the absolute close change in price. It subtracts the starting close price in the period from the final close price in the period. The denominator compares the close price of one bar to the close price of the previous bar, this is performed for each of the successive bars in the whole period and then the value is summed. The absolute price is used because there are positive and negative values because each bar may close above or below the previous bar close.
The Efficiency Ratio provides an opposite interpretation of market noise compared to Price Density. With Price Density high values = high noise and low values = low noise. With the Efficiency Ratio high values = low noise and low values = high noise.
Comparing Price Density to Perry Kaufman's Efficiency Ratio:
Similarities
Both use the sum of the individual bar moves
- Price Density - High - Low
- Efficiency Ratio - Close to Close
Differences
Price Density uses the full price range (to determine the height of the box)
Efficiency Ratio uses the net close price change over the period
The interpretation of the values is the reverse for each
Full credits to the source of the above information and interpretation.
MYX Bursa IPO Listing Table (Source Code)This indicator intended for Malaysia Market only for Initial Public Offering (IPO) refer to Bursa Malaysia
Indikator ini adalah untuk pasaran Malaysia sahaja untuk Tawaran Awam Permulaan (IPO) rujuk kepada Bursa Malaysia
Indicator features :
1. List similar symbol or counter based on year including total.
2. Font size small for mobile app and font size normal for desktop.
Kemampuan indikator :
1. Senarai simbol atau kaunter yang terlibat mengiku tahun termasuk jumlah.
2. Saiz font kecil untuk mobile app dan saiz size normal untuk desktop.
FAQ
1. Code Usage / Penggunaan Kod
Free to use for personal usage but credits are most welcomed.
Not for business / commercial usage, any damage or lialibity are not my resposibility.
Bebas untuk kegunaan peribadi tetapi kredit adalah amat dialu-alukan.
Bukan untuk kegunaan perniagaan / komersil, sebarang kerosakan atau liability adalah di luar tanggungjawab saya.
2. Update Frequency / Frekuensi
Anytime after official update by Bursa Malaysia.
Bila-bila masa selepas kemaskini rasmi oleh Bursa Malaysia
3. Symbol/Counter not showing / Simbol/kaunter tiada
Symbol/counter not longer exist or not yet updated.
Simbol/kaunter telah tersenarai keluar atau belum dikemaskini.
4. Why table overlap with chart ? To avoid this, click indicator > Visual Order > Send to Front.
Kenapa table bertindih dengan carta ? Untuk mengatasi ini, klik indikator > Visual Order > Send to Front.
All Setting enabled.
Semua seting diaktifkan.
Small Font setting enabled, suitable for mobile app.
Setting font kecil diaktifkan., sesuai untuk mobile app.
Setting by year.
Setting mengikut tahun.

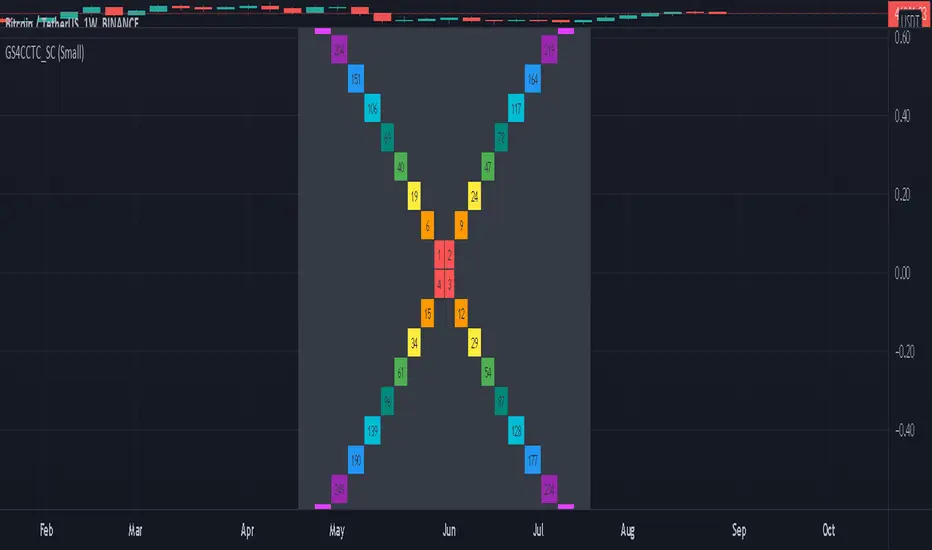
Pi Cycle bitcoin bottomFull credits go to the owner, but for reasons i cannot diclose.
Introduction
With the adoption of cryptographic assets reaching new heights, it is undeniably important to continuously expand and improve current indicators just like how these assets update with new lines of code over time.
Philip Swift’s Pi-Cycle Top Indicator has effectively signaled market and local tops to within 3 days, with the most recent occurrence being on May 12th 2021.
If it were possible to find the cycle/local top of each cycle, a similar analogy could be used to pinpoint the bottom of Bitcoin’s price.
These Pi-Cycle indicators are merely just two moving averages which, when divided by each other, are equal to the value of π.
π = Long MA / Short MA
350/111 = 3.153; as per the existing Bitcoin Pi-Cycle Top indicator.
Pi-Cycle Bottom for Bitcoin
At first, the existing “Pi moving average” pair (350/111) was realigned to see whether they cross at the bottom of the Bitcoin price.
They did not, only to be a lagging indicator in both 2015 and 2018 cycle bottoms.
A possible pair was discovered when the short MA was set to 150:
π = Long MA / 150
Long MA = π * 150
Long MA = 471 (rounded to the nearest whole number)
This resulted in a Pi MA pair of 471/150.
Using the multiple x0.745 of the 471-day SMA and the 150-day EMA (exponential average to take into account of short term volatility ), the price of Bitcoin bottoms at where they two moving averages cross:
When the 150-day EMA crossed below the 471 SMA *0.475, Bitcoin’s price had bottomed for the market cycle.
Over the last two market cycles, this indicator has been accurate to within 3 days also.

Price Volume Trend + Signal and HistogramThis is a script based on PVT + Signal Line, which can be EMA or SMA. It then plots a histogram which is equal to PVT - Signal. This makes it easier to spot divergences.
To better match up the scales, we decided to add a multiplication factor to the histogram. Each asset and even timeframe requires a different multiplication factor, so please experiment to find what suits you.
Credits and special thanks are listed on the source code.

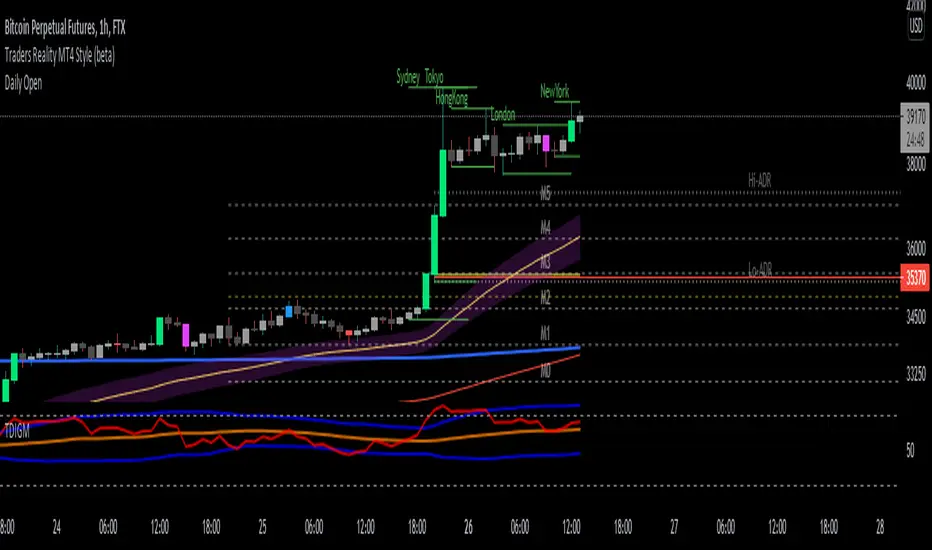
Daily Open Horizontal LineThis script draws a horizontal line that starts in the daily open (00:00 UTC)
Basically I did this since lots of times price come back down/up to the daily open and then bounces, meaning we can take trades based on this.
Hope you enjoy it.
PD: Took the code from infernix, all the credits to him, I know shit about coding.
Infernix TDV Profile: tradingview.com/u/infernixx
[Unxi]McClellan Summation Index for DAX 30 (GER30) [modified]About McClellan Summation Index
The McClellan Summation Index is a market breadth indicator which was developed by Sherman and Marian McClellan. It is based on the McClellan Oscillator and add its values together, effectively running a total. The index goes up when the McClellan Oscillator is positive and goes down when it is negative. Signals can be derived from the index crossing the middle line (bullish when it's crossing up and bearish when it's crossing down). Other potential signals include divergences and overbought and oversold conditions. The indicator is best used in combination with other analysis techniques.
About this implementation
This version here is a modification of the McClellan Summation Index.
It runs the simple version of the McClellan Oscillator and uses the simple method to calculate the Summation Index. No ratios are used in this implementation.
Further information:
- It can only be used on the DAX index ( DAX 30 or GER 30)
- It only considers the DAX 30 stocks
- The data window will provide a summary about rising and declining stocks
- The data window will output the last change for each of the 30 stocks
- The script is pretty slow because it has to calculate the change for each bar individually (instead of receiving a complete calculation from the stock exchange).
DISCLAIMER
This script was mainly written for educational purposes (training myself how to write custom indicatotors).
As you can see, the code is really messy.
FOR YOUR INFORMATION: This script will work on any time period. It is recommended to use it with timeperiod = 1d, though. Just use whatever timeperiod you are comfortable with, the indicator will automatically adjust accordingly.
Credits
Based on the simple version of aftabmk and of code from lazybear.

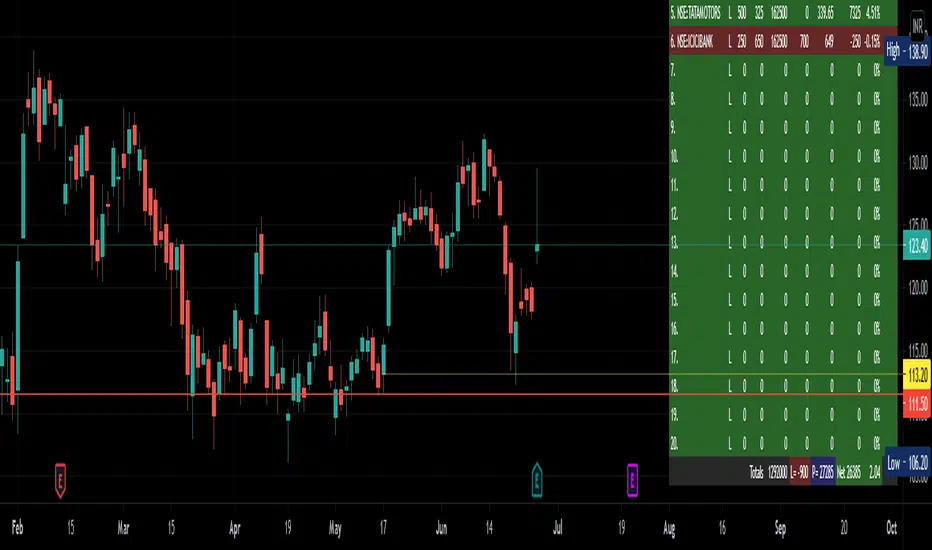
Tabular Portfolio by CJS V1This is a useful indicator that sits on top of the charts, in the right hand bottom corner and shows the current price, profit or loss in value and percent of upto 20 scrips fed in, in a Tabular form using tables feature.
Allows to mark a/c id also if you have multiple broker or individual accounts.
Colors are customisable.
Stocks get updated no matter what is your current selected scrip.
Gives total investment and total PnL also in percent.
Useful to monitor your portfolio status in once screen and while you are looking at charts.
Give feedback for improvement or issues, if any.
Credits to RedKTrader from where the idea was picked up.
Move visual order to front, if the charts and other indicators overlap the table view.
[jav] Mountain Oscillator
Introducing the Mountain Oscillator. Why not trading while admiring the scenery?
The main oscillator line is the black silhouette of the mountains, and each element of the landscape can be seen as a support or resistance - even the mountains far in the horizon, the misty band in the middle and the -1, 0 and 1 lines. (Well, almost every element... the sun is just for fun).
Equalling the heights of the mountains that are far away, or reaching the snow zone, are possible signs of an uptrend ending. On the other hand, stepping into a river is a clear sign of a reversal to the upside soon.
Strong uptrends are evidenced by significant portions of the mountain above the misty zone and/or the 0 line.
By default, the sky turns red/blue/dark gray depending on the trading hours. This option can be unchecked.
Calculations and usage :
The script is based on a modified version of Bollinger Bands. Bandwidth is calculated quite differently from the usual Bollinger indicator (not with the built-in stdev function). There is no need to input a multiplier factor, such as that used in BB - the script calculates it from 'Length' using a custom formula.
The 3 user inputs 'Length' ares recommended to be kept at 200, 100 and 50 period. In that way, the misty area in the landscape corresponds to price crossing EMAs of 50 and 100, and the zero line to EMA 200.
The different colors of the mountain and the horizon represent the Bollinger Bands corresponding to the mentioned periods of 50 and 100, whereas limits of -1 and +1 are those from the 'Length' parameter.
You will find that my coding skills are rudimentary, so any comment/suggestion to improve the script is welcome.
Credits
@everget for the 'Fancy Shapes' script which was used as a reference to draw the sun.

Visual Squeeze MomentumSqueeze Momentum from LazyBear now visible at the chart so you can check when the Squeeze its about to release. All credits for him.

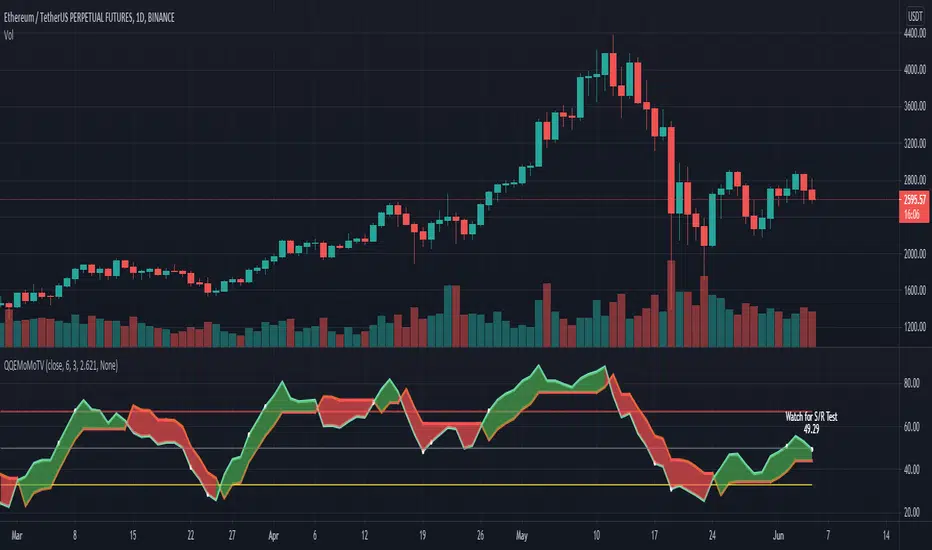
QQEMoMoTV█ OVERVIEW
This plots the QQE (Quantitive Qualitative Estimation)
with the addition of labels to show areas to watch out for and a colored cloud to show Green Upwards or Red Downwards Momentum
The QQE indicator is based on Wilder's RSI, which is based on a smoothed RSI comparing the change (delta Δ) between between bars
to compute the FastTL and SlowTL depending on the RSI Period, Slow Factor and QQE settings selected
As this works similarly to the RSI, it provides areas of overbought and oversold, and a cross at 50 for more bullish or more bearish
The FastTL and SlowTL crossovers works similarly to the crossover of a fast and slow moving average which can indicate bullish or bearish
When the SlowTL crosses above the FastTL a Green cloud indicating upwards momentum is drawn and vice versa when FastTL crosses above SlowTL
Bullish signals generated when Blue line crosses above Orange line, or Green MoMo cloud, Uptrend
Bearish signals generated when Orange line crosses above Blue line, or Red MoMo cloud, Downtrend
QQE Areas of interest:
Oversold: QQE < 33, Overbought: QQE > 67
Cross at 50: QQE crossing 50, this is an area that is between more bullish >50 and more bearish <50 zones
Note: as 50 is the switch between more bullish or more bearish zones , it is common to watch out for Support/Resistance Tests at this level
Tip: when QQE appears to be flat, this indicates a flat trend, this can commonly happen around the 50 zone when direction is relatively undecided, see the image below for an example
Very Overbought: QQE > 90, Careful! Watch out! QQE is showing very overbought and is generally a good area to take profit as others may sell soon too
QQE Fast settings: gives earlier signals, but also gives more shorter term signals
RSI_Period = 6, Slow_Factor = 3, QQE = 2.621
QQE Slow settings: gives more reliable signals, but sometimes a little late, best to use both fast and slow together for confirmation of the trend
RSI_Period = 20, Slow_Factor = 5, QQE = 4.236
You can add the QQEMoMoTV indicator to your chart twice and change one of them to the Fast settings and one of them to the Slow settings.
By comparing the QQEMoMoTV Fast and QQEMoMoTV Slow together you can get a better idea of the overall trend.
To best determine if this is a entry point or a trend reversal, it is recommended to use in conjunction with the MashumeHullTV indicator
█ FEATURES
Calculations
Calculates the change (delta Δ) between between bars based on Wilder's smoothed RSI to compute the FastTL (Orange) and SlowTL (Blue) lines
These are dependent on the QQE Fast settings or QQE Slow settings from the input RSI Period, Slow Factor and QQE selected
Labels are shown when QQE crosses areas of interest on the chart as Label text and shown with white dots on the QQEMoMoTV indicator
Inputs
You can use the script's inputs to configure:
• Calculation Source (default close)
• RSI Period (default 20)
• Slow Factor (default 5)
• QQE (default 4.236)
• Whether to show Green/Red MoMo Cloud
• Whether to show the QQE Label
• Style and Position of the QQELabel (default None)
None is selected as default to take up least space for optimal viewing when on Tradingview mobile, but you are free to change the style however you like
Alerts
Buy Signal alert based on rsi_ma crossing above FastAtrRsiTL, when Blue Line Cross above Orange Line, Green MoMo Cloud, Bullish
Sell Signal alert based on FastAtrRsiTL crossing above rsi_ma, when Orange Line Cross above Blue Line, Red MoMo Cloud, Bearish
█ CREDITS
Original Author: greyghost7
Feature upgrades and usage: Xiuying
Converted to Tradingview by: Machdragon
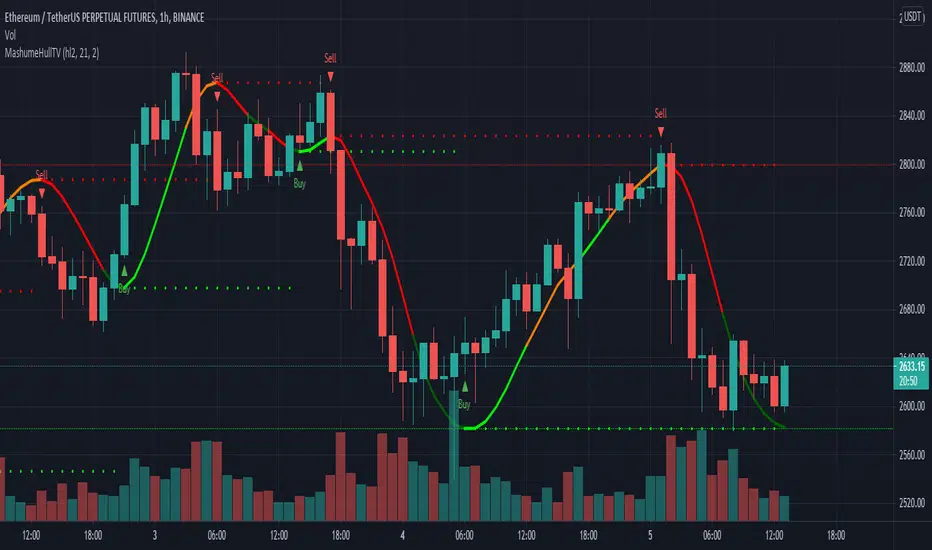
MashumeHullTV█ OVERVIEW
This plots the Hull Moving Average Turning Points and Concavity
with the addition of colored segments representing concavity and turning points: maxima, minima and inflection.
a fast way to determine the trend direction and possible reversals based on concavity of the trend
Dark Green: Concave Up but HMA decreasing. The 'mood' has changed and the declining trend of the HMA is slowing. Possible trend change to Uptrend soon
Light Green: Concave up and HMA increasing. Price is increasing, and since the curve is still concave up, it is accelerating upward. Uptrend
Orange: Concavity is now downward, and though price is still increasing, the rate has slowed, perhaps the mood has become less enthusiastic. Possible trend change to Downtrend soon
Red: Concave down and HMA decreasing. Downtrend
Buy signals generated when Hull turns from Dark Green -> Light Green
Sell signals generated when Hull turns from Orange -> Red
To best determine if this is a entry point or a trend reversal, it is recommended to use in conjunction with the QQEMoMoTV indicator
█ FEATURES
Calculations
Calculates the concavity of the Hull Moving Average comparing the Hull concavity of the current bar to the previous bar and displays the concavity in the form of 4 different colors.
Note: may cause repainting, so recommended to use with another indicator such as the QQEMoMoTV indicator to confirm signals.
Calculates divergence between the calculated HMA and the actual price and displays this in the Divergence Label.
Calculates the local minima, maxima and inflection points with the ability to display these as auto support/resistance lines.
Inputs
You can use the script's inputs to configure:
• Calculation Source (default HL2)
• HMA Length (default 21)
• Lookback (default 2)
• Whether to show Auto Support/Resist Lines
• Whether to show Buy/Sell Arrows
• Whether to show Divergence Label
• Whether to extend Local Auto Support/Resist Lines
Alerts
Buy Signal alert based on HMA crossing above MA_Min/Hull Support, when Hull turns from Dark Green -> Light Green, Bullish
Sell Signal alert based on HMA crossing below MA_Max/Hull Resistance, when Hull turns from Orange -> Red, Bearish
Experimental support for applying the indicator to higher time frames
eg. charting the hourly MashumeHull indicator on 15 min chart. See the commented code to access this feature
█ CREDITS
Original Author: Seth Urion (Mashume)
Feature upgrades and usage: Xiuying
Converted to Tradingview by: Machdragon
[jav] HeikinAshized OscillatorsThis script allows to HeikinAshize different commonly used centered oscillators.
It plots them like Heikin Ashi candles. In this way, we can eliminate some of the noise and uncertainty that is inherent to applying only one calculation period to the oscillators.
Applying Heikin Ashi to an oscillator might be advantageous compared to applying it directly to the chart, because you are not altering price readings. The obvious advantage is the clear visualization of the trend directions without noise.
INPUTS
The oscillators included are:
Relative Strength Index (RSI)
Stochastic
Stochastic RSI
Fisher transform
Inverse Fisher Transform of RSI (IFTRSI)
Commodity Channel Index (CCI)
Money Flow Index (MFI)
Chande Momentum Oscillator (CMO)
Momentum (MOM)
True Strength Index (TSI)
Williams' Percent Range (WPR).
Apart from the choice of one of these indicators, only two more inputs are required:
the main (median) period and
the % of variability of this period.
RESULTS
The script calculates 4 evenly spaced periods from that data (period and variability), e.g. for a period of 50 and a variability of 30%, the script calculates oscillator values for 4 different periods evenly spaced around 50, (35, 45, 55, 65) and uses these 4 values to draw the Heikin Ashi candle.
The script also plots the usual upper/lower (overbought/oversold) values, as well as the central line.
CREDITS
The interesting concept of applying Heikin Ashi to an oscillator was recently introduced in Tradingview by @JayRogers . Many thanks for the idea.
For Heikin Ashi calculations, the useful script by @allanster was taken as a reference.
Any improvements, modifications or suggestions are welcome.

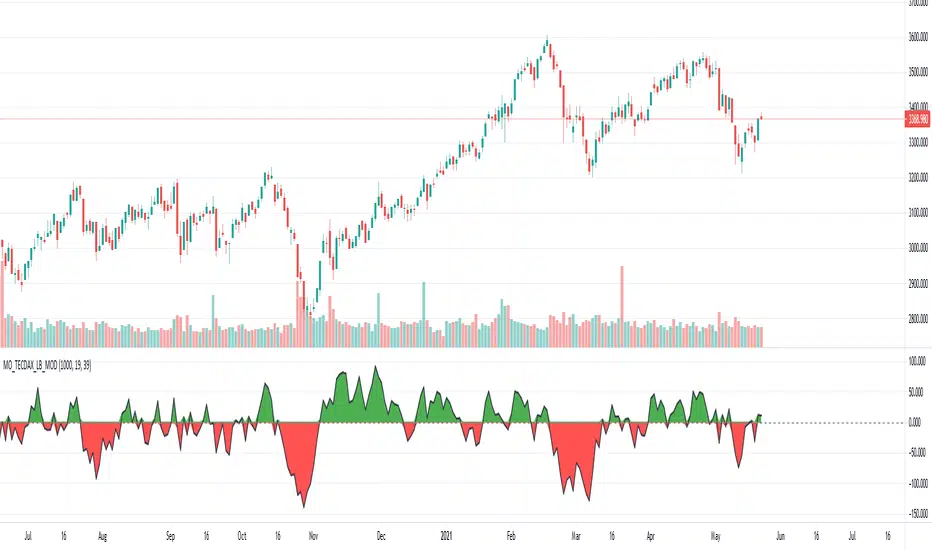
[Unxi]McClellan Oscillator for TECDAX [modified]This version is for use with the German TecDax index only!
About McClellan Oscillator
Developed by Sherman and Marian McClellan, the McClellan Oscillator is a breadth indicator derived from Net Advances, the number of advancing issues less the number of declining issues. Subtracting the 39-day exponential moving average of Net Advances from the 19-day exponential moving average of Net Advances forms the oscillator.
As the formula reveals, the McClellan Oscillator is a momentum indicator that works similar to MACD .
McClellan Oscillator signals can be generated with breadth thrusts, centerline crossovers, overall levels and divergences.
About my version
This version here is a modification, though:
- It can only be used on the German TECDAX index
- It only considers the TECDAX stocks
- The data window will provide a summary about rising and declining stocks
- The data window will output the last change for each of the 30 stocks
The script is pretty slow because it has to calculate the change for each bar individually (instead of receiving a complete calculation from the stock exchange).
This script will work on any time period. Just use whatever timeperiod you are comfortable with, the indicator will automatically adjust accordingly. It is recommended to use it with timeperiod = 1d, though.
DISCLAIMER
This script was mainly written for educational purposes (training myself how to write custom indicatotors).
As you can see, the code is really messy. Feel free to provide your feedback in the comments!
Credits
Based on the simple version of aftabmk
You can find the original version by searching for McClellan Oscillator for nifty 50.
Also got some inspiration from lazybear's version and from danarn's "Crypto McClellan Oscillator".
McClellan Oscillator for DAX (GER30) [aftabmk modified]About McClellan Oscillator
Developed by Sherman and Marian McClellan, the McClellan Oscillator is a breadth indicator derived from Net Advances, the number of advancing issues less the number of declining issues. Subtracting the 39-day exponential moving average of Net Advances from the 19-day exponential moving average of Net Advances forms the oscillator.
As the formula reveals, the McClellan Oscillator is a momentum indicator that works similar to MACD .
McClellan Oscillator signals can be generated with breadth thrusts, centerline crossovers, overall levels and divergences.
About my version
This version here is a modification, though:
- It can only be used on the DAX index (DAX 30 or GER 30)
- It only considers the DAX 30 stocks
- The data window will provide a summary about rising and declining stocks
- The data window will output the last change for each of the 30 stocks
BUG
I am only publishing this version because I am not sure if my current version is saved when I leave tradingview.com without publishing the script.
This version still contains a bug - the if/else clauses do not correctly recognize declining stocks. So the oscillator should not be used as it is.
Working on it these days. Feel free to provide feedback!
Stuff I am working on
- Coloring the area green/red according to the value
- Fixing this bug/making this script more efficient
DISCLAIMER
This script was mainly written for educational purposes (training myself how to write custom indicatotors).
As you can see, the code is really messy.
Credits
Based on the simple version of aftabmk
You can find the original version by searching for McClellan Oscillator for nifty 50.

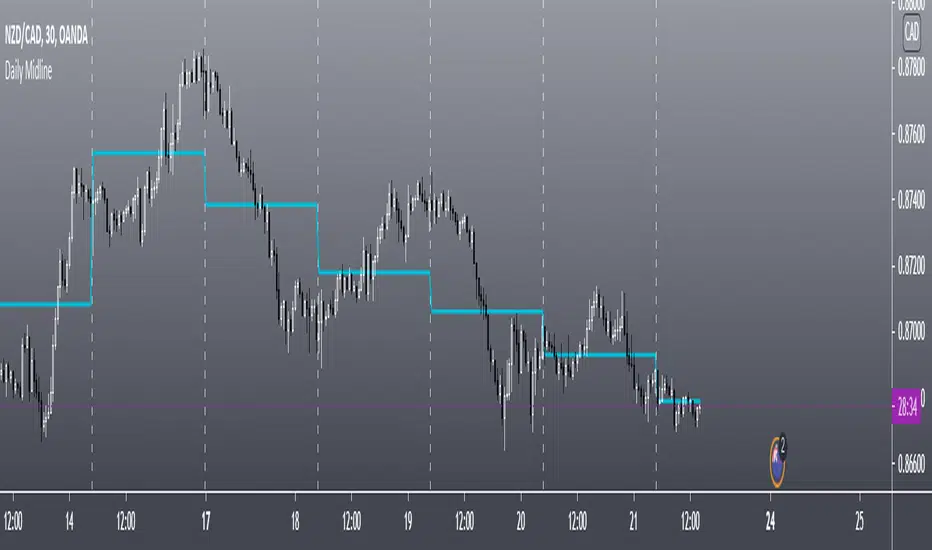
Daily MidlineThis Scripts Shows Daily Midline Levels From Yesterday High/lows.
Credits to rodrigo.aprieto and NorthstarDaytrading
for combined script idea.
ATR TRex Candle Classification(By MiladF)All credits goes to dear Mr.Khakestar and Trigger Price Action ( TRex ).
