Percent Trend Change [BigBeluga]The Percent Trend Change indicator is a trend-following tool that provides real-time percentage changes during trends based on entry prices. Using John Ehlers’ Ultimate Smoother filter, it detects trend direction, identifies uptrends and downtrends, and tracks percentage changes during the trend. Additionally, it has a channel that can be toggled on or off, and the width can be customized, adding an extra visual layer to assess trend strength and direction.
NIFTY50:
META:
🔵 IDEA
The Percent Trend Change indicator helps traders visualize the progression of a trend with percentage changes from entry points. It identifies trends and marks percentage changes during the trend, making it easier to assess the strength and sustainability of the ongoing trend.
The use of John Ehlers' Ultimate Smoother filter helps detect trend changes based on consecutive price movements over five bars, making it highly responsive to short- and medium-term trends.
🔵 KEY FEATURES & USAGE
◉ Ultimate Smoother Filter for Trend Detection:
The trend is detected using the Ultimate Smoother filter. If the smoothed line rises five times in a row, the indicator identifies an uptrend. If it falls five times in a row, it identifies a downtrend.
◉ Trend Entry with Price Labels:
The indicator marks trend entry points with up (green) and down (red) triangles. These triangles are labeled with the entry price, allowing traders to track the starting price of the trend.
◉ Percentage Change Labels During Trends:
During a trend, the indicator periodically plots percentage change labels based on the bar period set in the settings.
In an uptrend, positive changes are marked in green, while negative changes are marked in orange. In a downtrend, negative changes are marked in red, while positive changes are marked in orange.
Each plotted percentage label also includes a count of the trend points, allowing traders to track how many times the percentage labels have been plotted during the current trend.
These percentage labels help traders understand how much the price has changed since the trend began and can be used to define potential take-profit targets.
◉ Channel Toggle and Width Customization:
The indicator includes a channel that visually highlights the trend. Traders can toggle this channel on or off, and the width of the channel can be adjusted to match individual preferences. The channel helps visualize the overall trend direction and the range within which price fluctuations occur.
🔵 CUSTOMIZATION
Smoother Length: Adjusts the length of the Ultimate Smoother filter, affecting how responsive the indicator is to price fluctuations.
Bars Percent: Defines how many bars must pass before a new percentage label is plotted. A smaller value plots labels more frequently, while a higher value shows fewer labels.
Channel Width & Show Channel: The width of the channel can be customized, and traders can toggle the channel on or off depending on their preferences.
Color Customization: Traders can customize the colors for the uptrend, downtrend, and percentage labels, providing flexibility in how the indicator is displayed on the chart.
By combining trend-following capabilities with percentage change tracking, the Percent Trend Change indicator offers a powerful tool for identifying trend direction and setting potential take-profit targets. The ability to customize the channel and percentage labels makes it adaptable to various trading strategies.
Pesquisar nos scripts por "META股票怎么样"

[GTH decimals heatmap] (wide screen advised)Preface
I share my personal general view on indicators below; skip ahead to the Description below if you are not interested.
It is my personal conviction that most - if not all - indicators rely mainly on trader's belief that they work, and in a feedback system like free markets they might become a self-fulfilling prophecy as a result, if (!) a big part of the traders believes in it, because some famous trader releases an indicator, or such person's public statement goes viral.
One of those voodoo indicators is the famous "follow-through day". There is zero statistical evidence for its validity, beyond the validity of a statement like "If it's bright at day it's usually the sun shining". The uselessness was proven exactly on its inventor's YT channel, Investors Business Daily. According to the examiner, its inventor William J. O'Neil himself could not explain the values used for this indicator. It might have been an incidental observation at some point without general validity. A.k.a "curve fitting". Still, it's being used by many today.
Another one of those indicators is the three points reversal on the S&P 500 Volatility Index (VIX) which allegedly might potentially maybe indicate a possible shift in trend. Both indicators share an immediately problematic feature: They use absolute values. Nothing is ever absolute in a highly subjective and emotionally driven game like the markets where a lot of money can be made and lost.
Most indicators can not produce additional information since they can only re-pack price/volume action. Many times an interpretion of the distance between price and a moving average and/or the slope of a moving average deliver very similar - if not better - results than MACD, RSI etc., especially with standard settings, the origin of which are usually unknown (always a warning sign). Very few indicators can deliver information which is otherwise hard to quantify, e. g. market noise (Kaufman's Efficiency Ratio or Price Density) or volatility, standard deviation etc.
It is common knowledge that trading the markets is a game of probability. No indicator works all the time (or at all, see above). In order to make decisions based on any indicator, the probability for its validity and the conditions under which validity seemed to have occurred, must be known. Otherwise it is just coffee grounds reading under the illusion of adding to the edge, when in fact it is only adding to the trees, making it even harder to see the forest.
Description
A common belief is that whole or half-dollar prices tend to be attraction points in price action, so a number of traders include those into decision making. But are they really...?
Spoiler Alert:
Generally, it is safe to say that for the big majority of stocks there is very thin evidence for it. It depends vastly on the asset, the timeframe used and the market period (pre/post/main trading times). If at all, there seems to be an above random but still thin evidence for whole prices being significant attraction points. Interesting/surprising patterns are visible on many stocks/timeframes/session periods, though.
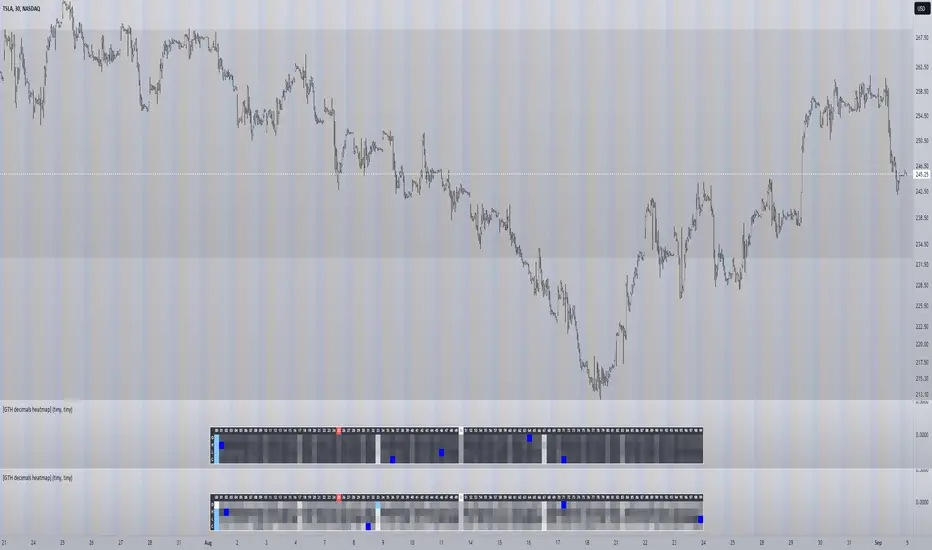
The screenshot shows TSLA, 30m timeframe, two heatmaps added. The top one shows pre/post-market data only, the bottom one main market data only. The cyan fields indicate the strongest occurrence, the dark blue fields indicate the weakest occurrence of open/high/low/close prices at the respective decimal. The red field indicates the current/last price decimal.
Clearly, TSLA displays a strong pre-market attraction for .00, followed by .33 and .67 and .50. This pattern of thirds seems to be a unique feature of TSLA. In the main trading session it is being diluted by a more random distribution.
Other interesting equities to examine:
SPY: No significant pattern on any timeframe!
META: Generally weak patterns on all timeframes, but interestingly on the 1D there is evidence for less randomness on O and H, more on L and most on C.
AAPL: 1D, foggy attraction areas around .35 and .12. Whole price is no attraction area at all! Very weak attraction around .73.
AMD: Strong pattern on D, W, M, attraction areas around 1/16th intervals. No patterns on lower timeframes.
AMZN: Significant differences between pre/post and main session. Strong 1/16th pattern below D in pre/post.
TAOP: Strong 1/5th pattern on all timeframes.
Read the tool tips and go explore!
Pineconnector Strategy Template (Connect Any Indicator)Hello traders,
If you're tired of manual trading and looking for a solid strategy template to pair with your indicators, look no further.
This Pine Script v5 strategy template is engineered for maximum customization and risk management.
Best part?
It’s optimized for Pineconnector, allowing seamless integration with MetaTrader 4 and 5.
This powerful tool gives a lot of power to those who don't know how to code in Pinescript and are looking to automate their indicators' signals on Metatrader 4/5.
IMPORTANT NOTES
Pineconnector is a trading bot software that forwards TradingView alerts to your Metatrader 4/5 for automating trading.
Many traders don't know how to dynamically create Pineconnector-compatible alerts using the data from their TradingView scripts.
Traders using trading bots want their alerts to reflect the stop-loss/take-profit/trailing-stop/stop-loss to break options from your script and then create the orders accordingly.
This script showcases how to create Pineconnector alerts dynamically.
Pineconnector doesn't support alerts with multiple Take Profits.
As a workaround, for 2 TPs, I had to open two trades.
It's not optimal, as we end up paying more spreads for that extra trade - however, depending on your trading strategy, it may not be a big deal.
TRADINGVIEW ALERTS
1) You'll have to create one alert per asset X timeframe = 1 chart.
Example: 1 alert for EUR/USD on the 5 minutes chart, 1 alert for EUR/USD on the 15-minute chart (assuming you want your bot to trade the EUR/USD on the 5 and 15-minute timeframes)
2) Select the Order fills and alert() function calls condition
3) For each alert, the alert message is pre-configured with the text below
{{strategy.order.alert_message}}
Please leave it as it is.
It's a TradingView native variable that will fetch the alert text messages built by the script.
4) Don't forget to set the Pineconnector webhook URL in the Notifications tab of the TradingView alerts UI.
You’ll find the URL on the Pineconnector documentation website.
EA CONFIGURATION
1) The Pyramiding in the EA on Metatrader must be set to 2 if you want to trade with 2 TPs => as it's opening 2 trades.
If you only want 1 TP, set the EA Pyramiding to 1.
Regarding the other EA settings, please refer to the Pineconnector documentation on their website.
2) In the EA, you can set a risk (= position size type) in %/lots/USD, as in the TradingView backtest settings.
KEY FEATURES
I) Modular Indicator Connection
* plug in your existing indicator into the template.
* Only two lines of code are needed for full compatibility.
Step 1: Create your connector
Adapt your indicator with only 2 lines of code and then connect it to this strategy template.
To do so:
1) Find in your indicator where the conditions print the long/buy and short/sell signals.
2) Create an additional plot as below
I'm giving an example with a Two moving averages cross.
Please replicate the same methodology for your indicator, whether it's a MACD , ZigZag , Pivots , higher-highs, lower-lows, or whatever indicator with clear buy and sell conditions.
//@version=5
indicator("Supertrend", overlay = true, timeframe = "", timeframe_gaps = true)
atrPeriod = input.int(10, "ATR Length", minval = 1)
factor = input.float(3.0, "Factor", minval = 0.01, step = 0.01)
= ta.supertrend(factor, atrPeriod)
supertrend := barstate.isfirst ? na : supertrend
bodyMiddle = plot(barstate.isfirst ? na : (open + close) / 2, display = display.none)
upTrend = plot(direction < 0 ? supertrend : na, "Up Trend", color = color.green, style = plot.style_linebr)
downTrend = plot(direction < 0 ? na : supertrend, "Down Trend", color = color.red, style = plot.style_linebr)
fill(bodyMiddle, upTrend, color.new(color.green, 90), fillgaps = false)
fill(bodyMiddle, downTrend, color.new(color.red, 90), fillgaps = false)
buy = ta.crossunder(direction, 0)
sell = ta.crossunder(direction, 0)
//////// CONNECTOR SECTION ////////
Signal = buy ? 1 : sell ? -1 : 0
plot(Signal, title = "Signal", display = display.data_window)
//////// CONNECTOR SECTION ////////
Important Notes
🔥 The Strategy Template expects the value to be exactly 1 for the bullish signal and -1 for the bearish signal
Now, you can connect your indicator to the Strategy Template using the method below or that one.
Step 2: Connect the connector
1) Add your updated indicator to a TradingView chart
2) Add the Strategy Template as well to the SAME chart
3) Open the Strategy Template settings, and in the Data Source field, select your 🔌Connector🔌 (which comes from your indicator)
Note it doesn’t have to be named 🔌Connector🔌 - you can name it as you want - however, I recommend an explicit name you can easily remember.
From then, you should start seeing the signals and plenty of other stuff on your chart.
🔥 Note that whenever you update your indicator values, the strategy statistics and visuals on your chart will update in real-time
II) Customizable Risk Management
- Choose between percentage or USD modes for maximum drawdown.
- Set max consecutive losing days and max losing streak length.
- I used the code from my friend @JosKodify for the maximum losing streak. :)
Will halt the EA and backtest orders fill whenever either of the safeguards above are “broken”
III) Intraday Risk Management
- Limit the maximum intraday losses both in percentage or USD.
- Option to set a maximum number of intraday trades.
- If your EA gets halted on an intraday chart, auto-restart it the next day.
IV) Spread and Account Filters
- Trade only if the spread is below a certain pip value.
- Set requirements based on account balance or equity.
V) Order Types and Position Sizing
- Choose between market, limit, or stop orders.
- Set your position size directly in the template.
Please use the position size from the “Inputs” and not the “Properties” tab.
Reason : The template sends the order on the same candle as the entry signals - at those entry signals candles, the position size isn’t computed yet, and the template can’t then send it to Pineconnector.
However, you can use the position size type (USD, contracts, %) from the “Properties” tab for backtesting.
In the EA, you can define the position size type for your orders in USD or lots or %.
VI) Advanced Take-Profit and Stop-Loss Options
- Choose to set your SL/TP in either pips or percentages.
- Option for multiple take-profit levels and trailing stop losses.
- Move your stop loss to break even +/- offset in pips for “risk-free” trades.
VII) Logger
The Pineconnector commands are logged in the TradingView logger.
You'll find more information about it in this TradingView blog post .
WHY YOU MIGHT NEED THIS TEMPLATE
1) Transform your indicator into a Pineconnector trading bot more easily than before
Connect your indicator to the template
Create your alerts
Set your EA settings
2) Save Time
Auto-generated alert messages for Pineconnector.
I tested them all, and I checked with the support team what could/can’t be done
3) Be in Control
Manage your trading risks with advanced features.
4) Customizable
Fits various trading styles and asset classes.
REQUIREMENTS
* Make sure you have your Pineconnector license ID.
* Create your alerts with the Pineconnector webhook URL
* If there is any issue with the template, ask me in the comments section - I’ll answer quickly.
BACKTEST RESULTS FROM THIS POST
1) I connected this strategy template to a dummy Supertrend script.
I could have selected any other indicator or concept for this script post.
I wanted to share an example of how you can quickly upgrade your strategy, making it compatible with Pineconnector.
2) The backtest results aren't relevant for this educational script publication.
I used realistic backtesting data but didn't look too much into optimizing the results, as this isn't the point of why I'm publishing this script.
This strategy is a template to be connected to any indicator - the sky is the limit. :)
3) This template is made to take 1 trade per direction at any given time.
Pyramiding is set to 1 on TradingView.
The strategy default settings are:
* Initial Capital: 100000 USD
* Position Size: 1 contract
* Commission Percent: 0.075%
* Slippage: 1 tick
* No margin/leverage used
WHAT’S COMING NEXT FOR YOU GUYS?
I’ll make the same template for ProfitView, then for AutoView, and then for Alertatron.
All of those are free and open-source.
I have no affiliations with any of those companies - I'm publishing those templates as they will be useful to many of you.
Dave

myAlertsLibrary "myAlerts"
My Alerts Functions - To use with autoview
f_order(_price, _qty, _position, _account, _exchange, _i, i_qtyTypeOrder, typeMsg, syminfoticker)
- Write the entry order message
Parameters:
_price : - The order price
_qty : - The order quantity
_position : - The order side
_account : - The user account
_exchange : - The user exchange
_i : - Used for multi-accounts, this represents the index of accounts
i_qtyTypeOrder : - String used to set Thether or Bitcoin Type Orders
typeMsg : - True = Autoview; False = Metatrader
syminfoticker : - Ticker
Returns: - Returns the open order message
f_stop(_stop_price, _slLimit_price, _account, _exchange, _i, i_delayOrders, typeMsg, syminfoticker)
- Write the stop order message
Parameters:
_stop_price : - The order stop price
_slLimit_price : - The order stop limit price
_account : - The user account
_exchange : - The user exchange
_i : - Used for multi-accounts, this represents the index of accounts
i_delayOrders : - Time in seconds to delay command on autoview
typeMsg : - True = Autoview; False = Metatrader
syminfoticker : - Ticker
Returns: - Returns the open order message
f_take(_take_price, _account, _exchange, _i, i_delayOrders, typeMsg, syminfoticker)
- Write the stop order message
Parameters:
_take_price : - The order stop price
_account : - The user account
_exchange : - The user exchange
_i : - Used for multi-accounts, this represents the index of accounts
i_delayOrders : - Time in seconds to delay command on autoview
typeMsg : - True = Autoview; False = Metatrader
syminfoticker : - Ticker
Returns: - Returns the open order message
f_update(_account, _exchange, _i, i_delayOrders, typeMsg, syminfoticker)
- Write the update order message
Parameters:
_account : - The user account
_exchange : - The user exchange
_i : - Used for multi-accounts, this represents the index of accounts
i_delayOrders : - Time in seconds to delay command on autoview
typeMsg : - True = Autoview; False = Metatrader
syminfoticker : - Ticker
Returns: - Returns the open order message
f_exit(_account, _exchange, _i, i_delayOrders, typeMsg, syminfoticker)
- Write the exit order message
Parameters:
_account : - The user account
_exchange : - The user exchange
_i : - Used for multi-accounts, this represents the index of accounts
i_delayOrders : - Time in seconds to delay command on autoview
typeMsg : - True = Autoview; False = Metatrader
syminfoticker : - Ticker
Returns: - Returns the open order message
f_hedge(_account, _exchange, _i, i_delayOrders, typeMsg, syminfoticker)
- Write the exit order message
Parameters:
_account : - The user account
_exchange : - The user exchange
_i : - Used for multi-accounts, this represents the index of accounts
i_delayOrders : - Time in seconds to delay command on autoview
typeMsg : - True = Autoview; False = Metatrader
syminfoticker : - Ticker
Returns: - Returns the open order message
The Investment ClockThe Investment Clock was most likely introduced to the general public in a research paper distributed by Merrill Lynch. It’s a simple yet useful framework for understanding the various stages of the US economic cycle and which asset classes perform best in each stage.
The Investment Clock splits the business cycle into four phases, where each phase is comprised of the orientation of growth and inflation relative to their sustainable levels:
Reflation phase (6:01 to 8:59): Growth is sluggish and inflation is low. This phase occurs during the heart of a bear market. The economy is plagued by excess capacity and falling demand. This keeps commodity prices low and pulls down inflation. The yield curve steepens as the central bank lowers short-term rates in an attempt to stimulate growth and inflation. Bonds are the best asset class in this phase.
Recovery phase (9:01 to 11:59): The central bank’s easing takes effect and begins driving growth to above the trend rate. Though growth picks up, inflation remains low because there’s still excess capacity. Rising growth and low inflation are the Goldilocks phase of every cycle. Stocks are the best asset class in this phase.
Overheat phase(12:01 to 2:59): Productivity growth slows and the GDP gap closes causing the economy to bump up against supply constraints. This causes inflation to rise. Rising inflation spurs the central banks to hike rates. As a result, the yield curve begins flattening. With high growth and high inflation, stocks still perform but not as well as in recovery. Volatility returns as bond yields rise and stocks compete with higher yields for capital flows. In this phase, commodities are the best asset class.
Stagflation phase (3:01 to 5:59): GDP growth slows but inflation remains high (sidenote: most bear markets are preceded by a 100%+ increase in the price of oil which drives inflation up and causes central banks to tighten). Productivity dives and a wage-price spiral develops as companies raise prices to protect compressing margins. This goes on until there’s a steep rise in unemployment which breaks the cycle. Central banks keep rates high until they reign in inflation. This causes the yield curve to invert. During this phase, cash is the best asset.
Additional notes from Merrill Lynch:
Cyclicality: When growth is accelerating (12 o'clock), Stocks and Commodities do well. Cyclical sectors like Tech or Steel outperform. When growth is slowing (6 o'clock), Bonds, Cash, and defensives outperform.
Duration: When inflation is falling (9 o'clock), discount rates drop and financial assets do well. Investors pay up for long duration Growth stocks. When inflation is rising (3 o'clock), real assets like Commodities and Cash do best. Pricing power is plentiful and short-duration Value stocks outperform.
Interest Rate-Sensitives: Banks and Consumer Discretionary stocks are interest-rate sensitive “early cycle” performers, doing best in Reflation and Recovery when central banks are easing and growth is starting to recover.
Asset Plays: Some sectors are linked to the performance of an underlying asset. Insurance stocks and Investment Banks are often bond or equity price sensitive, doing well in the Reflation or Recovery phases. Mining stocks are metal price-sensitive, doing well during an Overheat.
About the indicator:
This indicator suggests iShares ETFs for sector rotation analysis. There are likely other ETFs to consider which have lower fees and are outperforming their sector peers.
You may get errors if your chart is set to a different timeframe & ticker other than 1d for symbol/tickers GDPC1 or CPILFESL.
Investment Clock settings are based on a "sustainable level" of growth and inflation, which are each slightly subjective depending on the economist and probably have changed since the last time this indicator was updated. Hence, the sustainable levels are customizable in the settings. When I was formally educated I was trained to use average CPI of 3.1% for financial planning purposes, the default for the indicator is 2.5%, and the Medium article backtested and optimized a 2% sustainable inflation rate. Again, user-defined sustainable growth and rates are slightly subjective and will affect results.
I have not been trained or even had much experience with MetaTrader code, which is how this indicator was originally coded. See the original Medium article that inspired this indicator if you want to audit & compare code.
Hover over info panel for detailed information.
Features: Advanced info panel that performs Investment Clock analysis and offers additional hover info such as sector rotation suggestions. Customizable sustainable levels, growth input, and inflation input. Phase background coloring.
⚠ DISCLAIMER: Not financial advice. Not a trading system. DYOR. I am not affiliated with Medium, Macro Ops, iShares, or Merrill Lynch.
About the Author: I am a patent-holding inventor, a futures trader, a hobby PineScripter, and a former FINRA Registered Representative.

Volatility Risk Premium GOLD & SILVER 1.0ENGLISH
This indicator (V-R-P) calculates the (one month) Volatility Risk Premium for GOLD and SILVER.
V-R-P is the premium hedgers pay for over Realized Volatility for GOLD and SILVER options.
The premium stems from hedgers paying to insure their portfolios, and manifests itself in the differential between the price at which options are sold (Implied Volatility) and the volatility GOLD and SILVER ultimately realize (Realized Volatility).
I am using 30-day Implied Volatility (IV) and 21-day Realized Volatility (HV) as the basis for my calculation, as one month of IV is based on 30 calendaristic days and one month of HV is based on 21 trading days.
At first, the indicator appears blank and a label instructs you to choose which index you want the V-R-P to plot on the chart. Use the indicator settings (the sprocket) to choose one of the precious metals (or both).
Together with the V-R-P line, the indicator will show its one year moving average within a range of +/- 15% (which you can change) for benchmarking purposes. We should consider this range the “normalized” V-R-P for the actual period.
The Zero Line is also marked on the indicator.
Interpretation
When V-R-P is within the “normalized” range, … well... volatility and uncertainty, as it’s seen by the option market, is “normal”. We have a “premium” of volatility which should be considered normal.
When V-R-P is above the “normalized” range, the volatility premium is high. This means that investors are willing to pay more for options because they see an increasing uncertainty in markets.
When V-R-P is below the “normalized” range but positive (above the Zero line), the premium investors are willing to pay for risk is low, meaning they see decreasing uncertainty and risks in the market, but not by much.
When V-R-P is negative (below the Zero line), we have COMPLACENCY. This means investors see upcoming risk as being lower than what happened in the market in the recent past (within the last 30 days).
CONCEPTS :
Volatility Risk Premium
The volatility risk premium (V-R-P) is the notion that implied volatility (IV) tends to be higher than realized volatility (HV) as market participants tend to overestimate the likelihood of a significant market crash.
This overestimation may account for an increase in demand for options as protection against an equity portfolio. Basically, this heightened perception of risk may lead to a higher willingness to pay for these options to hedge a portfolio.
In other words, investors are willing to pay a premium for options to have protection against significant market crashes even if statistically the probability of these crashes is lesser or even negligible.
Therefore, the tendency of implied volatility is to be higher than realized volatility, thus V-R-P being positive.
Realized/Historical Volatility
Historical Volatility (HV) is the statistical measure of the dispersion of returns for an index over a given period of time.
Historical volatility is a well-known concept in finance, but there is confusion in how exactly it is calculated. Different sources may use slightly different historical volatility formulas.
For calculating Historical Volatility I am using the most common approach: annualized standard deviation of logarithmic returns, based on daily closing prices.
Implied Volatility
Implied Volatility (IV) is the market's forecast of a likely movement in the price of the index and it is expressed annualized, using percentages and standard deviations over a specified time horizon (usually 30 days).
IV is used to price options contracts where high implied volatility results in options with higher premiums and vice versa. Also, options supply and demand and time value are major determining factors for calculating Implied Volatility.
Implied Volatility usually increases in bearish markets and decreases when the market is bullish.
For determining GOLD and SILVER implied volatility I used their volatility indices: GVZ and VXSLV (30-day IV) provided by CBOE.
Warning
Please be aware that because CBOE doesn’t provide real-time data in Tradingview, my V-R-P calculation is also delayed, so you shouldn’t use it in the first 15 minutes after the opening.
This indicator is calibrated for a daily time frame.
----------------------------------------------------------------------
ESPAŇOL
Este indicador (V-R-P) calcula la Prima de Riesgo de Volatilidad (de un mes) para GOLD y SILVER.
V-R-P es la prima que pagan los hedgers sobre la Volatilidad Realizada para las opciones de GOLD y SILVER.
La prima proviene de los hedgers que pagan para asegurar sus carteras y se manifiesta en el diferencial entre el precio al que se venden las opciones (Volatilidad Implícita) y la volatilidad que finalmente se realiza en el ORO y la PLATA (Volatilidad Realizada).
Estoy utilizando la Volatilidad Implícita (IV) de 30 días y la Volatilidad Realizada (HV) de 21 días como base para mi cálculo, ya que un mes de IV se basa en 30 días calendario y un mes de HV se basa en 21 días de negociación.
Al principio, el indicador aparece en blanco y una etiqueta le indica que elija qué índice desea que el V-R-P represente en el gráfico. Use la configuración del indicador (la rueda dentada) para elegir uno de los metales preciosos (o ambos).
Junto con la línea V-R-P, el indicador mostrará su promedio móvil de un año dentro de un rango de +/- 15% (que puede cambiar) con fines de evaluación comparativa. Deberíamos considerar este rango como el V-R-P "normalizado" para el período real.
La línea Cero también está marcada en el indicador.
Interpretación
Cuando el V-R-P está dentro del rango "normalizado",... bueno... la volatilidad y la incertidumbre, como las ve el mercado de opciones, es "normal". Tenemos una “prima” de volatilidad que debería considerarse normal.
Cuando V-R-P está por encima del rango "normalizado", la prima de volatilidad es alta. Esto significa que los inversores están dispuestos a pagar más por las opciones porque ven una creciente incertidumbre en los mercados.
Cuando el V-R-P está por debajo del rango "normalizado" pero es positivo (por encima de la línea Cero), la prima que los inversores están dispuestos a pagar por el riesgo es baja, lo que significa que ven una disminución, pero no pronunciada, de la incertidumbre y los riesgos en el mercado.
Cuando V-R-P es negativo (por debajo de la línea Cero), tenemos COMPLACENCIA. Esto significa que los inversores ven el riesgo próximo como menor que lo que sucedió en el mercado en el pasado reciente (en los últimos 30 días).
CONCEPTOS :
Prima de Riesgo de Volatilidad
La Prima de Riesgo de Volatilidad (V-R-P) es la noción de que la Volatilidad Implícita (IV) tiende a ser más alta que la Volatilidad Realizada (HV) ya que los participantes del mercado tienden a sobrestimar la probabilidad de una caída significativa del mercado.
Esta sobreestimación puede explicar un aumento en la demanda de opciones como protección contra una cartera de acciones. Básicamente, esta mayor percepción de riesgo puede conducir a una mayor disposición a pagar por estas opciones para cubrir una cartera.
En otras palabras, los inversores están dispuestos a pagar una prima por las opciones para tener protección contra caídas significativas del mercado, incluso si estadísticamente la probabilidad de estas caídas es menor o insignificante.
Por lo tanto, la tendencia de la Volatilidad Implícita es de ser mayor que la Volatilidad Realizada, por lo cual el V-R-P es positivo.
Volatilidad Realizada/Histórica
La Volatilidad Histórica (HV) es la medida estadística de la dispersión de los rendimientos de un índice durante un período de tiempo determinado.
La Volatilidad Histórica es un concepto bien conocido en finanzas, pero existe confusión sobre cómo se calcula exactamente. Varias fuentes pueden usar fórmulas de Volatilidad Histórica ligeramente diferentes.
Para calcular la Volatilidad Histórica, utilicé el enfoque más común: desviación estándar anualizada de rendimientos logarítmicos, basada en los precios de cierre diarios.
Volatilidad Implícita
La Volatilidad Implícita (IV) es la previsión del mercado de un posible movimiento en el precio del índice y se expresa anualizada, utilizando porcentajes y desviaciones estándar en un horizonte de tiempo específico (generalmente 30 días).
IV se utiliza para cotizar contratos de opciones donde la alta Volatilidad Implícita da como resultado opciones con primas más altas y viceversa. Además, la oferta y la demanda de opciones y el valor temporal son factores determinantes importantes para calcular la Volatilidad Implícita.
La Volatilidad Implícita generalmente aumenta en los mercados bajistas y disminuye cuando el mercado es alcista.
Para determinar la Volatilidad Implícita de GOLD y SILVER utilicé sus índices de volatilidad: GVZ y VXSLV (30 días IV) proporcionados por CBOE.
Precaución
Tenga en cuenta que debido a que CBOE no proporciona datos en tiempo real en Tradingview, mi cálculo de V-R-P también se retrasa, y por este motivo no se recomienda usar en los primeros 15 minutos desde la apertura.
Este indicador está calibrado para un marco de tiempo diario.

Heatmap MACD Strategy - Pineconnector (Dynamic Alerts)Hello traders
This script is an upgrade of this template script.
Heatmap MACD Strategy
Pineconnector
Pineconnector is a trading bot software that forwards TradingView alerts to your Metatrader 4/5 for automating trading.
Many traders don't know how to dynamically create Pineconnector-compatible alerts using the data from their TradingView scripts.
Traders using trading bots want their alerts to reflect the stop-loss/take-profit/trailing-stop/stop-loss to breakeven options from your script and then create the orders accordingly.
This script showcases how to create Pineconnector alerts dynamically.
Pineconnector doesn't support alerts with multiple Take Profits.
As a workaround, for 2 TPs, I had to open two trades.
It's not optimal, as we end up paying more spreads for that extra trade - however, depending on your trading strategy, it may not be a big deal.
TradingView Alerts
1) You'll have to create one alert per asset X timeframe = 1 chart.
Example : 1 alert for EUR/USD on the 5 minutes chart, 1 alert for EUR/USD on the 15-minute chart (assuming you want your bot to trade the EUR/USD on the 5 and 15-minute timeframes)
2) For each alert, the alert message is pre-configured with the text below
{{strategy.order.alert_message}}
Please leave it as it is.
It's a TradingView native variable that will fetch the alert text messages built by the script.
3) Don't forget to set the webhook URL in the Notifications tab of the TradingView alerts UI.
EA configuration
The Pyramiding in the EA on Metatrader must be set to 2 if you want to trade with 2 TPs => as it's opening 2 trades.
If you only want 1 TP, set the EA Pyramiding to 1.
Regarding the other EA settings, please refer to the Pineconnector documentation on their website.
Logger
The Pineconnector commands are logged in the TradingView logger.
You'll find more information about it from this TradingView blog post
Important Notes
1) This multiple MACDs strategy doesn't matter much.
I could have selected any other indicator or concept for this script post.
I wanted to share an example of how you can quickly upgrade your strategy, making it compatible with Pineconnector.
2) The backtest results aren't relevant for this educational script publication.
I used realistic backtesting data but didn't look too much into optimizing the results, as this isn't the point of why I'm publishing this script.
3) This template is made to take 1 trade per direction at any given time.
Pyramiding is set to 1 on TradingView.
The strategy default settings are:
Initial Capital: 100000 USD
Position Size: 1 contract
Commission Percent: 0.075%
Slippage: 1 tick
No margin/leverage used
For example, those are realistic settings for trading CFD indices with low timeframes but not the best possible settings for all assets/timeframes.
Concept
The Heatmap MACD Strategy allows selecting one MACD in five different timeframes.
You'll get an exit signal whenever one of the 5 MACDs changes direction.
Then, the strategy re-enters whenever all the MACDs are in the same direction again.
It takes:
long trades when all the 5 MACD histograms are bullish
short trades when all the 5 MACD histograms are bearish
You can select the same timeframe multiple times if you don't need five timeframes.
For example, if you only need the 30min, the 1H, and 2H, you can set your timeframes as follow:
30m
30m
30m
1H
2H
Risk Management Features
All the features below are pips-based.
Stop-Loss
Trailing Stop-Loss
Stop-Loss to Breakeven after a certain amount of pips has been reached
Take Profit 1st level and closing X% of the trade
Take Profit 2nd level and close the remaining of the trade
Custom Exit
I added the option ON/OFF to close the opened trade whenever one of the MACD diverges with the others.
Help me help the community
If you see any issue when adding your strategy logic to that template regarding the orders fills on your Metatrader, please let me know in the comments.
I'll use your feedback to make this template more robust. :)
What's next?
I'll publish a more generic template built as a connector so you can connect any indicator to that Pineconnector template.
Then, I'll publish a template for Capitalise AI, ProfitView, AutoView, and Alertatron.
Thank you
Dave

PpSignal Chandelier StopThere are few indicators for MT4 which draw trailing stop line. I prefer to use Chandelier Stops. I believe that with good money management this is one of the best tools to follow a trend.
About ATR trailing stop loss (Chandelier Stops)
When you catch trend you can profit from most of the move. The good thing about ATR is that you have a stop loss level in place. When there is a close on the other side of ATR, it is a signal to close. No second guessing.
Best time frame for ATR trailing stop loss
I strongly recommend time frames such as 30m or larger. On lower time frames like 5m there is too much algo trading. I trade with ATR on 1h or 4h charts.
Parameters for trailing stop
Depends on pair or instrument. In most cases standard parameters will be fine. If I change anything then it is usually a Kv parameter. Standard is 3.5 and I tend to make it bigger like 3.7 or 4.0. In most cases it is around 3.7.
ATR trailing stop loss (Chandelier Exit) – Metatrader download
January 1, 2018 by simon in forex indicators
In this section you can download ATR trailing stop loss (Chandelier Exit) for MetaTrader:
– download ATR trailing stop loss (Chandelier Exit) for MetaTrader 4 –
There are few indicators for MT4 which draw trailing stop line. I prefer to use Chandelier Stops. I believe that with good money management this is one of the best tools to follow a trend.
About ATR trailing stop loss (Chandelier Stops)
When you catch trend you can profit from most of the move. The good thing about ATR is that you have a stop loss level in place. When there is a close on the other side of ATR, it is a signal to close. No second guessing.
Over 300 pips in profit thanks to ATR stop
Over 300 pips in profit thanks to ATR stop
Best time frame for ATR trailing stop loss
I strongly recommend time frames such as 30m or larger. On lower time frames like 5m there is too much algo trading. I trade with ATR on 1h or 4h charts.
Parameters for trailing stop
Depends on pair or instrument. In most cases standard parameters will be fine. If I change anything then it is usually a Kv parameter. Standard is 3.5 and I tend to make it bigger like 3.7 or 4.0. In most cases it is around 3.7.
Remember, it depends from pair and current situation in the market. You should experiment with few settings and check it on historical price action if they are ok.
Best pairs to trade with ATR trailing stop loss
Trailing stop loss works best in trending markets. That is why you should check pair if it tends to move strong or to move in range. It is not the secret that yen pairs line to move strongly. If you are looking for solid trends, you can’t go wrong with GBPJPY or EURJPY.

Top Right Watermark# TopRight Watermark
**Finally, a watermark that stays out of your way!**
Tired of TradingView's default watermark blocking your price action and technical analysis? This customizable watermark indicator gives you complete control over positioning and content display.
## 🎯 Key Features
**✅ Flexible Positioning** - Place anywhere: corners, sides, or edges
**✅ Multi-Slot Display** - Up to 3 customizable information slots
**✅ Individual Font Control** - Different sizes for each slot
**✅ Platform Compatibility** - TradingView OR MetaTrader timeframe formats
**✅ Clean & Professional** - Customizable colors and transparency
## 🔧 What You Can Display
- **Timeframe** - Current chart period
- **Ticker** - Symbol name (smart formatting for crypto/forex)
- **Exchange** - Broker/platform name
- **Custom Text** - Your own message
- **Empty** - Hide unused slots
## 🎨 Customization Options
- **Position**: 9 placement options (top/middle/bottom + left/center/right)
- **Colors**: Full color picker with transparency control
- **Font Sizes**: 5 sizes available per slot (tiny to huge)
- **Timeframe Style**: Choose TradingView (1m, 4H) or MetaTrader (M1, H4) format
## 🚀 Perfect For
- Traders who need clean chart visibility
- Multi-timeframe analysis
- Professional chart screenshots
- Platform migrants (MT4/MT5 to TradingView)
- Anyone wanting organized chart information
## 💡 Pro Tips
- Place in corners to avoid price action interference
- Combine Exchange + Ticker + Timeframe for complete context
- Use transparency to make it subtle but visible
**Stop letting watermarks interfere with your trading analysis. Take control of your chart display today!**
---
*Compatible with all TradingView chart types and timeframes. Easy setup with intuitive controls.*

DCA Investment Tracker Pro [tradeviZion]DCA Investment Tracker Pro: Educational DCA Analysis Tool
An educational indicator that helps analyze Dollar-Cost Averaging strategies by comparing actual performance with historical data calculations.
---
💡 Why I Created This Indicator
As someone who practices Dollar-Cost Averaging, I was frustrated with constantly switching between spreadsheets, calculators, and charts just to understand how my investments were really performing. I wanted to see everything in one place - my actual performance, what I should expect based on historical data, and most importantly, visualize where my strategy could take me over the long term .
What really motivated me was watching friends and family underestimate the incredible power of consistent investing. When Napoleon Bonaparte first learned about compound interest, he reportedly exclaimed "I wonder it has not swallowed the world" - and he was right! Yet most people can't visualize how their $500 monthly contributions today could become substantial wealth decades later.
Traditional DCA tracking tools exist, but they share similar limitations:
Require manual data entry and complex spreadsheets
Use fixed assumptions that don't reflect real market behavior
Can't show future projections overlaid on actual price charts
Lose the visual context of what's happening in the market
Make compound growth feel abstract rather than tangible
I wanted to create something different - a tool that automatically analyzes real market history, detects volatility periods, and shows you both current performance AND educational projections based on historical patterns right on your TradingView charts. As Warren Buffett said: "Someone's sitting in the shade today because someone planted a tree a long time ago." This tool helps you visualize your financial tree growing over time.
This isn't just another calculator - it's a visualization tool that makes the magic of compound growth impossible to ignore.
---
🎯 What This Indicator Does
This educational indicator provides DCA analysis tools. Users can input investment scenarios to study:
Theoretical Performance: Educational calculations based on historical return data
Comparative Analysis: Study differences between actual and theoretical scenarios
Historical Projections: Theoretical projections for educational analysis (not predictions)
Performance Metrics: CAGR, ROI, and other analytical metrics for study
Historical Analysis: Calculates historical return data for reference purposes
---
🚀 Key Features
Volatility-Adjusted Historical Return Calculation
Analyzes 3-20 years of actual price data for any symbol
Automatically detects high-volatility stocks (meme stocks, growth stocks)
Uses median returns for volatile stocks, standard CAGR for stable stocks
Provides conservative estimates when extreme outlier years are detected
Smart fallback to manual percentages when data insufficient
Customizable Performance Dashboard
Educational DCA performance analysis with compound growth calculations
Customizable table sizing (Tiny to Huge text options)
9 positioning options (Top/Middle/Bottom + Left/Center/Right)
Theme-adaptive colors (automatically adjusts to dark/light mode)
Multiple display layout options
Future Projection System
Visual future growth projections
Timeframe-aware calculations (Daily/Weekly/Monthly charts)
1-30 year projection options
Shows projected portfolio value and total investment amounts
Investment Insights
Performance vs benchmark comparison
ROI from initial investment tracking
Monthly average return analysis
Investment milestone alerts (25%, 50%, 100% gains)
Contribution tracking and next milestone indicators
---
📊 Step-by-Step Setup Guide
1. Investment Settings 💰
Initial Investment: Enter your starting lump sum (e.g., $60,000)
Monthly Contribution: Set your regular DCA amount (e.g., $500/month)
Return Calculation: Choose "Auto (Stock History)" for real data or "Manual" for fixed %
Historical Period: Select 3-20 years for auto calculations (default: 10 years)
Start Year: When you began investing (e.g., 2020)
Current Portfolio Value: Your actual portfolio worth today (e.g., $150,000)
2. Display Settings 📊
Table Sizes: Choose from Tiny, Small, Normal, Large, or Huge
Table Positions: 9 options - Top/Middle/Bottom + Left/Center/Right
Visibility Toggles: Show/hide Main Table and Stats Table independently
3. Future Projection 🔮
Enable Projections: Toggle on to see future growth visualization
Projection Years: Set 1-30 years ahead for analysis
Live Example - NASDAQ:META Analysis:
Settings shown: $60K initial + $500/month + Auto calculation + 10-year history + 2020 start + $150K current value
---
🔬 Pine Script Code Examples
Core DCA Calculations:
// Calculate total invested over time
months_elapsed = (year - start_year) * 12 + month - 1
total_invested = initial_investment + (monthly_contribution * months_elapsed)
// Compound growth formula for initial investment
theoretical_initial_growth = initial_investment * math.pow(1 + annual_return, years_elapsed)
// Future Value of Annuity for monthly contributions
monthly_rate = annual_return / 12
fv_contributions = monthly_contribution * ((math.pow(1 + monthly_rate, months_elapsed) - 1) / monthly_rate)
// Total expected value
theoretical_total = theoretical_initial_growth + fv_contributions
Volatility Detection Logic:
// Detect extreme years for volatility adjustment
extreme_years = 0
for i = 1 to historical_years
yearly_return = ((price_current / price_i_years_ago) - 1) * 100
if yearly_return > 100 or yearly_return < -50
extreme_years += 1
// Use median approach for high volatility stocks
high_volatility = (extreme_years / historical_years) > 0.2
calculated_return = high_volatility ? median_of_returns : standard_cagr
Performance Metrics:
// Calculate key performance indicators
absolute_gain = actual_value - total_invested
total_return_pct = (absolute_gain / total_invested) * 100
roi_initial = ((actual_value - initial_investment) / initial_investment) * 100
cagr = (math.pow(actual_value / initial_investment, 1 / years_elapsed) - 1) * 100
---
📊 Real-World Examples
See the indicator in action across different investment types:
Stable Index Investments:
AMEX:SPY (SPDR S&P 500) - Shows steady compound growth with standard CAGR calculations
Classic DCA success story: $60K initial + $500/month starting 2020. The indicator shows SPY's historical 10%+ returns, demonstrating how consistent broad market investing builds wealth over time. Notice the smooth theoretical growth line vs actual performance tracking.
MIL:VUAA (Vanguard S&P 500 UCITS) - Shows both data limitation and solution approaches
Data limitation example: VUAA shows "Manual (Auto Failed)" and "No Data" when default 10-year historical setting exceeds available data. The indicator gracefully falls back to manual percentage input while maintaining all DCA calculations and projections.
MIL:VUAA (Vanguard S&P 500 UCITS) - European ETF with successful 5-year auto calculation
Solution demonstration: By adjusting historical period to 5 years (matching available data), VUAA auto calculation works perfectly. Shows how users can optimize settings for newer assets. European market exposure with EUR denomination, demonstrating DCA effectiveness across different markets and currencies.
NYSE:BRK.B (Berkshire Hathaway) - Quality value investment with Warren Buffett's proven track record
Value investing approach: Berkshire Hathaway's legendary performance through DCA lens. The indicator demonstrates how quality companies compound wealth over decades. Lower volatility than tech stocks = standard CAGR calculations used.
High-Volatility Growth Stocks:
NASDAQ:NVDA (NVIDIA Corporation) - Demonstrates volatility-adjusted calculations for extreme price swings
High-volatility example: NVIDIA's explosive AI boom creates extreme years that trigger volatility detection. The indicator automatically switches to "Median (High Vol): 50%" calculations for conservative projections, protecting against unrealistic future estimates based on outlier performance periods.
NASDAQ:TSLA (Tesla) - Shows how 10-year analysis can stabilize volatile tech stocks
Stable long-term growth: Despite Tesla's reputation for volatility, the 10-year historical analysis (34.8% CAGR) shows consistent enough performance that volatility detection doesn't trigger. Demonstrates how longer timeframes can smooth out extreme periods for more reliable projections.
NASDAQ:META (Meta Platforms) - Shows stable tech stock analysis using standard CAGR calculations
Tech stock with stable growth: Despite being a tech stock and experiencing the 2022 crash, META's 10-year history shows consistent enough performance (23.98% CAGR) that volatility detection doesn't trigger. The indicator uses standard CAGR calculations, demonstrating how not all tech stocks require conservative median adjustments.
Notice how the indicator automatically detects high-volatility periods and switches to median-based calculations for more conservative projections, while stable investments use standard CAGR methods.
---
📈 Performance Metrics Explained
Current Portfolio Value: Your actual investment worth today
Expected Value: What you should have based on historical returns (Auto) or your target return (Manual)
Total Invested: Your actual money invested (initial + all monthly contributions)
Total Gains/Loss: Absolute dollar difference between current value and total invested
Total Return %: Percentage gain/loss on your total invested amount
ROI from Initial Investment: How your starting lump sum has performed
CAGR: Compound Annual Growth Rate of your initial investment (Note: This shows initial investment performance, not full DCA strategy)
vs Benchmark: How you're performing compared to the expected returns
---
⚠️ Important Notes & Limitations
Data Requirements: Auto mode requires sufficient historical data (minimum 3 years recommended)
CAGR Limitation: CAGR calculation is based on initial investment growth only, not the complete DCA strategy
Projection Accuracy: Future projections are theoretical and based on historical returns - actual results may vary
Timeframe Support: Works ONLY on Daily (1D), Weekly (1W), and Monthly (1M) charts - no other timeframes supported
Update Frequency: Update "Current Portfolio Value" regularly for accurate tracking
---
📚 Educational Use & Disclaimer
This analysis tool can be applied to various stock and ETF charts for educational study of DCA mathematical concepts and historical performance patterns.
Study Examples: Can be used with symbols like AMEX:SPY , NASDAQ:QQQ , AMEX:VTI , NASDAQ:AAPL , NASDAQ:MSFT , NASDAQ:GOOGL , NASDAQ:AMZN , NASDAQ:TSLA , NASDAQ:NVDA for learning purposes.
EDUCATIONAL DISCLAIMER: This indicator is a study tool for analyzing Dollar-Cost Averaging strategies. It does not provide investment advice, trading signals, or guarantees. All calculations are theoretical examples for educational purposes only. Past performance does not predict future results. Users should conduct their own research and consult qualified financial professionals before making any investment decisions.
---
© 2025 TradeVizion. All rights reserved.

[GrandAlgo] Candlestick ThemesTransform your TradingView charts with Candlestick Themes, an indicator that customizes candlestick colors using a variety of stunning themes. Whether you’re seeking improved clarity, enhanced personalization, or a fresh visual appeal, this indicator has something for everyone.
Key Features
This indicator offers a wide selection of pre-defined themes:
TradingView Default: The classic, familiar look of TradingView charts.
GrandAlgo: Our exclusive brand theme, blending vibrancy and professionalism for an exceptional charting experience.
MetaTrader-Inspired Themes: Green on Black, Yellow on Black, and Black on White, designed to replicate the iconic MetaTrader aesthetics.
Green Black: A calming and balanced theme for focused trading.
Darkblue Red: A bold and impactful combination with rich tones.
Darkblue Black: A subtle, sleek palette perfect for minimalists.
Lightblue Red: A mix of warm and cool tones for balanced visuals.
Lightblue Red (Gradient): Adds smooth transitions for a modern feel.
Lightblue Black: Crisp and clean for improved readability.
Crimson to Calm: A gradient theme transitioning from bold to tranquil tones.
Robinhood: Inspired by the clean and vibrant look of the popular trading platform.
Warm & Cool Harmony: A seamless blend of warm and cool tones.
Valentine: Passionate reds and pinks for a romantic visual.
Christmas: Festive greens and reds to match the holiday spirit.
Grapes: A playful mix of purples and greens.
Desert: Warm, sandy hues inspired by desert landscapes.
Real Madrid: A sporty theme with iconic colors for fans.
This indicator ensures seamless integration with TradingView charts, offering personalized trading experience. Whether you're a seasoned trader or just starting, these themes will make your charts both functional and visually appealing.

High/Low of week: Stats & Day of Week tendencies// Purpose:
-To show High of Week (HoW) day and Low of week (LoW) day frequencies/percentages for an asset.
-To further analyze Day of Week (DoW) tendencies based on averaged data from all various custom weeks. Giving a more reliable measure of DoW tendencies ('Meta Averages').
-To backtest day-of-week tendencies: across all asset history or across custom user input periods (i.e. consolidation vs trending periods).
-Education: to see how how data from a 'hard-defined-week' may be misleading when seeking statistical evidence of DoW tendencies.
// Notes & Tips:
-Only designed for use on DAILY timeframe.
-Verification table is to make sure HoW / LoW DAY (referencing previous finished week) is printing correctly and therefore the stats table is populating correctly.
-Generally, leaving Timezone input set to "America/New_York" is best, regardless of your asset or your chart timezone. But if misaligned by 1 day =>> tweak this timezone input to correct
-If you want to use manual backtesting period (e.g. for testing consolidation periods vs trending periods): toggle these settings on, then click the indicator display line three dots >> 'Reset Points' to quickly set start & end dates.
// On custom week start days:
-For assets like BTC which trade 7 days a week, this is quite simple. Pick custom start day, use verification table to check all is well. See the start week day & time in said verification table.
-For traditional assets like S&P which trade only 5 days a week and suffer from occasional Holidays, this is a bit more complicated. If the custom start day input is a bank holiday, its custom 'week' will be discounted from the data set. E.g.1: if you choose 'use custom start day' and set it to Monday, then bank holiday Monday weeks will be discounted from the data set. E.g.2: If you choose 'use custom start day' and set it to Thursday, then the Holiday Thursday custom week (e.g Thanksgiving Thursday >> following Weds) would be discounted from the data set.
// On 'Meta Averages':
-The idea is to try and mitigate out the 'continuation bias' that comes from having a fixed week start/end time: i.e. sometimes a market is trending through the week start/end time, so the start/end day stats are over-weighted if one is trying to tease out typical weekly profile tendencies or typical DoW tendencies. You'll notice this if you compare the stats with various custom start days ('bookend' start/end days are always more heavily weighted). I wanted to try to mitigate out this 'bias' by cycling through all the possible new week start/end days and taking an average of the results. i.e. on BTC/USD the 'meta average' for Tuesday would be the average of the Tuesday HoW frequencies from the set of all 7 possible custom weeks(Mon-Sun, Tues-Mon, Weds-Tues, etc etc).
// User Inputs:
~Week Start:
-use custom week start day (default toggled OFF); Choose custom week start day
-show Meta Averages (default toggled ON)
~Verification Table:
-show table, show new week lines, number of new week lines to show
-table formatting options (position, color, size)
-timezone (only for tweaking if printed DoW is misaligned by 1 day)
~Statistics Table:
-show table, table formatting options (position, color, size)
~Manual Backtesting:
-Use start date (default toggled OFF), choose start date, choose vline color
-Use end date (defautl toggled OFF), choose end date, choose vline color
// Demo charts:
NQ1! (Nasdaq), Full History, Traditional week (Mon>>Friday) stats. And Meta Averages. Annotations in purple:
NQ1! (Nasdaq), Full History, Custom week (custom start day = Wednesday). And Meta Averages. Annotations in purple:

theme_presetsStyle Made Easy with 175 Reversable light/dark themes
Built on to of my theme engine, so any tools built with one
will work with the other.
getTheme(_input)
Get a theme by name. (see lib for copy/paste list)
Parameters:
_input : string Name of Theme to use.
apathy()
Theme preset -> "Apathy"
Returns: Theme object
apprentice()
Theme preset -> "Apprentice"
Returns: Theme object
ashes()
Theme preset -> "Ashes"
Returns: Theme object
atelier_cave()
Theme preset -> "Atelier Cave"
Returns: Theme object
atelier_dune()
Theme preset -> "Atelier Dune"
Returns: Theme object
atelier_estuary()
Theme preset -> "Atelier Estuary"
Returns: Theme object
atelier_forest()
Theme preset -> "Atelier Forest"
Returns: Theme object
atelier_heath()
Theme preset -> "Atelier Heath"
Returns: Theme object
atelier_lakeside()
Theme preset -> "Atelier Lakeside"
Returns: Theme object
atelier_plateau()
Theme preset -> "Atelier Plateau"
Returns: Theme object
atelier_savanna()
Theme preset -> "Atelier Savanna"
Returns: Theme object
atelier_seaside()
Theme preset -> "Atelier Seaside"
Returns: Theme object
atelier_sulphurpool()
Theme preset -> "Atelier Sulphurpool"
Returns: Theme object
atlas()
Theme preset -> "Atlas"
Returns: Theme object
ayu()
Theme preset -> "Ayu"
Returns: Theme object
ayu_mirage()
Theme preset -> "Ayu Mirage"
Returns: Theme object
bespin()
Theme preset -> "Bespin"
Returns: Theme object
black_metal()
Theme preset -> "Black Metal"
Returns: Theme object
black_metal_bathory()
Theme preset -> "Black Metal (bathory)"
Returns: Theme object
black_metal_burzum()
Theme preset -> "Black Metal (burzum)"
Returns: Theme object
black_metal_funeral()
Theme preset -> "Black Metal (dark Funeral)"
Returns: Theme object
black_metal_gorgoroth()
Theme preset -> "Black Metal (gorgoroth)"
Returns: Theme object
black_metal_immortal()
Theme preset -> "Black Metal (immortal)"
Returns: Theme object
black_metal_khold()
Theme preset -> "Black Metal (khold)"
Returns: Theme object
black_metal_marduk()
Theme preset -> "Black Metal (marduk)"
Returns: Theme object
black_metal_mayhem()
Theme preset -> "Black Metal (mayhem)"
Returns: Theme object
black_metal_nile()
Theme preset -> "Black Metal (nile)"
Returns: Theme object
black_metal_venom()
Theme preset -> "Black Metal (venom)"
Returns: Theme object
blue_forest()
Theme preset -> "Blue Forest"
Returns: Theme object
blueish()
Theme preset -> "Blueish"
Returns: Theme object
brewer()
Theme preset -> "Brewer"
Returns: Theme object
bright()
Theme preset -> "Bright"
Returns: Theme object
brogrammer()
Theme preset -> "Brogrammer"
Returns: Theme object
brush_trees()
Theme preset -> "Brush Trees"
Returns: Theme object
catppuccin()
Theme preset -> "Catppuccin"
Returns: Theme object
chalk()
Theme preset -> "Chalk"
Returns: Theme object
circus()
Theme preset -> "Circus"
Returns: Theme object
classic()
Theme preset -> "Classic"
Returns: Theme object
clrs()
Theme preset -> "Colors"
Returns: Theme object
codeschool()
Theme preset -> "Codeschool"
Returns: Theme object
cupcake()
Theme preset -> "Cupcake"
Returns: Theme object
cupertino()
Theme preset -> "Cupertino"
Returns: Theme object
da_one_black()
Theme preset -> "Da One Black"
Returns: Theme object
da_one_gray()
Theme preset -> "Da One Gray"
Returns: Theme object
da_one_ocean()
Theme preset -> "Da One Ocean"
Returns: Theme object
da_one_paper()
Theme preset -> "Da One Paper"
Returns: Theme object
da_one_sea()
Theme preset -> "Da One Sea"
Returns: Theme object
da_one_white()
Theme preset -> "Da One White"
Returns: Theme object
danqing()
Theme preset -> "Danqing"
Returns: Theme object
darcula()
Theme preset -> "Darcula"
Returns: Theme object
dark_violet()
Theme preset -> "Dark Violet"
Returns: Theme object
darkmoss()
Theme preset -> "Darkmoss"
Returns: Theme object
darktooth()
Theme preset -> "Darktooth"
Returns: Theme object
decaf()
Theme preset -> "Decaf"
Returns: Theme object
dirtysea()
Theme preset -> "Dirtysea"
Returns: Theme object
dracula()
Theme preset -> "Dracula"
Returns: Theme object
edge()
Theme preset -> "Edge"
Returns: Theme object
eighties()
Theme preset -> "Eighties"
Returns: Theme object
embers()
Theme preset -> "Embers"
Returns: Theme object
emil()
Theme preset -> "Emil"
Returns: Theme object
equilibrium()
Theme preset -> "Equilibrium"
Returns: Theme object
equilibrium_gray()
Theme preset -> "Equilibrium Gray"
Returns: Theme object
espresso()
Theme preset -> "Espresso"
Returns: Theme object
eva()
Theme preset -> "Eva"
Returns: Theme object
everforest()
Theme preset -> "Everforest"
Returns: Theme object
flat()
Theme preset -> "Flat"
Returns: Theme object
framer()
Theme preset -> "Framer"
Returns: Theme object
fruit_soda()
Theme preset -> "Fruit Soda"
Returns: Theme object
gigavolt()
Theme preset -> "Gigavolt"
Returns: Theme object
github()
Theme preset -> "Github"
Returns: Theme object
google()
Theme preset -> "Google"
Returns: Theme object
gotham()
Theme preset -> "Gotham"
Returns: Theme object
grayscale()
Theme preset -> "Grayscale"
Returns: Theme object
green_screen()
Theme preset -> "Green Screen"
Returns: Theme object
gruber()
Theme preset -> "Gruber"
Returns: Theme object
gruvbox_hard()
Theme preset -> "Gruvbox Dark, Hard"
Returns: Theme object
gruvbox_medium()
Theme preset -> "Gruvbox Dark, Medium"
Returns: Theme object
gruvbox_pale()
Theme preset -> "Gruvbox Dark, Pale"
Returns: Theme object
gruvbox_soft()
Theme preset -> "Gruvbox Dark, Soft"
Returns: Theme object
gruvbox_material_hard()
Theme preset -> "Gruvbox Material Dark, Hard"
Returns: Theme object
gruvbox_material_medium()
Theme preset -> "Gruvbox Material Dark, Medium"
Returns: Theme object
gruvbox_material_soft()
Theme preset -> "Gruvbox Material Dark, Soft"
Returns: Theme object
hardcore()
Theme preset -> "Hardcore"
Returns: Theme object
harmonic16()
Theme preset -> "Harmonic16"
Returns: Theme object
heetch()
Theme preset -> "Heetch"
Returns: Theme object
helios()
Theme preset -> "Helios"
Returns: Theme object
hopscotch()
Theme preset -> "Hopscotch"
Returns: Theme object
horizon()
Theme preset -> "Horizon"
Returns: Theme object
horizon_terminal()
Theme preset -> "Horizon Terminal"
Returns: Theme object
humanoid()
Theme preset -> "Humanoid"
Returns: Theme object
ia()
Theme preset -> "Ia"
Returns: Theme object
icy()
Theme preset -> "Icy"
Returns: Theme object
ir_black()
Theme preset -> "Ir Black"
Returns: Theme object
isotope()
Theme preset -> "Isotope"
Returns: Theme object
kanagawa()
Theme preset -> "Kanagawa"
Returns: Theme object
katy()
Theme preset -> "Katy"
Returns: Theme object
kimber()
Theme preset -> "Kimber"
Returns: Theme object
lime()
Theme preset -> "Lime"
Returns: Theme object
london_tube()
Theme preset -> "London Tube"
Returns: Theme object
macintosh()
Theme preset -> "Macintosh"
Returns: Theme object
marrakesh()
Theme preset -> "Marrakesh"
Returns: Theme object
materia()
Theme preset -> "Materia"
Returns: Theme object
material()
Theme preset -> "Material"
Returns: Theme object
materialdarker()
Theme preset -> "Material Darker"
Returns: Theme object
material_palenight()
Theme preset -> "Material Palenight"
Returns: Theme object
material_vivid()
Theme preset -> "Material Vivid"
Returns: Theme object
mellow_purple()
Theme preset -> "Mellow Purple"
Returns: Theme object
mocha()
Theme preset -> "Mocha"
Returns: Theme object
monokai()
Theme preset -> "Monokai"
Returns: Theme object
Nebula()
Theme preset -> "Nebula"
Returns: Theme object
nord()
Theme preset -> "Nord"
Returns: Theme object
nova()
Theme preset -> "Nova"
Returns: Theme object
ocean()
Theme preset -> "Ocean"
Returns: Theme object
oceanicnext()
Theme preset -> "Oceanicnext"
Returns: Theme object
onedark()
Theme preset -> "Onedark"
Returns: Theme object
outrun()
Theme preset -> "Outrun"
Returns: Theme object
pandora()
Theme preset -> "Pandora"
Returns: Theme object
papercolor()
Theme preset -> "Papercolor"
Returns: Theme object
paraiso()
Theme preset -> "Paraiso"
Returns: Theme object
pasque()
Theme preset -> "Pasque"
Returns: Theme object
phd()
Theme preset -> "Phd"
Returns: Theme object
pico()
Theme preset -> "Pico"
Returns: Theme object
pinky()
Theme preset -> "Pinky"
Returns: Theme object
pop()
Theme preset -> "Pop"
Returns: Theme object
porple()
Theme preset -> "Porple"
Returns: Theme object
primer()
Theme preset -> "Primer"
Returns: Theme object
purpledream()
Theme preset -> "Purpledream"
Returns: Theme object
qualia()
Theme preset -> "Qualia"
Returns: Theme object
railscasts()
Theme preset -> "Railscasts"
Returns: Theme object
rebecca()
Theme preset -> "Rebecca"
Returns: Theme object
rose_pine()
Theme preset -> "Rosé Pine"
Returns: Theme object
rose_pine_dawn()
Theme preset -> "Rosé Pine Dawn"
Returns: Theme object
rose_pine_moon()
Theme preset -> "Rosé Pine Moon"
Returns: Theme object
sagelight()
Theme preset -> "Sagelight"
Returns: Theme object
sakura()
Theme preset -> "Sakura"
Returns: Theme object
sandcastle()
Theme preset -> "Sandcastle"
Returns: Theme object
seti_ui()
Theme preset -> "Seti Ui"
Returns: Theme object
shades_of_purple()
Theme preset -> "Shades Of Purple"
Returns: Theme object
shadesmear()
Theme preset -> "Shadesmear"
Returns: Theme object
shapeshifter()
Theme preset -> "Shapeshifter"
Returns: Theme object
silk()
Theme preset -> "Silk"
Returns: Theme object
snazzy()
Theme preset -> "Snazzy"
Returns: Theme object
solar_flare()
Theme preset -> "Solar Flare"
Returns: Theme object
solarized()
Theme preset -> "Solarized"
Returns: Theme object
spaceduck()
Theme preset -> "Spaceduck"
Returns: Theme object
spacemacs()
Theme preset -> "Spacemacs"
Returns: Theme object
stella()
Theme preset -> "Stella"
Returns: Theme object
still_alive()
Theme preset -> "Still Alive"
Returns: Theme object
summercamp()
Theme preset -> "Summercamp"
Returns: Theme object
summerfruit()
Theme preset -> "Summerfruit"
Returns: Theme object
synth_midnight_terminal()
Theme preset -> "Synth Midnight Terminal"
Returns: Theme object
tango()
Theme preset -> "Tango"
Returns: Theme object
tender()
Theme preset -> "Tender"
Returns: Theme object
tokyo_city()
Theme preset -> "Tokyo City"
Returns: Theme object
tokyo_city_terminal()
Theme preset -> "Tokyo City Terminal"
Returns: Theme object
tokyo_night()
Theme preset -> "Tokyo Night"
Returns: Theme object
tokyo_night_storm()
Theme preset -> "Tokyo Night Storm"
Returns: Theme object
tokyo_night_terminal()
Theme preset -> "Tokyo Night Terminal"
Returns: Theme object
tokyo_night_terminal_storm()
Theme preset -> "Tokyo Night Terminal Storm"
Returns: Theme object
tokyodark()
Theme preset -> "Tokyodark"
Returns: Theme object
tokyodark_terminal()
Theme preset -> "Tokyodark Terminal"
Returns: Theme object
tomorrow()
Theme preset -> "Tomorrow"
Returns: Theme object
tomorrow_night()
Theme preset -> "Tomorrow Night"
Returns: Theme object
tomorrow_night_eighties()
Theme preset -> "Tomorrow Night Eighties"
Returns: Theme object
twilight()
Theme preset -> "Twilight"
Returns: Theme object
unikitty()
Theme preset -> "Unikitty"
Returns: Theme object
unikitty_reversible()
Theme preset -> "Unikitty Reversible"
Returns: Theme object
uwunicorn()
Theme preset -> "Uwunicorn"
Returns: Theme object
vice()
Theme preset -> "Vice"
Returns: Theme object
vulcan()
Theme preset -> "Vulcan"
Returns: Theme object
windows_10()
Theme preset -> "Windows 10"
Returns: Theme object
windows_95()
Theme preset -> "Windows 95"
Returns: Theme object
windows_high_contrast()
Theme preset -> "Windows High Contrast"
Returns: Theme object
windows_nt()
Theme preset -> "Windows Nt"
Returns: Theme object
woodland()
Theme preset -> "Woodland"
Returns: Theme object
xcode_dusk()
Theme preset -> "Xcode Dusk"
Returns: Theme object
BollingerBands Strat + pending order alerts via TradingConnectorSoftware part of algotrading is simpler than you think. TradingView is a great place to do this actually. To present it, I'm publishing each of the default strategies you can find in Pinescript editor's "built-in" list with slight modification - I'm only adding 2 lines of code, which will trigger alerts, ready to be forwarded to your broker via TradingConnector and instantly executed there. Alerts added in this script: 14, 17, 20 and 23.
SCRIPT INCLUDES PENDING ORDERS AND ALERTS! Alert will be sent to MetaTrader when order is triggered, but not yet filled. That means if market conditions change and order does not get filled, it needs to be cancelled as well, and there are alerts for that in the script as well.
How it works:
1. TradingView alert fires.
2. TradingConnector catches it and forwards to MetaTrader4/5 you got from your broker.
3. Trade gets executed inside MetaTrader within 1 second of fired alert.
When configuring alert, make sure to select "alert() function calls only" in CreateAlert popup. One alert per ticker is required.
Adding stop-loss, take-profit, trailing-stop, break-even or executing pending orders is also possible. These topics have been covered in other example posts.
This routing works for Forex, indices, stocks, crypto - anything your broker offers via their MetaTrader4 or 5.
Disclaimer: This concept is presented for educational purposes only. Profitable results of trading this strategy are not guaranteed even if the backtest suggests so. By no means this post can be considered a trading advice. You trade at your own risk.
If you are thinking to execute this particular strategy, make sure to find the instrument, settings and timeframe which you like most. You can do this by your own research only.

4 Time Frame Two EMAs Ribbon Comparison - Tom1traderI had seen something like this on metatrader but not here. Since I use TradingView and not metatrader had some fun with this. Indicates up or down for 4 chosen time Frames and as such helps to see the historical trend. Works best on daily or shorter charts because of load time.
User can choose the length of the two exponential moving averages used on each time frame or use defaults 9 and 15.
User can choose the 4 time frames defaults are (display from top to bottom) 5, 15, 60 and D.
Displays a column of 4 dots or circles for each bar of current chart the top being the shortest time frame.
If the faster exponential moving average is above the slower (uptrend) the dot is green else red.
This is similar (actually what I was originally shooting for but took extra time to figure out time frames on here) to another script of mine that has the same display method but uses a spaced set of Hull Moving Averages on one time frame, you choose the shortest length and the space increment between the averages. One may work better than the other for different markets or trading styles. The other one is here: Have fun trading and keep smiling!

Candle ShapeCandle Shape
This indicator visualizes rolling candles that aggregate price action over a chosen lookback period, allowing you to see how OHLC dynamics evolve in real time.
Instead of waiting for a higher timeframe (HTF) bar to close, you can track its development directly from a lower timeframe chart.
For example, view how a 1-hour candle is forming on a 1-minute chart — complete with rolling open, high, low, and close levels, as well as colored body and wick areas.
---
🔹 How it works
- Lookback Period (n) → sets the bucket size, defining how many bars are merged into a “meta-candle.”
- The script continuously updates the meta-open, meta-high, meta-low, and meta-close.
- Body and wick areas are filled with color , making bullish/bearish transitions easy to follow.
---
🔹 Use cases
- Monitor the intra-development of higher timeframe candles.
- Analyze rolling OHLC structures to understand how price dynamics shift across different aggregation windows.
- Explore unique perspectives for strategy confirmation, breakout anticipation, and market structure analysis.
---
✨ Candle Shape bridges the gap between timeframes and uncovers new layers of price interaction.
QEMO: Quantum Electromagnetic Oscillator (Safe Adjusted)This is a highly conceptual and oscillator and It attempts to model market dynamics by borrowing concepts from quantum physics and electromagnetism to create a unique oscillator. It does not represent any real physical phenomena but uses these concepts as metaphors for market forces.
Here is a breakdown of its core components:
1. Quantum Price Wavefunction (The Core Price Engine)
This is the most abstract part of the script. It tries to model price not as a single point, but as a "wavefunction" representing a distribution of probable future prices.
Volatility & Price Grid: It first calculates recent market volatility. Based on this volatility, it creates a dynamic grid of possible price levels (price_bins) around the current price.
Probability Density: It assigns a probability to each price level in the grid.
"Energy" Operators:
Kinetic Energy: Metaphorically represents the "momentum" or rate of change of the price probabilities.
Potential Energy: A force field that influences the probabilities, derived from a combination of volatility and trading volume.
Expected Price: After evolving these probabilities, it calculates a single "expected price" which is the weighted average of all prices in the grid, based on their final probabilities.
2. Electromagnetic Fields (Buying vs. Selling Pressure)
This section models the battle between buyers and sellers in a more familiar way:
E-Field (Electric/Buying): Represents buying pressure, calculated from upward price moves (close - open) multiplied by volume.
B-Field (Magnetic/Selling): Represents selling pressure, calculated from downward price moves (open - close) multiplied by volume.
Lorentz Force (F_net): This is the net force (E - B), representing the overall directional pressure in the market. A positive value means buyers are in control; a negative value means sellers are.
3. Entanglement Entropy (Systemic Risk/Stability)
This component aims to measure the market's stability or "systemic risk."
It calculates a form of auto-correlation on recent price returns.
A high degree of instability in this correlation results in a high "Entropy" (S) value.
Essentially, a high S suggests the market is chaotic and unpredictable (low stability), while a low S suggests it is more stable and trending.
4. Final QEMO Calculation & Plotting
All the components are combined to create the final oscillator value:
Final Value: The qemo value is a product of the expected_price, the amplified net force, and the market stability (1 - S).
Smoothing: This raw qemo value is then smoothed with an Adaptive Moving Average (AMA) to produce the final line that gets plotted on the chart.
Visualization:
The main oscillator line is plotted below the chart. Its color changes based on its value (e.g., blue for positive, red for negative).
The background color of the indicator pane changes based on the Entropy (S), providing an immediate visual cue of market stability (e.g., black for stable, white for chaotic).
The script also plots 99th and 1st percentile bands to help identify statistically extreme readings in the oscillator's value.
HARSI PRO v2 - Advanced Adaptive Heikin-Ashi RSI OscillatorThis script is a fully re-engineered and enhanced version of the original Heikin-Ashi RSI Oscillator created by JayRogers. While it preserves the foundational concept and visual structure of the original indicatorusing Heikin-Ashi-style candles to represent RSI movementit introduces a range of institutional-grade engines and real-time analytics modules.
The core idea behind HARSI is to visualize the internal structure of RSI behavior using candle representations. This gives traders a clearer sense of trend continuity, exhaustion, and momentum inflection. In this upgraded version, the system is extended far beyond basic visualization into a comprehensive diagnostic and context-tracking tool.
Core Enhancements and Features
1. Heikin-Ashi RSI Candles
The base HARSI logic transforms RSI values into open, high, low, and close components, which are plotted as Heikin-Ashi-style candles. The open values are smoothed with a user-controlled bias setting, and the high/low are calculated from zero-centered RSI values.
2. Smoothed RSI Histogram and Plot
A secondary RSI plot and histogram are available for traditional RSI interpretation, optionally smoothed using a custom midpoint EMA process.
3. Dynamic Stochastic RSI Ribbon
The indicator optionally includes a smoothed Stochastic RSI ribbon with directional fill to highlight acceleration and reversal zones.
4. Real-Time Meta-State Engine
This engine determines the current market environmentneutral, breakout, or reversalbased on multiple adaptive conditions including volatility compression, momentum thrust, volume behavior, and composite reversal scoring.
5. Adaptive Overbought/Oversold Zone Engine
Instead of using fixed RSI thresholds, this engine dynamically adjusts OB/OS boundaries based on recent RSI range and normalized price volatility. This makes the OB/OS levels context-sensitive and more accurate across different instruments and regimes.
6. Composite Reversal Score Engine
A real-time score between 0 and 5 is generated using four components:
* OB/OS proximity (zone score)
* RSI slope behavior
* Volume state (burst or exhaustion)
* Trend continuation penalty based on position versus trend bias
This score allows for objective filtering of reversal zones and breakout traps.
7. Kalman Velocity Filter
A Kalman-style adaptive smoothing filter is applied to RSI for calculating velocity and acceleration. This allows for real-time detection of stalls and thrusts in RSI behavior.
8. Predictive Breakout Estimator
Uses ATR compression and RSI thrusting conditions to detect likely breakout environments. This logic contributes to the Meta-State Engine and the Breakout Risk dashboard metric.
9. Volume Acceleration Model
Real-time detection of volume bursts and fades based on VWMA baselines. Volume exhaustion warnings are used to qualify or disqualify reversals and breakouts.
10. Trend Bias and Regime Detection
Uses RSI slope, HARSI body impulse, and normalized ATR to classify the current trend state and directional bias. This forms the basis for filtering false reversals during strong trends.
11. Dashboard with Tooltips
A clean, table displays six key metrics in real time:
* Meta State
* Reversal Score
* Trend Bias
* Volume State
* Volatility Regime
* Breakout Risk
Each cell includes a descriptive tooltip explaining why the value is being shown based on internal state calculations.
How It Works Internally
* The system calculates a zero-centered RSI and builds candle structures using high, low, and smoothed open/close values.
* Volatility normalization is used throughout the script, including ATR-based thresholds and dynamic scaling of OB/OS zones.
* Momentum is filtered through smoothed slope calculations and HARSI body size measurements.
* Volume activity is compared against VWMA using configurable multipliers to detect institutional-level activity or exhaustion.
* Each regime detection module contributes to a centralized metaState classifier that determines whether the environment is conducive to reversal, breakout, or neutral action.
* All major signal and context values are continuously updated in a dashboard table with logic-driven color coding and tooltips.
Based On and Credits
This script is based on the original Heikin-Ashi RSI Oscillator by JayRogers . All visual elements from the original version, including candle plotting and color configurations, have been retained and extended. Significant backend enhancements were added by AresIQ for the 2025 release. The script remains open-source under the original attribution license. Credit to JayRogers is preserved and required for any derivative versions.

Magnificent 7 Overall Percentage Change with MA and Angle LabelsMagnificent 7 Overall Percentage Change with MA and Angle Labels
Overview:
The "Magnificent 7 Overall Percentage Change with MA and Angle Labels" indicator tracks the percentage change of seven key tech stocks (Apple, Microsoft, Amazon, NVIDIA, Tesla, Meta, and Alphabet) and displays their overall average percentage change on the chart. It also provides a moving average of this overall change and calculates the angle of the moving average to help traders gauge the momentum and direction of the overall trend.
How it works:
Real-Time Percentage Change: The indicator calculates the percentage change of each of the "Magnificent 7" stocks compared to their previous day's closing price, giving a snapshot of the market's performance.
Overall Average: It then computes the average of the seven stocks' percentage changes to reflect the broader movement of these major tech companies.
Moving Average: The indicator offers a choice of four types of moving averages (SMA, EMA, WMA, or VWMA) to smooth the overall percentage change, allowing traders to focus on the trend rather than short-term fluctuations.
Slope and Angle Calculation: To provide additional insights, the indicator calculates the slope of the moving average and converts it into an angle (in degrees). This can help traders determine the strength of the trend—steeper angles often indicate stronger momentum.
Key Features:
Percentage Change of the "Magnificent 7":
Tracks the percentage change of Apple (AAPL), Microsoft (MSFT), Amazon (AMZN), NVIDIA (NVDA), Tesla (TSLA), Meta (META), and Alphabet (GOOGL) on the current chart's timeframe.
Overall Average Change:
Computes the average percentage change across all seven stocks, giving a combined view of how the most influential tech stocks are performing.
Customizable Moving Averages:
Offers four types of moving averages (SMA, EMA, WMA, VWMA) to provide flexibility in tracking the trend of the overall percentage change.
Angle Calculation:
Measures the angle of the moving average in degrees, which helps assess the strength of the market’s momentum. Alerts and visual cues can be triggered based on the angle's steepness.
Visual Cues:
The percentage change is plotted in green when positive and red when negative, with a background color that changes accordingly. A zero line is plotted for reference.
Use Case:
This indicator is ideal for traders and investors looking to track the collective performance of the most dominant tech companies in the market. It provides real-time insights into how the "Magnificent 7" stocks are moving together and offers clues about potential market momentum based on the direction and angle of their average percentage change.
Customization:
Moving Average Type and Length: Choose between different types of moving averages (SMA, EMA, WMA, VWMA) and adjust the length to suit your preferred timeframe.
Angle Threshold: Set an angle threshold to trigger alerts when the moving average slope becomes too steep, indicating strong momentum.
Alerts:
Alerts can be created based on the crossing of the moving average or when the angle of the moving average exceeds a specified threshold. This ensures traders are notified when the trend is accelerating or decelerating significantly.
Conclusion:
The "Magnificent 7 Overall Percentage Change with MA and Angle Labels" indicator is a powerful tool for those wanting to monitor the performance of the most influential tech stocks, analyze their overall trend, and receive timely alerts when market conditions shift.

Normalized Willspread IndicatorNot sure to call it as willspread or not, because i take this idea from Larry William's original willspread indicator and did some modifications which found out to be more effective in my opinion, which is by subtracting 21 and 3 ma, this indicator is found on Trade_Stocks_and_Commodities_With_the_Insiders page155. Feel free to find out.
Here's what I modified, instead of using the subtraction between two ma, I use one ma only, I find more accurate in spotting oversold and overbought value. This indicator is useful for metals. It basically compares the value between two assets, let's say u are watching gold, u can select compare it to dxy, us30Y or gold, let's say u choose to compare to dxy, and the indicator shows the the index is overvalued which is above 80 levels, then it is suggesting that gold is overvalued, the same logic apply to undervalued as well which is 20 levels. This is not a entry or exit tool but as additional confluence, u can use any entry method u want like supply and demand and use this indicator to validate your idea, not sure whether it works on forex or not, so far i think it works well on metals.
The bar colour corresponding to the index when it is overbought or oversold. U can switch off it if you dont need it. Do note that this is a repainting indicator, so u must refer to previous week close.

ICT Concepts [LuxAlgo]The ICT Concepts indicator regroups core concepts highlighted by trader and educator "The Inner Circle Trader" (ICT) into an all-in-one toolkit. Features include Market Structure (MSS & BOS), Order Blocks, Imbalances, Buyside/Sellside Liquidity, Displacements, ICT Killzones, and New Week/Day Opening Gaps.
🔶 SETTINGS
🔹 Mode
When Present is selected, only data of the latest 500 bars are used/visualized, except for NWOG/NDOG
🔹 Market Structure
Enable/disable Market Structure.
Length: will set the lookback period/sensitivity.
In Present Mode only the latest Market Structure trend will be shown, while in Historical Mode, previous trends will be shown as well:
You can toggle MSS/BOS separately and change the colors:
🔹 Displacement
Enable/disable Displacement.
🔹 Volume Imbalance
Enable/disable Volume Imbalance.
# Visible VI's: sets the amount of visible Volume Imbalances (max 100), color setting is placed at the side.
🔹 Order Blocks
Enable/disable Order Blocks.
Swing Lookback: Lookback period used for the detection of the swing points used to create order blocks.
Show Last Bullish OB: Number of the most recent bullish order/breaker blocks to display on the chart.
Show Last Bearish OB: Number of the most recent bearish order/breaker blocks to display on the chart.
Color settings.
Show Historical Polarity Changes: Allows users to see labels indicating where a swing high/low previously occurred within a breaker block.
Use Candle Body: Allows users to use candle bodies as order block areas instead of the full candle range.
Change in Order Blocks style:
🔹 Liquidity
Enable/disable Liquidity.
Margin: sets the sensitivity, 2 points are fairly equal when:
'point 1' < 'point 2' + (10 bar Average True Range / (10 / margin)) and
'point 1' > 'point 2' - (10 bar Average True Range / (10 / margin))
# Visible Liq. boxes: sets the amount of visible Liquidity boxes (max 50), this amount is for Sellside and Buyside boxes separately.
Colour settings.
Change in Liquidity style:
🔹 Fair Value Gaps
Enable/disable FVG's.
Balance Price Range: this is the overlap of latest bullish and bearish Fair Value Gaps.
By disabling Balance Price Range only FVGs will be shown.
Options: Choose whether you wish to see FVG or Implied Fair Value Gaps (this will impact Balance Price Range as well)
# Visible FVG's: sets the amount of visible FVG's (max 20, in the same direction).
Color settings.
Change in FVG style:
🔹 NWOG/NDOG
Enable/disable NWOG; color settings; amount of NWOG shown (max 50).
Enable/disable NDOG ; color settings; amount of NDOG shown (max 50).
🔹 Fibonacci
This tool connects the 2 most recent bullish/bearish (if applicable) features of your choice, provided they are enabled.
3 examples (FVG, BPR, OB):
Extend lines -> Enabled (example OB):
🔹 Killzones
Enable/disable all or the ones you need.
Time settings are coded in the corresponding time zones.
🔶 USAGE
By default, the indicator displays each feature relevant to the most recent price variations in order to avoid clutter on the chart & to provide a very similar experience to how a user would contruct ICT Concepts by hand.
Users can use the historical mode in the settings to see historical market structure/imbalances. The ICT Concepts indicator has various use cases, below we outline many examples of how a trader could find usage of the features together.
In the above image we can see price took out Sellside liquidity, filled two bearish FVGs, a market structure shift, which then led to a clean retest of a bullish FVG as a clean setup to target the order block above.
Price then fills the OB which creates a breaker level as seen in yellow.
Broken OBs can be useful for a trader using the ICT Concepts indicator as it marks a level where orders have now been filled, indicating a solidified level that has proved itself as an area of liquidity. In the image above we can see a trade setup using a broken bearish OB as a potential entry level.
We can see the New Week Opening Gap (NWOG) above was an optimal level to target considering price may tend to fill / react off of these levels according to ICT.
In the next image above, we have another example of various use cases where the ICT Concepts indicator hypothetically allow traders to find key levels & find optimal entry points using market structure.
In the image above we can see a bearish Market Structure Shift (MSS) is confirmed, indicating a potential trade setup for targeting the Balanced Price Range imbalance (BPR) below with a stop loss above the buyside liquidity.
Although what we are demonstrating here is a hindsight example, it shows the potential usage this toolkit gives you for creating trading plans based on ICT Concepts.
Same chart but playing out the history further we can see directly after price came down to the Sellside liquidity & swept below it...
Then by enabling IFVGs in the settings, we can see the IFVG retests alongside the Sellside & Buyside liquidity acting in confluence.
Which allows us to see a great bullish structure in the market with various key levels for potential entries.
Here we can see a potential bullish setup as price has taken out a previous Sellside liquidity zone and is now retesting a NWOG + Volume Imbalance.
Users also have the option to display Fibonacci retracements based on market structure, order blocks, and imbalance areas, which can help place limit/stop orders more effectively as well as finding optimal points of interest beyond what the primary ICT Concepts features can generate for a trader.
In the above image we can see the Fibonacci extension was selected to be based on the NWOG giving us some upside levels above the buyside liquidity.
🔶 DETAILS
Each feature within the ICT Concepts indicator is described in the sub sections below.
🔹 Market Structure
Market structure labels are constructed from price breaking a prior swing point. This allows a user to determine the current market trend based on the price action.
There are two types of Market Structure labels included:
Market Structure Shift (MSS)
Break Of Structure (BOS)
A MSS occurs when price breaks a swing low in an uptrend or a swing high in a downtrend, highlighting a potential reversal. This is often labeled as "CHoCH", but ICT specifies it as MSS.
On the other hand, BOS labels occur when price breaks a swing high in an uptrend or a swing low in a downtrend. The occurrence of these particular swing points is caused by retracements (inducements) that highlights liquidity hunting in lower timeframes.
🔹 Order Blocks
More significant market participants (institutions) with the ability of placing large orders in the market will generally place a sequence of individual trades spread out in time. This is referred as executing what is called a "meta-order".
Order blocks highlight the area where potential meta-orders are executed. Bullish order blocks are located near local bottoms in an uptrend while bearish order blocks are located near local tops in a downtrend.
When price mitigates (breaks out) an order block, a breaker block is confirmed. We can eventually expect price to trade back to this breaker block offering a new trade opportunity.
🔹 Buyside & Sellside Liquidity
Buyside / Sellside liquidity levels highlight price levels where market participants might place limit/stop orders.
Buyside liquidity levels will regroup the stoploss orders of short traders as well as limit orders of long traders, while Sellside liquidity levels will regroup the stoploss orders of long traders as well as limit orders of short traders.
These levels can play different roles. More informed market participants might view these levels as source of liquidity, and once liquidity over a specific level is reduced it will be found in another area.
🔹 Imbalances
Imbalances highlight disparities between the bid/ask, these can also be defined as inefficiencies, which would suggest that not all available information is reflected by the price and would as such provide potential trading opportunities.
It is common for price to "rebalance" and seek to come back to a previous imbalance area.
ICT highlights multiple imbalance formations:
Fair Value Gaps: A three candle formation where the candle shadows adjacent to the central candle do not overlap, this highlights a gap area.
Implied Fair Value Gaps: Unlike the fair value gap the implied fair value gap has candle shadows adjacent to the central candle overlapping. The gap area is constructed from the average between the respective shadow and the nearest extremity of their candle body.
Balanced Price Range: Balanced price ranges occur when a fair value gap overlaps a previous fair value gap, with the overlapping area resulting in the imbalance area.
Volume Imbalance: Volume imbalances highlight gaps between the opening price and closing price with existing trading activity (the low/high overlap the previous high/low).
Opening Gap: Unlike volume imbalances opening gaps highlight areas with no trading activity. The low/high does not reach previous high/low, highlighting a "void" area.
🔹 Displacement
Displacements are scenarios where price forms successive candles of the same sentiment (bullish/bearish) with large bodies and short shadows.
These can more technically be identified by positive auto correlation (a close to open change is more likely to be followed by a change of the same sign) as well as volatility clustering (large changes are followed by large changes).
Displacements can be the cause for the formation of imbalances as well as market structure, these can be caused by the full execution of a meta order.
🔹 Kill Zones
Killzones represent different time intervals that aims at offering optimal trade entries. Killzones include:
- New York Killzone (7:9 ET)
- London Open Killzone (2:5 ET)
- London Close Killzone (10:12 ET)
- Asian Killzone (20:00 ET)
🔶 Conclusion & Supplementary Material
This script aims to emulate how a trader would draw each of the covered features on their chart in the most precise representation to how it's actually taught by ICT directly.
There are many parallels between ICT Concepts and Smart Money Concepts that we released in 2022 which has a more general & simpler usage:
ICT Concepts, however, is more specifically aligned toward the community's interpretation of how to analyze price 'based on ICT', rather than displaying features to have a more classic interpretation for a technical analyst.

Failed 2U/2D + 50% Retrace Scanner📈 Multi-Ticker Failed 2U/2D Scanner with Daily Retrace & Market Breadth Table
This TradingView indicator is a multi-symbol price action scanner designed to catch high-probability reversal signals using The Strat’s failed 2U/2D patterns and daily 50% retrace logic, while also displaying market breadth metrics ( USI:TICK and USI:ADD ) for context.
Monitored Symbols:
SPY, SPX, QQQ, IWM, NVDA, AMD, AAPL, META, MSTR
🔍 Detection Logic
1. Failed 2U / Failed 2D Setups
Failed 2U: Price breaks above the previous candle’s high but closes back below the open → Bearish reversal
Failed 2D: Price breaks below the previous candle’s low but closes back above the open → Bullish reversal
Timeframes Monitored:
🕐 1-Hour (1H)
⏰ 4-Hour (4H)
2. Daily 50% Candle Retrace
Checks if price has retraced 50% or more of the previous day’s candle body
Highlights potential trend exhaustion or reversal confluence
3. Market Breadth Metrics (Display Only)
USI:TICK : Measures real-time NYSE up vs. down ticks
USI:ADD : Advance-Decline Line (net advancing stocks)
Not used in signal logic — just displayed in the table for overall market context
🖼️ Visual Elements
✅ Chart Markers
🔺 Red/Green Arrows for 1H Failed 2U/2D
🟨 Yellow Squares for 4H Failed 2U/2D
Visual markers are plotted directly on the relevant candles
📊 Signal Table
Lists all 9 tickers in rows
Columns for:
1H Signal
4H Signal
Daily 50% Retrace
USI:TICK Value
USI:ADD Value
Color-Coded Cells:
🔴 Red = Failed 2U
🟢 Green = Failed 2D
⚠️ Highlight if 50% Daily Retrace condition is true
🟦 Neutral-colored cells for TICK/ADD numeric display
🔔 Alerts
Hardcoded alerts fire when:
A 1H or 4H Failed 2U/2D is detected
The Daily 50% retrace condition is met
Each alert is labeled clearly by symbol and timeframe:
"META 4H Failed 2D"
"AAPL Daily 50% Retrace"
🎯 Use Case
Built for:
Reversal traders using The Strat
Swing or intraday traders watching hourly setups
Traders wanting quick visual context on market breadth without relying on it for confirmation
Monitoring multiple tickers in one clean view
This is scan 2
Add scan 1 for spx, spy, iwm, qqq, aapl
This indicator is not financial advice. Use the alerts to check out chart and when tickers trigger.
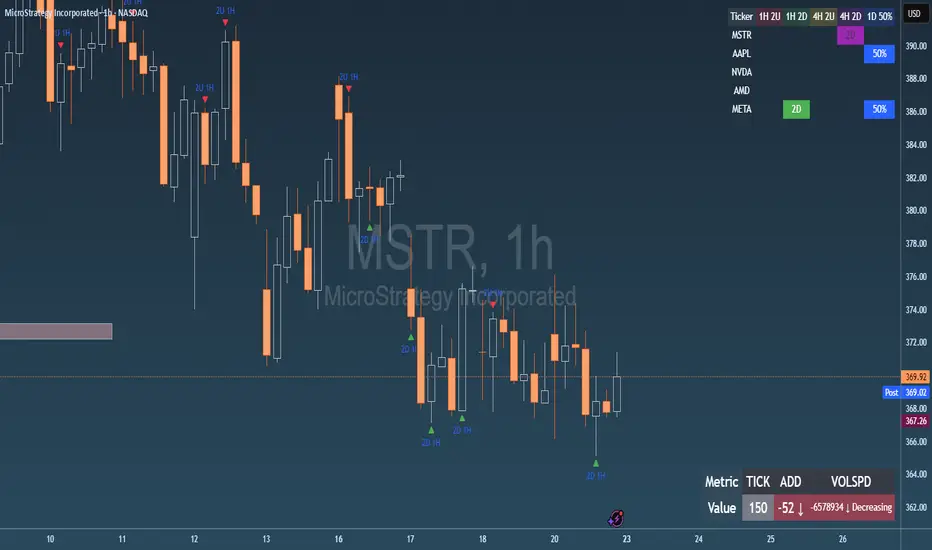
Big 7 NASDAQ📊 Big 7 NASDAQ % Change Heatmap with Trend Arrows
This indicator displays a real-time performance table for the "Big 7" NASDAQ stocks:
Apple (AAPL), Microsoft (MSFT), Amazon (AMZN), Google (GOOGL), Meta (META), Tesla (TSLA), and Nvidia (NVDA).
🔎 Features:
Live Daily % Change: Calculates the percentage change between today’s open and the current price.
Color Gradient: Background color intensity reflects the strength of the move (from mild to strong bullish/bearish).
Trend Arrows: Visual arrows 🔺 (up) and 🔻 (down) represent the direction of movement.
Position Mode Selector:
"Buy" – highlights with green tones
"Sell" – highlights with red tones
"Neutral" – uses dynamic coloring based on individual stock moves
📍 Placement:
The table is positioned in the top-right corner of the chart for easy reference without cluttering your main view.