Adaptive Bandpass Trigger Oscillator Ver 2.0This is an improvement of the Adaptive Bandpass Trigger Oscillator. It normalizes the values to 0-100 to allow the addition of overbought and oversold levels. An aggressive trigger would be an inflection point of the trigger line while overbought/oversold and the phase line above/below the midline.
Feel free to message me if you would like development work or would just like to donate ; )
This is based off of Ehlers' Bandpass Filter system (link below slides 15-17). I then used Ehlers' methods for finding the dominant cycle to automatically input the dominant cycle to the length. Essentially Ehlers runs a band pass with a given period to detrend the price data and highlight a cycle with the given frequency(length). This represents the In phase cycle. Ehlers then creates the trigger line by taking the one bar momentum of the In Phase line, multiplying by 2Pi and then using this to create a 60 degree leading signal. The triggers are crossovers of the In Phase and Lead lines. You can also use conservative signals by waiting for the In Phase line to trend in the direction of the trigger crossover as well.
Delta represents how much to influence the oscillator by the price (Delta 0 is a perfect wave)
Alpha represents how quickly to adapt between the dominant cycle changes in the price.
Thanks to LazyBear for implementing Ehlers' original adaptive code, which I used for this system
Thanks to HPotter for the BandPass Filter code, which I used as a base for implementing the rest of the system
www.mesasoftware.com
Pesquisar nos scripts por "LazyBear"

Adaptive Bandpass Trigger OscillatorThis is based off of Ehler's Bandpass Filter system (link below slides 15-17). I then used Ehler's methods for finding the dominant cycle to automatically input the dominant cycle to the length. Essentially Ehler runs a band pass with a given period to detrend the price data and highlight a cycle with the given frequency(length). This represents the In phase cycle. Ehler then creates the trigger line by taking the one bar momentum of the In Phase line, multiplying by 2Pi and then using this to create a 60 degree leading signal. The triggers are crossovers of the In Phase and Lead lines. You can also use conservative signals by waiting for the In Phase line to trend in the direction of the trigger crossover as well.
Delta represents how much to influence the oscillator by the price (Delta 0 is a perfect wave)
Alpha represents how quickly to adapt between the dominant cycle changes in the price.
Thanks to LazyBear for implementing Ehler's original adaptive code, which I used for this system
Thanks to HPotter for the BandPass Filter code, which I used as a base for implementing the rest of the system
www.mesasoftware.com

RSI CaveGives the same info as a conventional RSI oscillator except it's shown as a scary cave that price is trying to avoid touching. An indicator for the more visual traders out there. With thanks to LazyBear for the RSI band code.
I've included an RSI in the chart above for demonstration purposes.

Volume Squeeze Momentum by HypesterTradingview is basically composed by reskins of many great contributors such as Chrismood, Lazybear, RicardoSandos and a few others. Without those guys I would not be able to learn how to code PINE - since the "documentation" is horrible and support is basically also non-existent. So thank you!
So here is another contribution to the community, which I chose to not disclose the code since the community usually reskin the code and do not give credit and this code is 100% mine.
I believe that the volume tools available are poor and lagging so here is my contribution.
I use this tool to filter noise and eliminate fake reversal signals, momentum readings and trend changes on my Spectro M. Use at your own risk.
I've added some pre-set volume profiles and trend configs. Also, the bar colors for ease of use, and all of that can be easily turned on/off and changed in the config menu.
Let me know what you think!

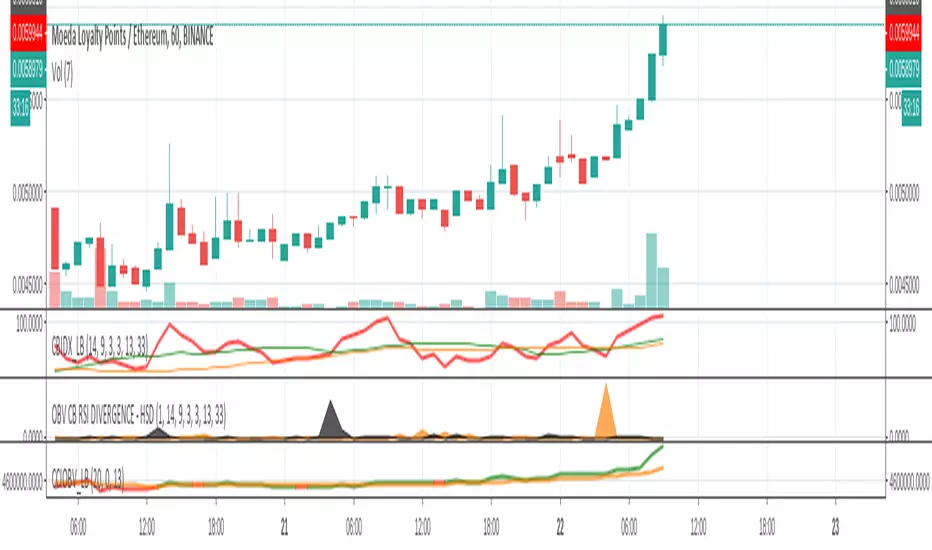
OBV CB RSI DIVERGENCE - HSDShows divergence spikes between OBV and Constance Brown RSI
Trade in the direction of the obv trend when it spikes
Includes LazyBear code and A&E's help - very much appreciated
Useful for all markets n instruments, i guess

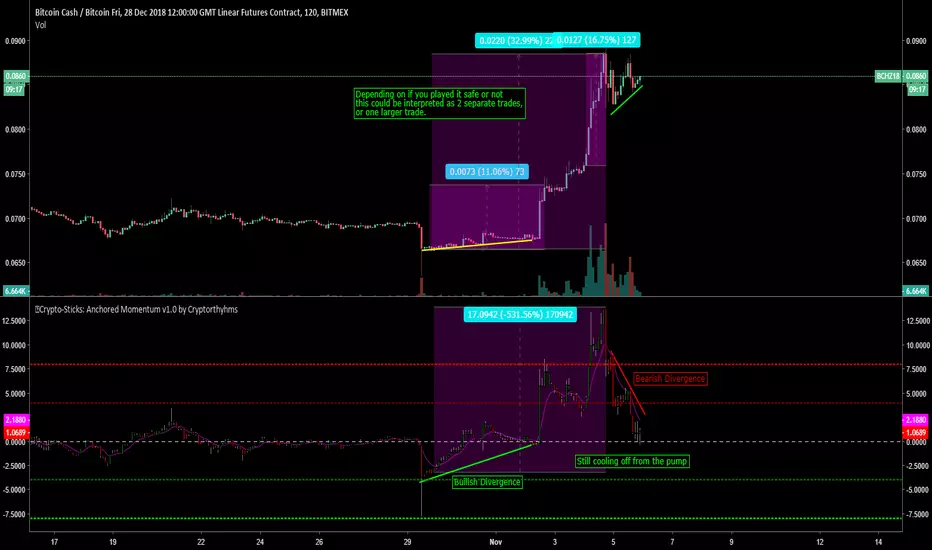
🥢Crypto-Sticks: Anchored Momentum v1.0 by Cryptorhythms🥢Crypto-Sticks™: Anchored Momentum (Rudy Stefenel)
A new series of indicators brought to you by Cryptorhythms...giving you an alternate look at your trusted favorites! Follow me, there are still 2 dozen Crypto-Sticks indicators planned - all will be released in public library.
🚀Indicator Specific Info
🐻Thanks to Lazybear for posting the original AM code I updated to create this indicator! (give that man a follow/thumbs-up, hes a legend!)
New Crypto-Sticks option is an EMA of the average signal line output. Eventually I will go back and update the previous indicators with this feature as well!
In this indicator there is an option to smooth the raw momentum or not. Here's an example of smoothed momentum:
Heiken Ashi candles (default) adds some more clear trend changing points. HA example here:
Volume weighting the HA candles adds a different dimension to the indicator which I have to explore more fully. VW
adds too much noise in my opinion. I left there in case you want to experiment. An example of VW+HA:
💭Please leave me any ideas or feedback you have!
🚫If you use volume weighting you should be on heiken candles.
🚀Crypto-Sticks General Info
🚧This series isnt polished 100%, and I have some more options I will add in the future. But for now, I want to just release them, as I am not sure when I will have the time to put more work into them (many other big projects I am working on).
📊Its basically reinterpretations of all your favorite indicators. I calculate the values a little bit differently than normal, but the end result is creating a candlestick chart (for the indicator!). Then I added the option to plot them as Heiken Ashi candles to smooth out noise and make signaling easier. I recommend using the indicator on this setting.
🔊Lastly I implemented a Volume Weighting system for them all which simply integrates volume into the formulas for these indicators. For the most part this feature is experimental and doesn't provide huge utility (yet - I have other ways I want to try it as well - just no time). Though on some of the indicators it already shows great promise.
👍Enjoying this indicator or find it useful? Please give me a like and follow! There are many more indicators to be released in this series, not to mention I post crypto analysis and other free indicators regularly.
💬Questions? Comments? Want to get access to an entire suite of proven trading indicators? Come visit us on telegram and chat, or just soak up some knowledge. We make timely posts about the market, news, and strategy everyday. Our community isnt open only to subscribers - everyone is welcome to join.
MACD+squeeze+DEMAThis indicator MACD DEMA and Squeeze Momentum from LazyBear and Toff. I combined them and added alert.
Crypto-Sticks Ehler Adaptive Center of Gravityby Cryptorthyhms🥢 Crypto-Sticks™: Ehler's Adaptive Center of Gravity
A new series of indicators brought to you by Cryptorthyhms...giving you an alternate look at your trusted favorites! Follow me, there are still 2 dozen Crypto-Sticks indicators planned - all will be released in public library.
🚀 Indicator Specific Info
🐻Thanks to Lazybear for posting the original EACG code I updated to create this indicator! (give that man a follow/thumbsup, hes a legend!)
New Crypto-Sticks option is an EMA of the average signal line output. Eventually I will go back and update the previous indicators with this feature as well!
⛔Please remember that this indicator is ADAPTIVE. The overbought and oversold ranges do not correspond to specific values. This does make it a bit harder to signal with, but its a great indicator nonetheless.
Heiken Ashi candles (default) adds some more clear trend changing points.
Volume weighting the HA candles adds a different dimension to the indicator which I have to explore more fully. VW does work okay on this indicator, skewing output but also adding some noise. An example of VW+HA:
💭Please leave me any ideas or feedback you have!
🚫If you use volume weighting you should be on heiken candles.
🚀 Crypto-Sticks General Info
🚧This series isnt polished 100%, and I have some more options I will add in the future. But for now, I want to just release them, as I am not sure when I will have the time to put more work into them (many other big projects I am working on).
📊Its basically reinterpretations of all your favorite indicators. I calculate the values a little bit differently than normal, but the end result is creating a candlestick chart (for the indicator!). Then I added the option to plot them as Heiken Ashi candles to smooth out noise and make signaling easier. I recommend using the indicator on this setting.
🔊Lastly I implemented a Volume Weighting system for them all which simply integrates volume into the formulas for these indicators. For the most part this feature is experimental and doesn't provide huge utility (yet - I have other ways I want to try it as well - just no time). Though on some of the indicators it already shows great promise.
👍Enjoying this indicator or find it useful? Please give me a like and follow! There are many more indicators to be released in this series, not to mention I post crypto analysis and other free indicators regularly.
💬Questions? Comments? Want to get access to an entire suite of proven trading indicators? Come visit us on telegram and chat, or just soak up some knowledge. We make timely posts about the market, news, and strategy everyday. Our community isnt open only to subscribers - everyone is welcome to join.
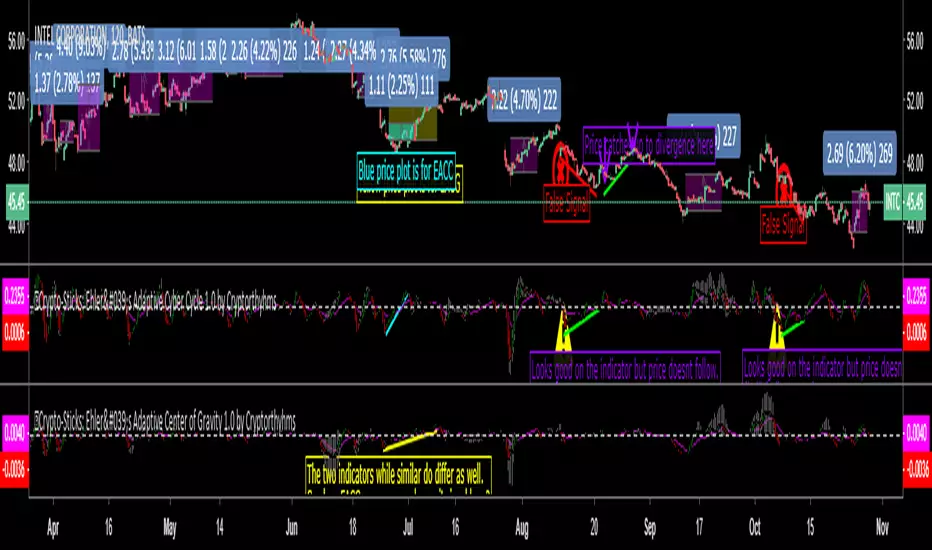
Crypto-Sticks: Ehler's Adaptive Cyber Cycle by Cryptorthyhms🥢 Crypto-Sticks™: Ehler's Adaptive Cyber Cycle
A new series of indicators brought to you by Cryptorthyhms...giving you an alternate look at your trusted favorites! Follow me, there are still 2 dozen Crypto-Sticks indicators planned - all will be released in public library.
🚀 Indicator Specific Info
🐻Thanks to Lazybear for posting the original EACC code I updated to create this indicator! (give that man a follow/ thumbsup, hes a legend!)
New Crypto-Sticks option is an EMA of the average signal line output. Eventually I will go back and update the previous indicators with this feature as well!
⛔Please remember that this indicator is ADAPTIVE. The overbought and oversold ranges do not correspond to specific values. This does make it a bit harder to signal with, but its a great indicator nonetheless.
Heiken Ashi candles (default) adds some more clear trend changing points.
Volume weighting the HA candles adds a different dimension to the indicator which I have to explore more fully. VW does work okay on this indicator, skewing output but also adding some noise. An example of VW+HA:
💭Please leave me any ideas or feedback you have!
🚫If you use volume weighting you should be on heiken candles.
🚀Crypto-Sticks General Info
🚧This series isnt polished 100%, and I have some more options I will add in the future. But for now, I want to just release them, as I am not sure when I will have the time to put more work into them (many other big projects I am working on).
📊Its basically reinterpretations of all your favorite indicators. I calculate the values a little bit differently than normal, but the end result is creating a candlestick chart (for the indicator!). Then I added the option to plot them as Heiken Ashi candles to smooth out noise and make signaling easier. I recommend using the indicator on this setting.
🔊Lastly I implemented a Volume Weighting system for them all which simply integrates volume into the formulas for these indicators. For the most part this feature is experimental and doesn't provide huge utility (yet - I have other ways I want to try it as well - just no time). Though on some of the indicators it already shows great promise.
👍Enjoying this indicator or find it useful? Please give me a like and follow! There are many more indicators to be released in this series, not to mention I post crypto analysis and other free indicators regularly.
💬Questions? Comments? Want to get access to an entire suite of proven trading indicators? Come visit us on telegram and chat, or just soak up some knowledge. We make timely posts about the market, news, and strategy everyday. Our community isnt open only to subscribers - everyone is welcome to join.

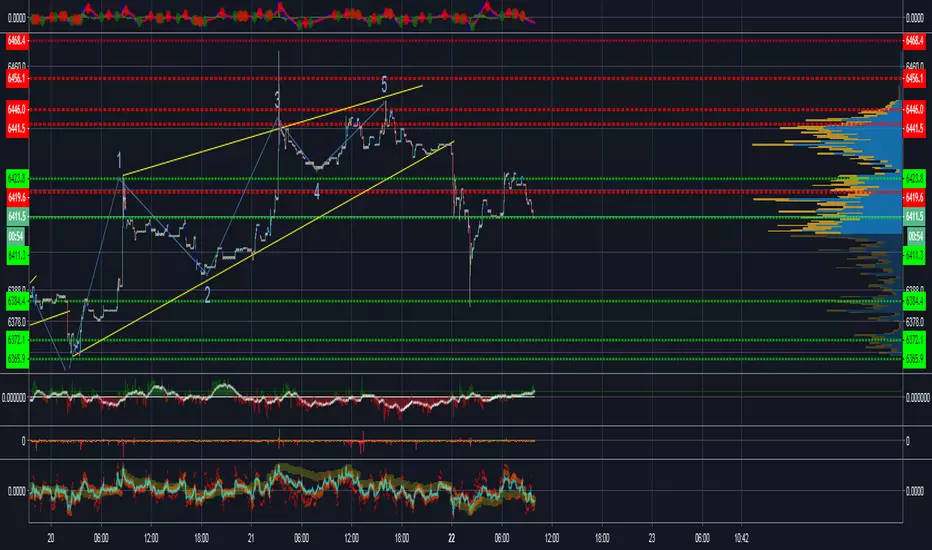

Crypto Day/Swing Trade ComboI've been having some (educational) fun with Pine lately, and wanted to improve the Trading Combo script, so here is my Crypto Day/Swing Trade script.
It's a combination of several indicators, included are:
Bollinger Bands (with 3 bands/StdDev, 2 enabled by default)
(Enhanced) Ichimoku Cloud
Automatic Fibonacci S/R levels
6 Moving Averages
3 Hull Moving Averages
Price Action Bars
Price Divergence Detector
Since Pine is limited to 64 plots, this is all i could get in.
Shout out goes to ChrisMoody, Albert Callisto, 100kiwi, LazyBear, RicardoSantos & JustUncleL for their ideas and (part of) the source code
The script is fully configurable. Use the Inputs tab to enable or disable indicators and use the Styles tab to enable/disable (or configure) specific parts of each indicator.
Happy Trading!
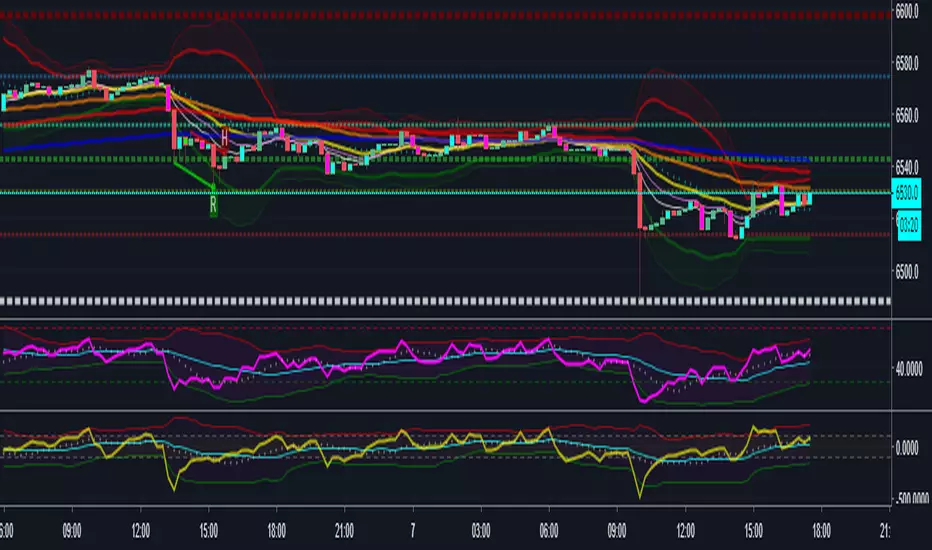
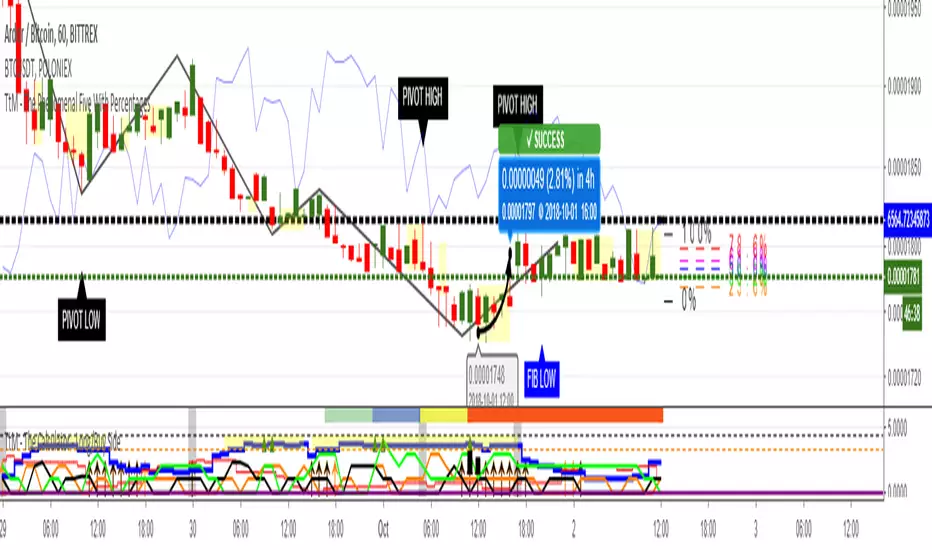
TtM - The Calculator - Long/Buy SideThe Calculator is more than just an indicator. The math from its underlying 16 built-in indicators is the core of my overall trading strategy.
The Calculator takes all that data, analyzes it behind the scenes and then displays it in an EASY to understand format.
Basically, The Calculator takes the work out of something that would ordinarily be very difficult and simplifies it down to a couple of symbols.
It also contains the coding necessary to fire off the 'Server Side ALERTS' provided by TradingView.
My suggestion is to take The Calculator for a FREE ride. Get in, kick the tires and try to break it. In other words, 'drive' it like you ‘STOLE IT’.
I think you will be pleasantly surprised at the simplicity, power and potential results.
Lastly, since the indicator will be for sale, I will take TradingView up on their House Rules that allow me to post an outside instruction link.
That information will provide ALL the details necessary to allow you to flip the coin (pun intended) as to whether The Calculator might be a good fit for you.
Here is that link:
drive.google.com
If you would like access to your 'One Week FREE Trial' of The Calculator, just Private Message me at:
www.tradingview.com
I am normally able to respond within 24 hours or less.
NOTE: I am NOT a professional trader. I DO NOT provide investment advice. This content and the data provided in the indicator is based on my live and simulated, personal observations and is intended for educational purposes ONLY. YOU are responsible for ALL your trading decisions and ALL subsequent tax ramifications. Past performance DOES NOT guarantee future results.
Acknowledgments: I would like to personally thank the following TV members for their inspiration and in certain cases, their code snippet usage approval: RicardoSantos, Shizaru, LazyBear, MarcoValente, karthikmarar, glaz and joe_vijay. By virtue of building on their publicly available code snippets, the finish line came sooner rather than later. Also, a special thanks to gyromatical for assistance and brainstorming.
CCI Cycle (Modified Schaff Trend Cycle)This is a modified Schaff Trend Cycle (STC), which is designed to provide quicker entries and exits.
I've been a huge fan of the STC for a long time, but being based on the MACD means its signals often lag by a bar or two (especially in fast moving markets). All I've done here is take the base STC script (all credit to user @LazyBear), and change the source to a modified CCI.
The CCI Cycle provides more timely entries and exits, often by 1-2 bars. The flip side of the increased responsiveness is a prevalence for more false signals (a perfect example is the 17th August on the above chart). It's the nature of the beast! Still, I've been using this for a few months now and it's (in my opinion) an upgrade on the standard STC.
As always, you will need to pair this with another indicator or method of technical analysis to provide a trade bias, as the CCI Cycle (and STC) aren't designed to trade every signal. In my experience, either divergence identification, or using one or more moving averages works particularly well.
The indicator is also MTF capable, so you can get some interesting results from that.
Any queries let me know.
DD

Simple TrenderOriginates from:
I was reading some Impulse Trading literature by A. Elder.. In it, someone named Kerry Lovvorn proposed "An End of Day Trend Following System" for someone lazy.
Originally it is just price closing above an 8 ema (low) for long. Exit when price closes below an 8 ema (low). The opposite for a short position.
Conditions: Buy when price closed below ema (low) for two bars or more, then closes above. Opposite for a short position. I do not follow this condition. Though it may help with whipsaw.
My condition is when price closes above the 26 ema (low) (works the best for me) I place orders above the initial crossing bars high. Opposite for lows.
I look for stocks that are low in price to go long on. I want the run from 2's to 15's
I look for stocks that are mid-teens/20's in price to go short on. I want the run from 20's to 2's
I look for stock with news and earnings that are already running (up or down) to play the pullback.
These conditions can easily be scanned for on thinkorswim
From first glance, the system looks like CMsling shotsystem. Although, I plagiarized some parts of the codes, because I am inept when it comes to that shit, it differs as it is not a moving average crossover system.
It is a price crossing over concept. A moving average VWAP is used for best entries on pullbacks.
Purpose:
--To catch the majority of a trend/wave/run.
--To identify pullback areas to go long or short while in midst of trend. To catch pullbacks off news and earning runners.
--To catch the initial start of trend with clear rules to enter
--Clear rules to exit
Issues
--possibilities of getting ninja sliced the fuck up. Can be mitigated by entering stocks with decent average volume. And also only going long above 200 ema and short below it. ADX won't work, at the initial start of the trend it will show not trending. Can look at blow off volume at the bottom followed by increase in buying for long and vice versa for short.
--Can give some huge gains away through gap ups or gap downs from news or earnings during trend. However, can get huge gain on gaps from news or earning. Nature of the game.
--Need some brass balls and a supply of pepto to stomach through some of the pullbacks. Gut wrenching seeing big gains dwindle. But they all even out at the end, you hope. (see NBEV and IGC, and CRON and others. shit don't go in straight lines, homie)
Pros
--It's simple and easy. Overall, you profit
--works with any security
Cons
--It can be stressful.
--does not work well on lower time frames. Do not recommend going below 15 minutes
--Possibility of working on 5 minutes with a time frame breakout strategy (15,30 min).
Couple it with LazyBear "Weis Wave Volume" indicator. Works well for pullback entries.
Enjoy. Ride some waves.

PROFITABLE BITCOIN TRADING STRATEGYIndicators:
Weis wave volume by LazyBear (4)
Heikin Ashi candles
useful for longs and exits.
Best applied on 4h - 1D charts.

Walter WeisBased on LazyBear's Weis Wave Indicator with minor tweaks. credits to CryptoC00kie for the help. This script is still incomplete at the moment, main purpose is for my research. Anyway red candle signals a possible short signal, lime candle a possible long. Requires interpretation with weis chart and PA still, will be updated to a signal script in the near future

MACD Volume Weighted and LeaderMACD+Leader MACD+Volume Weighted MACD
price tend to follow the leader/volume, look at price history to get an idea how it's works.
//all credits go to Lazybear,ChrisMoody.

Walter Weis LBBased on LazyBear's Weis Wave Indicator with minor tweaks. credits to CryptoC00kie for the help. This script is still incomplete at the moment, main purpose is for my research. Anyway red candle signals a possible short signal, lime candle a possible long. Requires interpretation with weis chart and PA still, will be updated to a signal script in the near future

-- Simple and Profitable Cryptocurrency Trading Strategy --Script based on this strategy:
Based on 8EMA Close and Open with Weis Wave Volume by Lazybear indicator.
The script will let you know when to Long or Short the market.

Squeeze Momentum Indicator mod#3 This is a corrected version of Squeeze Indicator that initially was authored by LazyBear and modified by KıvanÇ @fr3762 (twitter)
Indicator description: www.forextrading-pips.com
Interpretation:
When both the upper and lower Bollinger Bands go inside the Keltner Channel, the squeeze is on.
When the Bollinger Bands (BOTH lines) start to come out of the Keltner Channel, the squeeze has been released (off).
When one of the Bollinger Bands is out of Keltner Channel, no highlighting is done.
List of all my indicators: www.tradingview.com

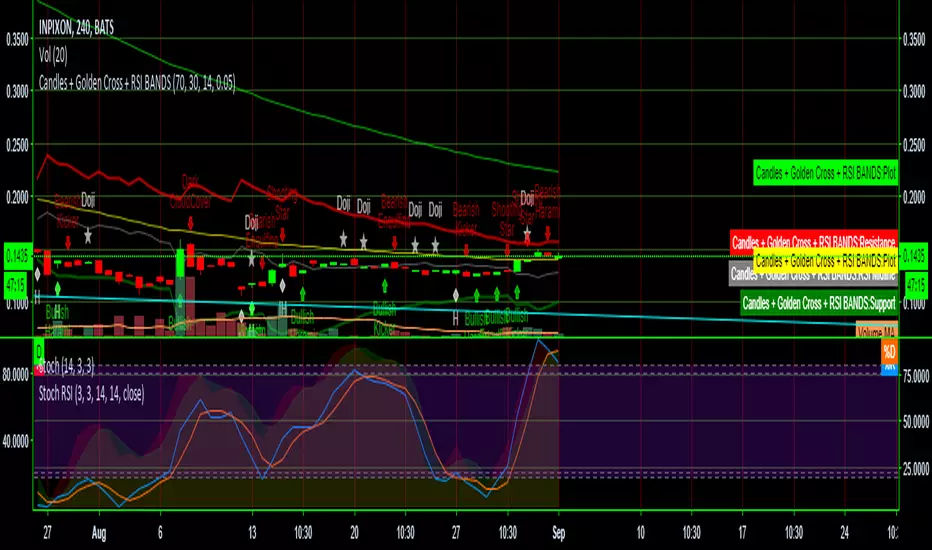
Candles + Golden Cross + RSI BANDSThis script combines three scripts for ease of use
RSI Bands LazyBear
Golden Cross MichMexTrading
Candlestick patterns identified repo32
I combined them because they work exceptionally well together in identifying reversals and other potential changes