Pesquisar nos scripts por "GOLD"

dmw_3SMACross3 SMA set to 5 10 20 used to find the crossing points for pattern reversals or breakouts.

Lysergik's Stochastic SynergyThis indicator shows the average Stochastic RSI output of the 15m, 1h, 2h, 4h, and Daily Stochastic RSI. It will change in its behavior depending on the time-frame you're using, but for many markets it works best on the 30m time-frame and the daily time-frame.
It is best used along with Lysergik's Fib Cross, which will allow you to avoid false signals in the stochastic synergy indicator. If your MA cross (50, 200) indicates a direction change opposite of the stochastic RSI synergy indicator then that is a signal to wait for more price action to determine your entry/exit points.
Using the Lysergik's Fib Cross, the same applies, but remember that a golden cross (white cross symbol) followed directly by a golden ratio cross (gold cross symbol) is even further indication that the stochastic RSI needs more breathing room before reversing.
This indicator is fully adjustable for you to back-test against charts and refine the indicator to your market.
The inputs in respective order are as follows:
RSI Length, Stoch Length, Smooth K, Smooth D, Upper Limit, Lower Limit, Basis
Enjoy and remember only make trades on your own terms.
Happy trading/investing! :)

SynergySynergy
This indicator was developed for use in an investigation/tutorial using Pine Script to analyse Gold and US Dollar Index correlation.
The first indicator shall measure the percentage change between the open and close of each bar and compare it to the same percentage change of an alternative asset. Additionally, we shall color the background when the two assets move in the same direction. This should allow us to more easily see when the two assets move together and spot trends in their moment.
The yellow bars show use the percentage change in the price of gold. The blue bars show the percentage change in the price of the US Dollar index. If the bar is above zero, it means that the asset closed up. Conversely, if it is below zero, it means the asset closed down. Finally, the grey bars show bars in which the two assets closed in the same direction.
It can be used in conjunction with a second indicator (to be published soon) that provides statistics generated from this indicator.
The full free post can be found here: backtest-rookies.com

BO Willians EMA'sBo Williams is a North America/Brazilian trader. He created a trading software called PHI CUBE.
This ema ratios are very used in Brazil. They a based in the Golden Number PHI.
"There is a special ratio that can be used to describe the proportions of everything from nature's smallest building blocks, such as atoms, to the most advanced patterns in the universe, such as unimaginably large celestial bodies. Nature relies on this innate proportion to maintain balance, but the financial markets also seem to conform to this "golden ratio." Here, we take a look at some technical analysis tools that have been developed to take advantage of it.
The Mathematics
Mathematicians, scientists and naturalists have known this ratio for centuries. It's derived from something known as the Fibonacci sequence, named after its Italian founder, Leonardo Fibonacci (whose birth is assumed to be around 1175 A.D. and death around 1250 A.D.). Each term in this sequence is simply the sum of the two preceding terms (1, 1, 2, 3, 5, 8, 13, etc.).
But this sequence is not all that important; rather, it is the quotient of the adjacent terms that possesses an amazing proportion, roughly 1.618, or its inverse 0.618. This proportion is known by many names: the golden ratio, the golden mean, PHI and the divine proportion, among others. So, why is this number so important? Well, almost everything has dimensional properties that adhere to the ratio of 1.618, so it seems to have a fundamental function for the building blocks of nature. "
More here www.goldennumber.net

EMA 50, 100 and 200Draw a set of 3 EMA: 50, 100 and 200. It highlight with a circle the crossing of EMA(50) with other EMAs

IV/HV ratio 1.0 [dime]This script compares the implied volatility to the historic volatility as a ratio.
The plot indicates how high the current implied volatility for the next 30 days is relative to the actual volatility realized over the set period. This is most useful for options traders as it may show when the premiums paid on options are over valued relative to the historic risk.
The default is set to one year (252 bars) however any number of bars can be set for the lookback period for HV.
The default is set to VIX for the IV on SPX or SPY but other CBOE implied volatility indexes may be used. For /CL you have OVX/HV and for /GC you have GVX/HV.
Note that the CBOE data for these indexes may be delayed and updated EOD
and may not be suitable for intraday information. (Future versions of this script may be developed to provide a realtime intraday study. )
There is a list of many volatility indexes from CBOE listed at:
www.cboe.com
(Some may not yet be available on Tradingview)
RVX Russell 2000
VXN NASDAQ
VXO S&P 100
VXD DJIA
GVX Gold
OVX OIL
VIX3M 3-Month
VIX6M S&P 500 6-Month
VIX1Y 1-Year
VXEFA Cboe EFA ETF
VXEEM Cboe Emerging Markets ETF
VXFXI Cboe China ETF
VXEWZ Cboe Brazil ETF
VXSLV Cboe Silver ETF
VXGDX Cboe Gold Miners ETF
VXXLE Cboe Energy Sector ETF
EUVIX FX Euro
JYVIX FX Yen
BPVIX FX British Pound
EVZ Cboe EuroCurrency ETF Volatility Index
Amazon VXAZN
Apple VXAPL
Goldman Sachs VXGS
Google VXGOG
IBM VXIBM

Moving Average Cross Strategy Simply define your fast and slow M then backtest the strategy.
*First script, work in progress. Will allow you to combine two TV indicators into one.

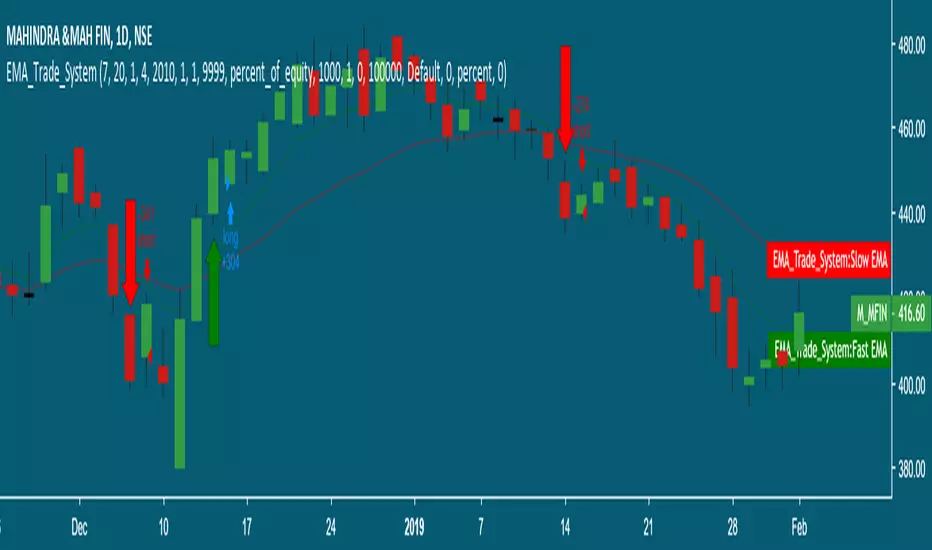
MA Cross 50/200 - Moving Averageindicates short-term 50-day moving average AND long-term 200-day moving average CROSS
@GateTicker

Multi-Timeframe Probability Zones [DW]This is an experimental study based on multi-timeframe price action and a simple average.
Use it to quickly identify MTF support and resistance, and high probability price levels.
NOTE: Because higher timeframe levels are not certain until the interval is closed, refresh your chart as new levels are drawn.

Line Break StrategyLine Break Strategy
Entry rule:
Long on a bullish line and short on a bearish line.
Backtest:
Profit factors are shown below for three-line break.
Daily time frame, FXCM broker.
EURUSD: 1.267, USDJPY: 1.039, GBPUSD: -0.816, AUDUSD: -0.959
S&P500: -0.783, Nikkei225: 1.099
CrudeOil: 1.03, Gold: 1.196
BTCUSD: -0.883
Reference:
Steve Nison, Beyond Candlesticks - New Japanese Charting Techniques Revealed
Note:
This strategy doesn't work properly on the linebreak chart.
A good example is shown below. The entry prices are not always correct.
If you have signal, but the next candle moves in the opposite direction, the entry price is drawn at the Open of the new candle instead of the Close of the previous candle.
The results of backtest are unreliable due to this reason.

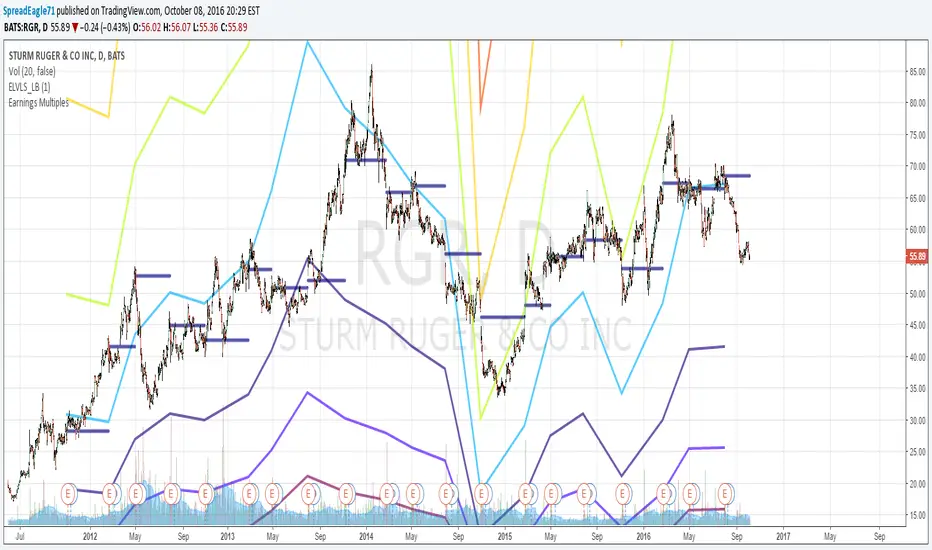
Earnings MultiplesMultiplies Quarterly Earnings x 13, x 21, x 34, x 55, x 89, x 144, x 233.
Yes its a fibonacci sequence.
"Goldilocks zone" seems to be in the 55x - 89x area.
Also when companies become profitable, the indicator looks like a "starburst".
EMA & SMA with FRACTAL DEVIATION BANDS by @XeL_ArjonaEMA & SMA with FRACTAL DEVIATION BANDS
Ver. 1.0.25.08.2015
By Ricardo M Arjona @XeL_Arjona
DISCLAIMER:
DISCLAIMER:
The Following indicator/code IS NOT intended to be a formal investment advice or recommendation by the author, nor should be construed as such. Users will be fully responsible by their use regarding their own trading vehicles/assets. The embedded code and ideas within this work are FREELY AND PUBLICLY available on the Web for NON LUCRATIVE ACTIVITIES and must remain as is.
WHAT IS THIS?
This is the adaptation of the FRACTAL DEVIATION BANDS to be used on Traditional Moving Averages (Simple & Exponential).
ALL NEW IDEAS OR MODIFICATIONS to these indicator(s) are Welcome in favor to deploy a better and more accurate readings. I will be very glad to be notified at Twitter or TradingVew accounts at: @XeL_Arjona
Any important addition to this work MUST REMAIN PUBLIC by means of CreativeCommons CC & TradingView.
2015

Cinematic Session Fade [Pro]🎬 Cinematic Session Fade — A Clean Way to See Market Mood
This indicator is designed to enhance visual clarity, not clutter your chart.
Instead of adding more lines, boxes, or signals, it uses soft cinematic session shading to show how market behavior naturally changes throughout the day.
🌍 Session-Based Market Atmosphere
Asia Session (Calm Blue)
Represents balance, low volatility, and range-building conditions.
London Session (Warm Gold)
Highlights the transition phase where momentum often starts to build.
New York Session (Deep Red)
Emphasizes decision-making hours, volatility, and directional moves.
The session colors fade smoothly in the background, creating a professional and distraction-free viewing experience.
🎨 Why This Indicator Looks Clean & Professional
No indicators stacked on price
No buy/sell arrows or noisy labels
Soft, eye-friendly background shading
Clean candle colors for clear price focus
Optimized for dark mode charts
This makes the chart easy to read, easy on the eyes, and visually attractive for both analysis and screenshots.
🧠 How Traders Use It
Identify which session the market is in at a glance
Adjust expectations for volatility and behavior
Combine with your own strategy (structure, SMC, trend, or price action)
Perfect for education, market commentary, and clean chart presentations
📈 Best Markets
Forex
Gold (XAUUSD)
Bitcoin & Crypto
Indices
🎯 Final Note
This tool does not predict price.
It simply provides context and atmosphere, helping traders stay aligned with market rhythm while keeping charts elegant and professional.
If you value clarity over clutter, this indicator is built for you.

Candle Size Table (Big Font & Colors)Symbols: gold, oil, BTC, silver, USDJPY, GBPUSD, USDCAD, AUDUSD
Timeframes: 1m and 5m
Size of the previous candle (for each TF)
I’ll assume “size” = candle range (high − low) of the previous closed candle.

Mitigation POI Master: OB + FVG ConfluenceOverview
The Mitigation POI Master is a Smart Money Concepts (SMC) tool designed to identify high-probability Points of Interest (POI). Unlike standard indicators that clutter your chart with every single block, this script focuses on the Confluence of two critical institutional footprints: Order Blocks (OB) and Fair Value Gaps (FVG).
Key Features
💎 Automated POI Detection: Finds overlapping areas between OBs and FVGs, marking them as premium Demand or Supply zones.
🧹 Smart Mitigation Engine: Real-time tracking of zone mitigation. Once a zone is touched or broken through (customizable), it is automatically removed to keep your chart clean.
⚡ Liquidity Sweep Filter: Includes an optional filter to only show Order Blocks that have successfully swept previous candle liquidity—a hallmark of true institutional intervention.
📊 Volume Confirmation: Integrated volume filter to ensure the zones are born from high-activity impulsive moves.
Settings
Timeframe Usage: This indicator performs best on higher timeframes (H1, H4, Daily) as institutional moves are more significant there. Using lower TFs (M1, M5) may generate too many low-quality zones.
Sensitivity (ATR Multiplier):
- For volatile assets/lower TFs (Crypto, Gold): Increase the Sensitivity input (e.g., 8-10) to filter out noise.
- For stable assets/higher TFs (Forex Majors, Stocks): Use the default Sensitivity (e.g., 4-6).
Mitigation Mode: The default "Breakthrough" mode is safer for high R:R setups. "Touch" mode offers earlier entries but higher risk.
How to Use
Identify the POI: Look for the ✦ DEMAND or ✦ SUPPLY labels.
Wait for the Return: Wait for price to retrace into the POI (Mitigation).
Execute: Use lower timeframe confirmation (like MSB or CHoCH) within these zones for high R:R entries.
Alerts: Set alerts to get notified the moment a new high-confluence POI is formed.

Visual Pro Trend Master by Herman Sangivera ( Papua )Visual pro Trend Mater by Herman Sangivera ( Papuan Trader )
Overview
Visual Pro Trend Master is a high-precision quantitative trading strategy specifically engineered for scalpers operating on lower timeframes (1m, 3m, 5m). The strategy focuses on execution efficiency with a fixed 1:2 Risk-to-Reward (RR) Ratio, powered by a multi-layered filtration system designed to eliminate "whipsaws" and fake signals commonly found in sideways markets.
By integrating institutional volume confirmation (VWAP), trend momentum (ADX Slope), and dynamic volatility sensing (Bollinger Band Squeeze), this script ensures that entries are only triggered when the market exhibits high-probability directional intent.
Key Technical Features
Anti-Sideways Engine: Utilizes Bollinger Band Width to calculate market compression. The strategy automatically enters "standby mode" during a Squeeze, filtering out low-volatility traps.
Trend Acceleration Filter: Not only does it check for ADX strength, but it specifically looks for a rising ADX slope. This ensures you enter as momentum is building, not when it is exhausting.
Institutional Alignment (VWAP): Acts as the ultimate trend arbiter. The strategy restricts Long positions to prices above VWAP and Short positions to prices below VWAP.
Dynamic Risk Management (1:2 RR): Stop Loss (SL) is mathematically determined by the Average True Range (ATR) to account for current market noise. The Take Profit (TP) is automatically set at 2x the risk distance.
Professional UI Dashboard: A real-time heads-up display (HUD) in the corner of your chart showing Trend Status, ADX Power, and active Risk Ratios.
Visual Interpretation
Trend Ribbon (Green/Red): Displays the primary trend zone between EMAs. A gray ribbon indicates a transition or a non-trending phase.
Candle Color Coding: Real-time bar coloring provides instant psychological confirmation of trend strength.
Gray Background Shading: Indicates a Bollinger Squeeze. This is a "No-Trade Zone" where fakeouts are most likely to occur.
Fuchsia Line (VWAP): The "Line in the Sand" for institutional sentiment.
Execution Guide
Best Timeframes: 1-Minute, 3-Minute, or 5-Minute.
Recommended Assets: High-liquidity pairs such as Gold (XAUUSD), Major Forex (EURUSD, GBPUSD), and Top-tier Crypto (BTCUSDT, ETHUSDT).
Optimization Tips: * Optimal performance is usually seen during the London and New York session overlaps.
Monitor the Dashboard: If ADX Power is below 25, the market lacks the "fuel" needed to hit a 1:2 TP.
Disclaimer
While this strategy includes advanced risk management and volatility filters, past performance does not guarantee future results. It is highly recommended to paper-trade this strategy first to understand its behavior during high-impact news events.

Scalping Reaper Elite- by Herman Sangivera ( Papua ) Scalping Reaper Elite by Herman Sangivera ( Papuan Trader )
Overview
Scalping Reaper Elite V5 is a high-precision quantitative trading strategy specifically engineered for scalpers operating on lower timeframes (1m, 3m, 5m). The strategy focuses on execution efficiency with a fixed 1:2 Risk-to-Reward (RR) Ratio, powered by a multi-layered filtration system designed to eliminate "whipsaws" and fake signals commonly found in sideways markets.
By integrating institutional volume confirmation (VWAP), trend momentum (ADX Slope), and dynamic volatility sensing (Bollinger Band Squeeze), this script ensures that entries are only triggered when the market exhibits high-probability directional intent.
Key Technical Features
Anti-Sideways Engine: Utilizes Bollinger Band Width to calculate market compression. The strategy automatically enters "standby mode" during a Squeeze, filtering out low-volatility traps.
Trend Acceleration Filter: Not only does it check for ADX strength, but it specifically looks for a rising ADX slope. This ensures you enter as momentum is building, not when it is exhausting.
Institutional Alignment (VWAP): Acts as the ultimate trend arbiter. The strategy restricts Long positions to prices above VWAP and Short positions to prices below VWAP.
Dynamic Risk Management (1:2 RR): Stop Loss (SL) is mathematically determined by the Average True Range (ATR) to account for current market noise. The Take Profit (TP) is automatically set at 2x the risk distance.
Professional UI Dashboard: A real-time heads-up display (HUD) in the corner of your chart showing Trend Status, ADX Power, and active Risk Ratios.
Visual Interpretation
Trend Ribbon (Green/Red): Displays the primary trend zone between EMAs. A gray ribbon indicates a transition or a non-trending phase.
Candle Color Coding: Real-time bar coloring provides instant psychological confirmation of trend strength.
Gray Background Shading: Indicates a Bollinger Squeeze. This is a "No-Trade Zone" where fakeouts are most likely to occur.
Fuchsia Line (VWAP): The "Line in the Sand" for institutional sentiment.
Execution Guide
Best Timeframes: 1-Minute, 3-Minute, or 5-Minute.
Recommended Assets: High-liquidity pairs such as Gold (XAUUSD), Major Forex (EURUSD, GBPUSD), and Top-tier Crypto (BTCUSDT, ETHUSDT).
Optimization Tips: * Optimal performance is usually seen during the London and New York session overlaps.
Monitor the Dashboard: If ADX Power is below 25, the market lacks the "fuel" needed to hit a 1:2 TP.
Disclaimer
While this strategy includes advanced risk management and volatility filters, past performance does not guarantee future results. It is highly recommended to paper-trade this strategy first to understand its behavior during high-impact news events.

Institutional Alpha Vector | D_QUANT Institutional Alpha Vector | D_QUANT
Overview
The Institutional Alpha Vector (IAV) is an original trend-following framework that replaces single-indicator bias with a Weighted Composite Score . Instead of relying on a simple moving average, this script aggregates four distinct quantitative dimensions—Price, Momentum, Volatility, and Volume—into a normalized value called the "Alpha Vector."
The goal of this tool is to identify "Institutional Consensus"—periods where multiple mathematical models align in the same direction, reducing the likelihood of false breakouts in choppy markets.
How It Works: The Quantitative Engines
The script calculates four independent signals. For each module, a state is stored (1 for Bullish, -1 for Bearish, 0 for Neutral).
1. Price Filter (Hull Moving Average):
The script uses an HMA (a weighted moving average that reduces lag by using the square root of the period). A signal is triggered when the price crosses over/under this "Spine."
2. Volatility Regime (RMA + ATR):
This module uses a Moving Average (RMA) combined with an Average True Range (ATR) offset. It acts as a volatility filter that price must move beyond 1 ATR from the mean to register a trend, ensuring the market isn't just "drifting."
3. Momentum Physics (ADX/DMI):
Based on J. Welles Wilder’s Directional Movement Index. It checks if the is above (or vice versa) but only if the ADX (Average Directional Index) is above a user-defined threshold (default: 10), confirming the presence of a strong trend.
4. Institutional Flow (Chaikin Money Flow):
This confirms price action with volume. It calculates the accumulation/distribution of money flow over a specific period. A signal is only valid if the CMF is positive (Bullish) or negative (Bearish).
The Alpha Vector Calculation
This is the core "originality" of the script. The indicator takes the active modules and calculates a Composite Score :
This results in a value between -1.0 and +1.0 .
* High Confidence Long: When the score exceeds +0.1 (adjustable).
* High Confidence Short: When the score drops below -0.1 (adjustable).
* Neutral Zone: When the score is near 0, the script colors the bars grey, signaling a lack of institutional consensus.
Visual Intelligence: The "Electric Conduit"
The script visualizes market energy through a custom rendering engine:
* The Spine: A central line representing the HMA trend.
* The Conduit (Fill): A dynamic gradient that expands or contracts based on the ATR (Average True Range) . This allows traders to see "volatility expansion" (wide ribbon) vs "compression" (tight ribbon) at a glance.
* Bar Coloring : Automatically aligns the chart candles with the Alpha Vector state to remove cognitive load.
How to Use
1. Define your Strategy: In the settings, you can toggle specific modules. If you are trading a low-volume asset, you might disable the **CMF** module.
2. Identify the Consensus: Look for the ribbon to change from Grey (Neutral) to Cyan/Gold.
3. Monitor the HUD: A small dashboard in the bottom right displays the live Alpha Vector score. A score of 1.0 means all four engines are in 100% bullish agreement.
Disclaimer: Trading involves significant risk. This tool is for educational and analytical purposes and does not constitute financial advice.

XAUUSD Psych Zones (0/25/50/75)This indicator plots psychological quarter levels on XAUUSD (0 / 25 / 50 / 75) and highlights them as tradable zones.
Each level is displayed as a horizontal zone with a midpoint line, designed for support & resistance, break-and-retest, and reaction-based trading on gold.
Zones extend across the chart and are sized using a custom pip definition (default: 1 pip = 1.00, ±5 pips each side).

Crypto Precision Signals "Crypto Precision Signals - Reliable" Script Comprehensive Documentation
This document aims to clearly and objectively explain the functional principles, design logic, and usage methods of the "Crypto Precision Signals - Reliable" Pine Script. We adhere to principles of transparency and pragmatism. All descriptions are based on publicly available technical analysis theories, and we make no promises regarding any definitive profit performance. Final trading decisions should be made independently by the user based on comprehensive market analysis.
I. Core Design Philosophy and Originality
The originality of this script lies not in creating new analytical indicators, but in constructing a decision-making framework based on multi-dimensional condition confluence and systematic risk control. Its core philosophy is: a signal from a single indicator has limited reliability, whereas signals from different analytical dimensions (trend, momentum, overbought/oversold levels, market participation) can, when converging under specific rules, potentially identify higher-probability trading environments. Furthermore, the script encourages more disciplined trading through mandatory cooldown mechanisms and visual state tracking.
II. Detailed Explanation of Integration Rationale and Synergistic Operation Mechanism
The script integrates four classic technical elements, and their selection and combination have clear logical justification:
1. Trend & Momentum Foundation Layer: MACD
Integration Rationale: MACD is a classic tool for identifying trend direction, momentum strength, and potential turning points. The crossover of its fast and slow lines is an intuitive representation of momentum change, providing the initial "action signal" for the system.
Synergistic Mechanism: In this script, a MACD golden cross or death cross is one of the primary conditions for triggering a potential buy or sell signal. It acts as the system's "engine," responsible for identifying the initiation of market momentum.
2. Overbought/Oversold & Auxiliary Trigger Layer: RSI
Integration Rationale: RSI measures the speed and magnitude of price changes to gauge overbought or oversold market conditions. It complements the trend-following MACD by providing reference points for market sentiment extremes.
Synergistic Mechanism: The script innovatively sets RSI extremes (<30 oversold, >70 overbought) as trigger conditions parallel to MACD crossovers. This means the system can capture not only trend initiation points but also potential reversal opportunities from extreme sentiment (e.g., a buy point after a pullback to key support within an uptrend due to short-term oversold conditions). MACD and RSI together form a dual-trigger engine of "trend momentum" and "market sentiment."
3. Trend Filter Layer: 50-Period Simple Moving Average (SMA)
Integration Rationale: "Trading with the trend" is a core tenet of technical analysis. The SMA-50 is widely used as a benchmark for medium-term trends.
Synergistic Mechanism: This layer acts as a strict "direction filter." All potential signals generated by MACD or RSI must pass the SMA-50 test:
Buy Signal: The current price must be above the SMA-50, ensuring the trade attempt aligns with the potential medium-term uptrend.
Sell Signal: The current price must be below the SMA-50, ensuring the trade attempt aligns with the potential medium-term downtrend.
This mechanism effectively filters out numerous counter-trend, high-risk reversal attempts, focusing the system on "trading with the major trend" opportunities.
4. Volume Confirmation Layer: Dynamic Volume Average
Integration Rationale: Volume is key to gauging market participation and the authenticity of price movements. Price breakouts or signals lacking volume support are often weak.
Synergistic Mechanism: This is the key validation layer of the script. The system calculates a 30-period average volume and allows users to set a multiplier (default 2.0). A signal is only finally confirmed when the trigger condition (from MACD or RSI) occurs simultaneously with the current bar's volume being significantly higher than the recent average (i.e., a "volume spike"). This validation ensures the signal is supported by broad market participation, aiming to increase the signal's credibility and reduce "false breakouts" or whipsaws caused by low liquidity.
Synergistic Operation Summary:
The script operates like a multi-stage screening funnel:
Signal Trigger: Initiated by a MACD crossover or RSI entering an extreme zone.
Preliminary Trend Screening: The price location of the trigger signal must pass the SMA-50 trend filter (buy above, sell below).
Energy Validation: Concurrently with the above conditions, a volume spike must provide confirmation.
Final Output: Only when all conditions are met simultaneously is a visual "BUY" or "SELL" label generated.
III. Control & Auxiliary Layers: Enhancing Disciplined Use
Beyond the signal generation logic, the script includes two original designs to enhance practicality:
Signal Frequency Controller (Cooldown Period):
Mechanism: After generating a valid signal, the system enters a user-adjustable "cooldown period" (default 5 bars). No new signals of the same type will be generated during this period.
Purpose: Forces a reduction in trading frequency, prevents signal overload during high volatility or ranging markets, encourages waiting for higher-quality, more spaced-out opportunities, and helps avoid emotional overtrading.
Visual State Tracker (Bar Coloring):
Mechanism: The system internally tracks the state of the last valid signal (buy or sell). After a buy signal, subsequent bars are tinted light blue; after a sell signal, subsequent bars are tinted light orange, until the next opposing signal appears.
Purpose: Provides the user with an intuitive visual reference for the "signal validity period" or "observation phase," helping to quickly identify which stage the market is in according to the system's logic and assisting in gauging market rhythm.
IV. Functional Purpose and Usage Method
Core Purpose: Serves as an auxiliary decision-making tool for swing trading or trend-pullback entries, suitable for timeframes of 1 hour and above. It filters for potential trade nodes that combine trend alignment, momentum, sentiment, and capital interest through multi-condition confluence.
Usage Process:
Loading: Add the script to a TradingView chart.
Observation: Watch for "BUY/SELL" labels confirmed by a "volume spike" and aligned with the trend direction.
Analysis: Never treat signals as direct trading orders. Always analyze the signal within the broader market context:
Check if the signal occurs near key support or resistance levels.
Observe the candlestick patterns (e.g., Pin Bar, Engulfing patterns) on the signal bar and its vicinity.
Assess the overall market structure on higher timeframes.
Decision & Risk Control: Only consider using the signal as an entry reference if it aligns with conclusions from your other analysis tools. Any trade must have a clearly defined stop-loss level set in advance and proper position sizing/risk management.
V. Important Disclaimer
This script is a technical analysis辅助 tool. Its signals are calculated based on historical data and mathematical formulas. Financial markets carry inherent risks, and past performance is in no way indicative of future results. Users must understand that all trading decisions carry the possibility of loss. The developer assumes no responsibility for any trading activities conducted by users based on this script or their outcomes. Please use it prudently under a full understanding of its logic and associated risks.

Smart Trader, Episode 04, by Ata Sabanci, Candles and Z ScoresSmart Trader, Episode 04
Candles and Z-Scores: A Statistical Approach to Market Analysis
━━━━━━━━━━━━━━━━━━━━━━━━━━━━━━━━━━━━━━━━━━━
OVERVIEW
This indicator applies Z-Score statistical analysis to measure how unusual current market conditions are compared to historical norms. It simultaneously analyzes five key metrics: Price, Total Volume, Buy Volume, Sell Volume, and Delta (Buy minus Sell) . The system detects 60 academically-researched market scenarios and provides visual feedback through Z-Lines (support/resistance levels), Event Markers, Trend Channels, and a comprehensive Dashboard.
━━━━━━━━━━━━━━━━━━━━━━━━━━━━━━━━━━━━━━━━━━━
CORE CONCEPT: WHY Z-SCORE?
A Z-Score measures how many standard deviations a value is from its mean. In financial markets, extreme Z-Scores indicate statistically rare events that often precede significant price movements.
Mathematical Formula:
Z = (Current Value - Mean) / Standard Deviation
Interpretation:
• Z ≥ +2.0: Extremely high (occurs approximately 2.5% of the time)
• Z ≥ +1.0: Above average
• Z ≈ 0: Normal (near the mean)
• Z ≤ -1.0: Below average
• Z ≤ -2.0: Extremely low (occurs approximately 2.5% of the time)
━━━━━━━━━━━━━━━━━━━━━━━━━━━━━━━━━━━━━━━━━━━
ACADEMIC FOUNDATION
This indicator is inspired by / grounded in market microstructure literature (abbreviated citations in-script) from market microstructure literature:
• Price-Volume Relationship - Karpoff (1987), Journal of Financial and Quantitative Analysis, Cambridge
Volume is positively correlated with price change magnitude
• Order Flow Imbalance - Cont, Kukanov, Stoikov (2014), Journal of Financial Econometrics
Order imbalance drives price more reliably than raw volume
• Informed Trading (PIN Model) - Easley, Kiefer, O'Hara, Paperman (1996), Journal of Finance
Buy/Sell imbalance reveals informed trader activity
• Mixture of Distributions - Tauchen & Pitts (1983), Clark (1973)
Volume clusters with volatility regimes
• Volume Predictability - Gervais, Kaniel, Mingelgrin (2001)
Volume shocks predict future returns
• Liquidity & Order Imbalance - Chordia, Roll, Subrahmanyam (2002)
Order imbalance affects short-term returns
• Volume-Return Dynamics - Llorente, Michaely, Saar, Wang (2002)
Speculation vs. risk-sharing patterns
• Reversal vs. Continuation - Campbell, Grossman, Wang (MIT)
High volume predicts lower autocorrelation
━━━━━━━━━━━━━━━━━━━━━━━━━━━━━━━━━━━━━━━━━━━
VOLUME ENGINE
The indicator offers two methods for decomposing total volume into Buy and Sell components:
Method 1: Geometry (Approximation)
Uses candle structure to estimate buying and selling pressure:
Buy Volume = Total Volume × (Close - Low) / (High - Low)
Sell Volume = Total Volume × (High - Close) / (High - Low)
• Works on all instruments without additional data requirements
• Fast calculation
• Less precise than intrabar method
Method 2: Intrabar (Precise)
Uses Lower Timeframe (LTF) tick/second data to aggregate actual up-ticks versus down-ticks:
• More accurate volume decomposition
• Requires LTF data availability
• Configurable LTF: 1T (tick), 1S, 15S, 1M
Delta Calculation:
Delta = Buy Volume - Sell Volume
━━━━━━━━━━━━━━━━━━━━━━━━━━━━━━━━━━━━━━━━━━━
Z-SCORE SYSTEM
The system calculates Z-Scores for five metrics simultaneously, using a configurable lookback period (default: 20 bars):
• Zp (Price Z-Score): Measures price deviation from its mean
• Zv (Volume Z-Score): Measures total volume deviation
• Zbuy (Buy Volume Z-Score): Measures buying pressure deviation
• Zsell (Sell Volume Z-Score): Measures selling pressure deviation
• ZΔ (Delta Z-Score): Measures order flow imbalance deviation
Threshold Constants:
• ZH (Z High) = 2.0: Extreme threshold
• ZM (Z Medium) = 1.0: Moderate threshold
• Z0 (Z Zero) = 0.5: Near-zero threshold
Group System:
The analysis window is divided into groups (default: 5 groups × 20 bars = 100 bar total window). Group numbers (1, 2, 3...) are displayed above candles when enabled, helping identify the relative age of detected levels.
━━━━━━━━━━━━━━━━━━━━━━━━━━━━━━━━━━━━━━━━━━━
Z-LINES (SUPPORT/RESISTANCE LEVELS)
When any metric reaches an extreme Z-Score, the system marks that price level as a significant support or resistance zone.
Detection Logic:
• Upper Z-Line: Drawn from the HIGH when Z ≥ upper threshold (default +2.0)
• Lower Z-Line: Drawn from the LOW when Z ≤ lower threshold (default -2.0)
Multi-Metric Detection:
Z-Lines can be triggered by any of the five metrics (Price, Volume, Buy, Sell, Delta). When multiple metrics trigger at similar price levels, they are clustered together into a single combined label showing all contributing metrics.
Persistence:
Z-Lines persist for the entire analysis window (Period × Groups bars) and are NOT removed when price touches them. This allows traders to see historical support/resistance levels that may still be relevant.
Anti-Overlap System:
Labels are automatically repositioned to prevent overlap. The "Label Min Gap (%)" setting controls minimum vertical separation between ALL labels (both upper and lower), ensuring readability even when multiple levels cluster together.
━━━━━━━━━━━━━━━━━━━━━━━━━━━━━━━━━━━━━━━━━━━
EVENT DETECTION ENGINE (60 SCENARIOS)
The system analyzes 60 distinct market scenarios based on Z-Score combinations. Each scenario is derived from academic research and assigned a confidence score based on signal strength and alignment.
Notation:
• Zp = Price Z-Score
• Zv = Total Volume Z-Score
• Zbuy = Buy Volume Z-Score
• Zsell = Sell Volume Z-Score
• ZΔ = Delta Z-Score
• dirP = Price direction (+1 if Zp > 0.5, -1 if Zp < -0.5, else 0)
• = Previous bar value
• ZH = 2.0 (High threshold)
• ZM = 1.0 (Medium threshold)
• Z0 = 0.5 (Zero threshold)
─────────────────────────────────────────────────────────────
CATEGORY A: PRICE-VOLUME (Events 1-10)
Based on: Karpoff (1987), Tauchen-Pitts (1983), Clark (1973)
─────────────────────────────────────────────────────────────
Event 1: Breakout Confirmed
|Zp| ≥ ZH AND Zv ≥ ZH AND sign(ZΔ) = dirP AND dirP ≠ 0
Direction: Bullish/Bearish (follows price direction)
Event 2: Trend Strength Confirmed
|Zp| ≥ ZH AND Zv ≥ ZH
Direction: Follows price direction
Event 3: Fragile Move
|Zp| ≥ ZH AND Zv ≤ -ZM
Direction: Warning (price move without volume support)
Event 4: Weak Rally
Zp ≥ ZH AND Zv ≤ -ZH
Direction: Warning (price up without volume)
Event 5: Weak Selloff
Zp ≤ -ZH AND Zv ≤ -ZH
Direction: Warning (price down without volume)
Event 6: Momentum Build
ZM ≤ |Zp| < ZH AND Zv ≥ ZH
Direction: Follows price direction
Event 7: Churn
|Zp| ≤ Z0 AND Zv ≥ ZH
Direction: Neutral (high volume, low price movement)
Event 8: Quiet Compression
|Zp| ≤ Z0 AND Zv ≤ -ZH
Direction: Neutral (low volume, low price movement)
Event 9: High Volume Regime
Zv ≥ ZH
Direction: Neutral
Event 10: Low Volume Regime
Zv ≤ -ZH
Direction: Neutral
─────────────────────────────────────────────────────────────
CATEGORY B: ORDER-FLOW / DELTA (Events 11-16)
Based on: Cont, Kukanov, Stoikov (2014), Easley, Kiefer, O'Hara, Paperman (1996)
─────────────────────────────────────────────────────────────
Event 11: Imbalance Drives Price
|ZΔ| ≥ ZH AND sign(ZΔ) = dirP AND dirP ≠ 0
Direction: Follows price direction (dirP), with delta alignment required
Event 12: Divergence Top
Zp ≥ ZH AND ZΔ ≤ -ZH
Direction: Warning (distribution at top)
Event 13: Divergence Bottom
Zp ≤ -ZH AND ZΔ ≥ ZH
Direction: Warning (accumulation at bottom)
Event 14: Absorption Positive
|Zp| ≤ Z0 AND Zv ≥ ZH AND ZΔ ≥ ZH
Direction: Bullish (buy absorption, support forming)
Event 15: Absorption Negative
|Zp| ≤ Z0 AND Zv ≥ ZH AND ZΔ ≤ -ZH
Direction: Bearish (sell absorption, resistance forming)
Event 16: Depth Wall
Zv ≥ ZH AND |ZΔ| ≥ ZH AND |Zp| ≤ Z0
Direction: Neutral (market depth absorbing)
─────────────────────────────────────────────────────────────
CATEGORY C: BUY VS SELL (Events 17-23)
Based on: Easley, Kiefer, O'Hara, Paperman (1996), Chordia, Roll, Subrahmanyam (2002)
─────────────────────────────────────────────────────────────
Event 17: Aggressive Buy Dominance
Zbuy ≥ ZH AND ZΔ ≥ ZH AND Zsell ≤ -ZM
Direction: Bullish
Event 18: Aggressive Sell Dominance
Zsell ≥ ZH AND ZΔ ≤ -ZH AND Zbuy ≤ -ZM
Direction: Bearish
Event 19: Two-Sided Battle
Zbuy ≥ ZH AND Zsell ≥ ZH AND |ZΔ| ≤ Z0
Direction: Neutral (buyers and sellers equally strong)
Event 20: Battle with Buy Edge
Zbuy ≥ ZH AND Zsell ≥ ZH AND ZM ≤ ZΔ < ZH
Direction: Bullish
Event 21: Battle with Sell Edge
Zbuy ≥ ZH AND Zsell ≥ ZH AND -ZH < ZΔ ≤ -ZM
Direction: Bearish
Event 22: Hidden Accumulation
Zbuy ≥ ZH AND |Zp| ≤ Z0 AND Zv ≥ ZH
Direction: Bullish (buy shock without price movement)
Event 23: Hidden Distribution
Zsell ≥ ZH AND |Zp| ≤ Z0 AND Zv ≥ ZH
Direction: Bearish (sell shock without price movement)
─────────────────────────────────────────────────────────────
CATEGORY D: PREDICTABILITY (Events 24-26)
Based on: Gervais, Kaniel, Mingelgrin (2001), Karpoff (1987)
─────────────────────────────────────────────────────────────
Event 24: Volume Shock Positive Drift
Zv ≥ ZH AND |Zp| ≤ ZM
Direction: Follows price direction
Event 25: Volume Shock Negative Drift
Zv ≤ -ZH AND |Zp| ≤ ZM
Direction: Opposite to price direction
Event 26: Abnormal Volume Info Arrival
Zv ≥ ZH
Direction: Neutral
─────────────────────────────────────────────────────────────
CATEGORY E: REVERSAL VS CONTINUATION (Events 27-30)
Based on: Campbell, Grossman, Wang (MIT), Llorente, Michaely, Saar, Wang (2002)
─────────────────────────────────────────────────────────────
Event 27: High Vol Reversal Risk
Zv ≥ ZH
Direction: Warning (high volume implies lower positive autocorrelation)
Event 28: Low Vol Continuation Risk
Zv ≤ -ZH
Direction: Follows price direction (trend likely continues)
Event 29: Speculation Continuation
Zv ≥ ZH AND |ZΔ| ≥ ZM AND sign(ZΔ) = dirP AND dirP ≠ 0
Direction: Follows price direction
Event 30: Risk Sharing Reversal
Zv ≥ ZH AND |ZΔ| ≤ Z0
Direction: Warning (potential reversal)
─────────────────────────────────────────────────────────────
CATEGORY F: IMBALANCE LAG (Events 31-33)
Based on: Chordia, Roll, Subrahmanyam (2002)
─────────────────────────────────────────────────────────────
Event 31: Persistent Imbalance Push
|ZΔ| ≥ ZM AND |ZΔ | ≥ ZM AND sign(ZΔ) = sign(ZΔ )
Direction: Follows delta direction (persistent pressure)
Event 32: Imbalance Pressure Decay
(ZΔ ≥ ZM AND ZΔ ≤ -ZM) OR (ZΔ ≤ -ZM AND ZΔ ≥ ZM)
Direction: Warning (imbalance sign flip)
Event 33: Intraday Imbalance Predicts
|ZΔ| ≥ ZM
Direction: Follows delta direction
─────────────────────────────────────────────────────────────
CATEGORY G: SUPPORT/RESISTANCE (Events 34-36)
Based on: Peskir (Manchester)
─────────────────────────────────────────────────────────────
Event 34: SR Barrier Event
|Zp| ≤ Z0 AND Zv ≥ ZH
Direction: Neutral (price stalls with high volume)
Event 35: Volume Backed SR Level
|Zp| ≤ Z0 AND Zv ≥ ZH AND |ZΔ| ≥ ZM
Direction: Follows delta direction
Event 36: Volume Poor SR Level
|Zp| ≤ Z0 AND Zv ≤ -ZM
Direction: Warning (weak S/R without volume)
─────────────────────────────────────────────────────────────
CATEGORY H: EXTENDED ANALYSIS (Events 37-50)
Based on: Extended market microstructure analysis
─────────────────────────────────────────────────────────────
Event 37: Climax Buy
Zbuy ≥ ZH AND Zp ≥ ZH AND Zv ≥ ZH
Direction: Warning (extreme buying exhaustion, potential top)
Event 38: Climax Sell
Zsell ≥ ZH AND Zp ≤ -ZH AND Zv ≥ ZH
Direction: Warning (extreme selling exhaustion, potential bottom)
Event 39: Stealth Accumulation
Zbuy ≥ ZM AND |Zp| ≤ Z0 AND Zv ≤ Z0
Direction: Bullish (quiet buying)
Event 40: Stealth Distribution
Zsell ≥ ZM AND |Zp| ≤ Z0 AND Zv ≤ Z0
Direction: Bearish (quiet selling)
Event 41: Volume Divergence Bull
Zp ≤ -ZM AND Zv ≤ -ZM
Direction: Bullish (price down but volume declining)
Event 42: Volume Divergence Bear
Zp ≥ ZM AND Zv ≤ -ZM
Direction: Bearish (price up but volume declining)
Event 43: Delta Price Alignment
|Zp| ≥ ZM AND |ZΔ| ≥ ZM AND sign(Zp) = sign(ZΔ)
Direction: Follows price direction (strong trend confirmation)
Event 44: Extreme Compression
|Zp| ≤ Z0 AND Zv ≤ -ZH
Direction: Neutral (very low volatility)
Event 45: Volatility Expansion
|Zp| ≥ ZH AND Zv ≥ ZH
Direction: Follows price direction (breakout from compression)
Event 46: Buy Exhaustion
Zbuy ≥ ZH AND Zp ≤ Z0
Direction: Warning (high buy but price fails)
Event 47: Sell Exhaustion
Zsell ≥ ZH AND Zp ≥ -Z0
Direction: Warning (high sell but price holds)
Event 48: Trend Acceleration
|Zp| ≥ ZM AND |Zp| > |Zp | AND Zv ≥ ZM
Direction: Follows price direction (increasing momentum)
Event 49: Trend Deceleration
|Zp| ≥ ZM AND |Zp| < |Zp | AND sign(Zp) = sign(Zp )
Direction: Warning (decreasing momentum)
Event 50: Multi Divergence
(Zp ≥ ZM AND ZΔ ≤ -ZM) OR (Zp ≤ -ZM AND ZΔ ≥ ZM) + |Zp| ≥ ZM AND Zv ≤ -ZM
Direction: Warning (multiple divergence signals)
─────────────────────────────────────────────────────────────
CATEGORY I: TREND-INTEGRATED (Events 51-60)
Based on: Combined price-volume-delta trend analysis
─────────────────────────────────────────────────────────────
Event 51: Trend Breakout Confirmed
|Zp| ≥ ZH AND Zv ≥ ZH AND |ZΔ| ≥ ZM AND sign(ZΔ) = dirP AND dirP ≠ 0
Direction: Follows price direction
Event 52: Trend Support Test
Zp ≥ ZM AND Z0 ≤ Zp < ZM AND ZΔ ≥ Z0
Direction: Bullish (pullback in uptrend)
Event 53: Trend Resistance Test
Zp ≤ -ZM AND -ZM < Zp ≤ -Z0 AND ZΔ ≤ -Z0
Direction: Bearish (rally in downtrend)
Event 54: Trend Reversal Signal
sign(Zp) ≠ sign(Zp ) AND |Zp| ≥ ZM AND |Zp | ≥ ZM
Direction: Follows new price direction (momentum flip)
Event 55: Channel Absorption
|Zp| ≤ Z0 AND Zv ≥ ZH
Direction: Neutral (range-bound with volume)
Event 56: Trend Continuation Volume
|Zp| ≥ ZM AND Zv ≥ ZM AND sign(ZΔ) = dirP AND dirP ≠ 0
Direction: Follows price direction (healthy trend with volume)
Event 57: Trend Exhaustion
|Zp| ≥ ZM AND Zv ≤ -ZM AND |Zp| < |Zp |
Direction: Warning (trend losing steam)
Event 58: Range Breakout Pending
|Zp| ≤ Z0 AND Zv ≤ -ZH AND |ZΔ| ≥ ZM
Direction: Follows delta direction (compression with imbalance)
Event 59: Trend Quality High
|Zp| ≥ ZM AND sign(ZΔ) = dirP AND Zv ≥ Z0 AND dirP ≠ 0
Direction: Follows price direction (strong aligned signals)
Event 60: Trend Quality Low
|Zp| ≥ ZM AND sign(ZΔ) ≠ dirP AND dirP ≠ 0
Direction: Warning (conflicting signals)
━━━━━━━━━━━━━━━━━━━━━━━━━━━━━━━━━━━━━━━━━━━
TREND CHANNEL SYSTEM
The trend channel system is adapted from Smart Trader Episode 03 to provide consistent visual context for price action analysis.
How It Works:
• Divides the chart into blocks based on Z-Score groups
• Calculates OHLC (Open, High, Low, Close) for each block
• Detects Higher Highs/Higher Lows (uptrend) or Lower Highs/Lower Lows (downtrend) patterns
• Draws channel lines connecting block extremes
• Classifies by angle: steep angles indicate trends, flat angles indicate ranges
Channel Classifications:
• UPTREND: Higher highs and higher lows detected
• DOWNTREND: Lower highs and lower lows detected
• RANGE: Channel angle below threshold (default 10 degrees)
Label Information:
• Trend direction (UPTREND/DOWNTREND/RANGE)
• Channel boundary prices
• Distance from current price (absolute and percentage)
• Channel angle in degrees
━━━━━━━━━━━━━━━━━━━━━━━━━━━━━━━━━━━━━━━━━━━
DASHBOARD
The dashboard provides a comprehensive real-time view of all Z-Score metrics and detected events.
Dashboard Sections:
1. Header Row
Displays indicator name and current calculation mode (CLOSED or LIVE).
2. Metric Rows (Price, Total Volume, Buy Volume, Sell Volume, Delta)
Each row displays:
• Value: Current metric value
• Z: Calculated Z-Score
• Visual: Graphical Z-bar showing position relative to mean
• Status: Interpretation (Extreme High, Above Avg, Normal, Below Avg, Extreme Low)
• Upper: Oldest active upper Z-Line in window (Label Mirror)
• Lower: Oldest active lower Z-Line in window (Label Mirror)
3. Event Detection Section
• Count of triggered events out of 60 total scenarios
• Market Bias: Bull/Bear/Neutral percentage with visual bar
• Strongest Event: Highest confidence event currently triggered
• #2 Event: Second highest confidence event
4. Footer
Shows engine type (Geometry/Intrabar), Z-Score period, calculation basis, and number of valid bars.
━━━━━━━━━━━━━━━━━━━━━━━━━━━━━━━━━━━━━━━━━━━
ALERT SYSTEM
The indicator uses native alertcondition() functions, keeping the settings menu clean while providing comprehensive alert options in TradingView's alert dialog.
Available Alert Categories:
• Master Alerts: Any event, Any bullish, Any bearish, Any warning
• Single Event Alerts: Individual alerts for key events (Breakout, Climax, Divergence, etc.)
• Category Alerts: Alerts by event category (Price-Volume, Order-Flow, etc.)
• Confluence Alerts: 2+, 3+, 4+, or 5+ aligned events
• Bias Shift Alerts: 10%, 20%, or 30% shifts in market bias
• High Confidence Alerts: Events with 60%+, 70%+, 80%+, or 90%+ confidence
• Divergence Alerts: Price vs Volume or Price vs Delta divergences
━━━━━━━━━━━━━━━━━━━━━━━━━━━━━━━━━━━━━━━━━━━
DATA ACCURACY AND LIMITATIONS
This indicator is 100% VOLUME-BASED and requires Lower Timeframe (LTF) intrabar data for accurate calculations when using the Intrabar method.
Data Accuracy Levels:
• 1T (Tick): Most accurate, real volume distribution per tick
• 1S (1 Second): Reasonably accurate approximation
• 15S (15 Seconds): Good approximation, longer historical data available
• 1M (1 Minute): Rough approximation, maximum historical data range
Backtest and Replay Limitations:
• Replay mode results may differ from live trading due to data availability
• For longer backtest periods, use higher LTF settings (15S or 1M)
• Not all symbols/exchanges support tick-level data
• Crypto and Forex typically have better LTF data availability than stocks
A Note on Data Access:
Higher TradingView plans provide access to more historical intrabar data, which directly impacts the accuracy of volume-based calculations. More precise volume data leads to more reliable calculations.
━━━━━━━━━━━━━━━━━━━━━━━━━━━━━━━━━━━━━━━━━━━
LANGUAGE SUPPORT (TRI-LINGUAL UI)
This indicator includes a built-in language switch with three interface languages :
• English (EN)
• Türkçe (TR)
• 한국어 (KO)
The selected language updates key interface text such as the Dashboard headers/rows , tooltips , and the Event Engine outputs (event names, category names, and direction labels). Turkish diacritics and Korean Hangul are supported for clean, native readability.
Why only three languages?
Each additional language requires duplicating strings throughout the code, which increases script size/memory usage and compilation time. To keep the indicator optimized and responsive, language options are intentionally limited to three.
━━━━━━━━━━━━━━━━━━━━━━━━━━━━━━━━━━━━━━━━━━━
⚠️ DISCLAIMER
FOR EDUCATIONAL AND RESEARCH PURPOSES ONLY
This indicator is designed as an educational and research tool based on academic market microstructure literature. It is NOT financial advice and should NOT be used as the sole basis for trading decisions.
Important Notices:
• Past performance does not guarantee future results
• All trading involves risk of substantial loss
• The indicator's signals are statistical probabilities, not certainties
• Always conduct your own research and consult qualified financial advisors
• The creator assumes no responsibility for trading losses
Research Sources:
This indicator is built upon peer-reviewed academic research from:
• Journal of Financial and Quantitative Analysis (Cambridge University Press)
• Journal of Finance
• Journal of Financial Econometrics
• MIT Working Papers
• arXiv Financial Mathematics
