Open Interest:CME e-o-d vs CFTC e-o-wCFTC only publishes total OI on fridays, related to last Tuesday.
But what happened since last Tuesday?
CME Vol & Open Interest data is recorded&exported daily by quandl.com to tradingview
via the che CHRIS/CME datasets
www.quandl.com
Eg. Nat Gas next outstanding cntract n. 20, field n. 7(OI)
@quandl.com:
www.quandl.com
is exported @tradingview:
www.tradingview.com
Every outstanding contract's OI & vol is exported (black column), but not the total (yellow line):
tiny.cc
This script sums up all the existing outstanding contract's OI for the future (the black column), so one can have an idea of the total OI for the day (Yellow line).
As numer of outstanding contracts varies from future to future,Eg:
E-mini (ES) has 4 contracts, Gold(GC) 16 cntrcts, NatGas(NG) has 43, WTI(CL) has 38 etc
the scrips tries to guess how many exist for it and sums them up, to have the total OI for tha day
Number ofoutstanding contracts exported by quandl.com to tradingview is taken from
s3.amazonaws.com
There are 2 params you can enter on the script:
* override the ticket symbol on the chart ,if script cannot guessit or you need a different one
* enter the "preliminary" OI that is published by CME early the next day, butb not yet exported by quandl to tradingview
This script is Open so anyone can copy and modifyit for its use.
Please post comments and ideas if you find it useful
I try to keep a log of my work here:
Pesquisar nos scripts por "Futures"

Colored Volume Bars All Markets: Combining Volume SourcesUsing volume in Forex is potentially misleading as we are only provided the broker volume or futures exchange volume for the currency or commodity in a decentralised market. This code combines the volumes from FXCM, Onanda and futures for the instrument being studied. The combination of the volumes could improve the reliability of the volume being considered. Using this approach other volume indicators can also be improved.

Bitmex Bitcoin BasisInspired by the Ugly Old Goat's articles about the Bitcoin basis - medium.com
with the help of @Plumptoiletduck this indicator was created to show the Bitmex futures premium or discount.
Note you need to add in the new futures ticker every 3 months.

ACM22 not repaintedДелал данный скрипт для FORTS.Идеально подойдет тем,кто использует трейлинг стопы.В основе стратегии лежит RSI.Как по мне,хорошая вещь для проверки стратегии и ее оптимизиации.На скрине 50 контрактов,так что не сильно радуйтесь,а просто делите на 50 и получите показатели на 1 контракт.
Script make for futures on MICEX.U can change paramets of RSI,traling stop and stop loss .On a ps 50 futures USDollar-russian ruble.Use for testing and optimisation.

Vertical Horizontal Filter BacktestVertical Horizontal Filter was initiated by Adam White. It was first published
in a magazine called “Issues of Futures” in August, 1991. The Vertical Horizontal
Filter (VHF) is a very common Indicator used by traders to find out the Phase of
a Price Trend. Normally, a price trend can be in a Trending Phase or a Congestion
Phase/Choppy Movement Phase. Adam White created this particular Technical Indicator
to determine whether prices are trending in a particular direction or are they going
through a transitional period. He used it to measure the range of Futures available
in the market.
You can change long to short in the Input Settings
WARNING:
- For purpose educate only
- This script to change bars colors.

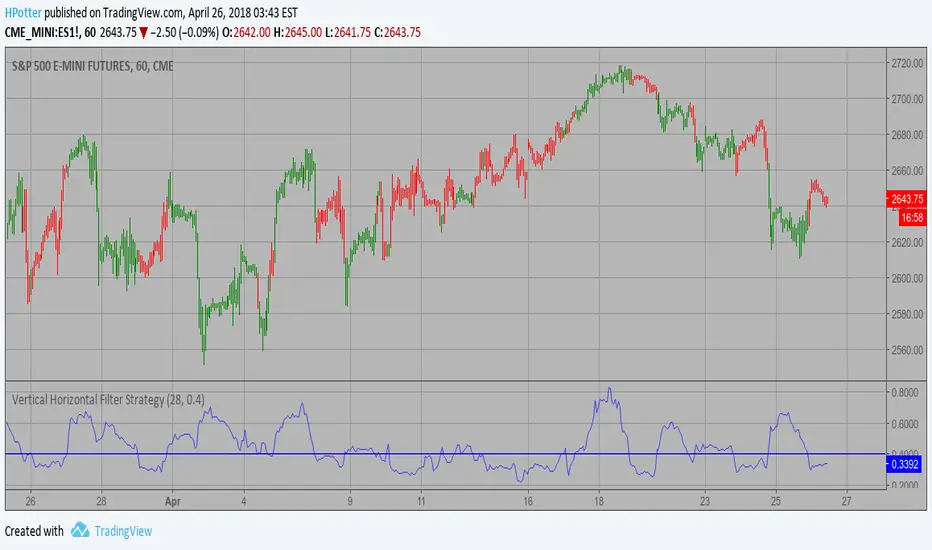
Vertical Horizontal Filter Strategy Vertical Horizontal Filter was initiated by Adam White. It was first published
in a magazine called “Issues of Futures” in August, 1991. The Vertical Horizontal
Filter (VHF) is a very common Indicator used by traders to find out the Phase of
a Price Trend. Normally, a price trend can be in a Trending Phase or a Congestion
Phase/Choppy Movement Phase. Adam White created this particular Technical Indicator
to determine whether prices are trending in a particular direction or are they going
through a transitional period. He used it to measure the range of Futures available
in the market.
WARNING:
- This script to change bars colors.
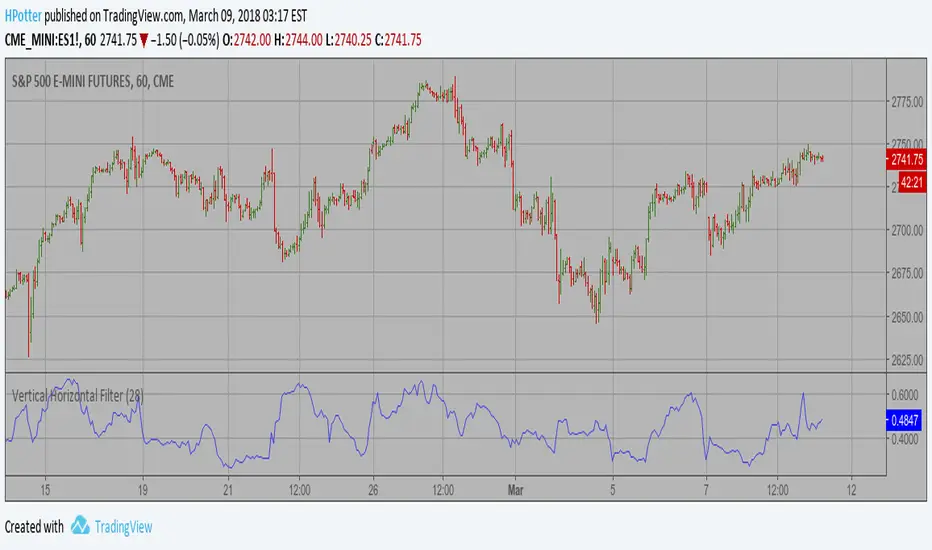
Vertical Horizontal Filter Vertical Horizontal Filter was initiated by Adam White. It was first published
in a magazine called “Issues of Futures” in August, 1991. The Vertical Horizontal
Filter (VHF) is a very common Indicator used by traders to find out the Phase of
a Price Trend. Normally, a price trend can be in a Trending Phase or a Congestion
Phase/Choppy Movement Phase. Adam White created this particular Technical Indicator
to determine whether prices are trending in a particular direction or are they going
through a transitional period. He used it to measure the range of Futures available
in the market.
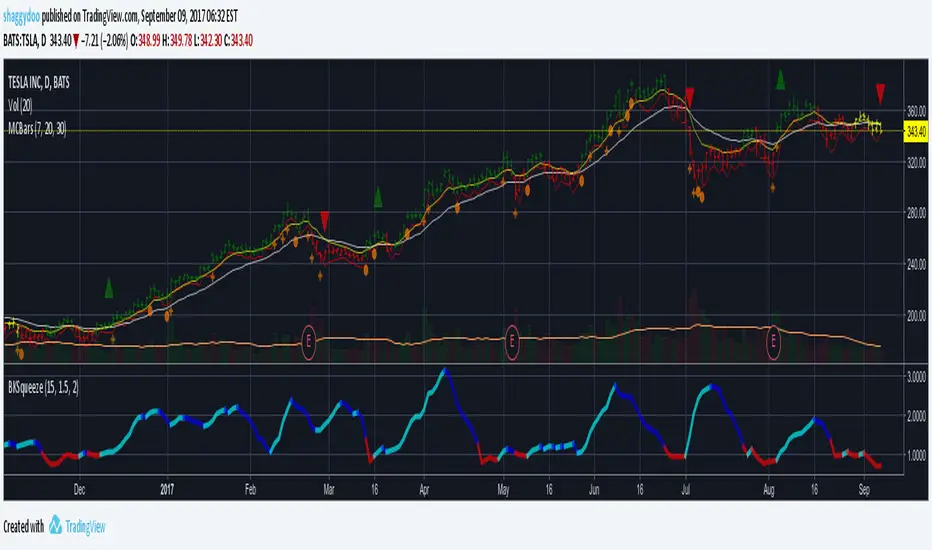
BKSqueezeThis is a price volatility compression and expansion indicator that uses the ratio of the Bollinger Band and Keltner Ratio.
Red segments indicate extreme price volatility compression that can be ideal entry points for stock/futures/forex and/or options positions.
Aqua segments indicate price volatility is expanding.
Blue segments indicate price volatility is compressing - can be used as an exit point or partial scale out point.
Note that the indicator doesn't indicate direction. One suggestion is to use the DMI indicator for this purpose - really depends on how early you enter the trade.
Suggest using a time period of 15 bars for volatile stocks, such as TSLA for example, otherwise a period of 20 bars suits most stocks/futures/forex symbols.
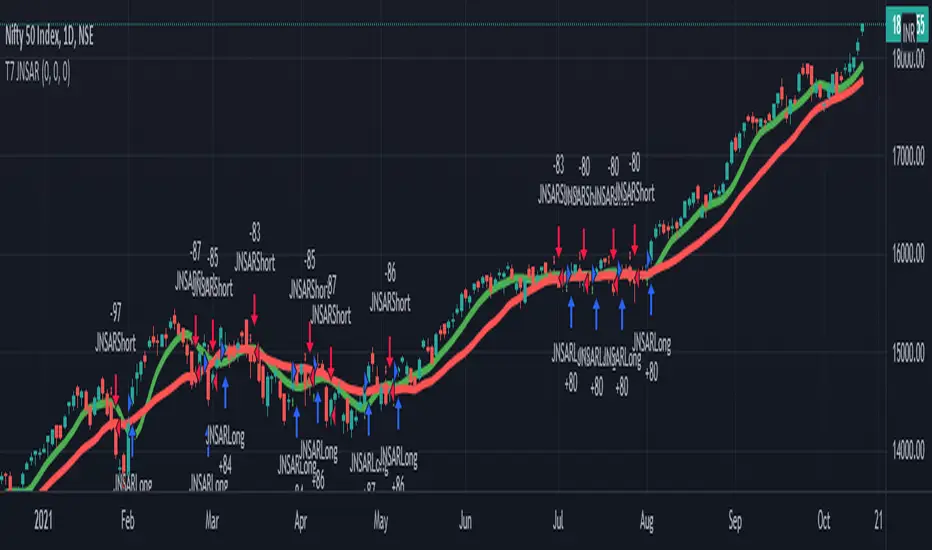
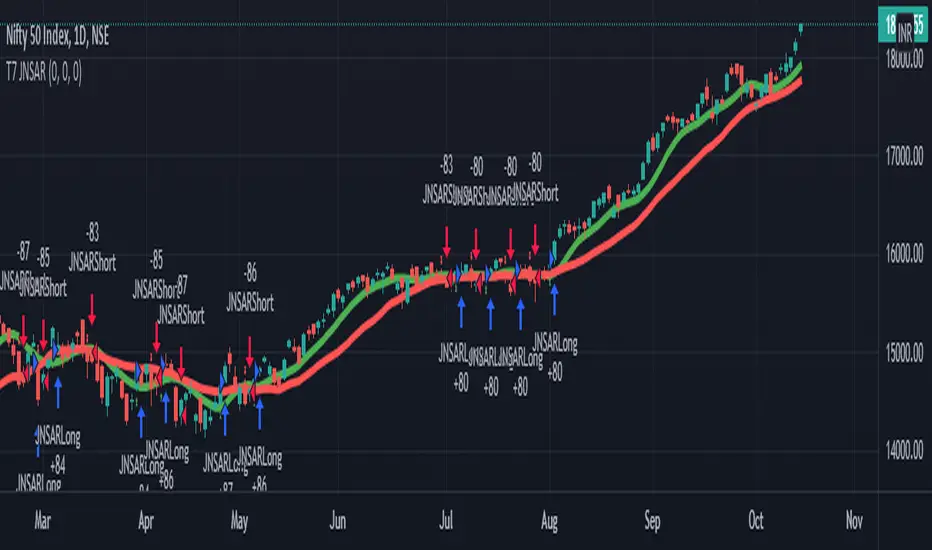
T7 JNSARJNSAR stands for Just Nifty -0.14% Stop & Reverse. This is a Trend Following Daily Bar Trading System for NIFTY -0.14% . Original idea belongs to ILLANGO @ I coded the pine version of this system based on a request from @stocksonfire. Use it at your own risk after validation at your end. Neither me or my company is responsible for any losses you may incur using this system. Hope you like this system and enjoy trading it !!!
Updated V3 code for the T7 JNSAR system earlier published here V2 and here V1
Following updates made to the code
1. Added a 22 Period Simple moving average filter over and above the standard JNSAR value for generating trading signals. This simple filter reduces the whipsaw trades drastically along with similar improvements in the max draw down and overall profitability of the system. The SMA filter is turned ON by default but can be turned OFF by user through the settings window.
2. Backtest option is now turned ON by default.
Also am republishing the trading rules here again with some modification
1. Go Long when the daily close is above the JNSAR line. Go Short when the daily close is below the JNSAR line. JNSAR line is the varying green line overlayed over the price chart. Once a signal comes at market close enter in the direction of the signal @ market price @ next day market open.
2. Trade only Nifty -0.14% Index. This system was developed and backtested only for NIFTY -0.14% Index. So trade in its Futures or Options, as you may deem fit. My recommendation is to choose futures for simplicity. If you want to reduce the trading cost and go with options, trade with deep in the money options, preferably 2 strikes far from the spot price.
3. Trade all signals. Markets trend only 30-35% of the time and hence the system is only accurate to that extend. But system tends to make enough money, in this small trending window, to keep the overall profitability in good health. But one never knows when a big trend may come and when it comes its absolutely imperative that you take it. To ensure that, trade all signals and don't be choosy about what signals you are going to trade. Also I wouldn't recommend using your own analysis to trade this system. Too many drivers will crash the car.
4. Like all trend following systems, this system will have many whipsaws during flat markets along with large trade and account drawdowns. Also some months and even years may not be profitable. But to trade this system profitably, it is necessary to take these in one's stride and keep trading. As the backtester results from 1990 to 2017 proves, this system is profitable overall thus far. Take confidence from that objective fact.
5. Trade with only that amount of money you can afford to loose. Initial capital that you need to have to trade one lot of NIFTY -0.14% should be atleast - (Margin Money required to take and hold 1 lot position + maximum drawdown amount per lot)*1.2. Be prepared to add more if need be, but the above formula will give a rough idea of what you need to have to start trading and be in the game always.
6. Place an After Market Order @ Market Price with your broker after market close so that you get to execute the trade next trading day @ Market open to capture near similar price as the daily open price seen on the chart. This execution mode will give you the best chance to minimize the slippage and mimic the backtester results as closely as practically possible.
7. Follow all the 6 rules above religiously, as if your life depends on it. If you cant, then don't trade this system; You will certainly loose money.
Happy Trading !!! As always am looking out for your valuable feedback.

T7 JNSARUpdated code for the T7 JNSAR system earlier published here -
Following updates made to the code
1. Buy / Sell arrows now appear when the corresponding conditions are met.
2. Support for Heikin-Ashi Candles added
3. Different Backtesting Position Sizing Algorithms added for evaluation
Also am republishing the trading rules here again with some modification
1. Go Long when the daily close is above the JNSAR line. Go Short when the daily close is below the JNSAR line. JNSAR line is the varying green line overlayed over the price chart. Once a signal comes at market close enter in the direction of the signal @ market price @ next day market open.
2. Trade only Nifty Index. This system was developed and backtested only for NIFTY Index. So trade in its Futures or Options, as you may deem fit. My recommendation is to choose futures for simplicity. If you want to reduce the trading cost and go with options, trade with deep in the money options, preferably 2 strikes far from the spot price.
3. Trade all signals. Markets trend only 30-35% of the time and hence the system is only accurate to that extend. But system tends to make enough money, in this small trending window, to keep the overall profitability in good health. But one never knows when a big trend may come and when it comes its absolutely imperative that you take it. To ensure that, trade all signals and don't be choosy about what signals you are going to trade. Also I wouldn't recommend using your own analysis to trade this system. Too many drivers will crash the car.
4. Like all trend following systems, this system will have many whipsaws during flat markets along with large trade and account drawdowns. Also some months and even years may not be profitable. But to trade this system profitably, it is necessary to take these in one's stride and keep trading. As the backtester results from 1990 to 2016 proves, this system is profitable overall thus far. Take confidence from that objective fact.
5. Trade with only that amount of money you can afford to loose. Initial capital that you need to have to trade one lot of NIFTY should be atleast - (Margin Money required to take and hold 1 lot position + maximum drawdown amount per lot)*1.2. Be prepared to add more if need be, but the above formula will give a rough idea of what you need to have to start trading and be in the game always.
6. Place an After Market Order @ Market Price with your broker after market close so that you get to execute the trade next trading day @ Market open to capture near similar price as the daily open price seen on the chart. This execution mode will give you the best chance to minimise the slippage and mimic the backtester results as closely as practically possible.
7. Follow all the 6 rules above religiously, as if your life depends on it. If you cant, then don't trade this system; You will certainly loose money.
Happy Trading !!! As always am looking out for your valuable feedback.
T7 JNSARJNSAR stands for Just Nifty Stop & Reverse. This is a trend following daily bar trading system for NIFTY. Original idea belongs to ILLANGO @ I coded the pine version of this system based on a request from @stocksonfire. Use it at your own risk after validation at your end. Neither me or my company is responsible for any losses you may incur using this system. Hope you like this system and enjoy trading it !!!
While trading this system you must follow these simple rules.
1. Go Long when the daily close is above the JNSAR line. Go Short when the daily close is below the JNSAR line. JNSAR line is the varying green line overlayed over the price chart. Once a signal comes at market close enter in the direction of the signal @ market price @ next day market open.
2. Trade only Nifty Index. This system was developed and backtested only for NIFTY Index. So trade in its Futures or Options, as you may deem fit. My recommendation is to choose futures for simplicity. If you want to reduce the trading cost and go with options, trade with deep in the money options, preferably 2 strikes far from the spot price.
3. Trade all signals. Markets trend only 30-35% of the time and hence the system is only accurate to that extend. But system tends to make enough money, in this small trending window, to keep the overall profitability in good health. But one never knows when a big trend may come and when it comes its absolutely imperative that you take it. To ensure that, trade all signals and don't be choosy about what signals you are going to trade. Also I wouldn't recommend using your own analysis to trade this system. Too many drivers will crash the car.
4. Like all trend following systems, this system will have many whipsaws during flat markets along with large trade and account drawdowns. Also some months and even years may not be profitable. But to trade this system profitably, it is necessary to take these in one's stride and keep trading. As the backtester results from 1990 to 2016 proves, this system is profitable overall thus far. Take confidence from that objective fact.
5. Initial capital that you need to have to trade one lot of NIFTY should be atleast - (Margin Money required to take and hold 1 lot position + maximum drawdown amount per lot)*1.2. Be prepared to add more if need be, but the above formula will give a rough idea of what you need to have to start trading and be in the game always.
6. Follow all the 5 rules above religiously as if your life depends on it. If you cant, then don't trade this system; You will certainly loose money.
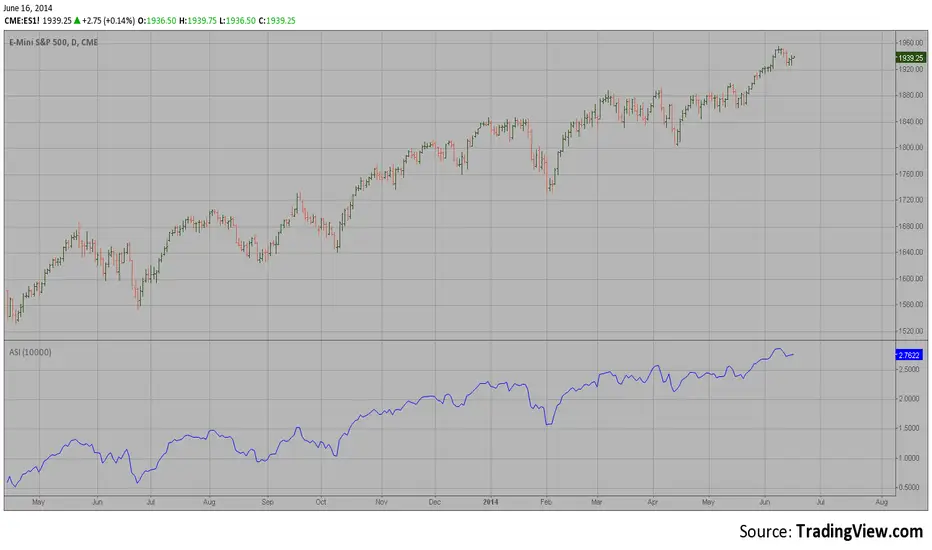
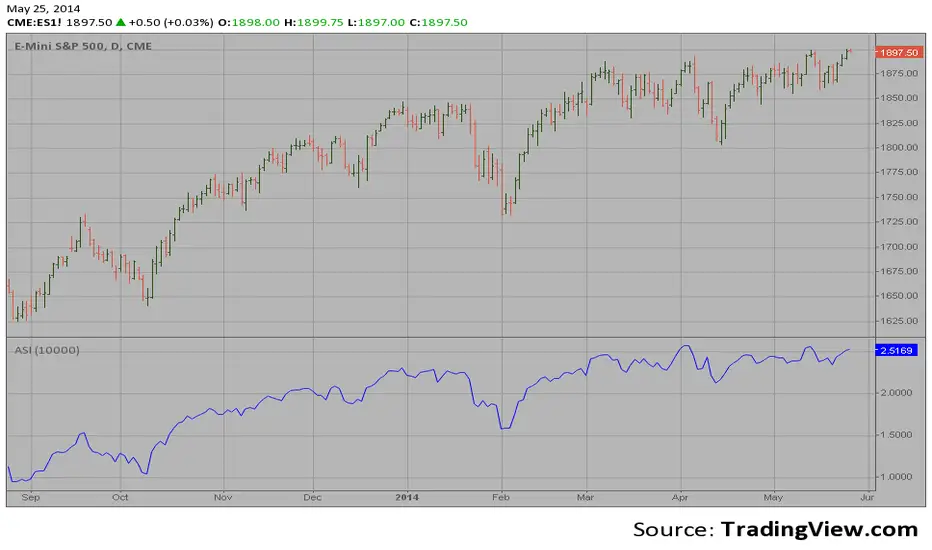
Accumulation Swing Index The Accumulation Swing Index is a cumulative total of the Swing Index.
The Accumulation Swing Index was developed by Welles Wilder.
The SwingIndex function was developed to help cut through the maze of
Open, High, Low and Close prices to indicate the real strength and direction
of the market. The Swing Index function looks at the Open, High, Low and
Close values for a two-bar period. The theory is that there are four cross-bar
and one intra-bar comparisons that are strong indicators of an up or down day.
The Swing Index returns a number between -100 and 100. If the factors point toward
an up day, then the function value will be positive and vice versa. In this way,
the Swing Index gives us definite short-term swing points, and it can be used to
supplement other methods as a breakout indicator. A breakout is indicated when the
value of the Accumulation Swing Index (ASI) exceeds the ASI value on the day when a
previous significant High Swing Point was made. A downside breakout is indicated when
the value of the ASI drops below the ASI value on a day when a previous significant
low swing point was made.
Since only futures have a relative daily limit value, this function only makes sense
when applied to a futures contract. If you use this function and it only plots a zero
flat line, check the Daily Limit value.
Accumulation Swing Index (ASI) The Accumulation Swing Index is a cumulative total of the Swing Index.
The Accumulation Swing Index was developed by Welles Wilder.
The SwingIndex function was developed to help cut through the maze of
Open, High, Low and Close prices to indicate the real strength and direction
of the market. The Swing Index function looks at the Open, High, Low and
Close values for a two-bar period. The theory is that there are four cross-bar
and one intra-bar comparisons that are strong indicators of an up or down day.
The Swing Index returns a number between -100 and 100. If the factors point toward
an up day, then the function value will be positive and vice versa. In this way,
the Swing Index gives us definite short-term swing points, and it can be used to
supplement other methods as a breakout indicator. A breakout is indicated when the
value of the Accumulation Swing Index (ASI) exceeds the ASI value on the day when a
previous significant High Swing Point was made. A downside breakout is indicated when
the value of the ASI drops below the ASI value on a day when a previous significant
low swing point was made.
Since only futures have a relative daily limit value, this function only makes sense
when applied to a futures contract. If you use this function and it only plots a zero
flat line, check the Daily Limit value.
Adaptive Trend Flow (ATF)Adaptive Trend Flow (ATF) is a custom trend-following indicator designed to work reliably across all markets and all timeframes.
It uses an adaptive moving average that automatically adjusts to market conditions, combined with trend slope analysis and a volatility filter to reduce noise during ranging periods.
Unlike traditional fixed moving averages, ATF reacts faster during strong trends and slows down during consolidation, helping traders stay aligned with meaningful price movements.
🔍 How It Works
Uses an adaptive smoothing algorithm to track price efficiently
Confirms trend direction using trend slope
Filters out low-volatility and choppy conditions using ATR-based logic
Does not repaint — signals are based only on confirmed data
📊 Visual Interpretation
🟢 Green line / background → Bullish trend
🔴 Red line / background → Bearish trend
⚪ Gray → No clear trend (range / low volatility)
⚙️ Features
Works on Crypto, Forex, Stocks, Futures
Compatible with all timeframes
Optional trend-change signals
Optional background highlighting
Fully customizable inputs
Alert-ready
🎯 Best Use Cases
Trend filter for entries and exits
Directional bias for scalping, day trading, or swing trading
Strategy backbone when combined with price action or momentum tools
⚠️ Disclaimer
This indicator is for educational and analytical purposes only and does not constitute financial advice. Always manage risk appropriately.

Trader HQ - Multi Time Frame EMA🔷 Indicator Title
MTF 200 EMA Pro — Triple Timeframe Trend Filter
🔷 Short Description (Tagline)
A professional multi-timeframe 200 EMA framework that overlays up to three higher and lower timeframe trend filters on a single chart for superior market alignment and trade confirmation.
🔷 Full Description (Paste This in TradingView)
📈 MTF 200 EMA Pro — Triple Timeframe Trend Filter
MTF 200 EMA Pro is a professional-grade multi-timeframe trend analysis tool designed to help traders identify high-probability directional bias across multiple timeframes.
This indicator allows you to overlay up to three independent 200-period Exponential Moving Averages from different timeframes onto one chart, providing instant insight into higher, medium, and lower timeframe trend alignment.
By stacking multiple 200 EMAs, traders can eliminate low-quality setups, avoid countertrend trades, and operate in harmony with dominant market structure.
🔧 Key Features
✅ Up to 3 independent 200 EMAs
✅ Individual timeframe selection per EMA
✅ Clean overlay on any chart
✅ Adjustable display per line
✅ Real-time multi-timeframe calculations
✅ Works on all markets and sessions
🎯 How to Use
This indicator is designed as a primary trend filter.
Example configuration:
• EMA 1 → Lower timeframe (Execution)
• EMA 2 → Medium timeframe (Momentum)
• EMA 3 → Higher timeframe (Structure)
Bullish Bias Example
Price above all 200 EMAs
Lower EMA above higher EMA
Pullbacks hold above structure
Bearish Bias Example
Price below all 200 EMAs
Lower EMA below higher EMA
Rejections at structure
When EMAs are aligned, trend probability increases.
📊 Best Use Cases
✔ Futures Trading
✔ Options & Equity Trading
✔ Forex & Crypto
✔ Prop Firm Evaluations
✔ Trend-Following Systems
✔ Momentum Strategies
⚠️ Risk Disclaimer
This indicator is a trend visualization and filtering tool only. It does not provide financial advice. Always apply proper risk management and confirm signals with your own strategy.

Advanced Scalping Navigator free by S B PrasadAdvanced Scalping Navigator Lite • Features
by S B Prasad
Advanced Scalping Navigator Lite is a powerful multi-factor scalping and intraday indicator designed to generate high-probability BUY and SELL signals using trend, momentum, volatility, and smart-money concepts.
This FREE version retains the complete core signal engine while limiting certain premium visual and channel features.
🚀 Core Features (Included in Lite Version)
✅ High-Accuracy BUY & SELL Signals
Signals are generated only when multiple technical and structural conditions align, including:
ATR-based trend direction & strength
EMA trend bias
MACD momentum
RSI confirmation
VWAP institutional bias
Ribbon & Hull MA filters
Higher-timeframe (HTF) trend confirmation
Smart-money liquidity sweep validation
Supply & demand zone filtering
Session-based trading filter
✅ Smart-Money Liquidity Sweeps
Detects equal highs/lows and stop-hunt behavior to identify institutional accumulation or distribution before issuing signals.
✅ Supply & Demand Zones
Automatically plots demand and supply zones using pivot-based market structure to improve trade location quality.
✅ Higher-Timeframe (HTF) Confirmation
Filters trades in the direction of the dominant higher-timeframe trend for better probability alignment.
✅ Session Filter (Market Timing Control)
Limits signals to selected market sessions:
Indian Market
London Session
New York Session
✅ Multi-Factor Confirmation Engine
Combines EMA, MACD, RSI, VWAP, Ribbon, and HMA into a weighted factor score to avoid low-quality trades.
✅ Real-Time Dashboard Panel
On-chart dashboard displaying:
Trend direction
Trend strength
Factor alignment score
HTF bias
Zone context
Signal state
Session status
🔒 Features Limited or Disabled in Lite Version
The following premium visuals and channels are not available in the FREE version:
❌ ATR trendline (dynamic support / resistance)
❌ ATR trendline strength coloring
❌ Full ATR channel (upper / average / lower)
❌ Channel fills & premium visual layers
❌ Pivot ATR trend channel visuals
❌ Enhanced trend-zone background fills
🎯 Best For
Intraday traders
Scalpers
Index & stock traders
Futures and options traders
Traders who prefer clean charts with powerful signals
📣 Join Our Telegram (Updates & PRO Access)
👉 Telegram: t.me
💬 For updates, support & PRO version access, join our Telegram.
⚠️ Disclaimer
This indicator is for educational and informational purposes only.
It does not constitute financial advice.
Trading involves risk. Always use proper risk management.

Market DashboardMarket Dashboard - Trend vs Chop Detection
A comprehensive intraday market internals dashboard that displays five key metrics to help traders quickly identify whether the market is in a trending or sideways/rotational regime.
METRICS DISPLAYED:
1. VOLD Ratio - Up Volume / Down Volume ratio for NYSE
• > +2.0 = Strong buying pressure (green)
• < -2.0 = Strong selling pressure (red)
• Between -2 and +2 = Neutral/rotational (gray)
2. RVOL - Relative Volume compared to same time over past N days
• > 1.5 = Above-average participation (orange)
• < 0.7 = Below-average participation (blue)
• Otherwise neutral (gray)
3. Breadth % - Net percentage of advancing vs declining issues
• > +30% = Broad upside participation (green)
• < -30% = Broad downside participation (red)
• Between -30% and +30% = Mixed/rotational (gray)
4. ADR Used % - Session range utilization vs 5-day Average Daily Range
• > 80% = Extended move, potential exhaustion (orange)
• < 30% = Compressed, room to move (blue)
• Otherwise neutral (gray)
5. TICK - NYSE TICK Index with sentiment label
• > +600 = Strong uptick pressure (green)
• < -600 = Strong downtick pressure (red)
• Between -600 and +600 = Neutral (gray)
HOW TO READ:
Trending Day Signals:
• VOLD > ±2.5 + Breadth > ±50% + TICK sustained in one direction + RVOL > 1.5 + ADR climbing = Strong trend, trade with pullbacks
Sideways/Chop Signals:
• VOLD oscillating ±2 + Breadth flipping around 0% + TICK whipping + RVOL < 1.2 + ADR mean-reverting = Range-bound, fade extremes or stand aside
CUSTOMIZATION:
• Adjustable ADR length (default 5 days)
• Adjustable RVOL lookback period (default 10 days, 30 bars)
• Table position selector (9 positions available)
Perfect for ES, NQ, and other index futures traders who need quick regime assessment at a glance.

10 Youtube Opening Range Strategies + Backtest 1. Quick Flip Scalper
A strategy centered on fading or following the initial move relative to the Opening Range (OR).
LONG Rules:
Reversal Mode: If the Opening Range is Bearish (Red), enter Long when price drops below the Opening Range Low (ORL).
Continuity Mode: If the Opening Range is Bullish (Green), enter Long when price drops below the Opening Range Low (ORL) (Buying the deep pullback/trap).
SHORT Rules:
Reversal Mode: If the Opening Range is Bullish (Green), enter Short when price breaks above the Opening Range High (ORH).
Continuity Mode: If the Opening Range is Bearish (Red), enter Short when price breaks above the Opening Range High (ORH) (Selling the deep pullback/trap).
2. First Candle Scalper
Identical to the Quick Flip Scalper but restricts entries to the very first retest only.
LONG Rules:
Same as Quick Flip Long, but only triggers once per session.
SHORT Rules:
Same as Quick Flip Short, but only triggers once per session.
3. Smart Money Trap (SMT)
Identifies a "fakeout" breakout followed immediately by a reversal candlestick pattern.
LONG Rules:
Condition: The previous candle low was below the ORL, but the candle closed back inside (above ORL).
Trigger: Must have a Bullish Engulfing or Bullish Rejection pattern closing above the ORL.
SHORT Rules:
Condition: The previous candle high was above the ORH, but the candle closed back inside (below ORH).
Trigger: Must have a Bearish Engulfing or Bearish Rejection pattern closing below the ORH.
4. Trident Pattern (TG Capital)
A London-session exclusive strategy requiring a Fair Value Gap (FVG) and a Doji confirmation.
LONG Rules:
Filter: Price is Above the 200 EMA (if enabled).
Setup: A Bullish FVG forms.
Confirmation: A Doji candle wicks down into the 50% level of the FVG.
Trigger: Enter on the next candle close.
SHORT Rules:
Filter: Price is Below the 200 EMA (if enabled).
Setup: A Bearish FVG forms.
Confirmation: A Doji candle wicks up into the 50% level of the FVG.
Trigger: Enter on the next candle close.
5. OTE Framework (MBB Trader)
Simulates an Optimal Trade Entry by combining a Liquidity Sweep with a Market Structure Shift (SMR).
LONG Rules:
Sweep: Price drops below the lowest low of the last 20 candles.
Structure: A Bullish SMR forms (Low → High → Lower Low → Higher High).
SHORT Rules:
Sweep: Price breaks above the highest high of the last 20 candles.
Structure: A Bearish SMR forms (High → Low → Higher High → Lower Low).
6. Liquidity Trap (Marco Trades)
A contrarian strategy that buys/sells purely on sweeps of major structural levels.
LONG Rules:
Trigger: Price sweeps (drops below) the lowest low of the last 50 candles.
SHORT Rules:
Trigger: Price sweeps (breaks above) the highest high of the last 50 candles.
7. Trojan Horse (Trader Mayne)
Uses Trend EMAs (50 & 200) to identify direction, then enters on a Lower Timeframe Breaker.
LONG Rules:
Trend: 50 EMA > 200 EMA (Uptrend).
Trigger: Price sweeps a recent 10-candle low, then immediately breaks a recent 5-candle high.
SHORT Rules:
Trend: 50 EMA < 200 EMA (Downtrend).
Trigger: Price sweeps a recent 10-candle high, then immediately breaks a recent 5-candle low.
8. Simplified SMT (9:30 Range)
Focuses on the 9:30 AM range. Waits for a breakout and a confirmed failure to sustain it.
LONG Rules:
Context: Price previously broke above the ORH.
Trigger: Price returns to the ORH (Retest) with a Bullish Engulfing/Rejection pattern.
SHORT Rules:
Context: Price previously broke below the ORL.
Trigger: Price returns to the ORL (Retest) with a Bearish Engulfing/Rejection pattern.
9. 9:30 One-Candle (Scarface)
Uses the high/low of the single 9:30 candle as the range.
LONG Rules:
Setup: Price closes above the 9:30 High.
Trigger: Price pulls back and touches/dips into the 9:30 High (Retest).
SHORT Rules:
Setup: Price closes below the 9:30 Low.
Trigger: Price pulls back and touches/wicks into the 9:30 Low (Retest).
10. London Breakout (Joovier)
Based on the 3 AM - 9 AM EST box.
LONG Rules:
Trigger: A candle's Body (Open and Close) forms completely above the Box High after the session opens.
SHORT Rules:
Trigger: A candle's Body (Open and Close) forms completely below the Box Low after the session opens.
⚠️ DISCLAIMER & LIMITATION OF LIABILITY
1. NO AFFILIATION / INDEPENDENT PROJECT This script is an independent coding project created solely for testing, research, and entertainment purposes. The creator of this indicator is not associated, affiliated, endorsed by, or in any way connected to the strategy authors or influencers mentioned within the tool (including but not limited to TG Capital, MBB Trader, Marco Trades, Trader Mayne, Scarface, or Joovier).
The strategy names are used strictly for identification purposes to credit the original concept creators.
This code represents an independent interpretation of public trading concepts. It may not reflect the exact, proprietary, or private methods taught by these individuals.
This is not an official product from any of the aforementioned parties.
2. FOR EDUCATIONAL PURPOSES ONLY This indicator is strictly for educational and informational purposes. It is not a signal service and does not constitute investment, financial, or trading advice. The buy/sell labels generated by this script are merely visual representations of specific code logic and should not be interpreted as instructions to execute trades.
3. EXCLUSION OF LIABILITY By using this script, you explicitly agree that:
The creator assumes no responsibility or liability for any direct, indirect, consequential, or incidental losses or damages resulting from the use of this tool.
You engage in trading entirely at your own risk.
You release the creator from any legal responsibility regarding your trading activities or financial results.
4. HYPOTHETICAL PERFORMANCE The statistics displayed on the "Dashboard" (Win Rate, P&L, etc.) are hypothetical and based on historical backtesting data.
Past performance is not indicative of future results.
These results do not account for slippage, spreads, commission fees, or real-time liquidity issues.
Strategies that performed well in the past may fail in current or future market conditions.
5. HIGH-RISK WARNING Trading in financial markets (Stocks, Forex, Crypto, Futures) involves a high degree of risk and is not suitable for all investors. You could lose some or all of your initial investment. You should not trade with money that you cannot afford to lose.
IF YOU DO NOT AGREE WITH THESE TERMS, DO NOT USE THIS SCRIPT.

Super OscillatorSuper Oscillator – Intraday Momentum
Super Oscillator is a momentum-based oscillator designed for intraday trading, optimized for 1-minute charts and fast market conditions.
The indicator uses a zero-centered momentum model with dynamic smoothing and clearly defined zones to help traders identify exhaustion, pullbacks, and momentum shifts without excessive noise.
Key Features
Zero-centered oscillator for immediate directional bias
Dynamic overbought and oversold zones
Neutral “dead zone” to avoid low-probability trades
Smoothed momentum line with signal line for timing entries
Optimized for scalping and short-term intraday trading
Fully compatible with TradingView Pine Script v6
How to Use
Overbought zone: Look for bearish reactions or momentum exhaustion
Oversold zone: Look for bullish reactions or pullbacks
Dead zone: Avoid trades when momentum is unclear
Use the oscillator as a confirmation tool, always with price action and structure
Best Use Case
Intraday scalping (1M–5M)
Futures markets (indices, metals)
NY session trading
Disclaimer
This indicator does not predict price direction. It measures momentum and exhaustion and should be used as part of a complete trading plan with proper risk management.

PSAR Laboratory [DAFE]PSAR Laboratory : The Ultimate Adaptive Trailing Stop & Reversal Engine
23 Advanced Algorithms. Adaptive Acceleration. Smart Flip Logic. Parabolic SAR Reimagined.
█ PHILOSOPHY: WELCOME TO THE LABORATORY
The standard Parabolic SAR, created by the legendary J. Welles Wilder Jr., is a tool of beautiful simplicity. But in today's complex, algorithm-driven markets, its simplicity is its fatal flaw. Its fixed acceleration and rigid flip logic cause it to fail precisely when you need it most: it whipsaws in choppy conditions and gives back too much profit in strong trends.
The PSAR Laboratory was not created to be just another PSAR. It was engineered to be the definitive evolution of Wilder's original concept. This is not an indicator; it is a powerful, interactive research environment. It is a sandbox where you, the trader, can move beyond the static "one-size-fits-all" approach and forge a PSAR that is perfectly adapted to your specific market, timeframe, and trading style.
We have deconstructed the very DNA of the Parabolic SAR and rebuilt it from the ground up, infusing it with modern quantitative techniques. The result is an institutional-grade suite of 23 distinct, mathematically diverse algorithms that dynamically control every aspect of the PSAR's behavior.
█ WHAT MAKES THIS A "LABORATORY"? THE CORE INNOVATIONS
This tool stands in a class of its own. It is a collection of what could be 23 separate indicators, all seamlessly integrated into one powerful engine.
The 23 Algorithm Engine: This is the heart of the Laboratory. Instead of one rigid formula, you have a library of 23 unique mathematical engines at your command. These algorithms are not simple tweaks; they are complete re-imaginings of how the PSAR should behave, based on concepts from information theory, digital signal processing, fractal geometry, and institutional analysis.
Truly Adaptive Acceleration (AF): The standard PSAR's "gas pedal" (the AF) is dumb; it accelerates at a fixed rate. Our algorithms make it intelligent. The AF can now speed up in clean, trending environments to lock in profits, and automatically slow down in choppy, chaotic conditions to avoid whipsaws.
Advanced Flip Confirmation Logic: Say goodbye to noise-driven flips. You are no longer at the mercy of a single wick touching the SAR. The Laboratory provides multiple layers of flip confirmation, including requiring a bar close beyond the SAR, a volume spike to validate the reversal, or even a multi-bar confirmation .
Comprehensive Noise Filtering Core: In a revolutionary step, you can apply one of over 30 advanced signal processing filters directly to the SAR output itself. From ultra-low-lag filters like the Hull MA and DAFE Spectral Laguerre to adaptive filters like KAMA and FRAMA , you can surgically remove noise while preserving the responsiveness of the core signal.
Integrated Performance Engine: How do you know which of the 23 algorithms is best for your market? You test it. The built-in Performance Dashboard is a comprehensive backtesting and analytics engine that tracks every trade, providing real-time data on Win Rate, Profit Factor, Max Drawdown, and more. It allows you to scientifically validate your chosen configuration.
█ A GUIDED TOUR OF THE ALGORITHMS: 23 PATHS TO AN EDGE
b]These 23 algorithms are not simple settings; they are distinct mathematical philosophies for how a Parabolic SAR should adapt to the market. They are grouped into three primary categories: those that adapt the Acceleration Factor (AF) , those that enhance the Extreme Point (EP) detection, and those that redefine the Flip Logic .
CATEGORY A: ACCELERATION FACTOR (AF) ADAPTATION
These algorithms dynamically change the "gas pedal" of the PSAR.
1. Volatility-Scaled AF
Core Concept: Treats volatility as market friction. The PSAR should be more forgiving in high-volatility environments.
How It Works: It calculates a Volatility Ratio by comparing the short-term ATR to the long-term ATR. If current volatility is high (ratio > 1), it reduces the AF Step. If volatility is low (ratio < 1), it increases the AF Step to trail tighter.
Ideal Use Case: The best all-rounder. Excellent for any market, especially those with clear shifts between high and low volatility regimes (like indices and crypto).
2. Efficiency Ratio (ER) AF
Core Concept: The PSAR should accelerate aggressively in clean, efficient trends and slow down dramatically in choppy, inefficient markets.
How It Works: It uses Kaufman's Efficiency Ratio (ER), which measures the net directional movement versus the total price movement. A high ER (near 1.0) signifies a pure trend, triggering a high AF multiplier. A low ER (near 0.0) signifies chop, triggering a low AF multiplier.
Ideal Use Case: Markets that alternate between strong trends and sideways chop. It is exceptionally good at surviving ranging periods.
3. Shannon Entropy AF
Core Concept: Uses Information Theory to measure market disorder. The PSAR should be conservative in chaos and aggressive in order.
How It Works: It calculates the Shannon Entropy of recent price changes. High entropy means the market is unpredictable ("chaotic"), causing the AF to slow down. Low entropy means the market is organized and trending, causing the AF to speed up.
Ideal Use Case: Advanced traders looking for a mathematically pure way to distinguish between a tradable trend and random noise.
4. Fractal Dimension (FD) AF
Core Concept: Measures the "jaggedness" or complexity of the price path. A smooth path is a trend; a jagged, space-filling path is chop.
How It Works: It calculates the Fractal Dimension of the price series. An FD near 1.0 is a smooth line (high AF). An FD near 1.5 is a random walk (low AF).
Ideal Use Case: Visually identifying the moment a smooth trend begins to break down into chaotic, unpredictable movement.
5. ADX-Gated AF
Core Concept: Uses the classic ADX indicator to confirm the presence of a trend before allowing the PSAR to accelerate.
How It Works: If the ADX value is above a "Strong" threshold (e.g., 25), the AF accelerates normally. If the ADX is below a "Weak" threshold (e.g., 15), the AF is "frozen" and will not increase, preventing the SAR from tightening up in a non-trending market.
Ideal Use Case: For classic trend-following purists who trust the ADX as their primary regime filter.
6. Kalman AF Estimator
Core Concept: A sophisticated signal processing algorithm that predicts the "true" optimal AF by filtering out price "noise."
How It Works: It treats the PSAR's AF as a state to be estimated. It makes a prediction, then corrects it based on how far the actual price deviates. It's like a GPS constantly refining its position. The "Process Noise" input controls how fast it thinks the AF can change, while "Measurement Noise" controls how much it trusts the price data.
Ideal Use Case: Smooth, high-inertia markets like commodities or major forex pairs. It creates an incredibly smooth and responsive AF.
7. Volume-Momentum AF
Core Concept: A trend's acceleration is only valid if confirmed by both volume and price momentum.
How It Works: The AF will only increase if a new Extreme Point is made on above-average volume AND the Rate of Change (ROC) of the price is aligned with the trend's direction.
Ideal Use Case: Any market with reliable volume data (stocks, futures, crypto). It's excellent for filtering out low-conviction moves.
8. Garman-Klass (GK) AF
Core Concept: Uses a more advanced, statistically efficient measure of volatility (Garman-Klass, which uses OHLC data) to adapt the AF.
How It Works: It modulates the AF based on whether the current GK volatility is higher or lower than its historical average. Unlike the standard Volatility-Scaled algo, it tends to slow down more in high volatility and speed up less in low volatility, making it more conservative.
Ideal Use Case: Traders who want a volatility-adaptive model that is more focused on risk reduction during volatile periods.
9. RSI-Modulated AF
Core Concept: The RSI can identify points of potential trend exhaustion or strong momentum.
How It Works: If a trend is bullish but the RSI enters the "Overbought" zone, the AF slows down, anticipating a pullback. Conversely, if the RSI is in the strong momentum mid-range (40-60), the AF is boosted to trail more aggressively.
Ideal Use Case: Mean-reversion traders or those who want to automatically loosen their trail stop near potential exhaustion points.
10. Bollinger Squeeze AF
Core Concept: A Bollinger Band Squeeze signals a period of volatility compression, often preceding an explosive breakout.
How It Works: When the algorithm detects that the Bollinger Band Width is in a "Squeeze" (below a certain historical percentile), it boosts the AF in anticipation of a fast move, allowing the PSAR to catch the breakout quickly.
Ideal Use Case: Breakout traders. This algorithm primes the PSAR to be maximally responsive right at the moment a breakout is most likely.
11. Keltner Adaptive AF
Core Concept: Keltner Channels provide a robust measure of a trend's "normal" volatility channel.
How It Works: When price is trading strongly outside the Keltner Channel, it's considered a powerful trend, and the AF is boosted. When price falls back inside the channel, it's considered a consolidation or pullback, and the AF is slowed down.
Ideal Use Case: Trend followers who use channel breakouts as their primary confirmation.
12. Choppiness-Gated AF
Core Concept: Uses the Choppiness Index to quantify whether the market is trending or consolidating.
How It Works: If the Choppiness Index is below the "Trend" threshold (e.g., 38.2), the AF is boosted. If it's above the "Range" threshold (e.g., 61.8), the AF is significantly reduced.
Ideal Use Case: A more responsive alternative to the ADX-Gated algorithm for distinguishing between trending and ranging markets.
13. VIDYA-Style AF
Core Concept: Uses a Chande Momentum Oscillator (CMO) to create a variable-speed acceleration factor.
How It Works: The absolute value of the CMO is used to create a dynamic smoothing constant. Strong momentum (high absolute CMO) results in a faster, more responsive AF. Weak momentum results in a slower, smoother AF.
Ideal Use Case: Momentum traders who want their trailing stop's speed directly tied to the momentum of the price itself.
14. Hilbert Cycle AF
Core Concept: Uses Ehlers' Hilbert Transform to extract the dominant cycle period of the market and synchronizes the PSAR with it.
How It Works: It dynamically adjusts the AF based on the detected cycle period (shorter cycles = faster AF) and can also modulate it based on the current phase within that cycle (e.g., accelerate faster near cycle tops/bottoms).
Ideal Use Case: Markets with clear cyclical behavior, like commodities and some forex pairs.
CATEGORY B: EXTREME POINT (EP) ENHANCEMENT
These algorithms make the detection of new highs/lows more intelligent.
15. Volume-Weighted EP
Core Concept: A new high or low is more significant if it occurs on high volume.
How It Works: It can be configured to only accept a new EP if the volume on that bar is above average. It can also "weight" the EP by volume, pushing it further out on high-volume bars.
Ideal Use Case: Filtering out weak, low-conviction price probes in markets with reliable volume.
16. Wavelet Filtered EP
Core Concept: Uses wavelet decomposition (a signal processing technique) to separate the underlying trend from high-frequency noise.
How It Works: It calculates a smoothed, wavelet-filtered version of the price. A new EP is only registered if the actual high/low significantly exceeds this smoothed baseline, effectively ignoring minor noise spikes.
Ideal Use Case: Noisy markets where small, insignificant wicks can cause the AF to accelerate prematurely.
17. ATR-Validated EP
Core Concept: A new EP should represent a meaningful move, not just a one-tick poke.
How It Works: It requires a new high/low to exceed the previous EP by a minimum amount, defined as a multiple of the current ATR. This ensures only volatility-significant advances are counted.
Ideal Use Case: A simple, robust way to filter out "noise" EPs and slow down the AF's acceleration in choppy conditions.
18. Statistical EP Filter
Core Concept: A new EP is only valid if the price change that created it is statistically significant.
How It Works: It calculates the Z-Score of the bar's price change relative to recent history. A new EP is only accepted if its Z-Score exceeds a certain threshold (e.g., 1.5 sigma), meaning it was an unusually strong move.
Ideal Use Case: For quantitative traders who want to ensure their trailing stop only tightens in response to statistically meaningful price action.
CATEGORY C: FLIP LOGIC & CONFIRMATION
These algorithms change the very rules of when and why the PSAR reverses.
19. Dual-PSAR Gate
Core Concept: Uses two PSARs—one fast and one slow—to confirm a reversal.
How It Works: A flip signal for the main PSAR is only considered valid if both the fast (sensitive) PSAR and the slow (structural) PSAR have flipped. This acts as a powerful trend filter.
Ideal Use Case: An excellent method for reducing whipsaws. It forces the PSAR to wait for both short-term and longer-term momentum to align before signaling a reversal.
20. MTF Coherence PSAR
Core Concept: Do not flip against the higher timeframe macro trend.
How It Works: It pulls PSAR data from two higher timeframes. A flip is only allowed if the new direction does not contradict the trend on at least one (or both) of those higher timeframes. It also boosts the AF when all timeframes are aligned.
Ideal Use Case: The ultimate tool for multi-timeframe traders who want to ensure their entries and exits are in sync with the bigger picture.
21. Momentum-Gated Flip
Core Concept: A reversal is only valid if it is supported by a significant surge of momentum.
How It Works: A price cross of the SAR is not enough. The script also requires the Rate of Change (ROC) to exceed a certain threshold for a set number of bars, confirming that there is real force behind the reversal.
Ideal Use Case: Filtering out weak, drifting reversals and only taking signals that are initiated with explosive power.
22. Close-Only PSAR
Core Concept: Wicks are noise; the bar's close is the final decision.
How It Works: This algorithm modifies the flip logic to ignore wicks. A flip only occurs if one or more bars close beyond the SAR line.
Ideal Use Case: One of the most effective and simple ways to reduce false signals from volatile wicks. A fantastic default choice for any trader.
23. Ultimate PSAR Consensus
Core Concept: The highest conviction signal comes from the agreement of multiple, diverse mathematical models.
How It Works: This is the capstone algorithm. It runs a "vote" between a selection of the top-performing algorithms (e.g., Volatility-Scaled, Efficiency Ratio, Dual-PSAR). A flip is only signaled if a majority consensus is reached. It can even weight the votes based on each algorithm's recent performance.
Ideal Use Case: For traders who want the absolute highest level of confirmation and are willing to accept fewer, but more robust, signals.
█ PART II: THE NOISE FILTERING CORE - The Shield
This is a revolutionary feature that allows you to apply a second layer of signal processing directly to the SAR line itself, surgically removing noise before the flip logic is even considered.
FILTER CATEGORIES
Basic Filters (SMA, EMA, WMA, RMA): The classic moving averages. They provide basic smoothing but introduce significant lag. Best used for educational purposes.
Low-Lag Filters (DEMA, TEMA, Hull MA, ZLEMA): A family of filters designed to reduce the lag inherent in basic moving averages. The Hull MA is a standout, offering a superb balance of smoothness and responsiveness.
Adaptive Filters (KAMA, VIDYA, FRAMA): These are "smart" filters. They automatically adjust their smoothing level based on market conditions. They will be very smooth in choppy markets and become highly responsive in trending markets.
Advanced DSP & DAFE Filters: This is the pinnacle of signal processing.
Ehlers Filters (SuperSmoother, 2-Pole, 3-Pole): Based on the work of John Ehlers, these use digital signal processing techniques to remove high-frequency noise with minimal lag.
Gaussian & ALMA: These use a bell-curve weighting, giving the most importance to recent data in a smooth, non-linear fashion.
DAFE Spectral Laguerre: A proprietary, non-linear filter that uses a feedback loop and adapts its "gamma" based on volatility, providing exceptional tracking in all market conditions.
How to Choose a Filter
Start with "None": First, find an algorithm you like with no filtering to understand its raw behavior.
Introduce Low Lag: If you are getting too many whipsaws from noise, apply a short-length Hull MA (e.g., 5-8). This is often the best solution.
Go Adaptive: If your market has very distinct trend/chop regimes, try an Adaptive KAMA .
Maximum Purity: For the smoothest possible output with excellent responsiveness, use the DAFE Spectral Laguerre or Ehlers SuperSmoother .
█ THE VISUAL EXPERIENCE: DATA AS ART
The PSAR Laboratory is not just functional; it is beautiful. The visualization engine is designed to provide you with an intuitive, at-a-glance understanding of the market's state.
Algorithm-Specific Theming: Each of the 23 algorithms comes with its own unique, professionally designed color palette. This not only provides visual variety but allows you to instantly recognize which engine is active.
Dynamic Glow Effects: For many algorithms, the PSAR dots will emit a soft "glow." The brightness and color of this glow are not random; they are tied to a key metric of the active algorithm (e.g., trend strength, volatility, consensus), providing a subtle, visual cue about the health of the trend.
Adaptive Volatility Bands: Certain algorithms will display dynamic bands around the PSAR. These are not standard deviation bands; their width is controlled by the specific logic of the active algorithm, showing you a visual representation of the market's expected range or energy level.
Secondary Reference Lines: For algorithms like the Dual-PSAR or MTF Coherence, a secondary line will be plotted on the chart, giving you a clear visual of the underlying data (e.g., the slow PSAR, the HTF trend) that is driving the decision-making process.
█ THE MASTER DASHBOARD: YOUR MISSION CONTROL
The comprehensive dashboard is your unified command center for analysis and performance tracking.
Engine Status: See the currently selected Algorithm, the active Noise Filter, the Trend direction, and a real-time progress bar of the current Acceleration Factor (AF).
Algorithm-Specific Metrics: This is the most powerful section. It displays the key real-time data from the currently active algorithm. If you're using "Shannon Entropy," you'll see the Entropy score. If you're using "ADX-Gated," you'll see the ADX value. This gives you a direct, quantitative look under the hood.
Performance Readout: When enabled, this section provides a full breakdown of your backtesting results, including Win Rate, Profit Factor, Net P&L, Max Drawdown, and your current trade status.
█ DEVELOPMENT PHILOSOPHY
The PSAR Laboratory was born from a deep respect for Wilder's original work and a relentless desire to push it into the 21st century. We believe that in modern markets, static tools are obsolete. The future of trading lies in adaptation. This indicator is for the serious trader, the tinkerer, the scientist—the individual who is not content with a black box, but who seeks to understand, test, and refine their edge with surgical precision. It is a tool for forging, not just following.
The PSAR Laboratory is designed to be the ultimate tool for that evolution, allowing you to discover and codify the rules that truly fit you.
█ DISCLAIMER AND BEST PRACTICES
THIS IS A TOOL, NOT A STRATEGY: This indicator provides a sophisticated trailing stop and reversal signal. It must be integrated into a complete trading plan that includes risk management, position sizing, and your own contextual analysis.
TEST, DON'T GUESS: The power of this tool is its adaptability. Use the Performance Dashboard to rigorously test different algorithms and settings on your chosen asset and timeframe. Find what works, and build your strategy around that data.
START SIMPLE: Begin with the "Volatility-Scaled AF" algorithm, as it is a powerful and intuitive all-rounder. Once you are comfortable, begin experimenting with other engines.
RISK MANAGEMENT IS PARAMOUNT: All trading involves substantial risk. The backtesting results are hypothetical and do not account for slippage or psychological factors. Never risk more capital than you are prepared to lose.
"I don't think traders can follow rules for very long unless they reflect their own trading style. Eventually, a breaking point is reached and the trader has to quit or change, or find a new set of rules he can follow. This seems to be part of the process of evolution and growth of a trader."
— Ed Seykota, Market Wizard
Taking you to school. - Dskyz, Trade with Volume. Trade with Density. Trade with DAFE

AI Adaptive Trend Navigator Strategy Echo EditionAI Adaptive Trend Navigator Strategy
This is a professional long-only automated strategy optimized for Taiwan Index Futures (TX). Based on the LuxAlgo clustering framework, this version features advanced logic iteration for institutional-grade backtesting and execution.
1. Realistic Cost Modeling To ensure backtest reliability, this strategy is pre-configured with:
Slippage: 2 ticks (Approx. 400 TWD per side).
Commission: 100 TWD per side.
Total Cost: 500 TWD per side. This provides a rigorous stress test for real-world trading environments.
2. State Consistency & Logic Continuity Optimized the underlying array handling to ensure "State Persistence." This eliminates the logic gaps common in real-time script execution, ensuring that historical signals are 100% consistent with live alerts.
3. Adaptive AI Clustering Utilizes K-means clustering to dynamically select the optimal ATR factors based on current market volatility, allowing the strategy to "evolve" as market regimes shift.
🧠 開發理念:追求實戰一致性的量化策略 本策略旨在為台指期(TX)提供一套具備真實參考價值的自動化系統。
✨ Echo 版核心優化點
數據連續性迭代:修正底層邏輯,確保訊號在即時盤勢中穩定不跳斷。
真實交易成本模擬:預設 2 點滑價 與 單邊 100 TWD 手續費,單邊總成本對標 500 TWD,拒絕虛假神單,挑戰最嚴苛的回測環境。
台指期專屬參數調校:融入針對台灣市場波動特性的預設參數與過濾邏輯。
🛡️ 進階實戰過濾
空間緩衝區 (Buffer Strategy):價格需有效突破緩衝區才觸發,精準過濾盤整雜訊。
AI 信心評分系統:只有當動能穩定度達標時才會發進場訊號。
冷卻保護機制:有效抑制訊號在洗盤區間過度頻繁跳動。
⚠️ Disclaimer: Backtest results do not guarantee future performance.

Euro Day StrategyThis is a false breakout reversal strategy that fades short-term breakouts when they conflict with longer-term momentum. Here's the detailed breakdown:
Strategy Overview
Type: Counter-trend/Fade strategy disguised as breakout trading
Core Logic: Enter against immediate breakouts when longer-term momentum suggests the move is exhausted.
Strategy Classification
This is a FADE/EXHAUSTION strategy, NOT a breakout-following strategy
Enters against the immediate breakout direction
Bets on mean reversion when short-term price action diverges from longer-term momentum
Works best in ranging/choppy markets where breakouts frequently fail
Will get hurt in strong trending markets where breakouts are genuine
This strategy is designed for intraday mean-reversion trading on instruments that tend to range (likely forex or futures). It requires markets where false breakouts are common and price tends to snap back quickly.

AI Adaptive Trend Navigator Echo EditionAI Adaptive Trend Navigator
This is an advanced trend-following system optimized for high-volatility index futures (TX). Built upon the LuxAlgo clustering framework, this version introduces several critical enhancements to meet professional trading standards:
1. State Consistency Iteration Enhanced the underlying logic for dynamic arrays and User-Defined Types (UDTs) to ensure stable "State Persistence." This fix eliminates logic gaps during real-time price fluctuations, ensuring that historical backtests perfectly align with live execution.
2. Adaptive Factor Tuning (K-means) The system simulates dozens of parameter paths in real-time, using K-means clustering to automatically select the optimal factor suited for the current market volatility.
3. Advanced Practical Filters
Dynamic Buffer Strategy: Filters out market noise during consolidation and early session volatility.
Confidence Threshold: Only triggers signals when the AI performance score meets the required quality.
Cooldown Logic: Prevents rapid signal flipping in choppy markets.
🧠 開發理念:將 AI 自適應力帶入台指期實戰 針對台指期(TX)高波動特性開發,透過機器學習演算法動態尋優,解決傳統指標參數固定的滯後性。
✨ Echo 版核心優化點
數據連續性迭代:底層邏輯優化,確保訊號在即時盤勢中穩定不跳斷,回測與實戰高度吻合。
自適應動態尋優:透過 K-means 聚類自動鎖定當前最佳 ATR 因子。
實戰多重濾網:包含空間緩衝區 (Buffer) 與信心門檻,大幅提升訊號品質。
📊 視覺說明
🚀 Rocket: AI confirms trend momentum.
⚡ Lightning: Trend exhaustion or reversal warning.
⚠️ Disclaimer: For educational and technical analysis purposes only.
