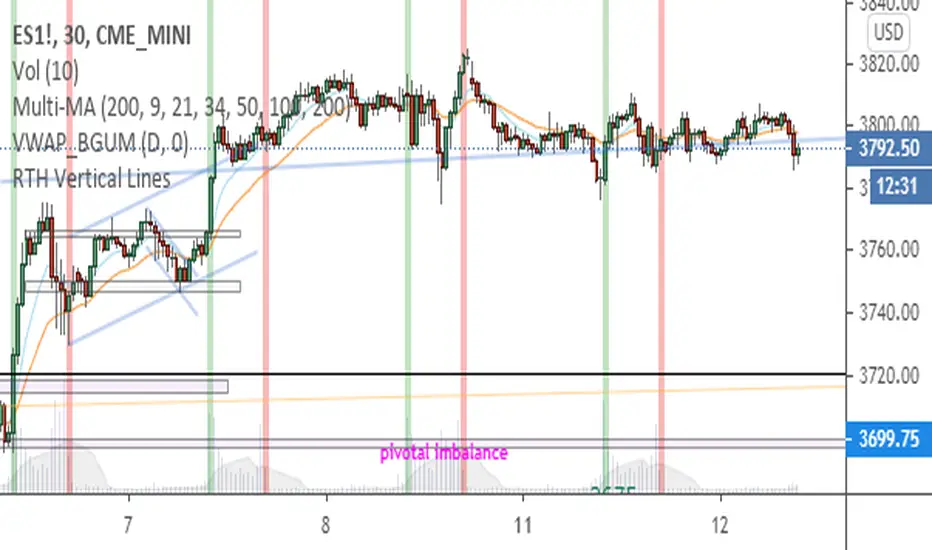
Real Trading Hours - Vertical Lines - Mark RTH for Futures 12/Jan/2021 09:15 AM AUTHOR: Brandon Gum
--
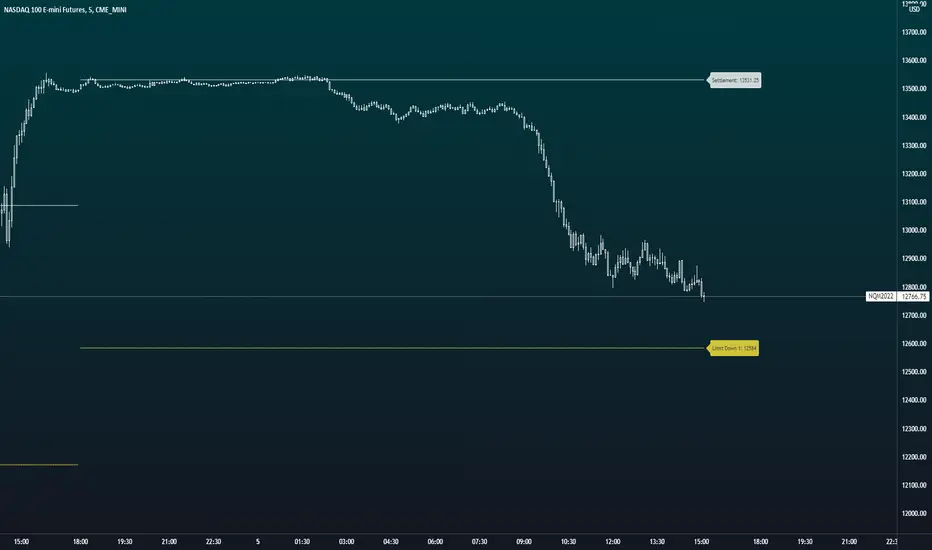
Updated script to plot vertical lines for open and close of futures.
Not sure why the 8:30 and 15:00 times had to be used over 9:30 or 16:00
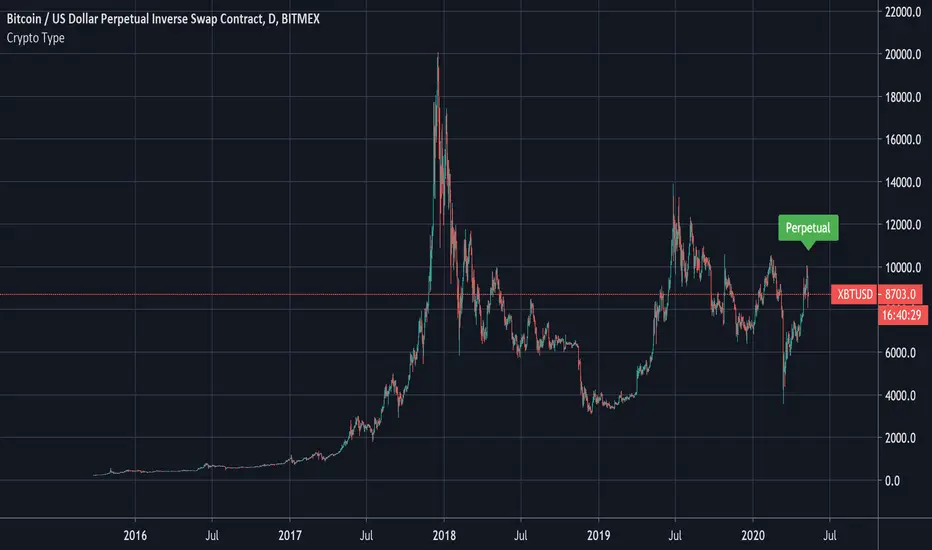
Only plots for products of type futures. - Could be easily expanded to work with cryptos as well if you wanted.
======================
Indicador Pine Script®