pandas_taLibrary "pandas_ta"
Level: 3
Background
Today is the first day of 2022 and happy new year every tradingviewers! May health and wealth go along with you all the time. I use this chance to publish my 1st PINE v5 lib : pandas_ta
This is not a piece of cake like thing, which cost me a lot of time and efforts to build this lib. Beyond 300 versions of this script was iterated in draft.
Function
Library "pandas_ta"
PINE v5 Counterpart of Pandas TA - A Technical Analysis Library in Python 3 at github.com
The Original Pandas Technical Analysis (Pandas TA) is an easy to use library that leverages the Pandas package with more than 130 Indicators and Utility functions and more than 60 TA Lib Candlestick Patterns.
I realized most of indicators except Candlestick Patterns because tradingview built-in Candlestick Patterns are even more powerful!
I use this to verify pandas_ta python version indicators for myself, but I realize that maybe many may need similar lib for pine v5 as well.
Function Brief Descriptions (Pls find details in script comments)
bton --> Binary to number
wcp --> Weighted Closing Price (WCP)
counter --> Condition counter
xbt --> Between
ebsw --> Even Better SineWave (EBSW)
ao --> Awesome Oscillator (AO)
apo --> Absolute Price Oscillator (APO)
xrf --> Dynamic shifted values
bias --> Bias (BIAS)
bop --> Balance of Power (BOP)
brar --> BRAR (BRAR)
cci --> Commodity Channel Index (CCI)
cfo --> Chande Forcast Oscillator (CFO)
cg --> Center of Gravity (CG)
cmo --> Chande Momentum Oscillator (CMO)
coppock --> Coppock Curve (COPC)
cti --> Correlation Trend Indicator (CTI)
dmi --> Directional Movement Index(DMI)
er --> Efficiency Ratio (ER)
eri --> Elder Ray Index (ERI)
fisher --> Fisher Transform (FISHT)
inertia --> Inertia (INERTIA)
kdj --> KDJ (KDJ)
kst --> 'Know Sure Thing' (KST)
macd --> Moving Average Convergence Divergence (MACD)
mom --> Momentum (MOM)
pgo --> Pretty Good Oscillator (PGO)
ppo --> Percentage Price Oscillator (PPO)
psl --> Psychological Line (PSL)
pvo --> Percentage Volume Oscillator (PVO)
qqe --> Quantitative Qualitative Estimation (QQE)
roc --> Rate of Change (ROC)
rsi --> Relative Strength Index (RSI)
rsx --> Relative Strength Xtra (rsx)
rvgi --> Relative Vigor Index (RVGI)
slope --> Slope
smi --> SMI Ergodic Indicator (SMI)
sqz* --> Squeeze (SQZ) * NOTE: code sufferred from very strange error, code was commented.
sqz_pro --> Squeeze PRO(SQZPRO)
xfl --> Condition filter
stc --> Schaff Trend Cycle (STC)
stoch --> Stochastic (STOCH)
stochrsi --> Stochastic RSI (STOCH RSI)
trix --> Trix (TRIX)
tsi --> True Strength Index (TSI)
uo --> Ultimate Oscillator (UO)
willr --> William's Percent R (WILLR)
alma --> Arnaud Legoux Moving Average (ALMA)
xll --> Dynamic rolling lowest values
dema --> Double Exponential Moving Average (DEMA)
ema --> Exponential Moving Average (EMA)
fwma --> Fibonacci's Weighted Moving Average (FWMA)
hilo --> Gann HiLo Activator(HiLo)
hma --> Hull Moving Average (HMA)
hwma --> HWMA (Holt-Winter Moving Average)
ichimoku --> Ichimoku Kinkō Hyō (ichimoku)
jma --> Jurik Moving Average Average (JMA)
kama --> Kaufman's Adaptive Moving Average (KAMA)
linreg --> Linear Regression Moving Average (linreg)
mgcd --> McGinley Dynamic Indicator
rma --> wildeR's Moving Average (RMA)
sinwma --> Sine Weighted Moving Average (SWMA)
ssf --> Ehler's Super Smoother Filter (SSF) © 2013
supertrend --> Supertrend (supertrend)
xsa --> X simple moving average
swma --> Symmetric Weighted Moving Average (SWMA)
t3 --> Tim Tillson's T3 Moving Average (T3)
tema --> Triple Exponential Moving Average (TEMA)
trima --> Triangular Moving Average (TRIMA)
vidya --> Variable Index Dynamic Average (VIDYA)
vwap --> Volume Weighted Average Price (VWAP)
vwma --> Volume Weighted Moving Average (VWMA)
wma --> Weighted Moving Average (WMA)
zlma --> Zero Lag Moving Average (ZLMA)
entropy --> Entropy (ENTP)
kurtosis --> Rolling Kurtosis
skew --> Rolling Skew
xev --> Condition all
zscore --> Rolling Z Score
adx --> Average Directional Movement (ADX)
aroon --> Aroon & Aroon Oscillator (AROON)
chop --> Choppiness Index (CHOP)
xex --> Condition any
cksp --> Chande Kroll Stop (CKSP)
dpo --> Detrend Price Oscillator (DPO)
long_run --> Long Run
psar --> Parabolic Stop and Reverse (psar)
short_run --> Short Run
vhf --> Vertical Horizontal Filter (VHF)
vortex --> Vortex
accbands --> Acceleration Bands (ACCBANDS)
atr --> Average True Range (ATR)
bbands --> Bollinger Bands (BBANDS)
donchian --> Donchian Channels (DC)
kc --> Keltner Channels (KC)
massi --> Mass Index (MASSI)
natr --> Normalized Average True Range (NATR)
pdist --> Price Distance (PDIST)
rvi --> Relative Volatility Index (RVI)
thermo --> Elders Thermometer (THERMO)
ui --> Ulcer Index (UI)
ad --> Accumulation/Distribution (AD)
cmf --> Chaikin Money Flow (CMF)
efi --> Elder's Force Index (EFI)
ecm --> Ease of Movement (EOM)
kvo --> Klinger Volume Oscillator (KVO)
mfi --> Money Flow Index (MFI)
nvi --> Negative Volume Index (NVI)
obv --> On Balance Volume (OBV)
pvi --> Positive Volume Index (PVI)
dvdi --> Dual Volume Divergence Index (DVDI)
xhh --> Dynamic rolling highest values
pvt --> Price-Volume Trend (PVT)
Remarks
I also incorporated func descriptions and func test script in commented mode, you can test the functino with the embedded test script and modify them as you wish.
This is a Level 3 free and open source indicator library.
Feedbacks are appreciated.
This is not the end of pandas_ta lib publication, but it is start point with pine v5 lib function and I will add more and more funcs into this lib for my own indicators.
Function Name List:
bton()
wcp()
count()
xbt()
ebsw()
ao()
apo()
xrf()
bias()
bop()
brar()
cci()
cfo()
cg()
cmo()
coppock()
cti()
dmi()
er()
eri()
fisher()
inertia()
kdj()
kst()
macd()
mom()
pgo()
ppo()
psl()
pvo()
qqe()
roc()
rsi()
rsx()
rvgi()
slope()
smi()
sqz_pro()
xfl()
stc()
stoch()
stochrsi()
trix()
tsi()
uo()
willr()
alma()
wcx()
xll()
dema()
ema()
fwma()
hilo()
hma()
hwma()
ichimoku()
jma()
kama()
linreg()
mgcd()
rma()
sinwma()
ssf()
supertrend()
xsa()
swma()
t3()
tema()
trima()
vidya()
vwap()
vwma()
wma()
zlma()
entropy()
kurtosis()
skew()
xev()
zscore()
adx()
aroon()
chop()
xex()
cksp()
dpo()
long_run()
psar()
short_run()
vhf()
vortex()
accbands()
atr()
bbands()
donchian()
kc()
massi()
natr()
pdist()
rvi()
thermo()
ui()
ad()
cmf()
efi()
ecm()
kvo()
mfi()
nvi()
obv()
pvi()
dvdi()
xhh()
pvt()
Pesquisar nos scripts por "Exponential"

Bogdan Ciocoiu - Looking Glass► Description
The script shows a multi-timeline suite of information for the current ticker. This information refers to configurable moving averages, RSI, Stochastic RSI, VWAP and TSI data. The timeframes reflected in the script vary from 1m to 1h. I recommend the tool for 3m scalping as it provides good visibility upwards.
The headings from the table are:
{Close} - {MA1}
{Close} - {MA2}
{Close} - {MA3}
{MA1} - {MA2}
{MA2} - {MA3}
{RSI}
{Stoch RSI K}
{Stoch RSI D}
{VWAP}
{TSI}
{TSI EMA}
{TSI} - {TSI EMA}
► Originality and usefulness
This tool is helpful because it helps users read a chart much quicker than if they were to navigate between timeframes. The colour coding indicates an accident/descendant trend between any two values (i.e. close vs MA1, MA1-MA2, RSI K vs RSI D, etc.).
► Open-source reuse
www.tradingview.com
www.tradingview.com
www.tradingview.com
www.tradingview.com
www.tradingview.com
MLActivationFunctionsLibrary "MLActivationFunctions"
Activation functions for Neural networks.
binary_step(value) Basic threshold output classifier to activate/deactivate neuron.
Parameters:
value : float, value to process.
Returns: float
linear(value) Input is the same as output.
Parameters:
value : float, value to process.
Returns: float
sigmoid(value) Sigmoid or logistic function.
Parameters:
value : float, value to process.
Returns: float
sigmoid_derivative(value) Derivative of sigmoid function.
Parameters:
value : float, value to process.
Returns: float
tanh(value) Hyperbolic tangent function.
Parameters:
value : float, value to process.
Returns: float
tanh_derivative(value) Hyperbolic tangent function derivative.
Parameters:
value : float, value to process.
Returns: float
relu(value) Rectified linear unit (RELU) function.
Parameters:
value : float, value to process.
Returns: float
relu_derivative(value) RELU function derivative.
Parameters:
value : float, value to process.
Returns: float
leaky_relu(value) Leaky RELU function.
Parameters:
value : float, value to process.
Returns: float
leaky_relu_derivative(value) Leaky RELU function derivative.
Parameters:
value : float, value to process.
Returns: float
relu6(value) RELU-6 function.
Parameters:
value : float, value to process.
Returns: float
softmax(value) Softmax function.
Parameters:
value : float array, values to process.
Returns: float
softplus(value) Softplus function.
Parameters:
value : float, value to process.
Returns: float
softsign(value) Softsign function.
Parameters:
value : float, value to process.
Returns: float
elu(value, alpha) Exponential Linear Unit (ELU) function.
Parameters:
value : float, value to process.
alpha : float, default=1.0, predefined constant, controls the value to which an ELU saturates for negative net inputs. .
Returns: float
selu(value, alpha, scale) Scaled Exponential Linear Unit (SELU) function.
Parameters:
value : float, value to process.
alpha : float, default=1.67326324, predefined constant, controls the value to which an SELU saturates for negative net inputs. .
scale : float, default=1.05070098, predefined constant.
Returns: float
exponential(value) Pointer to math.exp() function.
Parameters:
value : float, value to process.
Returns: float
function(name, value, alpha, scale) Activation function.
Parameters:
name : string, name of activation function.
value : float, value to process.
alpha : float, default=na, if required.
scale : float, default=na, if required.
Returns: float
derivative(name, value, alpha, scale) Derivative Activation function.
Parameters:
name : string, name of activation function.
value : float, value to process.
alpha : float, default=na, if required.
scale : float, default=na, if required.
Returns: float
EMA Index Cross by Hassonya
While the indicator is working on any stock chart, it shows the two ema average breakdown/breakup of the index or any other stock with an arrow. In this way, you will be able to follow the ema intersections of the index chart while working on a normal stock chart.
I will add other moving average options if you like it.
I hope you will be satisfied using it.
TURKISH
------------
Gösterge, herhangi bir hisse senedi grafiği üzerinde çalışırken, endeksin veya başka bir hisse senedinin iki ema ortalama dağılımını/dökülmesini bir okla gösterir.
Bu sayede normal bir hisse senedi grafiği üzerinde çalışırken endeks grafiğinin ema kesişimlerini takip edebileceksiniz.
Eğer beğenirseniz başka ortalama seçenekleri de ekleyeceğim.
Güle güle kullanın.

Moving Average Multitool CrossoverAs per request, this is a moving average crossover version of my original moving average multitool script .
It allows you to easily access and switch between different types of moving averages, without having to continuously add and remove different moving averages from your chart. This should make backtesting moving average crossovers much, much more easier. It also has the option to show buy and sell signals for the crossovers of the chosen moving averages.
It contains the following moving averages:
Exponential Moving Average (EMA)
Simple Moving Average (SMA)
Weighted Moving Average (WMA)
Double Exponential Moving Average (DEMA)
Triple Exponential Moving Average (TEMA)
Triangular Moving Average (TMA)
Volume-Weighted Moving Average (VWMA)
Smoothed Moving Average (SMMA)
Hull Moving Average (HMA)
Least Squares Moving Average (LSMA)
Kijun-Sen line from the Ichimoku Kinko-Hyo system (Kijun)
McGinley Dynamic (MD)
Rolling Moving Average (RMA)
Jurik Moving Average (JMA)
Arnaud Legoux Moving Average (ALMA)
Vector Autoregression Moving Average (VAR)
Welles Wilder Moving Average (WWMA)
Sine Weighted Moving Average (SWMA)
Leo Moving Average (LMA)
Variable Index Dynamic Average (VIDYA)
Fractal Adaptive Moving Average (FRAMA)
Variable Moving Average (VAR)
Geometric Mean Moving Average (GMMA)
Corrective Moving Average (CMA)
Moving Median (MM)
Quick Moving Average (QMA)
Kaufman's Adaptive Moving Average (KAMA)
Volatility-Adjusted Moving Average (VAMA)
Modular Filter (MF)

InterpolationLibrary "Interpolation"
Functions for interpolating values. Can be useful in signal processing or applied as a sigmoid function.
linear(k, delta, offset, unbound) Returns the linear adjusted value.
Parameters:
k : A number (float) from 0 to 1 representing where the on the line the value is.
delta : The amount the value should change as k reaches 1.
offset : The start value.
unbound : When true, k values less than 0 or greater than 1 are still calculated. When false (default), k values less than 0 will return the offset value and values greater than 1 will return (offset + delta).
quadIn(k, delta, offset, unbound) Returns the quadratic (easing-in) adjusted value.
Parameters:
k : A number (float) from 0 to 1 representing where the on the curve the value is.
delta : The amount the value should change as k reaches 1.
offset : The start value.
unbound : When true, k values less than 0 or greater than 1 are still calculated. When false (default), k values less than 0 will return the offset value and values greater than 1 will return (offset + delta).
quadOut(k, delta, offset, unbound) Returns the quadratic (easing-out) adjusted value.
Parameters:
k : A number (float) from 0 to 1 representing where the on the curve the value is.
delta : The amount the value should change as k reaches 1.
offset : The start value.
unbound : When true, k values less than 0 or greater than 1 are still calculated. When false (default), k values less than 0 will return the offset value and values greater than 1 will return (offset + delta).
quadInOut(k, delta, offset, unbound) Returns the quadratic (easing-in-out) adjusted value.
Parameters:
k : A number (float) from 0 to 1 representing where the on the curve the value is.
delta : The amount the value should change as k reaches 1.
offset : The start value.
unbound : When true, k values less than 0 or greater than 1 are still calculated. When false (default), k values less than 0 will return the offset value and values greater than 1 will return (offset + delta).
cubicIn(k, delta, offset, unbound) Returns the cubic (easing-in) adjusted value.
Parameters:
k : A number (float) from 0 to 1 representing where the on the curve the value is.
delta : The amount the value should change as k reaches 1.
offset : The start value.
unbound : When true, k values less than 0 or greater than 1 are still calculated. When false (default), k values less than 0 will return the offset value and values greater than 1 will return (offset + delta).
cubicOut(k, delta, offset, unbound) Returns the cubic (easing-out) adjusted value.
Parameters:
k : A number (float) from 0 to 1 representing where the on the curve the value is.
delta : The amount the value should change as k reaches 1.
offset : The start value.
unbound : When true, k values less than 0 or greater than 1 are still calculated. When false (default), k values less than 0 will return the offset value and values greater than 1 will return (offset + delta).
cubicInOut(k, delta, offset, unbound) Returns the cubic (easing-in-out) adjusted value.
Parameters:
k : A number (float) from 0 to 1 representing where the on the curve the value is.
delta : The amount the value should change as k reaches 1.
offset : The start value.
unbound : When true, k values less than 0 or greater than 1 are still calculated. When false (default), k values less than 0 will return the offset value and values greater than 1 will return (offset + delta).
expoIn(k, delta, offset, unbound) Returns the exponential (easing-in) adjusted value.
Parameters:
k : A number (float) from 0 to 1 representing where the on the curve the value is.
delta : The amount the value should change as k reaches 1.
offset : The start value.
unbound : When true, k values less than 0 or greater than 1 are still calculated. When false (default), k values less than 0 will return the offset value and values greater than 1 will return (offset + delta).
expoOut(k, delta, offset, unbound) Returns the exponential (easing-out) adjusted value.
Parameters:
k : A number (float) from 0 to 1 representing where the on the curve the value is.
delta : The amount the value should change as k reaches 1.
offset : The start value.
unbound : When true, k values less than 0 or greater than 1 are still calculated. When false (default), k values less than 0 will return the offset value and values greater than 1 will return (offset + delta).
expoInOut(k, delta, offset, unbound) Returns the exponential (easing-in-out) adjusted value.
Parameters:
k : A number (float) from 0 to 1 representing where the on the curve the value is.
delta : The amount the value should change as k reaches 1.
offset : The start value.
unbound : When true, k values less than 0 or greater than 1 are still calculated. When false (default), k values less than 0 will return the offset value and values greater than 1 will return (offset + delta).
using(fn, k, delta, offset, unbound) Returns the adjusted value by function name.
Parameters:
fn : The name of the function. Allowed values: linear, quadIn, quadOut, quadInOut, cubicIn, cubicOut, cubicInOut, expoIn, expoOut, expoInOut.
k : A number (float) from 0 to 1 representing where the on the curve the value is.
delta : The amount the value should change as k reaches 1.
offset : The start value.
unbound : When true, k values less than 0 or greater than 1 are still calculated. When false (default), k values less than 0 will return the offset value and values greater than 1 will return (offset + delta).

EMA deviation & Range with barcolor changeThis indicator includes an EMA, a range and outer lines similar to the Bollinger Bands, but with a different calculation (which also becomes apparent once you compare the two). This indicator fits very well with the EMA pullback strategy.
The color of the candles changes depending on where it is located.
Above the EMA - green
Below it - red
Inside the range - black
All colors as well as lines are customizable under the Style tab.
The "Deviation" can be set to 0, here there are only slight deviations.
The EMA range can be adjusted in 0.1 steps to achieve the highest possible accuracy of the pullbacks.
If you have any questions, please don't hesitate to contact me.

Simple Ema_ATR Strategy HulkTradingSimple EMA strategy, based on ema55+ema21 and ATR(Average True Range) and it enters a deal from ema55 when the other entry conditions are met
Basically long and short conditions
If long:
1) close must be less than open (because we are searching for a pullback)
2) emaFast(21) must be bigger than emaSlow(55) - for a trend detection
3) Difference between emaFast and emaSlow must be greater than ATR(14) - for excluding flat
For short conditions are opposite
Stop levels and take profits, based on ATR multiplier.
You can change it in input field.
I recommended values between 1 and 4, not more.
This strategy was tested on pairs BTCUSDT and ETHUSDT and have a nice results.

Indicator: SMA/EMA (Multi timeframes)This moving average indicator will plot the SMA or EMA sourced from a different timeframe on the current chart.
Applications:
Say you are viewing an hourly chart but you also want to know the ema20 sourced from a higher timeframe (i.e daily) of the same security. The problem with using most built-in indicators is that the MA values are usually calculated from the current chart, so to do that, you will have to toggle between 1h/1D. This script will eliminate this hassle by plotting out the desired alternative timeframe on the same chart.
Dynamic settings
By default the alternative timeframe is 1D, but this can be customized further:
- 1 week chart -> plots out 1 month MA
- 1 day chart -> plots out 1 week MA
- 1 hour chart -> plots out 1 day MA

MACD-EDT "EMA DEMA TEMA" [DM]Greetings to all colleagues
Today I share a MACD with the EMA , DEMA , TEMA variants.
The aim is that they can see how the signals vary from a normal MACD to one with the averages created by Patrick Mulloy (1994)
Variables of this MACD:
EMA = Exponential Moving Average
DEMA = Double Exponential Moving Average
TOPIC = Triple Exponential Moving Average
He also has in the arsenal:
SMA Simple Moving Average
WMA Weighted Moving Average
Plus...:
Volume-weighted variant in all of them
Visual options:
Points at the crossroads
Shadows on the body of the signals
All colors are customizable
Histogram and shadow are gradients at 15 steps
It has switches for:
Shadow
Histogram
Macd and signal
Crosses
Some minor details remain to be incorporated in the next few days.
Pre-cross calculation.
Alerts
Bar color
Enjoy!!! ;-)

SirSeff's EMA RainbowThis strategy uses divergences between three exponential moving averages and their slope directions as well as crosses between the price and these moving averages to switch between a long or short position. The strategy is non-stop in the market and always either long or short.\
This trend trading strategy uses exponential moving averages of 10, 20, 50, 100, 150, 200 to gauge the price action cycle if it is on Stage 2 aka Mark up famously coined by Dr.Wykcoff.
It opens a position when the closing price crosses above the 10ema and all the exponential moving averages are stacked up together. Stacked-up Moving averages are used by Mark Minervini and Oliver Kell.
I close a position at an 8% trailing stop from the opened position which makes the succeeding buy orders as scaling up or averaging up from an established bullish trend.
All trading involves high risk; past performance is not necessarily indicative of future results. Hypothetical or simulated performance results have certain inherent limitations. Unlike an actual performance record, simulated results do not represent actual trading. Also, since the trades have not actually been executed, the results may have under-or over-compensated for the impact, if any, of certain market factors, such as lack of liquidity. Simulated trading programs in general are also subject to the fact that they are designed with the benefit of hindsight. No representation is being made that any account will or is likely to achieve profits or losses similar to those shown.

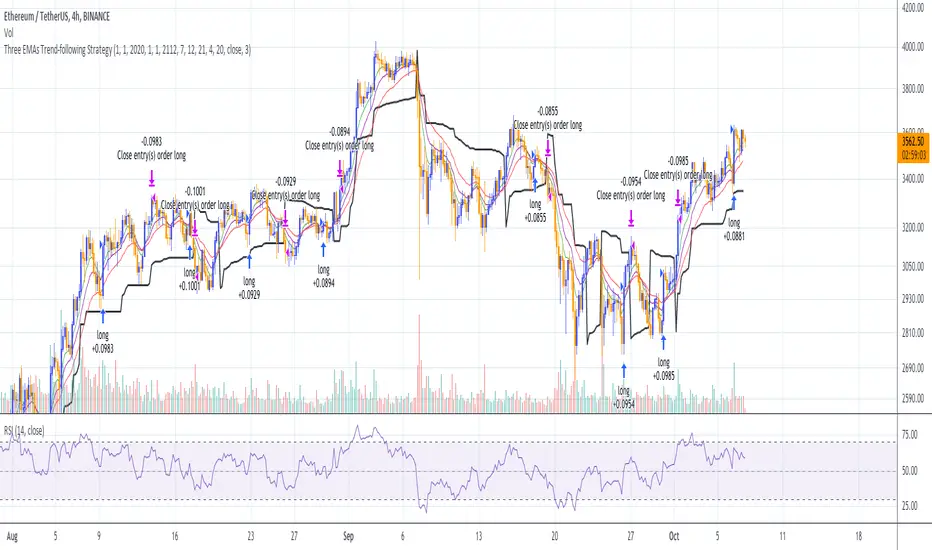
Three EMAs Trend-following Strategy (by Coinrule)Trend-following strategies are great because they give you the peace of mind that you're trading in line with the market.
However, by definition, you're always following . That means you're always a bit later than your want to be. The main challenges such strategies face are:
Confirming that there is a trend
Following the trend, hopefully, early enough to catch the majority of the move
Hopping off the trade when it seems to have run its course
This EMA Trend-following strategy attempts to address such challenges while allowing for a dynamic stop loss.
ENTRY
The trading system requires three crossovers on the same candle to confirm that a new trend is beginning:
Price crossing over EMA 7
Price crossing over EMA 14
Price crossing over EMA 21
The first benefit of using all three crossovers is to reduce false signals. The second benefit is that you know that a strong trend is likely to develop relatively soon, with the help of the fast setup of the three EMAs.
EXIT
The strategy comes with a fixed take profit and a volatility stop, which acts as a trailing stop to adapt to the trend's strength. That helps you get out of the way as soon as market conditions change. Depending on your long term confidence in the asset, you can edit the fixed take profit to be more conservative or aggressive.
The position is closed when:
The price increases by 4%
The price crosses below the volatility stop.
The best time frame for this strategy based on our backtest is the 4-hr. Shorter timeframes can also work well, although they exhibit larger volatility in their returns. In general, this approach suits medium timeframes. A trading fee of 0.1% is taken into account. The fee is aligned to the base fee applied on Binance, which is the largest cryptocurrency exchange.
You can execute this strategy on your favourite exchange at coinrule.com
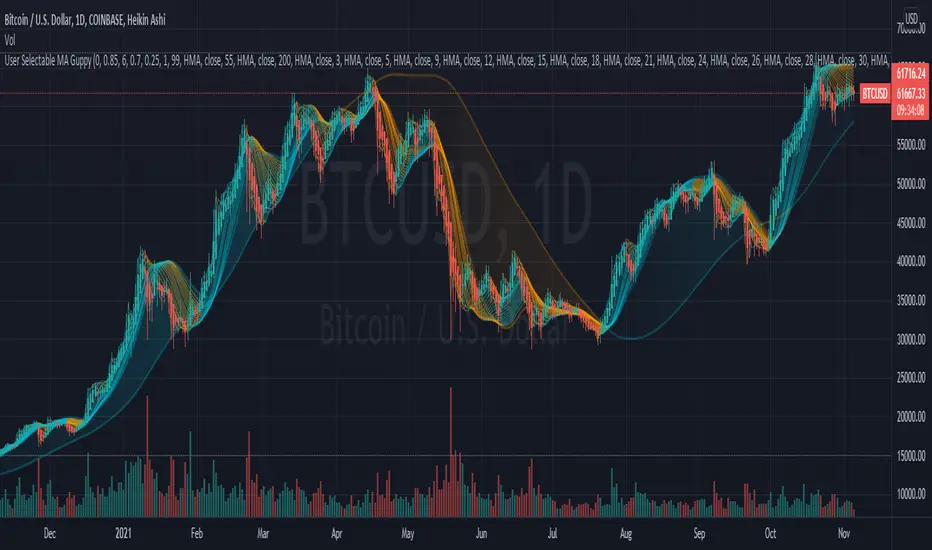
User Selectable Moving Average GuppyA version of the popular "Moving Average Ribbon" or "Guppy" indicators, except nearly everything about it is user selectable. The user can change the source, period, and type of moving average used for every single line on the chart. Note: The visuals are fairly intensive and may take a moment to catch up after adjusting settings.
Credit: This script utilizes the "Color Gradient Framework" tutorial by LucF (PineCoders) to create gradient visuals, which are also customizable for the user.
Moving Average Options:
Running (SMoothed) Moving Average (RMA or SMMA) - Slowest
Simple Moving Average (SMA) - Slow
Exponential Moving Average (EMA) - Responds faster to price than SMA
Weighted Moving Average (WMA)
Volume-Weighted Moving Average (VWMA)
Triple EMA (TEMA)
Exponential Hull Moving Average (EHMA) - Hull with Smoothing (Slower than Hull)
Least Squares Moving Average (LSMA) - Simple Linear Regression
Arnaud Legoux Moving Average (ALMA) - Adjustable, set offset=1 to be current, offset=0.85 for good smoothing (Slower)
Hull Moving Average (HMA) - Normally responds fastest to price of all options
Value Added :
This script is unique in that it allows the user to chart the "Guppy", except nearly everything about it is customizable. The user can change the source, period, and type of moving average used for every single line.
Typically, the Guppy is plotted with simple moving average or exponential moving average, which respond much slower to price than the Hull Moving Average, which this indicator uses as default. (Elimination of lag)
The Hull MA settings for the highest time frame moving averages should work well for assessing the overall macro trend, with a nice visual presentation. Additional labels and alerts for the macro trend are available.
Furthermore, this script provides many more options for type of moving average than is typical for a moving average indicator that provides the user with options, including advanced options such as Hull, TEMA, and ALMA.
The visual presentation is customizable and should provide some entertainment for users who want to create pretty charts.
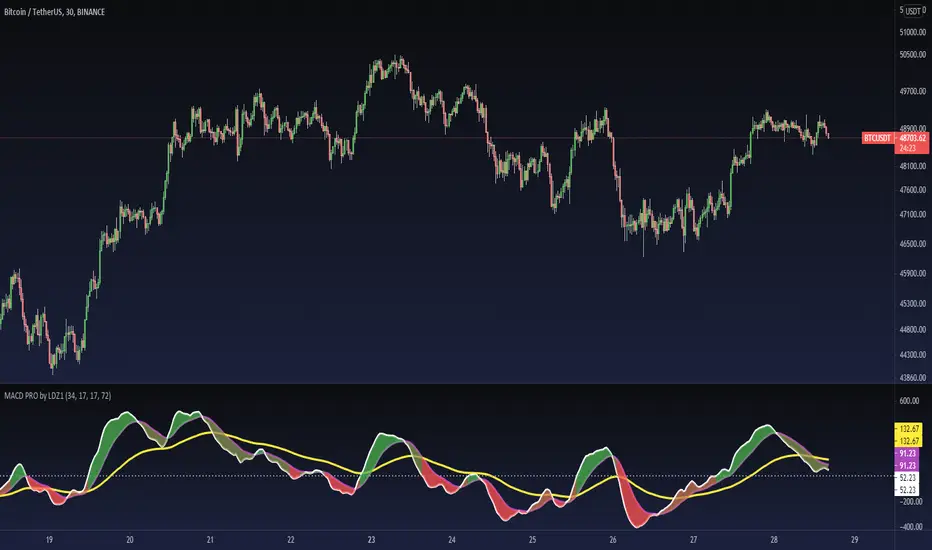
MACD PRO by LDZ1LANDZZ1 MACD Pro was developed to show the first signs of reversal, direction, and also trend strength.
Unlike normal MACD, this indicator has 3 lines as information. A white line (short EMA), a purple line (sign), and a yellow line (long EMA).
The Purple Line "Signal" is a 17-period Exponential Moving Average.
The White Line "Short EMA" is a 34-period Exponential Moving Average.
The Yellow Line "Long EMA" is a 72-Period Exponential Moving Average.
When the background color turns green it indicates that we are above 0 (positive trend) and above the Signal line (positive trend)
When the background color turns Yellow it indicates that we are above 0 (positive trend) but below the Signal line (Indicating Attention to a possible trend reversal or price correction)
When the background color turns Red it indicates that we are below 0 (negative trend) and below the Signal line (negative trend)
When the background color turns Orange it indicates that we are below 0 (negative trend) and above the signal line (Indicating attention to a possible trend reversal or price correction)
The Yellow line is like a watershed, when the White Line "Short EMA" crosses above or below it, it indicates that a stronger price movement may occur.
Tip:
Only enter Long Positions when the background color turns green and the Short EMA (White line) is above the yellow line and/or the white dotted horizontal line.
Only enter Short Positions when the background color turns red and the Long EMA (Yellow line) is below the white dotted horizontal line.
Note the difference of MACD Pro by LANDZZ1 as the traditional MACD.
----------------------------------------------------------
Description in Portuguese-BR
MACD Pro by LANDZZ1 foi desenvolvido para mostrar os primeiros sinais de reversão, direção e também força da tendência.
Diferente do MACD normal, este indicador tem como informação 3 linhas. Uma linha branca (short EMA), uma linha roxa(signal) e uma linha amarela (long EMA).
A Linha Roxa "Signal" é uma Média Móvel Exponencial de 17 períodos.
A Linha branca "Short EMA" é uma Média Móvel Exponencial de 34 períodos.
A Linha Amarela "Long EMA" é uma Média Móvel Exponencial de 72 Períodos.
Quando a cor de fundo ficar verde indica que estamos acima de 0 (tendência positiva) e acima da linha de Sinal (tendência positiva)
Quando a cor de fundo ficar Amarelo indica que estamos acima de 0 (tendência positiva) porém abaixo da linha de Sinal (Indicando Atenção a uma possível reversão de tendência ou correção de preço)
Quando a cor de fundo ficar vermelho indica que estamos abaixo de 0 (tendência negativa) e abaixo da linha de Sinal (tendência negativa)
Quando a cor de fundo ficar laranja indica que estamos abaixo de 0 (tendência negativa) e acima da linha de sinal (Indicando atenção a uma possível reversão de tendência ou correção do preço)
A linha amarela é como um divisor de águas, quando a linha branca (Short EMA) cruza para cima ou para baixo dela, indica que um movimento mais forte forte de preço poderá ocorrer.
Dica:
Apenas entre em Long Positions quando a cor de fundo ficar verde e se a Short EMA (linha Branca) estiver acima da linha amarela e/ou da linha horizontal pontilhada branca.
Apenas entre em Short Positions quando a cor de fundo ficar Vermelha e se a Long EMA (linha Amarela) estiver abaixo da linha horizontal pontilhada branca.
Repare a diferença do MACD Pro by LANDZZ1 como o MACD tradicional.
ADX / RSI Strategy by Trade Rush (created by SirPoggy) This is one of many new strategies coming soon which were seen on Trade Rush
This one is the ADX / RSI Strategy seen here:
https:www.youtube.com/watch?v=uSkGE0ujyn4
While the strategy has been modified slightly to use the DMI instead of the ADX, the core of the strategy is essentially the same
Long signals are generated when the RSI is above 70, close is above the 200EMA, and the ADX is above 25 (added is the plus DMI over 25 and minus DMI below 20)
Stop loss is placed below /above the 21 EMA, however, there is a deviation required to ensure price is not too close to where a stop loss would be placed.
Short signals are generated when the RSI is below 30, close is below the 200EMA, and the ADX is above 25 (added is the minus DMI over 25 and plus DMI below 20)
I do not recommend using this strategy but I have provided this code for educational purposes.
Thanks!
Let me know which strategy you'd like coded next in the comments below.

RSI Cross [xaurr]This is simple but profitable rsi cross strategy, to find optimal values you can change rsi and ema periods.
Good Luck!

TradePro's Trading Idea Cipher Divergence EMA Pb StrategyHere I present you on of Trade Pro's Trading Idea: Cipher B+ Divergence EMA Pullback Strategy.
Optimized the crypto pairBTC/USDT in the 30 minute chart.
There is the possibility to switch between short and long positions.
You can choose between 2 different take profit/stop loss types: The Lowest Low/ Highest High Stop Loss/ Take Profit and the ATR Take Profit/ Stop Loss.
-----------------------------------------------------------------------------------
How does the strategy work?
ENTRY
Long
The price must be above the 200 EMA .
The price needs to make a pullback into the 50 EMA .
Right after that, the Cipher B indicator must give a buy signal, it must be below the zero line and the Money Flow cloud must be green.
Short
Contrary to the premise of long positions.
EXIT
Lowest Low/ Highest High Exit
The Lowest Low (long) / highest high (short) serves as the stop loss. The TP is formed on the basis of a factor.
(Long for example: *Lowest Low* multiplied by *Profitfactor* = TP).
ATR Exit
The value of ATR at the time of buying is multiplied by the value entered in "Profit factor ATR" and "Stop factor ATR". As soon as the price reaches this value, it is closed.
Important
The script must be optimized for each coin or currency pair. However, only the values for the profit factor, the stop loss and Lowest Low / Highest High are relevant.
Also, by changing the Chanel Length and the Chanel Average, you can create strong profit changes.
The results of the strategy are without commissions and leverage.
If you have any questions or feedback, please let me know in the comments.
If you need more information about the strategy and want to know exactly how to apply it, check out my profile. There I have created a tutorial for the function of the script.

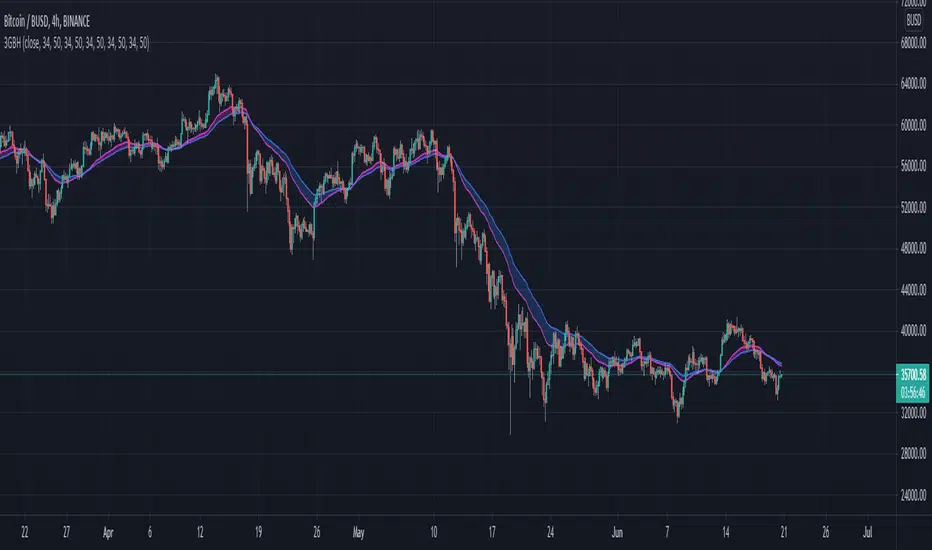
3GBH - Multiple MA'sIncluded in this indicator:
- Fast/Slow EMA's
- Fast/Slow SMA's
- Fast/Slow WMA's
- Fast/Slow HMA's
- Fast/Slow RMA's
-----
Use of of the type of Moving Averages.
Or use them all.
-----
User-friendly.
You can change all the inputs, they are labelled for ease-of-use.
You can toggle On/Off any or all of the options.
Ichimoku EMA RSI - Crypto only long StrategyHey there!
Here I show you an Ichimoku Cloud Strategy.
I discovered the strategy on a YouTube channel and tried to transfer it as a strategy into a script.
He said in his video that you would make more profit with this strategy than holding the coin.
Tested with the crypto pair ETH/USDT in the four hour chart.
Period: beginning of 2017 until today.
The strategy should also work with foreign exchange. But then the settings have to be adjusted.
There is the possibility to activate two EMA's and a Stochastic RSI .
-----------------------------------------------------------------------------------
How does the strategy work?
ENTRY
The green Ichimoku lead line must above the red Ichimoku lead line - only the two lead lines are activated.
A green candle must closed above the green lead line.
EXIT
A red candle must close below the green Ichimoku lead line.
OPTIONAL ENTRY
EMA
Once you activate the EMA , long positions will only be taken once the EMA1 is above the EMA2.
Thereby I could observe a significant increase of the profit as well as a decrease of the maximum drawdown.
RSI
As soon as you activate the Stochastic RSI , long positions are only taken when the K line is above the D line.
In the future, I may add an oversold - undersold parameter.
The results of the strategy are without commissions and levers.
If you have any questions or feedback, please let me know in the comments.
If you need more information about the strategy and want to know exactly how to apply it, check out my profile.
I wish you good luck with the strategy!

Shaded Tripple MAsThree moving averages that have shaded area between its sma and ema versions. Default lengths are 50, 100 and 200.

Custom Multi-Timeframe Screener with AlertsThis is a multi-timeframe screener with alerts. Use this way you can create a screener on indicators using 2 or more timeframes.
In TradingView there is a limit of 40 security function calls. Every timeframe requires another security call so you can screen fewer symbols with any additional timeframe.
In this example, I use 2 timeframes, so the maximum amount of symbols you can scan is 40/2 = 20.
For 3 timeframes - 13, 4tfs - 10, 5tfs - 8 symbols and so on.
In this simplistic example, I require a cross of EMAs on the current timeframe and confirmation that one EMA above/below another from the second timeframe.
Of course, you can create much more complicated functions for this screener.
Params
- higher timeframe
- ema params
- 20 symbol inputs for instruments you want to use in this screener
Alerts
You can create an alert from it easily by selecting the screener name from the list and then selecting "Any alert() function call".
No additional configuration is required, message and alert on close is generated in the code.
You should better change the default name for your alert. Sometimes because of big amount of inputs you might receive an error.
Disclaimer
Please remember that past performance may not be indicative of future results.
Due to various factors, including changing market conditions, the strategy may no longer perform as good as in historical backtesting.
This post and the script don’t provide any financial advice.

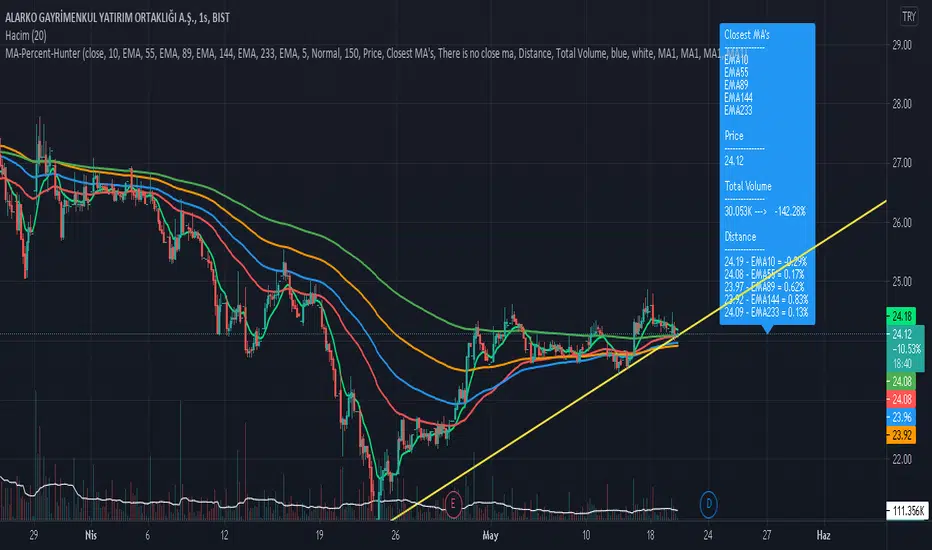
Moving Average Percentage Hunter by HassonyaIn this indicator study, we aim to capture the moving averages to which the bar close is closest. The indicator shows the moving averages, which are closest to the percentage value we selected, on the label. It indicates the names of the closest averages at the top of the label with a (near) note next to them. If none of the averages are close to the specified percentage value, there will be a no nearness warning. The indicator supports the heikin ashi candles. For this setting, check the I'm using heikin ashi candles box.
Thanks to this feature of the indicator, you will be able to see bar proximity to the moving averages you use continuously. You can make purchases and sales by using this feature to your advantage. This way you can easily catch reaction turns.
If you want, you can turn off moving averages in the settings section. You can open it whenever you need. You can do this in the show moving averages box. Appears if you check it, disappears if you uncheck it.
There are 5 moving average options. SMA, EMA, WMA, TMA and HullMA moving averages. Moving average names and values in the list are dynamically adjusted. When you change the settings, the moving average names and values in the list will change automatically. At the bottom of the settings, you can determine the lengths of the moving averages yourself. In the next update, each moving average will have a different average option.
You can enter percentage values, fractional figures. for example (3.5, 5.2 vb.) The indicator will show you the value you give and the proximity of the value below that value. You can adjust this setting in MA Percentage Nearness.
More detailed options will be available in the next update. Range of values, options below, above, and so on.
In the settings section, there is a Show distance option. If you check this option, you can continuously see the percentage values of the distance to the moving averages on the label. For this feature, you have to check the show distance box.
The alarm feature will come in the next update.
Thanks for support. Good Luck.
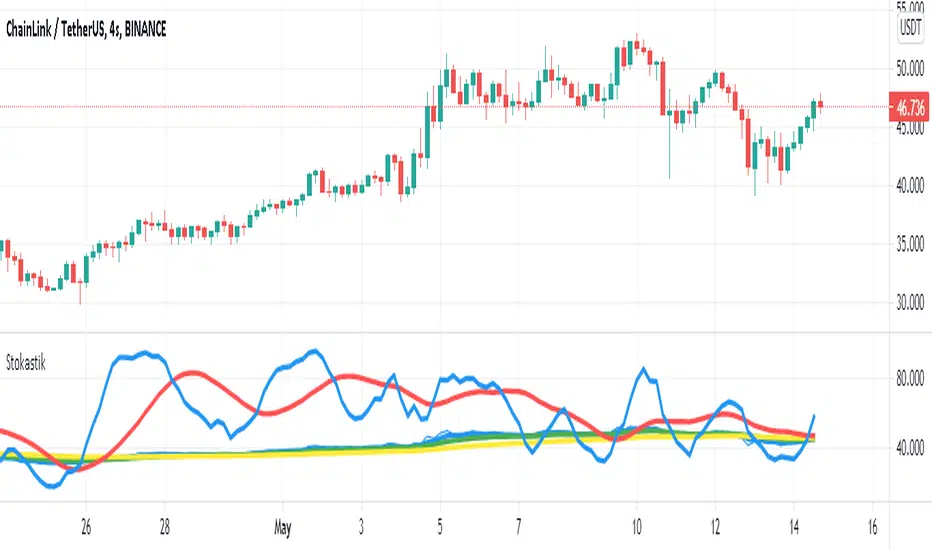
4-Hour Stochastic EMA TrendThis trading strategy relies heavily on catching the trend. You
may have success using this strategy on as low as the one hour
chart or as high as the daily chart; however, I’ve had most
success trading it on the four hour chart. This strategy consists
of four indicators, which are:
1. 5 Period Exponential Moving Average (closed)
2. 15 Period Exponential Moving Average (closed)
3. 50 Period Exponential Moving Average (closed)
4. Stochastic indicator K=13 D=5 Smooth=5 (13,5,5) 80/20
Levels
Refer