EMA Dynamic Crossover Detector with Real-Time Signal TableDescriptionWhat This Indicator Does:This indicator monitors all possible crossovers between four key exponential moving averages (20, 50, 100, and 200 periods) and displays them both visually on the chart and in an organized data table. Unlike standard EMA indicators that only plot the lines, this tool actively detects every crossover event, marks the exact crossover point with a circle, records the precise price level, and maintains a running log of all crossovers during the trading session. It's designed for traders who want comprehensive EMA crossover analysis without manually watching multiple moving average pairs.Key Features:
Four Essential EMAs: Plots 20, 50, 100, and 200-period exponential moving averages with color-coded thin lines for clean chart presentation
Complete Crossover Detection: Monitors all 6 possible EMA pair combinations (20×50, 20×100, 20×200, 50×100, 50×200, 100×200) in both directions
Precise Price Marking: Places colored circles at the exact average price where crossovers occur (not just at candle close)
Real-Time Signal Table: Displays up to 10 most recent crossovers with timestamp, direction, exact price, and signal type
Session Filtering: Only records crossovers during active trading hours (10:00-18:00 Istanbul time) to avoid noise from low-liquidity periods
Automatic Daily Reset: Clears the signal table at the start of each new trading day for fresh analysis
Built-In Alerts: Two alert conditions (bullish and bearish crossovers) that can be configured to send notifications
How It Works:The indicator calculates four exponential moving averages using the standard EMA formula, then continuously monitors for crossover events using Pine Script's ta.crossover() and ta.crossunder() functions:Bullish Crossovers (Green ▲):
When a faster EMA crosses above a slower EMA, indicating potential upward momentum:
20 crosses above 50, 100, or 200
50 crosses above 100 or 200
100 crosses above 200 (Golden Cross when it's the 50×200)
Bearish Crossovers (Red ▼):
When a faster EMA crosses below a slower EMA, indicating potential downward momentum:
20 crosses below 50, 100, or 200
50 crosses below 100 or 200
100 crosses below 200 (Death Cross when it's the 50×200)
Price Calculation:
Instead of marking crossovers at the candle's close price (which might not be where the actual cross occurred), the indicator calculates the average price between the two crossing EMAs, providing a more accurate representation of the crossover point.Signal Table Structure:The table in the top-right corner displays four columns:
Saat (Time): Exact time of crossover in HH:MM format
Yön (Direction): Arrow indicator (▲ green for bullish, ▼ red for bearish)
Fiyat (Price): Calculated average price at the crossover point
Durum (Status): Signal classification ("ALIŞ" for buy signals, "SATIŞ" for sell signals) with color-coded background
The table shows up to 10 most recent crossovers, automatically updating as new signals appear. If no crossovers have occurred during the session within the time filter, it displays "Henüz kesişim yok" (No crossovers yet).EMA Color Coding:
EMA 20 (Aqua/Turquoise): Fastest-reacting, most sensitive to recent price changes
EMA 50 (Green): Short-term trend indicator
EMA 100 (Yellow): Medium-term trend indicator
EMA 200 (Red): Long-term trend baseline, key support/resistance level
How to Use:For Day Traders:
Monitor 20×50 crossovers for quick entry/exit signals within the day
Use the time filter (10:00-18:00) to focus on high-volume trading hours
Check the signal table throughout the session to track momentum shifts
Look for confirmation: if 20 crosses above 50 and price is above EMA 200, bullish bias is stronger
For Swing Traders:
Focus on 50×200 crossovers (Golden Cross/Death Cross) for major trend changes
Use higher timeframes (4H, Daily) for more reliable signals
Wait for price to close above/below the crossover point before entering
Combine with support/resistance levels for better entry timing
For Position Traders:
Monitor 100×200 crossovers on daily/weekly charts for long-term trend changes
Use as confirmation of major market shifts
Don't react to every crossover—wait for sustained movement after the cross
Consider multiple timeframe analysis (if crossovers align on weekly and daily, signal is stronger)
Understanding EMA Hierarchies:The indicator becomes most powerful when you understand EMA relationships:Bullish Hierarchy (Strongest to Weakest):
All EMAs ascending (20 > 50 > 100 > 200): Strong uptrend
20 crosses above 50 while both are above 200: Pullback ending in uptrend
50 crosses above 200 while 20/50 below: Early trend reversal signal
Bearish Hierarchy (Strongest to Weakest):
All EMAs descending (20 < 50 < 100 < 200): Strong downtrend
20 crosses below 50 while both are below 200: Rally ending in downtrend
50 crosses below 200 while 20/50 above: Early trend reversal signal
Trading Strategy Examples:Pullback Entry Strategy:
Identify major trend using EMA 200 (price above = uptrend, below = downtrend)
Wait for pullback (20 crosses below 50 in uptrend, or above 50 in downtrend)
Enter when 20 re-crosses 50 in the trend direction
Place stop below/above the recent swing point
Exit when 20 crosses 50 against the trend again
Golden Cross/Death Cross Strategy:
Wait for 50×200 crossover (appears in the signal table)
Verify: Check if crossover occurs with increasing volume
Entry: Enter in the direction of the cross after a pullback
Stop: Place stop below/above the 200 EMA
Target: Swing high/low or when opposite crossover occurs
Multi-Crossover Confirmation:
Watch for multiple crossovers in the same direction within a short period
Example: 20×50 crossover followed by 20×100 = strengthening momentum
Enter after the second confirmation crossover
More crossovers = stronger signal but also means you're entering later
Time Filter Benefits:The 10:00-18:00 Istanbul time filter prevents recording crossovers during:
Pre-market volatility and gaps
Low-volume overnight sessions (for 24-hour markets)
After-hours erratic movements
Pesquisar nos scripts por "Exponential"

Market Breadth - [JTCAPITAL]Market Breadth - is a comprehensive crypto market strength and sentiment indicator designed to visualize the overall bullish or bearish alignment across 40 major cryptocurrencies. By combining multi-asset Exponential Moving Average (EMA) comparisons and smoothing techniques, it offers a clean, aggregated view of the broader market trend—helping traders quickly assess whether the market is dominated by bullish momentum or bearish pressure.
The indicator works by calculating in the following steps:
Symbol Selection and Data Retrieval
The script monitors 40 leading cryptocurrencies based on Market Cap. Each asset’s daily close price is requested using a 1D timeframe. This ensures that every data point reflects the same temporal resolution, allowing the indicator to evaluate global crypto strength rather than individual token volatility.
EMA Comparison per Asset
For each asset, two Exponential Moving Averages (EMAs) are calculated:
A short-term EMA with period emalength (default 10).
A long-term EMA with period emalength2 (default 20).
Each coin receives a score of +1 when the short-term EMA is greater than the long-term EMA (indicating bullish structure), or -1 when it is below (indicating bearish structure). This binary scoring system effectively converts individual price action into a directional sentiment measure.
Market Breadth Aggregation
All 40 individual scores are summed into a single composite value called scores .
If many assets have bullish EMA alignment, the total score becomes strongly positive.
If the majority show bearish alignment, the total score turns negative.
This step transforms scattered price data into one unified market breadth metric—quantifying how many assets participate in the same directional trend.
Smoothing the Breadth Line
To reduce short-term noise and isolate trend direction, the aggregated score is smoothed using an EMA of length = smoothlen (default 15). The resulting smoothed line helps identify sustained shifts in collective sentiment rather than temporary fluctuations.
Visualization and Color Coding
When scores > 0 , the market breadth is bullish and the histogram is colored blue.
When scores < 0 , the breadth turns bearish and the histogram is purple.
The same logic applies to the smoothed line and background color, offering an instant visual cue of market mood transitions.
Buy and Sell Conditions:
The indicator itself does not trigger direct buy/sell signals but rather acts as a market regime filter . Traders can use it as follows:
Buy Filter: When the smoothed value is above zero and rising, the majority of assets confirm an uptrend — this favors long setups or trend continuation entries.
Sell Filter: When the smoothed value is below zero and falling, bearish alignment dominates — ideal for short setups or defensive risk management.
Optional filters could include combining this with RSI or volume-weighted momentum indicators to confirm breadth-based reversals.
Features and Parameters:
emalength – Defines the short-term EMA length used for individual asset trend detection (default 10).
emalength2 – Defines the long-term EMA length (default 20).
smoothlen – Defines the smoothing EMA length for the total market breadth line (default 15).
40 asset inputs – User-editable symbols allow full customization of which cryptos are tracked.
Dynamic color backgrounds – Visual distinction between bullish and bearish phases.
Specifications:
Exponential Moving Average (EMA)
EMA is a type of moving average that places more weight on recent price data, responding faster to market changes compared to SMA. By comparing a short-term and long-term EMA, the indicator captures momentum shifts across each asset individually. The crossover logic (EMA10 > EMA20) signals bullish conditions, while the opposite indicates bearish momentum.
Market Breadth
Market Breadth quantifies how many assets are participating in a directional move. Instead of tracking a single coin’s trend, breadth analysis measures collective sentiment. When most coins’ short-term EMAs are above long-term EMAs, the market shows healthy bullish breadth. Conversely, when most are below, weakness dominates.
Smoothing (EMA on Scores)
After summing the breadth score, the result is smoothed with an additional EMA to mitigate the inherent volatility caused by individual coin reversals. This second-level smoothing transforms raw fluctuations into a readable, trend-consistent curve.
Color Visualization
Visual cues are integral for intuitive interpretation.
Blue Shades: Indicate bullish alignment and collective upward momentum.
Purple Shades: Indicate bearish conditions and potential risk-off phases.
The background tint reinforces visual clarity even when the indicator is overlaid on price charts.
Background Logic
By applying the same color logic to the chart’s background, users can instantly recognize the prevailing market phase.
Use Cases
As a trend confirmation filter for other indicators (e.g., trade only in the direction of positive breadth).
As a divergence tool : when price rises but breadth weakens, it may signal a topping market.
As a macro sentiment monitor : perfect for assessing when the crypto market as a whole transitions from bearish to bullish structure.
Summary
“ Market Breadth - ” transforms the chaotic price movements of 40 cryptocurrencies into a single, powerful visual representation of overall market health. By merging EMA cross analysis with market-wide aggregation and smoothing , it provides traders with a deep understanding of when bullish or bearish forces dominate the ecosystem.
It’s a clean, data-driven approach to identifying shifts in crypto market sentiment — a perfect companion for trend-following, macro analysis, and timing portfolio exposure.
Enjoy!

Easy [CHE] Easy — Minimalist Pine Script for detecting EMA direction changes to define fixed price zones for simple support and resistance visualization, ideal for manual trading workflows.
Summary
This indicator's programming is kept minimalist and super simple, with core logic in under 20 lines for easy comprehension and modification. It creates fixed price zones based on divergences between a base exponential moving average and its smoother counterpart, helping traders spot potential consolidation or reversal areas without dynamic adjustments. By locking the zone at the high and low of the signal bar, it avoids over-expansion in volatile conditions, offering a stable reference line colored by price position relative to the zone. This approach differs from expanding channels by prioritizing simplicity and persistence until a new qualifying signal, reducing visual clutter while highlighting directional bias through midpoint coloring.
Motivation: Why this design?
Traders often face noisy signals from moving averages that flip frequently in sideways markets or lag during breakouts, leading to premature entries or missed opportunities. This indicator addresses that by focusing on confirmed direction shifts between the base and smoothed averages, then anchoring a non-expanding zone to capture the initial price range of the shift. The result is a cleaner tool for marking equilibrium levels, assuming price respects these bounds in ranging or mildly trending conditions.
What’s different vs. standard approaches?
- Reference baseline: Traditional moving average crossovers or simple channels that update every bar.
- Architecture differences:
- Zones are set only on new divergence signals and remain fixed until reset by a gap from the prior zone.
- No ongoing high-low expansion; relies on persistent variables to hold bounds across bars.
- Midpoint plotting with conditional coloring based on close position, plus a highlight for zone initiations.
- Practical effect: Charts show persistent horizontal references instead of drifting lines, making it easier to gauge if price is rejecting or embracing the zone—useful for avoiding false breaks in low-volatility setups.
How it works (technical)
The indicator first computes a base exponential moving average of closing prices over a user-defined length, then applies a second exponential moving average to smooth that base. It checks if both the base and smoothed values are increasing or decreasing compared to their prior values, indicating aligned direction. A signal triggers when this alignment breaks, marking a potential shift.
On a new signal, if the current bar's high and low fall outside any existing zone (or none exists), the zone bounds update to those extremes and persist via dedicated variables. The midpoint of these bounds becomes the primary plot line, colored green if below the close (bullish lean), red if above (bearish lean), or gray otherwise. A secondary thick line highlights the midpoint briefly when a zone first sets, aiding visual confirmation. No higher timeframe data or external fetches are used, so updates occur on each bar close without lookahead.
Parameter Guide
EMA Length — Sets the period for the base moving average; longer values smooth more, reducing signal frequency but increasing lag. Default: 50. Trade-offs/Tips: Shorter for faster response in intraday charts (risks noise); longer for daily trends (may miss early shifts).
Smoother Length — Defines the period for the secondary smoothing on the base average; higher values dampen minor wiggles for stabler direction checks. Default: 3. Trade-offs/Tips: Keep low (2–5) for sensitivity; increase to 7+ if zones trigger too often in choppy markets, at cost of delayed signals.
Reading & Interpretation
The main circle plot at the zone midpoint serves as a dynamic equilibrium line: green suggests price is above the zone (potential strength), red indicates below (potential weakness), and gray shows containment within bounds (neutral consolidation). A sudden thick foreground line at the midpoint flags a fresh zone start, prompting review of the prior bar's context. Absence of a plot means no active zone, implying reliance on price action alone until the next signal.
Practical Workflows & Combinations
- Trend following: Enter long on green midpoint after a higher low touches the zone lower bound, confirmed by structure like higher highs; filter shorts similarly on red with lower highs.
- Exits/Stops: Use the opposite zone bound as a conservative stop (e.g., below lower for longs); trail aggressively to midpoint on strong moves, tightening near gray neutrality.
- Multi-asset/Multi-TF: Defaults work across forex and stocks on 1H–Daily; for crypto volatility, shorten EMA Length to 20–30. Pair with volume oscillators for confirmation, avoiding isolated use.
Behavior, Constraints & Performance
- Repaint/confirmation: Plots update on bar close using historical closes, so confirmed signals hold; live bars may shift until close but without future references.
- security()/HTF: Not used, eliminating related repaint risks.
- Resources: Minimal overhead—no loops, arrays, or bar limits exceeded; suitable for real-time on any timeframe.
- Known limits: Fixed zones may lag in strong trends (price drifts away without reset); signals skip if no gap from prior zone, potentially missing clustered shifts. Assumes standard OHLC data; untested on non-equity assets.
Sensible Defaults & Quick Tuning
Start with EMA Length at 50 and Smoother Length at 3 for balanced daily charts. If signals fire too frequently (e.g., in ranges), extend EMA Length to 100 for fewer but stabler zones. For sluggish response in trends, drop Smoother Length to 2 and EMA Length to 30, monitoring for added noise. In high-vol setups, widen both to 75/5 to filter extremes, trading speed for reliability.
What this indicator is—and isn’t
This is a lightweight visualization layer for EMA-driven zones, aiding manual chart reading and basic signal spotting. It is not a standalone system, predictive model, or automated alert generator—integrate with broader analysis like market structure and risk rules. (Unknown/Optional: No built-in alerts or multi-timeframe scaling.)
Disclaimer
The content provided, including all code and materials, is strictly for educational and informational purposes only. It is not intended as, and should not be interpreted as, financial advice, a recommendation to buy or sell any financial instrument, or an offer of any financial product or service. All strategies, tools, and examples discussed are provided for illustrative purposes to demonstrate coding techniques and the functionality of Pine Script within a trading context.
Any results from strategies or tools provided are hypothetical, and past performance is not indicative of future results. Trading and investing involve high risk, including the potential loss of principal, and may not be suitable for all individuals. Before making any trading decisions, please consult with a qualified financial professional to understand the risks involved.
By using this script, you acknowledge and agree that any trading decisions are made solely at your discretion and risk.
Do not use this indicator on Heikin-Ashi, Renko, Kagi, Point-and-Figure, or Range charts, as these chart types can produce unrealistic results for signal markers and alerts.
Best regards and happy trading
Chervolino

Robust Scaled Dema | OquantOverview
The Robust Scaled DEMA indicator is a tool designed for traders seeking to identify potential trend directions in financial markets. It combines the smoothing capabilities of a Double Exponential Moving Average (DEMA) with a robust scaling mechanism to normalize the data, making it more resilient to outliers and extreme price movements. This scaling helps in generating long and short signals based on predefined thresholds, visualized through color-coded plots and bars. The indicator aims to provide a balanced view of market momentum, reducing the impact of noise while highlighting significant shifts in price behavior.
Key Factors/Components
DEMA (Double Exponential Moving Average): Serves as the core smoothing component, reducing lag compared to simple averages by emphasizing recent price action more effectively.
Robust Scaling Mechanism: Utilizes statistical measures like median and interquartile range to normalize the DEMA values, ensuring the indicator is less sensitive to extreme values or price spikes.
Thresholds: User-defined upper and lower levels that trigger long or short signals when the scaled DEMA crosses them.
Visual Elements: Includes plotted lines for the scaled DEMA and thresholds, plus color-coded candlestick bars for intuitive interpretation.
Alerts: Built-in conditions for notifying users of potential entry points for long or short positions.
How It Works
The indicator starts by applying a DEMA to the chosen price source to create a smoothed representation of the market's direction. This smoothed value is then scaled using a robust statistical approach that accounts for the distribution of recent DEMA values, centering it around a median and adjusting for variability to minimize the influence of outliers. The resulting scaled metric is compared against user-set upper and lower thresholds: crossing above the upper suggests a bullish momentum (long signal), while dipping below the lower indicates bearish conditions (short signal). A state variable tracks these conditions to color the chart accordingly, helping traders visualize regime changes. Optional alerts fire on transitions.
For Who Is Best/Recommended Use Cases
This indicator is ideal for traders who employ trend-following or momentum-based strategies and need tools that perform well in non-normal market conditions, such as during high volatility or in assets prone to spikes. Use cases include identifying entry/exit points in trending environments, confirming breakouts, or integrating into multi-indicator systems for added confirmation. Quantitative traders or those backtesting strategies will appreciate its customizable parameters for optimization.
Settings and Default Settings
Source: The price data input for calculations, such as close, open, high, or low. Default: close.
DEMA Length: Controls the period for the DEMA smoothing; shorter values increase responsiveness but may add noise, longer ones provide more lag but smoother signals. Default: 25.
Robust Scaling Length: Defines the lookback period for the scaling statistics; affects how adaptive the normalization is to recent data distributions. Default: 40.
Upper Threshold: The level above which a long signal is triggered; higher values make signals rarer but potentially more reliable. Default: 0.5.
Lower Threshold: The level below which a short signal is triggered; lower values allow for more aggressive bearish detection. Default: 0.
Conclusion
The Robust Scaled DEMA offers an outlier-resistant alternative to traditional moving average indicators, empowering traders to navigate volatile markets. By blending exponential smoothing with statistical robustness, it provides actionable insights into trend shifts while minimizing false positives from extreme events..
⚠️ Disclaimer: This indicator is intended for educational and informational purposes only. Trading/investing involves risk, and past performance does not guarantee future results. Always test and evaluate indicators/strategies before applying them in live markets. Use at your own risk.

DEMA Flow [Alpha Extract]A sophisticated trend identification system that combines Double Exponential Moving Average methodology with advanced HL median filtering and ATR-based band detection for precise trend confirmation. Utilizing dual-layer smoothing architecture and volatility-adjusted breakout zones, this indicator delivers institutional-grade flow analysis with minimal lag while maintaining exceptional noise reduction. The system's intelligent band structure with asymmetric ATR multipliers provides clear trend state classification through price position analysis relative to dynamic threshold levels.
🔶 Advanced DEMA Calculation Engine
Implements double exponential moving average methodology using cascaded EMA calculations to significantly reduce lag compared to traditional moving averages. The system applies dual smoothing through sequential EMA processing, creating a responsive yet stable trend baseline that maintains sensitivity to genuine market structure changes while filtering short-term noise.
// Core DEMA Framework
dema(src, length) =>
EMA1 = ta.ema(src, length)
EMA2 = ta.ema(EMA1, length)
DEMA_Value = 2 * EMA1 - EMA2
DEMA_Value
// Primary Calculation
DEMA = dema(close, DEMA_Length)
2H
🔶 HL Median Filter Smoothing Architecture
Features sophisticated high-low median filtering using rolling window analysis to create ultra-smooth trend baselines with outlier resistance. The system constructs dynamic arrays of recent DEMA values, sorts them for median extraction, and handles both odd and even window lengths for optimal smoothing consistency across all market conditions.
// HL Median Filter Logic
hlMedian(src, length) =>
window = array.new_float()
for i = 0 to length - 1
array.push(window, src)
array.sort(window)
// Median Extraction
lenW = array.size(window)
median = lenW % 2 == 1 ?
array.get(window, lenW / 2) :
(array.get(window, lenW/2 - 1) + array.get(window, lenW/2)) / 2
// Smooth DEMA Calculation
Smooth_DEMA = hlMedian(DEMA_Value, HL_Filter_Length)
🔶 ATR Band Construction Framework
Implements volatility-adaptive band structure using Average True Range calculations with asymmetric multiplier configuration for optimal trend identification. The system creates upper and lower threshold bands around the smoothed DEMA baseline with configurable ATR multipliers, enabling precise trend state determination through price breakout analysis.
// ATR Band Calculation
atrBands(src, atr_length, upper_mult, lower_mult) =>
ATR = ta.atr(atr_length)
Upper_Band = src + upper_mult * ATR
Lower_Band = src - lower_mult * ATR
// Band Generation
= atrBands(Smooth_DEMA, ATR_Length, Upper_ATR_Mult, Lower_ATR_Mult)
15min
🔶 Intelligent Flow Signal Engine
Generates binary trend states through band breakout detection, transitioning to bullish flow when price exceeds upper band and bearish flow when price breaches lower band. The system maintains flow state persistence until opposing band breakout occurs, providing clear trend classification without whipsaw signals during normal volatility fluctuations.
🔶 Comprehensive Visual Architecture
Provides multi-dimensional flow visualization through color-coded DEMA line, trend-synchronized candle coloring, and bar color overlay for complete chart integration. The system uses institutional color scheme with neon green for bullish flow, neon red for bearish flow, and neutral gray for undefined states with configurable band visibility.
🔶 Asymmetric Band Configuration
Features intelligent asymmetric ATR multiplier system with default upper multiplier of 2.1 and lower multiplier of 1.5, optimizing for market dynamics where upside breakouts often require stronger momentum confirmation than downside breaks. This configuration reduces false signals while maintaining sensitivity to genuine flow changes.
🔶 Dual-Layer Smoothing Methodology
Combines DEMA's inherent lag reduction with HL median filtering to create exceptional smoothing without sacrificing responsiveness. The system first applies double exponential smoothing for initial noise reduction, then applies median filtering to eliminate outliers and create ultra-clean flow baseline suitable for high-frequency and institutional trading applications.
🔶 Alert Integration System
Features comprehensive alert framework for flow state transitions with customizable notifications for bullish and bearish flow confirmations. The system provides real-time alerts on crossover events with clear directional indicators and exchange/ticker integration for multi-symbol monitoring capabilities.
🔶 Performance Optimization Framework
Utilizes efficient array management with optimized median calculation algorithms and minimal variable overhead for smooth operation across all timeframes. The system includes intelligent bar indexing for median filter initialization and streamlined flow state tracking for consistent performance during extended analysis periods.
🔶 Why Choose DEMA Flow ?
This indicator delivers sophisticated flow identification through dual-layer smoothing architecture and volatility-adaptive band methodology. By combining DEMA's reduced-lag characteristics with HL median filtering and ATR-based breakout zones, it provides institutional-grade flow analysis with exceptional noise reduction and minimal false signals. The system's asymmetric band structure and comprehensive visual integration make it essential for traders seeking systematic trend-following approaches across cryptocurrency, forex, and equity markets with clear entry/exit signals and comprehensive alert capabilities for automated trading strategies.

X21The X21 Dynamic Trend Indicator is an adaptive moving average system that combines SMA, EMA, and TEMA to provide real-time trend identification with dynamic color coding. This indicator automatically adjusts its visual presentation based on market conditions, making trend recognition intuitive and immediate.
Key Components
1. TEMA21 (Triple Exponential Moving Average)
Yellow Line - The most responsive trend indicator in the system
Significantly reduces lag compared to traditional moving averages
Formula: TEMA = 3×EMA1 - 3×EMA2 + EMA3
Provides early signals for potential trend changes
Ideal for timing entries and exits with minimal delay
2. SMA21 (Simple Moving Average)
Green Line - Always displayed in green regardless of trend direction
21-period simple moving average of closing prices
Represents the baseline trend reference
Acts as the primary support/resistance level in the system
3. EMA21 (Exponential Moving Average)
Dynamic Color Line - Changes color based on trend strength
Dark Green (#159015): Confirmed uptrend (bullish conditions)
Red (#f50000): Downtrend or weak trend (bearish/neutral conditions)
More responsive than SMA21 due to exponential weighting
Provides faster reaction to recent price movements
4. Dynamic Fill Band (SMA21/EMA21 Envelope)
Color-Coded Zone between SMA21 and EMA21
Light Green (#15e915, 19% transparency): Uptrend zone
Light Red (#f50000, 19% transparency): Downtrend zone
Visualizes the strength and volatility of the current trend
Width of the band indicates trend momentum and volatility
Trend Detection LogicThe indicator uses a dual-confirmation system for trend identification:
Price Position: Close must be above SMA21
Trend Slope: SMA21 must be rising (SMA21 > SMA21 )
Both conditions must be met simultaneously for an uptrend confirmation.This conservative approach reduces false signals and ensures only h
Power RSI Segment Runner [CHE] Power RSI Segment Runner — Tracks RSI momentum across higher timeframe segments to detect directional switches for trend confirmation.
Summary
This indicator calculates a running Relative Strength Index adapted to segments defined by changes in a higher timeframe, such as daily closes, providing a smoothed view of momentum within each period. It distinguishes between completed segments, which fix the final RSI value, and ongoing ones, which update in real time with an exponential moving average filter. Directional switches between bullish and bearish momentum trigger visual alerts, including overlay lines and emojis, while a compact table displays current trend strength as a progress bar. This segmented approach reduces noise from intra-period fluctuations, offering clearer signals for trend persistence compared to standard RSI on lower timeframes.
Motivation: Why this design?
Standard RSI often generates erratic signals in choppy markets due to constant recalculation over fixed lookback periods, leading to false reversals that mislead traders during range-bound or volatile phases. By resetting the RSI accumulation at higher timeframe boundaries, this indicator aligns momentum assessment with broader market cycles, capturing sustained directional bias more reliably. It addresses the gap between short-term noise and long-term trends, helping users filter entries without over-relying on absolute overbought or oversold thresholds.
What’s different vs. standard approaches?
- Baseline Reference: Diverges from the classic Wilder RSI, which uses a fixed-length exponential moving average of gains and losses across all bars.
- Architecture Differences:
- Segments momentum resets at higher timeframe changes, isolating calculations per period instead of continuous history.
- Employs persistent sums for ups and downs within segments, with on-the-fly RSI derivation and EMA smoothing.
- Integrates switch detection logic that clears prior visuals on reversal, preventing clutter from outdated alerts.
- Adds overlay projections like horizontal price lines and dynamic percent change trackers for immediate trade context.
- Practical Effect: Charts show discrete RSI endpoints for past segments alongside a curved running trace, making momentum evolution visually intuitive. Switches appear as clean, extendable overlays, reducing alert fatigue and highlighting only confirmed directional shifts, which aids in avoiding whipsaws during minor pullbacks.
How it works (technical)
The indicator begins by detecting changes in the specified higher timeframe, such as a new daily bar, to define segment boundaries. At each boundary, it finalizes the prior segment's RSI by summing positive and negative price changes over that period and derives the value from the ratio of those sums, then applies an exponential moving average for smoothing. Within the active segment, it accumulates ongoing ups and downs from price changes relative to the source, recalculating the running RSI similarly and smoothing it with the same EMA length.
Points for the running RSI are collected into an array starting from the segment's onset, forming a curved polyline once sufficient bars accumulate. Comparisons between the running RSI and the last completed segment's value determine the current direction as long, short, or neutral, with switches triggering deletions of old visuals and creation of new ones: a label at the RSI pane, a vertical dashed line across the RSI range, an emoji positioned via ATR offset on the price chart, a solid horizontal line at the switch price, a dashed line tracking current close, and a midpoint label for percent change from the switch.
Initialization occurs on the first bar by resetting accumulators, and visualization gates behind a minimum bar count since the segment start to avoid early instability. The trend strength table builds vertically with filled cells proportional to the rounded RSI value, colored by direction. All drawing objects update or extend on subsequent bars to reflect live progress.
Parameter Guide
EMA Length — Controls the smoothing applied to the running RSI; higher values increase lag but reduce noise. Default: 10. Trade-offs: Shorter settings heighten sensitivity for fast markets but risk more false switches; longer ones suit trending conditions for stability.
Source — Selects the price data for change calculations, typically close for standard momentum. Default: close. Trade-offs: Open or high/low may emphasize gaps, altering segment intensity.
Segment Timeframe — Defines the higher timeframe for segment resets, like daily for intraday charts. Default: D. Trade-offs: Shorter frames create more frequent but shorter segments; longer ones align with major cycles but delay resets.
Overbought Level — Sets the upper threshold for potential overbought conditions (currently unused in visuals). Default: 70. Trade-offs: Adjust for asset volatility; higher values delay bearish warnings.
Oversold Level — Sets the lower threshold for potential oversold conditions (currently unused in visuals). Default: 30. Trade-offs: Lower values permit deeper dips before signaling bullish potential.
Show Completed Label — Toggles labels at segment ends displaying final RSI. Default: true. Trade-offs: Enables historical review but can crowd charts on dense timeframes.
Plot Running Segment — Enables the curved polyline for live RSI trace. Default: true. Trade-offs: Visualizes intra-segment flow; disable for cleaner panes.
Running RSI as Label — Displays current running RSI as a forward-projected label on the last bar. Default: false. Trade-offs: Useful for quick reads; may overlap in tight scales.
Show Switch Label — Activates RSI pane labels on directional switches. Default: true. Trade-offs: Provides context; omit to minimize pane clutter.
Show Switch Line (RSI) — Draws vertical dashed lines across the RSI range at switches. Default: true. Trade-offs: Marks reversal bars clearly; extends both ways for reference.
Show Solid Overlay Line — Projects a horizontal line from switch price forward. Default: true. Trade-offs: Acts as dynamic support/resistance; wider lines enhance visibility.
Show Dashed Overlay Line — Tracks a dashed line from switch to current close. Default: true. Trade-offs: Shows price deviation; thinner for subtlety.
Show Percent Change Label — Midpoint label tracking percent move from switch. Default: true. Trade-offs: Quantifies progress; centers dynamically.
Show Trend Strength Table — Displays right-side table with direction header and RSI bar. Default: true. Trade-offs: Instant strength gauge; fixed position avoids overlap.
Activate Visualization After N Bars — Delays signals until this many bars into a segment. Default: 3. Trade-offs: Filters immature readings; higher values miss early momentum.
Segment End Label — Color for completed RSI labels. Default: 7E57C2. Trade-offs: Purple tones for finality.
Running RSI — Color for polyline and running elements. Default: yellow. Trade-offs: Bright for live tracking.
Long — Color for bullish switch visuals. Default: green. Trade-offs: Standard for uptrends.
Short — Color for bearish switch visuals. Default: red. Trade-offs: Standard for downtrends.
Solid Line Width — Thickness of horizontal overlay line. Default: 2. Trade-offs: Bolder for emphasis on key levels.
Dashed Line Width — Thickness of tracking and vertical lines. Default: 1. Trade-offs: Finer to avoid dominance.
Reading & Interpretation
Completed segment RSIs appear as static points or labels in purple, indicating the fixed momentum at period close—values drifting toward the upper half suggest building strength, while lower half implies weakness. The yellow curved polyline traces the live smoothed RSI within the current segment, rising for accumulating gains and falling for losses. Directional labels and lines in green or red flag switches: green for running momentum exceeding the prior segment's, signaling potential uptrend continuation; red for the opposite.
The right table's header colors green for long, red for short, or gray for neutral/wait, with filled purple bars scaling from bottom (low RSI) to top (high), topped by the numeric value. Overlay elements project from switch bars: the solid green/red line as a price anchor, dashed tracker showing pullback extent, and percent label quantifying deviation—positive for alignment with direction, negative for counter-moves. Emojis (up arrow for long, down for short) float above/below price via ATR spacing for quick chart scans.
Practical Workflows & Combinations
- Trend Following: Enter long on green switch confirmation after a higher high in structure; filter with table strength above midpoint for conviction. Pair with volume surge for added weight.
- Exits/Stops: Trail stops to the solid overlay line on pullbacks; exit if percent change reverses beyond 2 percent against direction. Use wait bars to confirm without chasing.
- Multi-Asset/Multi-TF: Defaults suit forex/stocks on 1H-4H with daily segments; for crypto, shorten EMA to 5 for volatility. Scale segment TF to weekly for daily charts across indices.
- Combinations: Overlay on EMA clouds for confluence—switch aligning with cloud break strengthens signal. Add volatility filters like ATR bands to debounce in low-volume regimes.
Behavior, Constraints & Performance
Signals confirm on bar close within segments, with running polyline updating live but gated by minimum bars to prevent flicker. Higher timeframe changes may introduce minor repaints on timeframe switches, mitigated by relying on confirmed HTF closes rather than intrabar peeks. Resource limits cap at 500 labels/lines and 50 polylines, pruning old objects on switches to stay efficient; no explicit loops, but array growth ties to segment length—suitable for up to 500-bar histories without lag.
Known limits include delayed visualization in short segments and insensitivity to overbought/oversold levels, as thresholds are inputted but not actively visualized. Gaps in source data reset accumulators prematurely, potentially skewing early RSI.
Sensible Defaults & Quick Tuning
Start with EMA length 10, daily segments, and 3-bar wait for balanced responsiveness on hourly charts. For excessive switches in ranging markets, increase wait bars to 5 or EMA to 14 to dampen noise. If signals lag in trends, drop EMA to 5 and use 1H segments. For stable assets like indices, widen to weekly segments; tune colors for dark/light themes without altering logic.
What this indicator is—and isn’t
This tool serves as a momentum visualization and switch detector layered over price action, aiding trend identification and confirmation in segmented contexts. It is not a standalone trading system, predictive model, or risk calculator—always integrate with broader analysis, position sizing, and stop-loss discipline. View it as an enhancement for discretionary setups, not automated alerts without validation.
Disclaimer
The content provided, including all code and materials, is strictly for educational and informational purposes only. It is not intended as, and should not be interpreted as, financial advice, a recommendation to buy or sell any financial instrument, or an offer of any financial product or service. All strategies, tools, and examples discussed are provided for illustrative purposes to demonstrate coding techniques and the functionality of Pine Script within a trading context.
Any results from strategies or tools provided are hypothetical, and past performance is not indicative of future results. Trading and investing involve high risk, including the potential loss of principal, and may not be suitable for all individuals. Before making any trading decisions, please consult with a qualified financial professional to understand the risks involved.
By using this script, you acknowledge and agree that any trading decisions are made solely at your discretion and risk.
Do not use this indicator on Heikin-Ashi, Renko, Kagi, Point-and-Figure, or Range charts, as these chart types can produce unrealistic results for signal markers and alerts.
Best regards and happy trading
Chervolino

Holt Damped Forecast [CHE]A Friendly Note on These Pine Script Scripts
Hey there! Just wanted to share a quick, heartfelt heads-up: All these Pine Script examples come straight from my own self-study adventures as a total autodidact—think late nights tinkering and learning on my own. They're purely for educational vibes, helping me (and hopefully you!) get the hang of Pine Script basics, cool indicators, and building simple strategies.
That said, please know this isn't any kind of financial advice, investment nudge, or pro-level trading blueprint. I'd love for you to dive in with your own research, run those backtests like a champ, and maybe bounce ideas off a qualified expert before trying anything in a real trading setup. No guarantees here on performance or spot-on accuracy—trading's got its risks, and those are totally on each of us.
Let's keep it fun and educational—happy coding! 😊
Holt Damped Forecast — Damped trend forecasts with fan bands for uncertainty visualization and momentum integration
Summary
This indicator applies damped exponential smoothing to generate forward price forecasts, displaying them as probabilistic fan bands to highlight potential ranges rather than point estimates. It incorporates residual-based uncertainty to make projections more reliable in varying market conditions, reducing overconfidence in strong trends. Momentum from the trend component is shown in an optional label alongside signals, aiding quick assessment of direction and strength without relying on lagging oscillators.
Motivation: Why this design?
Standard exponential smoothing often extrapolates trends indefinitely, leading to unrealistic forecasts during mean reversion or weakening momentum. This design uses damping to gradually flatten long-term projections, better suiting real markets where trends fade. It addresses the need for visual uncertainty in forecasts, helping traders avoid entries based on overly optimistic point predictions.
What’s different vs. standard approaches?
- Reference baseline: Diverges from basic Holt's linear exponential smoothing, which assumes persistent trends without decay.
- Architecture differences:
- Adds damping to the trend extrapolation for finite-horizon realism.
- Builds fan bands from historical residuals for probabilistic ranges at multiple confidence levels.
- Integrates a dynamic label combining forecast details, scaled momentum, and directional signals.
- Applies tail background coloring to recent bars based on forecast direction for immediate visual cues.
- Practical effect: Charts show converging forecast bands over time, emphasizing shorter horizons where accuracy is higher. This visibly tempers aggressive projections in trends, making it easier to spot when uncertainty widens, which signals potential reversals or consolidation.
How it works (technical)
The indicator maintains two persistent components: a level tracking the current price baseline and a trend capturing directional slope. On each bar, the level updates by blending the current source price with a one-step-ahead expectation from the prior level and damped trend. The trend then adjusts by weighting the change in level against the prior damped trend. Forecasts extend this forward over a user-defined number of steps, with damping ensuring the trend influence diminishes over distance.
Uncertainty derives from the standard deviation of historical residuals—the differences between actual prices and one-step expectations—scaled by the damping structure for the forecast horizon. Bands form around the median forecast at specified confidence intervals using these scaled errors. Initialization seeds the level to the first bar's price and trend to zero, with persistence handling subsequent updates. A security call fetches the last bar index for tail logic, using lookahead to align with realtime but introducing minor repaint on unconfirmed bars.
Parameter Guide
The Source parameter selects the price input for level and residual calculations, defaulting to close; consider using high or low for assets sensitive to volatility, as close works well for most trend-following setups. Forecast Steps (h) defines the number of bars ahead for projections, defaulting to 4—shorter values like 1 to 5 suit intraday trading, while longer ones may widen bands excessively in choppy conditions. The Color Scheme (2025 Trends) option sets the base, up, and down colors for bands, labels, and backgrounds, starting with Ruby Dawn; opt for serene schemes on clean charts or vibrant ones to stand out in dark themes.
Level Smoothing α controls the responsiveness of the price baseline, defaulting to 0.3—values above 0.5 enhance tracking in fast markets but may amplify noise, whereas lower settings filter disturbances better. Trend Smoothing β adjusts sensitivity to slope changes, at 0.1 by default; increasing to 0.2 helps detect emerging shifts quicker, but keeping it low prevents whipsaws in sideways action. Damping φ (0..1) governs trend persistence, defaulting to 0.8—near 0.9 preserves carryover in sustained moves, while closer to 0.5 curbs overextensions more aggressively.
Show Fan Bands (50/75/95) toggles the probabilistic range display, enabled by default; disable it in oscillator panes to reduce clutter, but it's key for overlay forecasts. Residual Window (Bars) sets the length for deviation estimates, at 400 bars initially—100 to 200 works for short timeframes, and 500 or more adds stability over extended histories. Line Width determines the thickness of band and median lines, defaulting to 2; go thicker at 3 to 5 for emphasis on higher timeframes or thinner for layered indicators.
Show Median/Forecast Line reveals the central projection, on by default—hide if bands provide enough detail, or keep for pinpoint entry references. Show Integrated Label activates the combined view of forecast, momentum, and signal, defaulting to true; it's right-aligned for convenience, so turn it off on smaller screens to save space. Show Tail Background colors the last few bars by forecast direction, enabled initially; pair low transparency for subtle hints or higher for bolder emphasis.
Tail Length (Bars) specifies bars to color backward from the current one, at 3 by default—1 to 2 fits scalping, while 5 or more underscores building momentum. Tail Transparency (%) fades the background intensity, starting at 80; 50 to 70 delivers strong signals, and 90 or above allows seamless blending. Include Momentum in Label adds the scaled trend value, defaulting to true—ATR% scaling here offers relative strength context across assets.
Include Long/Short/Neutral Signal in Label displays direction from the trend sign, on by default; neutral helps in ranging markets, though it can be overlooked during strong trends. Scaling normalizes momentum output (raw, ATR-relative, or level-relative), set to ATR% initially—ATR% ensures cross-asset comparability, while %Level provides percentage perspectives. ATR Length defines the period for true range averaging in scaling, at 14; align it with your chart timeframe or shorten for quicker volatility responses.
Decimals sets precision in the momentum label, defaulting to 2—0 to 1 yields clean integers, and 3 or more suits detailed forex views. Show Zero-Cross Markers places arrows at direction changes, enabled by default; keep size small to minimize clutter, with text labels for fast scanning.
Reading & Interpretation
Fan bands expand outward from the current bar, with the median line as the central forecast—narrower bands indicate lower uncertainty, wider suggest caution. Colors tint up (positive forecast vs. prior level) in the scheme's up hue and down otherwise. The optional label lists the horizon, median, and range brackets at 50%, 75%, and 95% levels, followed by momentum (scaled per mode) and signal (Long if positive trend, Short if negative, Neutral if zero). Zero-cross arrows mark trend flips: upward triangle below bar for bullish cross, downward above for bearish. Tail background reinforces the forecast direction on recent bars.
Practical Workflows & Combinations
- Trend following: Enter long on upward zero-cross if median forecast rises above price and bands contain it; confirm with higher highs/lows. Short on downward cross with falling median.
- Exits/Stops: Trail stops below 50% lower band in longs; exit if momentum drifts negative or signal turns neutral. Use wider bands (75/95%) for conservative holds in volatile regimes.
- Multi-asset/Multi-TF: Defaults work across stocks, forex, crypto on 5m-1D; scale steps by TF (e.g., 10+ on daily). Layer with volume or structure tools—avoid over-reliance on isolated crosses.
Behavior, Constraints & Performance
Closed-bar logic ensures stable historical plots, but realtime updates via security lookahead may shift forecasts until bar confirmation, introducing minor repaint on the last bar. No explicit HTF calls beyond bar index fetch, minimizing gaps but watch for low-liquidity assets. Resources include a 2000-bar lookback for residuals and up to 500 labels, with no loops—efficient for most charts. Known limits: Early bars show wide bands due to sparse residuals; assumes stationary errors, so gaps or regime shifts widen inaccuracies.
Sensible Defaults & Quick Tuning
Start with defaults for balanced smoothing on 15m-4H charts. For choppy conditions (too many crosses), lower β to 0.05 and raise residual window to 600 for stability. In trending markets (sluggish signals), increase α/β to 0.4/0.2 and shorten steps to 2. If bands overexpand, boost φ toward 0.95 to preserve trend carry. Tune colors for theme fit without altering logic.
What this indicator is—and isn’t
This is a visualization and signal layer for damped forecasts and momentum, complementing price action analysis. It isn’t a standalone system—pair with risk rules and broader context. Not predictive beyond the horizon; use for confirmation, not blind entries.
Disclaimer
The content provided, including all code and materials, is strictly for educational and informational purposes only. It is not intended as, and should not be interpreted as, financial advice, a recommendation to buy or sell any financial instrument, or an offer of any financial product or service. All strategies, tools, and examples discussed are provided for illustrative purposes to demonstrate coding techniques and the functionality of Pine Script within a trading context.
Any results from strategies or tools provided are hypothetical, and past performance is not indicative of future results. Trading and investing involve high risk, including the potential loss of principal, and may not be suitable for all individuals. Before making any trading decisions, please consult with a qualified financial professional to understand the risks involved.
By using this script, you acknowledge and agree that any trading decisions are made solely at your discretion and risk.
Do not use this indicator on Heikin-Ashi, Renko, Kagi, Point-and-Figure, or Range charts, as these chart types can produce unrealistic results for signal markers and alerts.
Best regards and happy trading
Chervolino

Ehlers Autocorrelation Periodogram (EACP)# EACP: Ehlers Autocorrelation Periodogram
## Overview and Purpose
Developed by John F. Ehlers (Technical Analysis of Stocks & Commodities, Sep 2016), the Ehlers Autocorrelation Periodogram (EACP) estimates the dominant market cycle by projecting normalized autocorrelation coefficients onto Fourier basis functions. The indicator blends a roofing filter (high-pass + Super Smoother) with a compact periodogram, yielding low-latency dominant cycle detection suitable for adaptive trading systems. Compared with Hilbert-based methods, the autocorrelation approach resists aliasing and maintains stability in noisy price data.
EACP answers a central question in cycle analysis: “What period currently dominates the market?” It prioritizes spectral power concentration, enabling downstream tools (adaptive moving averages, oscillators) to adjust responsively without the lag present in sliding-window techniques.
## Core Concepts
* **Roofing Filter:** High-pass plus Super Smoother combination removes low-frequency drift while limiting aliasing.
* **Pearson Autocorrelation:** Computes normalized lag correlation to remove amplitude bias.
* **Fourier Projection:** Sums cosine and sine terms of autocorrelation to approximate spectral energy.
* **Gain Normalization:** Automatic gain control prevents stale peaks from dominating power estimates.
* **Warmup Compensation:** Exponential correction guarantees valid output from the very first bar.
## Implementation Notes
**This is not a strict implementation of the TASC September 2016 specification.** It is a more advanced evolution combining the core 2016 concept with techniques Ehlers introduced later. The fundamental Wiener-Khinchin theorem (power spectral density = Fourier transform of autocorrelation) is correctly implemented, but key implementation details differ:
### Differences from Original 2016 TASC Article
1. **Dominant Cycle Calculation:**
- **2016 TASC:** Uses peak-finding to identify the period with maximum power
- **This Implementation:** Uses Center of Gravity (COG) weighted average over bins where power ≥ 0.5
- **Rationale:** COG provides smoother transitions and reduces susceptibility to noise spikes
2. **Roofing Filter:**
- **2016 TASC:** Simple first-order high-pass filter
- **This Implementation:** Canonical 2-pole high-pass with √2 factor followed by Super Smoother bandpass
- **Formula:** `hp := (1-α/2)²·(p-2p +p ) + 2(1-α)·hp - (1-α)²·hp `
- **Rationale:** Evolved filtering provides better attenuation and phase characteristics
3. **Normalized Power Reporting:**
- **2016 TASC:** Reports peak power across all periods
- **This Implementation:** Reports power specifically at the dominant period
- **Rationale:** Provides more meaningful correlation between dominant cycle strength and normalized power
4. **Automatic Gain Control (AGC):**
- Uses decay factor `K = 10^(-0.15/diff)` where `diff = maxPeriod - minPeriod`
- Ensures K < 1 for proper exponential decay of historical peaks
- Prevents stale peaks from dominating current power estimates
### Performance Characteristics
- **Complexity:** O(N²) where N = (maxPeriod - minPeriod)
- **Implementation:** Uses `var` arrays with native PineScript historical operator ` `
- **Warmup:** Exponential compensation (§2 pattern) ensures valid output from bar 1
### Related Implementations
This refined approach aligns with:
- TradingView TASC 2025.02 implementation by blackcat1402
- Modern Ehlers cycle analysis techniques post-2016
- Evolved filtering methods from *Cycle Analytics for Traders*
The code is mathematically sound and production-ready, representing a refined version of the autocorrelation periodogram concept rather than a literal translation of the 2016 article.
## Common Settings and Parameters
| Parameter | Default | Function | When to Adjust |
|-----------|---------|----------|---------------|
| Min Period | 8 | Lower bound of candidate cycles | Increase to ignore microstructure noise; decrease for scalping. |
| Max Period | 48 | Upper bound of candidate cycles | Increase for swing analysis; decrease for intraday focus. |
| Autocorrelation Length | 3 | Averaging window for Pearson correlation | Set to 0 to match lag, or enlarge for smoother spectra. |
| Enhance Resolution | true | Cubic emphasis to highlight peaks | Disable when a flatter spectrum is desired for diagnostics. |
**Pro Tip:** Keep `(maxPeriod - minPeriod)` ≤ 64 to control $O(n^2)$ inner loops and maintain responsiveness on lower timeframes.
## Calculation and Mathematical Foundation
**Explanation:**
1. Apply roofing filter to `source` using coefficients $\alpha_1$, $a_1$, $b_1$, $c_1$, $c_2$, $c_3$.
2. For each lag $L$ compute Pearson correlation $r_L$ over window $M$ (default $L$).
3. For each period $p$, project onto Fourier basis:
$C_p=\sum_{n=2}^{N} r_n \cos\left(\frac{2\pi n}{p}\right)$ and $S_p=\sum_{n=2}^{N} r_n \sin\left(\frac{2\pi n}{p}\right)$.
4. Power $P_p=C_p^2+S_p^2$, smoothed then normalized via adaptive peak tracking.
5. Dominant cycle $D=\frac{\sum p\,\tilde P_p}{\sum \tilde P_p}$ over bins where $\tilde P_p≥0.5$, warmup-compensated.
**Technical formula:**
```
Step 1: hp_t = ((1-α₁)/2)(src_t - src_{t-1}) + α₁ hp_{t-1}
Step 2: filt_t = c₁(hp_t + hp_{t-1})/2 + c₂ filt_{t-1} + c₃ filt_{t-2}
Step 3: r_L = (M Σxy - Σx Σy) / √
Step 4: P_p = (Σ_{n=2}^{N} r_n cos(2πn/p))² + (Σ_{n=2}^{N} r_n sin(2πn/p))²
Step 5: D = Σ_{p∈Ω} p · ĤP_p / Σ_{p∈Ω} ĤP_p with warmup compensation
```
> 🔍 **Technical Note:** Warmup uses $c = 1 / (1 - (1 - \alpha)^{k})$ to scale early-cycle estimates, preventing low values during initial bars.
## Interpretation Details
- **Primary Dominant Cycle:**
- High $D$ (e.g., > 30) implies slow regime; adaptive MAs should lengthen.
- Low $D$ (e.g., < 15) signals rapid oscillations; shorten lookback windows.
- **Normalized Power:**
- Values > 0.8 indicate strong cycle confidence; consider cyclical strategies.
- Values < 0.3 warn of flat spectra; favor trend or volatility approaches.
- **Regime Shifts:**
- Rapid drop in $D$ alongside rising power often precedes volatility expansion.
- Divergence between $D$ and price swings may highlight upcoming breakouts.
## Limitations and Considerations
- **Spectral Leakage:** Limited lag range can smear peaks during abrupt volatility shifts.
- **O(n²) Segment:** Although constrained (≤ 60 loops), wide period spans increase computation.
- **Stationarity Assumption:** Autocorrelation presumes quasi-stationary cycles; regime changes reduce accuracy.
- **Latency in Noise:** Even with roofing, extremely noisy assets may require higher `avgLength`.
- **Downtrend Bias:** Negative trends may clip high-pass output; ensure preprocessing retains signal.
## References
* Ehlers, J. F. (2016). “Past Market Cycles.” *Technical Analysis of Stocks & Commodities*, 34(9), 52-55.
* Thinkorswim Learning Center. “Ehlers Autocorrelation Periodogram.”
* Fab MacCallini. “autocorrPeriodogram.R.” GitHub repository.
* QuantStrat TradeR Blog. “Autocorrelation Periodogram for Adaptive Lookbacks.”
* TradingView Script by blackcat1402. “Ehlers Autocorrelation Periodogram (Updated).”

TrendShield Pro | DinkanWorldSmart Trailing Trend System Powered by EMA + ATR
TrendShield Pro is a powerful trend detection and trailing stop indicator designed for traders who rely on pure price movement and volatility tracking.
It dynamically adapts to market conditions using a combination of EMA (Exponential Moving Average) and ATR (Average True Range) to identify the active trend and place a visual trailing stop line.
🔍 How It Works
TrendShield Pro combines trend direction and volatility to create a self-adjusting trailing system:
EMA (Exponential Moving Average):
Smooths price fluctuations and identifies the overall market bias.
ATR (Average True Range):
Measures volatility to determine how far the trailing stop should follow the trend.
Dynamic Bands:
Two invisible thresholds are formed — up and down — around the EMA using the ATR and your chosen Factor value.
Trailing Logic:
When the EMA is rising, the Trailing Stop (TUp) locks in higher lows.
When the EMA is falling, the Trailing Stop (TDown) locks in lower highs.
The indicator switches trend automatically based on price crossing these trailing levels.
🧭 Visuals & Features
Green Trailing Line (Demand Trend): Indicates an active bullish trend.
Red Trailing Line (Supply Trend): Indicates an active bearish trend.
Arrow Signals:
🟢 Up Arrow → Bullish Trend Reversal
🔴 Down Arrow → Bearish Trend Reversal
Diamond Markers: Show points where the trailing line shifts, marking dynamic volatility changes.
⚙️ Inputs
Input Description
EMA Period Length of the Exponential Moving Average
ATR Period Period used for Average True Range calculation
Factor Multiplier for ATR-based volatility expansion

Lorentzian Harmonic Flow - Temporal Market Dynamic Lorentzian Harmonic Flow - Temporal Market Dynamic (⚡LHF)
By: DskyzInvestments
What this is
LHF Pro is a research‑grade analytical instrument that models market time as a compressible medium , extracts directional flow in curved time using heavy‑tailed kernels, and consults a history‑based memory bank for context before synthesizing a final, bounded probabilistic score . It is not a mashup; each subsystem is mathematically coupled to a single clock (time dilation via gamma) and a single lens (Lorentzian heavy‑tailed weighting). This script is dense in logic (and therefore heavy) because it prioritizes rigor, interpretability, and visual clarity.
Intended use
Education and research. This tool expresses state recognition and regime context—not guarantees. It does not place orders. It is fully functional as published and contains no placeholders. Nothing herein is financial advice.
Why this is original and useful
Curved time: Markets do not move at a constant pace. LHF Pro computes a Lorentz‑style gamma (γ) from relative speed so its analytical windows contract when the tape accelerates and relax when it slows.
Heavy‑tailed lens: Lorentzian kernels weight information with fat tails to respect rare but consequential extremes (unlike Gaussian decay).
Memory of regimes: A K‑nearest‑neighbors engine works in a multi‑feature space using Lorentz kernels per dimension and exponential age fade , returning a memory bias (directional expectation) and assurance (confidence mass).
One ecosystem: Squeeze, TCI, flow, acceleration, and memory live on the same clock and blend into a single final_score —visualized and documented on the dashboard.
Cognitive map: A 2D heat map projects memory resonance by age and flow regime, making “where the past is speaking” visible.
Shadow portfolio metaphor: Neighbor outcomes act like tiny hypothetical positions whose weighted average forms an educational pressure gauge (no execution, purely didactic).
Mathematical framework (full transparency)
1) Returns, volatility, and speed‑of‑market
Log return: rₜ = ln(closeₜ / closeₜ₋₁)
Realized vol: rv = stdev(r, vol_len); vol‑of‑vol: burst = |rv − rv |
Speed‑of‑market (analog to c): c = c_multiplier × (EMA(rv) + 0.5 × EMA(burst) + ε)
2) Trend velocity and Lorentz gamma (time dilation)
Trend velocity: v = |close − close | / (vel_len × ATR)
Relative speed: v_rel = v / c
Gamma: γ = 1 / √(1 − v_rel²), stabilized by caps (e.g., ≤10)
Interpretation: γ > 1 compresses market time → use shorter effective windows.
3) Adaptive temporal scale
Adaptive length: L = base_len / γ^power (bounded for safety)
Harmonic horizons: Lₛ = L × short_ratio, Lₘ = L × mid_ratio, Lₗ = L × long_ratio
4) Lorentzian smoothing and Harmonic Flow
Kernel weight per lag i: wᵢ = 1 / (1 + (d/γ)²), d = i/L
Horizon baselines: lw_h = Σ wᵢ·price / Σ wᵢ
Z‑deviation: z_h = (close − lw_h)/ATR
Harmonic Flow (HFL): HFL = (w_short·zₛ + w_mid·zₘ + w_long·zₗ) / (w_short + w_mid + w_long)
5) Flow kinematics
Velocity: HFL_vel = HFL − HFL
Acceleration (curvature): HFL_acc = HFL − 2·HFL + HFL
6) Squeeze and temporal compression
Bollinger width vs Keltner width using L
Squeeze: BB_width < KC_width × squeeze_mult
Temporal Compression Index: TCI = base_len / L; TCI > 1 ⇒ compressed time
7) Entropy (regime complexity)
Shannon‑inspired proxy on |log returns| with numerical safeguards and smoothing. Higher entropy → more chaotic regime.
8) Memory bank and Lorentzian k‑NN
Feature vector (5D):
Outcomes stored: forward returns at H5, H13, H34
Per‑dimension similarity: k(Δ) = 1 / (1 + Δ²), weighted by user’s feature weights
Age fading: weight_age = mem_fade^age_bars
Neighbor score: sᵢ = similarityᵢ × weight_ageᵢ
Memory bias: mem_bias = Σ sᵢ·outcomeᵢ / Σ sᵢ
Assurance: mem_assurance = Σ sᵢ (confidence mass)
Normalization: mem_bias normalized by ATR and clamped into band
Shadow portfolio metaphor: neighbors behave like micro‑positions; their weighted net forward return becomes a continuous, adaptive expectation.
9) Blended score and breakout proxy
Blend factor: α_mem = 0.45 + 0.15 × (γ − 1)
Final score: final_score = (1−α_mem)·tanh(HFL / (flow_thr·1.5)) + α_mem·tanh(mem_bias_norm)
Breakout probability (bounded): energy = cap(TCI−1) + |HFL_acc|×k + cap(γ−1)×k + cap(mem_assurance)×k; breakout_prob = sigmoid(energy). Caps avoid runaway “100%” readings.
Inputs — every control, purpose, mechanics, and tuning
🔮 Lorentz Core
Auto‑Adapt (Vol/Entropy): On = L responds to γ and entropy (breathes with regime), Off = static testing.
Base Length: Calm‑market anchor horizon. Lower (21–28) for fast tapes; higher (55–89+) for slow.
Velocity Window (vel_len): Bars used in v. Shorter = more reactive γ; longer = steadier.
Volatility Window (vol_len): Bars used for rv/burst (c). Shorter = more sensitive c.
Speed‑of‑Market Multiplier (c_multiplier): Raises/lowers c. Lower values → easier γ spikes (more adaptation). Aim for strong trends to peak around γ ≈ 2–4.
Gamma Compression Power: Exponent of γ in L. <1 softens; >1 amplifies adaptation swings.
Max Kernel Span: Upper bound on smoothing loop (quality vs CPU).
🎼 Harmonic Flow
Short/Mid/Long Horizon Ratios: Partition L into fast/medium/slow views. Smaller short_ratio → faster reaction; larger long_ratio → sturdier bias.
Weights (w_short/w_mid/w_long): Governs HFL blend. Higher w_short → nimble; higher w_long → stable.
📈 Signals
Squeeze Strictness: Threshold for BB1 = compressed (coiled spring); <1 = dilated.
v/c: Relative speed; near 1 denotes extreme pacing. Diagnostic only.
Entropy: Regime complexity; high entropy suggests caution, smaller size, or waiting for order to return.
HFL: Curved‑time directional flow; sign and magnitude are the instantaneous bias.
HFL_acc: Curvature; spikes often accompany regime ignition post‑squeeze.
Mem Bias: Directional expectation from historical analogs (ATR‑normalized, bounded). Aligns or conflicts with HFL.
Assurance: Confidence mass from neighbors; higher → more reliable memory bias.
Squeeze: ON/RELEASE/OFF from BB

特典インジケーター (ボリンジャーバンド+移動平均線)BTCやSP500向けのチャート解析ツールです。
- ボリンジャーバンド(オレンジ上下線、水色中央線)
- EMA5(青線)、EMA25(黄色線)、EMA200(赤線)
使い方のポイント
- トレンド判定: EMA200(赤)より上なら上昇基調、下なら下降基調が優勢。
- 短中期の勢い: EMA5(青)とEMA25(黄)のゴールデンクロス/デッドクロスで勢いの変化を確認。
- ボラティリティと逆張り: ボリンジャーバンドの上限/下限タッチは伸びの継続か反転の初動かを、中央線(基準・水色)復帰でフォロー確認。
- 時間軸: 1時間~4時間は短期、日足は中期のトレンド確認に適合。複数時間軸で整合性を取ると精度が上がります。
ツールの解説
ボリンジャーバンド(Bollinger Bands)
ボリンジャーバンドは、20期間の単純移動平均(SMA)を中央線とし、その上下に標準偏差×2のバンドを配置します。
- 上限バンド:相場の上振れが過熱している可能性を示すレジスタンスライン
- 下限バンド:相場の下振れが過冷却している可能性を示すサポートライン
- バンド幅の拡大:ボラティリティ上昇局面を示唆
- バンド幅の収縮:レンジ相場や転換前の低ボラティリティを示唆
---------------------
EMA5(Exponential Moving Average 5)
EMA5は直近5本の価格により重み付けされた指数移動平均です。
- 非常に短期的な価格の変化を捉え、エントリーや還流のタイミングに敏感
- EMA25とのクロスオーバーで、短期モメンタムの変化を判断
EMA25(Exponential Moving Average 25)
EMA25は中期的なトレンドを表す指数移動平均です。
- EMA5との位置関係でトレンドの強さや方向性を評価
- 価格がEMA25を上回れば短期的な買い優勢、下回れば売り優勢
EMA200(Exponential Moving Average 200)
EMA200は長期トレンドの大局を示す指数移動平均です。
- プロのトレーダーにも重要視されるサポート/レジスタンスライン
- 価格がEMA200を上回ると長期的に強気、市場全体のセンチメント確認に利用
Chart Analysis Tool for BTC and S&P500
- Bollinger Bands (orange upper/lower lines, light blue middle line)
- EMA5 (blue line), EMA25 (yellow line), EMA200 (red line)

TradeScope: MA Reversion • RVOL • Trendlines • GAPs • TableTradeScope is an all-in-one technical analysis suite that brings together price action, momentum, volume dynamics, and trend structure into one cohesive and fully customizable indicator.
An advanced, modular trading suite that combines moving averages, reversion signals, RSI/CCI momentum, relative volume, gap detection, trendline analysis, and dynamic tables — all within one powerful dashboard.
Perfect for swing traders, intraday traders, and analysts who want to read price strength, volume context, and market structure in real time.
⚙️ Core Components & Inputs
🧮 Moving Average Settings
Moving Average Type & Length:
Choose between SMA or EMA and set your preferred period for smoother or more reactive trend tracking.
Multi-MA Plotting:
Up to 8 customizable moving averages (each with independent type, color, and length).
Includes a “window filter” to show only the last X bars, reducing chart clutter.
MA Reversion Engine:
Detects when price has extended too far from its moving average.
Reversion Lookback: Number of bars analyzed to determine historical extremes.
Reversion Threshold: Sensitivity multiplier—lower = more frequent signals, higher = stricter triggers.
🔄 Trend Settings
Short-Term & Long-Term Trend Lookbacks:
Uses linear regression to detect the slope and direction of the short- and long-term trend.
Results are displayed in the live table with color-coded bias:
🟩 Bullish | 🟥 Bearish
📈 Momentum Indicators
RSI (Relative Strength Index):
Adjustable period; displays the current RSI value, overbought (>70) / oversold (<30) zones, and trending direction.
CCI (Commodity Channel Index):
Customizable length with color-coded bias:
🟩 Oversold (< -100), 🟥 Overbought (> 100).
Tooltip shows whether the CCI is trending up or down.
📊 Volume Analysis
Relative Volume (RVOL):
Estimates end-of-day projected volume using intraday progress and compares it against the 20-day average.
Displays whether today’s volume is expected to exceed yesterday’s, and highlights color by strength.
Volume Trend (Short & Long Lookbacks):
Visual cues for whether current volume is above or below short-term and long-term averages.
Estimated Full-Day Volume & Multiplier:
Converts raw volume into “X” multiples (e.g., 2.3X average) for quick interpretation.
🕳️ Gap Detection
Automatically identifies and plots bullish and bearish price gaps within a defined lookback period.
Gap Lookback: Defines how far back to search for gaps.
Gap Line Width / Visibility: Controls the thickness and display of gap lines on chart.
Displays the closest open gap in the live table, including its distance from current price (%).
🔍 ATR & Volatility
14-day ATR (% of price):
Automatically converts the Average True Range into a percent, providing quick volatility context:
🟩 Low (<3%) | 🟨 Moderate (3–5%) | 🟥 High (>5%)
💬 Candlestick Pattern Recognition
Auto-detects popular reversal and continuation patterns such as:
Bullish/Bearish Engulfing
Hammer / Hanging Man
Shooting Star / Inverted Hammer
Doji / Harami / Kicking / Marubozu / Morning Star
Each pattern is shown with contextual color coding in the table.
🧱 Pivot Points & Support/Resistance
Optional Pivot High / Pivot Low Labels
Adjustable left/right bar lengths for pivot detection
Theme-aware text and label color options
Automatically drawn diagonal trendlines for both support and resistance
Adjustable line style, color, and thickness
Detects and tracks touches for reliability
Includes breakout alerts (with optional volume confirmation)
🚨 Alerts
MA Cross Alerts:
Triggers when price crosses the fast or slow moving average within a tolerance band (default ±0.3%).
Diagonal Breakout Alerts:
Detects and alerts when price breaks diagonal trendlines.
Volume-Confirmed Alerts:
Filters breakouts where volume exceeds 1.5× the 20-bar average.
🧾 Live Market Table
A fully dynamic table displayed on-chart, customizable via input toggles:
Choose which rows to show (e.g., RSI, ATR, RVOL, Gaps, CCI, Trend, MA info, Diff, Low→Close%).
Choose table position (top-right, bottom-left, etc.) and text size.
Theme selection: Light or Dark
Conditional background colors for instant visual interpretation:
🟩 Bullish or Oversold
🟥 Bearish or Overbought
🟨 Neutral / Moderate
🎯 Practical Uses
✅ Identify confluence setups combining MA reversion, volume expansion, and RSI/CCI extremes.
✅ Track trend bias and gap proximity directly in your dashboard.
✅ Monitor relative volume behavior for intraday strength confirmation.
✅ Automate MA cross or breakout alerts to stay ahead of key price action.
🧠 Ideal For
Swing traders seeking confluence-based setups
Intraday traders monitoring multi-factor bias
Analysts looking for compact market health dashboards
💡 Summary
TradeScope is designed as a single-pane-of-glass market view — combining momentum, trend, volume, structure, and reversion into one clear visual system.
Fully customizable. Fully dynamic.
Use it to see what others miss — clarity, confluence, and confidence in every trade.

Multi-Timeframe Multi-EMA StatusMultiple changeable EMAs and Timeframes to tell you if the stock price is above or below them. Can be used on any ticker where EMAs can be used.

TEWMA Supertrend - [JTCAPITAL]TEWMA Supertrend - is a modified way to use Triple Exponential Weighted Moving Average (TEWMA) combined with ATR-based Supertrend logic for Trend-Following.
The idea behind this indicator is to merge the smoothness and responsiveness of TEWMA with the robustness of ATR-based Supertrend volatility filtering. This results in a tool that not only reacts quickly to price changes but also adapts to market volatility, providing reliable trend detection with reduced noise.
The indicator works by calculating in the following steps:
Source Selection
The user can select the price source (default is Close). This price series is the foundation of all calculations, and changing the source allows the indicator to adapt to different analytical perspectives, such as Open, High, Low, or HL2.
TEWMA Calculation
The script calculates a Weighted Moving Average (WMA) of the selected source, and then applies a Triple Exponential Moving Average (TEMA) smoothing on top of it. The result is what we call TEWMA. This hybrid method achieves two goals simultaneously:
-WMA adds sensitivity by giving more weight to recent data.
-TEMA reduces lag by combining multiple EMA calculations while keeping smoothness.
ATR Volatility Measurement
In parallel, the Average True Range (ATR) is calculated over the user-defined Supertrend length . ATR measures volatility and dynamically scales the upper and lower bands to adjust to different market conditions.
Upper and Lower Band Construction
The indicator builds two envelopes around the TEWMA:
- Upper Band = TEWMA + (Multiplier × ATR)
- Lower Band = TEWMA – (Multiplier × ATR)
These bands expand and contract depending on volatility, creating a dynamic channel.
Band Adjustment Logic
To prevent false flips, the current upper/lower band values are compared to their previous values. If price has not broken above or below the prior band, the bands “stick” to their previous values, thereby filtering noise and avoiding unnecessary trend changes.
Trend Detection
-If price closes above the adjusted upper band, the direction is bullish.
-If price closes below the adjusted lower band, the direction is bearish.
-Otherwise, the trend direction continues from its prior state.
The Trend line is then set to either the upper band (bearish) or lower band (bullish).
Visual Representation
-The TEWMA line itself is plotted and color-coded (blue for bullish, purple for bearish).
-The active Supertrend line is plotted depending on trend direction.
-Shaded regions are added around the lines for enhanced clarity, visually separating bullish and bearish phases.
Buy and Sell Conditions :
- Buy Signal : Triggered when price closes above the Supertrend line, confirming a bullish shift.
- Sell Signal : Triggered when price closes below the Supertrend line, confirming a bearish shift.
Features and Parameters :
- TEWMA Source – Select the input price (Close, Open, High, Low, etc.).
- TEWMA Length – Defines the lookback for the Weighted MA and subsequent TEMA smoothing.
- Supertrend Length – Defines the ATR period used for volatility measurement.
- Multiplier – Determines how far the Supertrend bands are placed from the TEWMA. Higher values mean wider bands and fewer trend flips, while lower values mean tighter bands and more frequent signals.
Specifications :
Weighted Moving Average (WMA)
The WMA gives more importance to recent price points while still considering past values. This makes it more responsive to recent moves than a Simple Moving Average (SMA).
Triple Exponential Moving Average (TEMA)
TEMA reduces lag by combining multiple layers of EMA calculations. Unlike a simple EMA, which can be slow to react, TEMA anticipates changes faster, while still maintaining smoothness to avoid false signals.
TEWMA (TEMA of WMA)
By applying TEMA on top of WMA, we create a hybrid smoothing technique. This retains the responsiveness of WMA but reduces its lag via TEMA’s structure. The result is a highly adaptive moving average, ideal for fast trend detection.
Average True Range (ATR)
ATR measures the degree of volatility by looking at the full trading range of each candle. It ensures that the Supertrend bands expand in volatile markets and contract in calm markets, keeping signals relevant to current conditions.
Supertrend Bands
The upper and lower envelopes built around TEWMA act as dynamic support and resistance. Their adaptive nature reduces false trend shifts during choppy sideways markets.
Band Adjustment Logic
Instead of recalculating bands every candle, the script uses a memory mechanism (previous values) to prevent unnecessary trend switches. This stabilizes the indicator and avoids excessive noise.
Trend Line
The final output is a line that follows price in trending phases while holding steady during consolidations. Its placement above or below price clearly signals bullish or bearish market structure.
Color Coding and Visuals
The use of shaded fills and line coloring enhances readability. Traders can quickly distinguish trend direction and momentum without deep numerical analysis.
Enjoy!

Trend Pro V2 [CRYPTIK1]Introduction: What is Trend Pro V2?
Welcome to Trend Pro V2! This analysis tool give you at-a-glance understanding of the market's direction. In a noisy market, the single most important factor is the dominant trend. Trend Pro V2 filters out this noise by focusing on one core principle: trading with the primary momentum.
Instead of cluttering your chart with confusing signals, this indicator provides a clean, visual representation of the trend, helping you make more confident and informed trading decisions.
The dashboard provides a simple, color-coded view of the trend across multiple timeframes.
The Core Concept: The Power of Confluence
The strength of any trading decision comes from confluence—when multiple factors align. Trend Pro V2 is built on this idea. It uses a long-term moving average (200-period EMA by default) to define the primary trend on your current chart and then pulls in data from three higher timeframes to confirm whether the broader market agrees.
When your current timeframe and the higher timeframes are all aligned, you have a state of "confluence," which represents a higher-probability environment for trend-following trades.
Key Features
1. The Dynamic Trend MA:
The main moving average on your chart acts as your primary guide. Its color dynamically changes to give you an instant read on the market.
Teal MA: The price is in a confirmed uptrend (trading above the MA).
Pink MA: The price is in a confirmed downtrend (trading below the MA).
The moving average changes color to instantly show you if the trend is bullish (teal) or bearish (pink).
2. The Multi-Timeframe (MTF) Trend Dashboard:
Located discreetly in the bottom-right corner, this dashboard is your window into the broader market sentiment. It shows you the trend status on three customizable higher timeframes.
Teal Box: The trend is UP on that timeframe.
Pink Box: The trend is DOWN on that timeframe.
Gray Box: The price is neutral or at the MA on that timeframe.
How to Use Trend Pro V2: A Simple Framework
Step 1: Identify the Primary Trend
Look at the color of the MA on your chart. This is your starting point. If it's teal, you should generally be looking for long opportunities. If it's pink, you should be looking for short opportunities.
Step 2: Check for Confluence
Glance at the MTF Trend Dashboard.
Strong Confluence (High-Probability): If your main chart shows an uptrend (Teal MA) and the dashboard shows all teal boxes, the market is in a strong, unified uptrend. This is a high-probability environment to be a buyer on dips.
Weak or No Confluence (Caution Zone): If your main chart shows an uptrend, but the dashboard shows pink or gray boxes, it signals disagreement among the timeframes. This is a sign of market indecision and a lower-probability environment. It's often best to wait for alignment.
Here, the daily trend is down, but the MTF dashboard shows the weekly trend is still up—a classic sign of weak confluence and a reason for caution.
Best Practices & Settings
Timeframe Synergy: For best results, use Trend Pro on a lower timeframe and set your dashboard to higher timeframes. For example, if you trade on the 1-hour chart, set your MTF dashboard to the 4-hour, 1-day, and 1-week.
Use as a Confirmation Tool: Trend Pro V2 is designed as a foundational layer for your analysis. First, confirm the trend, then use your preferred entry method (e.g., support/resistance, chart patterns) to time your trade.
This is a tool for the community, so feel free to explore the open-source code, adapt it, and build upon it. Happy trading!
For your consideration @TradingView

Momentum Moving Averages | MisinkoMasterThe Momentum Moving Averages (MMA) indicator blends multiple moving averages into a single momentum-scoring framework, helping traders identify whether market conditions are favoring upside momentum or downside momentum.
By comparing faster, more adaptive moving averages (DEMA, TEMA, ALMA, HMA) against a baseline EMA, the MMA produces a cumulative score that reflects the prevailing strength and direction of the trend.
🔎 Methodology
Moving Averages Used
EMA (Exponential Moving Average) → Baseline reference.
DEMA (Double Exponential Moving Average) → Reacts faster than EMA.
TEMA (Triple Exponential Moving Average) → Even faster, reduces lag further.
ALMA (Arnaud Legoux Moving Average) → Smooth but adaptive, with adjustable σ and offset.
HMA (Hull Moving Average) → Very responsive, reduces lag, ideal for momentum shifts.
Scoring System
Each comparison is made against the EMA baseline:
If another MA is above EMA → +1 point.
If another MA is below EMA → -1 point.
The total score reflects overall momentum:
Positive score → Bullish bias.
Negative score → Bearish bias.
Trend Logic
Bullish Signal → When the score crosses above 0.1.
Bearish Signal → When the score crosses below -0.1.
Neutral or sideways trends are identified when the score remains between thresholds.
📈 Visualization
All five moving averages are plotted on the chart.
Colors adapt to the current score:
Cyan (Bullish bias) → Positive momentum.
Magenta (Bearish bias) → Negative momentum.
Overlapping fills between MAs highlight zones of convergence/divergence, making momentum shifts visually clear.
⚡ Features
Adjustable length parameter for all MAs.
Adjustable ALMA parameters (sigma and offset).
Cumulative momentum score system to filter false signals.
Works across all markets (crypto, forex, stocks, indices).
Overlay design for direct chart integration.
✅ Use Cases
Trend Confirmation → Ensure alignment with market momentum.
Momentum Shifts → Spot when faster MAs consistently outperform the baseline EMA.
Entry & Exit Filter → Avoid trades when the score is neutral or indecisive.
Divergence Visualizer → Filled zones make it easier to see when MAs begin separating or converging.
Low History Required → Unlike most For Loops, this script does not require that much history, making it less lagging and more responsive
⚠️ Limitations
Works best in trending conditions; performance decreases in sideways/choppy ranges.
Sensitivity of signals depends on chosen length and ALMA settings.
Should not be used as a standalone buy/sell system—combine with volume, structure, or higher timeframe analysis.
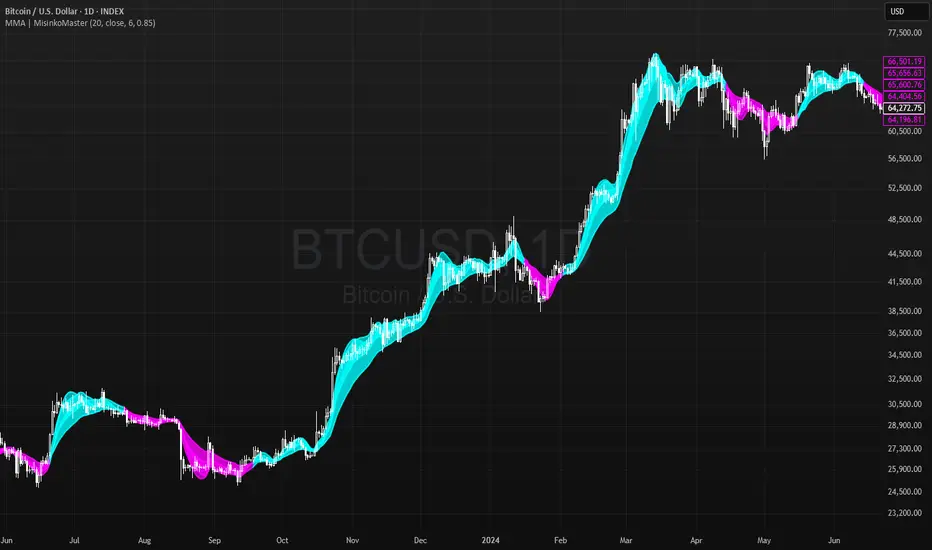
Advanced Trend Momentum [Alpha Extract]The Advanced Trend Momentum indicator provides traders with deep insights into market dynamics by combining exponential moving average analysis with RSI momentum assessment and dynamic support/resistance detection. This sophisticated multi-dimensional tool helps identify trend changes, momentum divergences, and key structural levels, offering actionable buy and sell signals based on trend strength and momentum convergence.
🔶 CALCULATION
The indicator processes market data through multiple analytical methods:
Dual EMA Analysis: Calculates fast and slow exponential moving averages with dynamic trend direction assessment and ATR-normalized strength measurement.
RSI Momentum Engine: Implements RSI-based momentum analysis with enhanced overbought/oversold detection and momentum velocity calculations.
Pivot-Based Structure: Identifies and tracks dynamic support and resistance levels using pivot point analysis with configurable level management.
Signal Integration: Combines trend direction, momentum characteristics, and structural proximity to generate high-probability trading signals.
Formula:
Fast EMA = EMA(Close, Fast Length)
Slow EMA = EMA(Close, Slow Length)
Trend Direction = Fast EMA > Slow EMA ? 1 : -1
Trend Strength = |Fast EMA - Slow EMA| / ATR(Period) × 100
RSI Momentum = RSI(Close, RSI Length)
Momentum Value = Change(Close, 5) / ATR(10) × 100
Pivot Support/Resistance = Dynamic pivot arrays with configurable lookback periods
Bullish Signal = Trend Change + Momentum Confirmation + Strength > 1%
Bearish Signal = Trend Change + Momentum Confirmation + Strength > 1%
🔶 DETAILS
Visual Features:
Trend EMAs: Fast and slow exponential moving averages with dynamic color coding (bullish/bearish)
Enhanced RSI: RSI oscillator with color-coded zones, gradient fills, and reference bands at overbought/oversold levels
Trend Fill: Dynamic gradient between EMAs indicating trend strength and direction
Support/Resistance Lines: Horizontal levels extending from pivot-based calculations with configurable maximum levels
Momentum Candles: Color-coded candlestick overlay reflecting combined trend and momentum conditions
Divergence Markers: Diamond-shaped signals highlighting bullish and bearish momentum divergences
Analysis Table: Real-time summary of trend direction, strength percentage, RSI value, and momentum reading
Interpretation:
Trend Direction: Bullish when Fast EMA crosses above Slow EMA with strength confirmation
Trend Strength > 1%: Strong trending conditions with institutional participation
RSI > 70: Overbought conditions, potential selling opportunity
RSI < 30: Oversold conditions, potential buying opportunity
Momentum Divergence: Price and momentum moving opposite directions signal potential reversals
Support/Resistance Proximity: Dynamic levels provide optimal entry/exit zones
Combined Signals: Trend changes with momentum confirmation generate high-probability opportunities
🔶 EXAMPLES
Trend Confirmation: Fast EMA crossing above Slow EMA with trend strength exceeding 1% and positive momentum confirms strong bullish conditions.
Example: During institutional accumulation phases, EMA crossovers with momentum confirmation have historically preceded significant upward moves, providing optimal long entry points.
15min
4H
Momentum Divergence Detection: RSI reaching overbought levels while momentum decreases despite rising prices signals potential trend exhaustion.
Example: Bearish divergence signals appearing at resistance levels have marked major market tops, allowing traders to secure profits before corrections.
Support/Resistance Integration: Dynamic pivot-based levels combined with trend and momentum signals create high-probability trading zones.
Example: Bullish trend changes occurring near established support levels offer optimal risk-reward entries with clearly defined stop-loss levels.
Multi-Dimensional Confirmation: The indicator's combination of trend, momentum, and structural analysis provides comprehensive market validation.
Example: When trend direction aligns with momentum characteristics near key structural levels, the confluence creates institutional-grade trading opportunities with enhanced probability of success.
🔶 SETTINGS
Customization Options:
Trend Analysis: Fast EMA Length (default: 12), Slow EMA Length (default: 26), Trend Strength Period (default: 14)
Support & Resistance: Pivot Length for level detection (default: 10), Maximum S/R Levels displayed (default: 3), Toggle S/R visibility
Momentum Settings: RSI Length (default: 14), Oversold Level (default: 30), Overbought Level (default: 70)
Visual Configuration: Color schemes for bullish/bearish/neutral conditions, transparency settings for fills, momentum candle overlay toggle
Display Options: Analysis table visibility, divergence marker size, alert system configuration
The Advanced Trend Momentum indicator provides traders with comprehensive insights into market dynamics through its sophisticated integration of trend analysis, momentum assessment, and structural level detection. By combining multiple analytical dimensions into a unified framework, this tool helps identify high-probability opportunities while filtering out market noise through its multi-confirmation approach, enabling traders to make informed decisions across various market cycles and timeframes.

IU Indicators DashboardDESCRIPTION
The IU Indicators Dashboard is a comprehensive multi-stock monitoring tool that provides real-time technical analysis for up to 10 different stocks simultaneously. This powerful indicator creates a customizable table overlay that displays the trend status of multiple technical indicators across your selected stocks, giving you an instant overview of market conditions without switching between charts.
Perfect for portfolio monitoring, sector analysis, and quick market screening, this dashboard consolidates critical technical data into one easy-to-read interface with color-coded trend signals.
USER INPUTS
Stock Selection (10 Configurable Stocks):
- Stock 1-10: Customize any symbols (Default: NSE:CDSL, NSE:RELIANCE, NSE:VEDL, NSE:TCS, NSE:BEL, NSE:BHEL, NSE:TATAPOWER, NSE:TATASTEEL, NSE:ITC, NSE:LT)
Technical Indicator Parameters:
- EMA 1 Length: First Exponential Moving Average period (Default: 20)
- EMA 2 Length: Second Exponential Moving Average period (Default: 50)
- EMA 3 Length: Third Exponential Moving Average period (Default: 200)
- RSI Length: Relative Strength Index calculation period (Default: 14)
- SuperTrend Length: SuperTrend indicator period (Default: 10)
- SuperTrend Factor: SuperTrend multiplier factor (Default: 3.0)
Visual Customization:
- Table Size: Choose from Normal, Tiny, Small, or Large
- Table Background Color: Customize dashboard background
- Table Frame Color: Set frame border color
- Table Border Color: Configure border styling
- Text Color: Set text display color
- Bullish Color: Color for positive/bullish signals (Default: Green)
- Bearish Color: Color for negative/bearish signals (Default: Red)
LOGIC OF THE INDICATOR
The dashboard employs a multi-timeframe analysis approach using five key technical indicators:
1. Triple EMA Analysis
- Compares current price against three different EMA periods (20, 50, 200)
- Bullish Signal: Price above EMA level
- Bearish Signal: Price below EMA level
- Provides short-term, medium-term, and long-term trend perspective
2. RSI Momentum Analysis
- Uses 14-period RSI with 50-level threshold
- Bullish Signal: RSI > 50 (upward momentum)
- Bearish Signal: RSI < 50 (downward momentum)
- Identifies momentum strength and potential reversals
3. SuperTrend Direction
- Utilizes SuperTrend with configurable length and factor
- Bullish Signal: SuperTrend direction = -1 (uptrend)
- Bearish Signal: SuperTrend direction = 1 (downtrend)
- Provides clear trend direction with volatility-adjusted signals
4. MACD Histogram Analysis
- Uses standard MACD (12, 26, 9) histogram values
- Bullish Signal: Histogram > 0 (bullish momentum)
- Bearish Signal: Histogram < 0 (bearish momentum)
- Identifies momentum shifts and trend confirmations
5. Real-time Data Processing
- Implements request.security() for multi-symbol data retrieval
- Uses barstate.isrealtime logic for accurate live data
- Processes data only on the last bar for optimal performance
WHY IT IS UNIQUE
Multi-Stock Monitoring
- Monitor up to 10 different stocks simultaneously on a single chart
- No need to switch between multiple charts or timeframes
Highly Customizable Interface
- Full color customization for personalized visual experience
- Adjustable table size and positioning
- Clean, professional dashboard design
Real-time Analysis
- Live data processing with proper real-time handling
- Instant visual feedback through color-coded signals
- Optimized performance with smart data retrieval
Comprehensive Technical Coverage
- Combines trend-following, momentum, and volatility indicators
- Multiple timeframe perspective through different EMA periods
- Balanced approach using both lagging and leading indicators
Flexible Configuration
- Easy symbol switching for different markets (NSE, BSE, NYSE, NASDAQ)
- Adjustable indicator parameters for different trading styles
- Suitable for both swing trading and position trading
HOW USERS CAN BENEFIT FROM IT
Portfolio Management
- Quick Portfolio Health Check: Instantly assess the technical status of your entire stock portfolio
- Diversification Analysis: Monitor stocks across different sectors to ensure balanced exposure
- Risk Management: Identify which positions are showing bearish signals for potential exit strategies
- Rebalancing Decisions: Spot strongest performers for potential position increases
Market Screening and Analysis
- Sector Rotation: Compare different sector stocks to identify rotation opportunities
- Relative Strength Analysis: Quickly identify which stocks are outperforming or underperforming
- Market Breadth Assessment: Gauge overall market sentiment by monitoring diverse stock selections
- Trend Confirmation: Validate market trends by observing multiple stock behaviors
Time-Efficient Trading
- Single-Glance Analysis: Get complete technical overview without chart-hopping
- Pre-Market Preparation: Quickly assess overnight changes across multiple positions
- Intraday Monitoring: Track multiple opportunities simultaneously during trading hours
- End-of-Day Review: Efficiently review all watched stocks for next-day planning
Strategic Decision Making
- Entry Point Identification: Spot stocks showing bullish alignment across multiple indicators
- Exit Signal Recognition: Identify positions showing deteriorating technical conditions
- Swing Trading Opportunities: Find stocks with favorable technical setups for swing trades
- Long-term Investment Guidance: Use 200 EMA signals for long-term position decisions
Educational Benefits
- Pattern Recognition: Learn how different indicators behave across various market conditions
- Correlation Analysis: Understand how stocks move relative to each other
- Technical Analysis Learning: Observe multiple indicator interactions in real-time
- Market Sentiment Understanding: Develop better market timing skills through multi-stock observation
Workflow Optimization
- Reduced Chart Clutter: Keep your main chart clean while monitoring multiple stocks
- Faster Analysis: Complete technical analysis of 10 stocks in seconds instead of minutes
- Consistent Methodology: Apply the same technical criteria across all monitored stocks
- Alert Integration: Easy visual identification of stocks requiring immediate attention
This indicator is designed for traders and investors who want to maximize their market awareness while minimizing analysis time. Whether you're managing a portfolio, screening for opportunities, or learning technical analysis, the IU Indicators Dashboard provides the comprehensive overview you need for better trading decisions.
DISCLAIMER :
This indicator is not financial advice, it's for educational purposes only highlighting the power of coding( pine script) in TradingView, I am not a SEBI-registered advisor. Trading and investing involve risk, and you should consult with a qualified financial advisor before making any trading decisions. I do not guarantee profits or take responsibility for any losses you may incur.

EMA Grid + Martingale Strategy (Long-Only) with CooldownTitle:
EMA Grid + Martingale Strategy (Long-Only) with Cooldown
Short Summary:
A long-only strategy combining EMA trend filters, grid-based entries, optional martingale sizing, and a cooldown feature to manage position timing and exits.
Full Description:
This strategy uses a 4-EMA trend confirmation system to detect bullish momentum, then deploys a grid-style entry method with optional martingale position sizing. It includes a cooldown mechanism to prevent reentry too soon after a completed trade cycle.
How It Works
1. Trend Confirmation: Two EMA groups (fast/slow) determine whether market conditions are bullish.
2. Initial Entry: A new position is entered when both EMA groups confirm an uptrend and no position is currently active.
3. Grid Entries: Additional long entries are placed when price drops by a defined pip distance from the last entry, respecting the maximum number of entries.
4. Martingale Sizing (Optional): Grid orders can increase in size with each level using a customizable multiplier.
5. Weighted-Average Exit: All positions close once price reaches or exceeds the average entry price plus a buffer.
6. Cooldown Timer: After closing a position set, the strategy waits a defined number of bars before opening a new grid.
Key Features
• 4 customizable EMAs for trend confirmation.
• Dynamic grid-style long entries based on pip intervals.
• Optional martingale-style position sizing.
• Weighted-average price exit logic with buffer control.
• Cooldown bar period to limit overtrading.
• Suitable for optimization and backtesting with full control over inputs.
Use Cases
• Designed for trending markets where pullbacks present entry opportunities.
• Helps manage staged entries while avoiding premature reentry.
• Ideal for testing martingale and grid-based strategies with exit precision.
Note: This strategy is for testing and educational purposes only. It does not guarantee profits and is not financial advice.

THF Crossover and Trend Signals Golden & Death Cross with VolumeScript Overview:
This Pine Script is designed to assist traders in identifying key buy/sell signals and major trend changes on the chart using Exponential Moving Averages (EMA) and Simple Moving Averages (SMA), as well as visualizing Golden Cross and Death Cross events. The script also includes a volume indicator to highlight the volume trading activity in relation to the price movements.
Key Features:
1. Moving Averages:
EMA 21: Exponential Moving Average over a 21-period, shown in green.
EMA 50: Exponential Moving Average over a 50-period, shown in yellow.
SMA 50: Simple Moving Average over a 50-period, shown in red.
SMA 200: Simple Moving Average over a 200-period, shown in blue.
2. Signals:
Buy Signal: Generated when EMA 21 crosses above SMA 50, indicating a potential upward trend. Displayed with a green label below the price bar.
Sell Signal: Generated when EMA 21 crosses below SMA 50, indicating a potential downward trend. Displayed with a red label above the price bar.
3. Golden Cross (Bullish Trend):
A Golden Cross occurs when EMA 50 crosses above SMA 200, which often signals the start of a long-term upward trend. The signal is displayed with a yellow label below the price bar.
4. Death Cross (Bearish Trend):
A Death Cross occurs when EMA 50 crosses below SMA 200, which often signals the start of a long-term downward trend. The signal is displayed with a blue label above the price bar.
5. Volume Indicator:
The volume is plotted as colored columns. Green indicates higher volume than the 20-period moving average, and red indicates lower volume.
A Volume Moving Average (SMA 20) is also plotted to compare volume changes over time.
How the Script Works:
1. The EMA and SMA lines are plotted on the chart, providing a visual representation of the short- and long-term trends.
2. Buy/Sell signals are triggered based on the crossover between EMA 21 and SMA 50, helping to identify potential entry and exit points.
3. The Golden Cross and Death Cross indicators highlight major trend reversals based on the crossover between EMA 50 and SMA 200, providing clear visual cues for long-term trend changes.
4. Volume is displayed alongside price movements, offering insight into the strength or weakness of a trend.
Key Customizations:
Moving Average Periods: Users can modify the lengths of the EMAs and SMAs for customized analysis.
Volume Moving Average Period: The script allows for adjustment of the volume moving average period to suit different market conditions.
Signal Visibility: The size and color of the buy, sell, Golden Cross, and Death Cross signals can be easily customized to make them more prominent on the chart.
Conclusion:
This script is ideal for traders looking to combine price action with volume analysis, using key technical indicators such as EMA, SMA, Golden Cross, and Death Cross to make informed decisions in trending markets.
---
This explanation covers all aspects of the script and provides a clear understanding of its functionality, which is helpful for sharing the script or using it as an educational resource.

MACD Liquidity Tracker Strategy [Quant Trading]MACD Liquidity Tracker Strategy
Overview
The MACD Liquidity Tracker Strategy is an enhanced trading system that transforms the traditional MACD indicator into a comprehensive momentum-based strategy with advanced visual signals and risk management. This strategy builds upon the original MACD Liquidity Tracker System indicator by TheNeWSystemLqtyTrckr , converting it into a fully automated trading strategy with improved parameters and additional features.
What Makes This Strategy Original
This strategy significantly enhances the basic MACD approach by introducing:
Four distinct system types for different market conditions and trading styles
Advanced color-coded histogram visualization with four dynamic colors showing momentum strength and direction
Integrated trend filtering using 9 different moving average types
Comprehensive risk management with customizable stop-loss and take-profit levels
Multiple alert systems for entry signals, exits, and trend conditions
Flexible signal display options with customizable entry markers
How It Works
Core MACD Calculation
The strategy uses a fully customizable MACD configuration with traditional default parameters:
Fast MA : 12 periods (customizable, minimum 1, no maximum limit)
Slow MA : 26 periods (customizable, minimum 1, no maximum limit)
Signal Line : 9 periods (customizable, now properly implemented and used)
Cryptocurrency Optimization : The strategy's flexible parameter system allows for significant optimization across different crypto assets. Traditional MACD settings (12/26/9) often generate excessive noise and false signals in volatile crypto markets. By using slower, more smoothed parameters, traders can capture meaningful momentum shifts while filtering out market noise.
Example - DOGE Optimization (45/80/290 settings) :
• Performance : Optimized parameters yielding exceptional backtesting results with 29,800% PnL
• Why it works : DOGE's high volatility and social sentiment-driven price action benefits from heavily smoothed indicators
• Timeframes : Particularly effective on 30-minute and 4-hour charts for swing trading
• Logic : The very slow parameters filter out noise and capture only the most significant trend changes
Other Optimizable Cryptocurrencies : This parameter flexibility makes the strategy highly effective for major altcoins including SUI, SEI, LINK, Solana (SOL) , and many others. Each crypto asset can benefit from custom parameter tuning based on its unique volatility profile and trading characteristics.
Four Trading System Types
1. Normal System (Default)
Long signals : When MACD line is above the signal line
Short signals : When MACD line is below the signal line
Best for : Swing trading and capturing longer-term trends in stable markets
Logic : Traditional MACD crossover approach using the signal line
2. Fast System
Long signals : Bright Blue OR Dark Magenta (transparent) histogram colors
Short signals : Dark Blue (transparent) OR Bright Magenta histogram colors
Best for : Scalping and high-volatility markets (crypto, forex)
Logic : Leverages early momentum shifts based on histogram color changes
3. Safe System
Long signals : Only Bright Blue histogram color (strongest bullish momentum)
Short signals : All other colors (Dark Blue, Bright Magenta, Dark Magenta)
Best for : Risk-averse traders and choppy markets
Logic : Prioritizes only the strongest bullish signals while treating everything else as bearish
4. Crossover System
Long signals : MACD line crosses above signal line
Short signals : MACD line crosses below signal line
Best for : Precise timing entries with traditional MACD methodology
Logic : Pure crossover signals for more precise entry timing
Color-Coded Histogram Logic
The strategy uses four distinct colors to visualize momentum:
🔹 Bright Blue : MACD > 0 and rising (strong bullish momentum)
🔹 Dark Blue (Transparent) : MACD > 0 but falling (weakening bullish momentum)
🔹 Bright Magenta : MACD < 0 and falling (strong bearish momentum)
🔹 Dark Magenta (Transparent) : MACD < 0 but rising (weakening bearish momentum)
Trend Filter Integration
The strategy includes an advanced trend filter using 9 different moving average types:
SMA (Simple Moving Average)
EMA (Exponential Moving Average) - Default
WMA (Weighted Moving Average)
HMA (Hull Moving Average)
RMA (Running Moving Average)
LSMA (Least Squares Moving Average)
DEMA (Double Exponential Moving Average)
TEMA (Triple Exponential Moving Average)
VIDYA (Variable Index Dynamic Average)
Default Settings : 50-period EMA for trend identification
Visual Signal System
Entry Markers : Blue triangles (▲) below candles for long entries, Magenta triangles (▼) above candles for short entries
Candle Coloring : Price candles change color based on active signals (Blue = Long, Magenta = Short)
Signal Text : Optional "Long" or "Short" text inside entry triangles (toggleable)
Trend MA : Gray line plotted on main chart for trend reference
Parameter Optimization Examples
DOGE Trading Success (Optimized Parameters) :
Using 45/80/290 MACD settings with 50-period EMA trend filter has shown exceptional results on DOGE:
Performance : Backtesting results showing 29,800% PnL demonstrate the power of proper parameter optimization
Reasoning : DOGE's meme-driven volatility and social sentiment spikes create significant noise with traditional MACD settings
Solution : Very slow parameters (45/80/290) filter out social media-driven price spikes while capturing only major momentum shifts
Optimal Timeframes : 30-minute and 4-hour charts for swing trading opportunities
Result : Exceptionally clean signals with minimal false entries during DOGE's characteristic pump-and-dump cycles
Multi-Crypto Adaptability :
The same optimization principles apply to other major cryptocurrencies:
SUI : Benefits from smoothed parameters due to newer coin volatility patterns
SEI : Requires adjustment for its unique DeFi-related price movements
LINK : Oracle news events create price spikes that benefit from noise filtering
Solana (SOL) : Network congestion events and ecosystem developments need smoothed detection
General Rule : Higher volatility coins typically benefit from very slow MACD parameters (40-50 / 70-90 / 250-300 ranges)
Key Input Parameters
System Type : Choose between Fast, Normal, Safe, or Crossover (Default: Normal)
MACD Fast MA : 12 periods default (no maximum limit, consider 40-50 for crypto optimization)
MACD Slow MA : 26 periods default (no maximum limit, consider 70-90 for crypto optimization)
MACD Signal MA : 9 periods default (now properly utilized, consider 250-300 for crypto optimization)
Trend MA Type : EMA default (9 options available)
Trend MA Length : 50 periods default (no maximum limit)
Signal Display : Both, Long Only, Short Only, or None
Show Signal Text : True/False toggle for entry marker text
Trading Applications
Recommended Use Cases
Momentum Trading : Capitalize on strong directional moves using the color-coded system
Trend Following : Combine MACD signals with trend MA filter for higher probability trades
Scalping : Use "Fast" system type for quick entries in volatile markets
Swing Trading : Use "Normal" or "Safe" system types for longer-term positions
Cryptocurrency Trading : Optimize parameters for individual crypto assets (e.g., 45/80/290 for DOGE, custom settings for SUI, SEI, LINK, SOL)
Market Suitability
Volatile Markets : Forex, crypto, indices (recommend "Fast" system or smoothed parameters)
Stable Markets : Stocks, ETFs (recommend "Normal" or "Safe" system)
All Timeframes : Effective from 1-minute charts to daily charts
Crypto Optimization : Each major cryptocurrency (DOGE, SUI, SEI, LINK, SOL, etc.) can benefit from custom parameter tuning. Consider slower MACD parameters for noise reduction in volatile crypto markets
Alert System
The strategy provides comprehensive alerts for:
Entry Signals : Long and short entry triangle appearances
Exit Signals : Position exit notifications
Color Changes : Individual histogram color alerts
Trend Conditions : Price above/below trend MA alerts
Strategy Parameters
Default Settings
Initial Capital : $1,000
Position Size : 100% of equity
Commission : 0.1%
Slippage : 3 points
Date Range : January 1, 2018 to December 31, 2069
Risk Management (Optional)
Stop Loss : Disabled by default (customizable percentage-based)
Take Profit : Disabled by default (customizable percentage-based)
Short Trades : Disabled by default (can be enabled)
Important Notes and Limitations
Backtesting Considerations
Uses realistic commission (0.1%) and slippage (3 points)
Default position sizing uses 100% equity - adjust based on risk tolerance
Stop-loss and take-profit are disabled by default to show raw strategy performance
Strategy does not use lookahead bias or future data
Risk Warnings
Past performance does not guarantee future results
MACD-based strategies may produce false signals in ranging markets
Consider combining with additional confluences like support/resistance levels
Test thoroughly on demo accounts before live trading
Adjust position sizing based on your risk management requirements
Technical Limitations
Strategy does not work on non-standard chart types (Heikin Ashi, Renko, etc.)
Signals are based on close prices and may not reflect intraday price action
Multiple rapid signals in volatile conditions may result in overtrading
Credits and Attribution
This strategy is based on the original "MACD Liquidity Tracker System" indicator created by TheNeWSystemLqtyTrckr . This strategy version includes significant enhancements:
Complete strategy implementation with entry/exit logic
Addition of the "Crossover" system type
Proper implementation and utilization of the MACD signal line
Enhanced risk management features
Improved parameter flexibility with no artificial maximum limits
Additional alert systems for comprehensive trade management
The original indicator's core color logic and visual system have been preserved while expanding functionality for automated trading applications.

Bitcoin Cycle Log-Curve (JDK-Analysis)Important: The standard parameters provided in the script are specifically tuned for the TradingView Bitcoin Index chart on a monthly timeframe on logarithmic scale, and will yield the most accurate visual alignment when applied to that dataset. (more below)
This very simple script visualizes Bitcoin’s long-term price behavior using a logarithmic regression model designed to reflect the cyclical nature of Bitcoin’s historical market trends. Unlike typical technical indicators that react to recent price movements, this tool is built on the assumption that Bitcoin follows an exponential growth path over time, shaped by its fixed supply structure and four-year halving cycles.
The calculation behind the curved bands:
An upper boundary, a lower boundary, and a central midline, are calculated based on logarithmic functions applied to the bar index (which serves as a proxy for time). The upper and lower bounds are defined using exponential formulas of the type y = exp(constant + coefficient * log(bar_index)), allowing the curves to evolve dynamically over time. These bands serve as a macro-level guide for identifying periods of historical overvaluation (upper red curve) and undervaluation (lower green curve), with a central black curve representing the geometric average of the two.
How to customize the parameters:
The lower1_const and upper1_const values vertically shift the respective lower and upper curves—more negative values push the curve downward, while higher values lift it.
The lower1_coef and upper1_coef control the steepness of the curves over time, with higher values resulting in faster growth relative to time.
The shift_factor allows for uniform vertical adjustment of all curves simultaneously.
Additionally, the channel_width setting determines how far the mirrored bands extend from the original curves, creating a visual “channel” that can highlight more conservative or aggressive valuation zones depending on preference.
How to use this indicator:
This indicator is not intended for short-term trading or intraday signals. Rather, it serves as a contextual framework for long-term investors to identify high-risk zones near the upper curve and potential long-term value opportunities near the lower curve. These areas historically align with cycle tops and bottoms, and the model helps to place current price action within that broader cyclical narrative. While the concept draws inspiration from Bitcoin’s halving-driven market cycles and exponential adoption curve, the implementation is original in its use of time-based logarithmic regression to define dynamic trend boundaries.
It is best used as a strategic tool for cycle analysis, macro positioning, and trend anchoring—rather than as a short-term signal provider.